
Medicare’s Hospice Benefit:Revising the Payment System to Better Reflect Visit Intensity May 28, 2015 Steve Sheingold, Susan Bogasky, and Sally Stearns
I. Introduction
The Medicare hospice benefit was established in 1983 to provide palliative care and support services to terminally ill patients and their families. The benefit is intended for beneficiaries with a life expectancy of six months or less if the illness runs its normal course. Over time, utilization of the hospice benefit has grown considerably. Medicare spending for hospice increased from approximately $2.9 billion in 2000 to $15.1 billion in 2014 (MedPAC, 2015).
Hospice has become a choice for many beneficiaries and their families for end of life care. The percent of beneficiaries who die in hospice has more than doubled over the last 15 years, from 22% to 46%. Enrolling in hospice reflects a decision to have the focus of care move away from aggressive curative services to pain management and support services. Several studies have now demonstrated that hospice is serving this role – indeed, that treatment services, especially hospital stays, decline significantly once a beneficiary enrolls in hospice (Kelly, 2013; Taylor, 2007). The reductions in hospital use can represent reductions in stress and suffering that meet patient and family wishes. Moreover, survey data suggest that, in general, the quality of hospice care is rated highly by families (Teno 2012; Holland 2014).
Over time, the mix of beneficiaries electing hospice shifted significantly. The majority of beneficiaries electing the hospice benefit in its early years had terminal cancer diagnoses. In recent years, the proportion of users with non-cancer diagnoses (i.e., failure to thrive, congestive heart failure, Alzheimer’s, dementia, debility etc.) has grown steadily. These non-cancer diagnoses have been associated with increasingly longer periods of hospice care.
The basic payment and coverage structure of the hospice benefit has remained unchanged since its implementation in 1983. In recent years, researchers and policymakers have begun to examine and evaluate the Medicare hospice benefit as currently implemented. As a result of these efforts, concerns have been raised about the financial incentives in the current payment system for hospice services which pays a fixed per diem rate for each day a beneficiary is enrolled. (MedPAC 2009, 2011). The data demonstrate a care pattern in which visit intensity is high during the first and last few days of an episode and relatively low during the middle of the episode. Concern has been expressed that under these conditions incentives may exist forhospices to recruit patients likely to have longer stays. The Medicare Payment Advisory Commission (MedPAC) has recommended for several years that the Medicare hospice payment system be reformed to better match the intensity of services provided over the episode of care (MedPAC 2009-2015).
Section 3132 of the Affordable Care Act of 2010 (ACA) provided the Secretary of HHS discretion to implement hospice payment reform after October 1, 2013. In the hospice notice of proposed rulemaking (NPRM) for FY 2016, CMS has proposed a change in hospice payment to better align the payment with the visit intensity profile (80 FR 25832 published on May 5, 2015).
The purpose of this issue brief is to provide key results on trends in hospice enrollment, utilization, resource use and other contextual analysis to inform the policy discussion of hospice payment reform in general, and the NPRM specifically.
Key Findings:
- Hospice services are used by nearly half of all Medicare beneficiaries who die in a year
- Hospice visit intensity is greatest in the first and last several days of an episode, it is relatively flat in the middle of an episode.
- This pattern holds across short and long stay patients and for patients diagnosed with cancer as well as other conditions. This is commonly known as the “U” shaped curve.
II. Background on the Hospice Benefit
When a Medicare beneficiary elects the hospice benefit, he/she waives coverage of curative treatment for the terminal illness. Eligible hospice patients may be certified and recertified for two initial 90 day periods and unlimited 60 day periods thereafter as long as the patient remains eligible for the Medicare hospice benefit. Beginning in January 2011 per the ACA, an eligible hospice clinician was required to have a face-to-face encounter with a hospice patient no more than 30 days prior to the 180-day recertification and at each subsequent recertification to ensure patients remain eligible for Medicare hospice services. Recertification is used in to determine whether the patient continues to have a life expectancy of 6 months or less, should the illness run its normal course
Once a Medicare beneficiary elects the hospice benefit, Medicare will pay for: 1) covered hospice services provided by a participating hospice and 2) other Medicare covered services unrelated to the terminal illness. There are four levels of hospice care each with a prospective per diem rate. The most common level of care provided is routine home care (RHC) which is provided on a typical day, and accounts for approximately 95% of all hospice days paid. Second, continuous home care (CHC) can be provided during a crisis. Third, inpatient respite care (IRC) enables a respite or break for the family or caregiver for a hospice patient at home. Fourth, general inpatient care (GIC) may be provided for a condition that cannot be treated in another setting. RHC, GIC and IRC levels of care are all paid at a constant per diem rate, regardless of whether services or visits are provided each day or the level of intensity provided by each visit discipline. The CHC per-diem payment level varies by the number of hours provided each day.
The FY 2015 hospice per diem payment rates (CMS, 2014)1 are:
- Routine Home Care (RHC) - $159.34
- Continuous Home Care(CHC) - $929.91 for full rate of 24 hours or $38.75 per hour
- Inpatient Respite Care (IRC) - $164.81
- General Inpatient Care (GIC) - $708.77
By law, Medicare hospices are subject to an annual aggregate cap on payment and a separate inpatient cap. The aggregate cap is compared to total Medicare payments during the same period. Medicare payments in excess of the aggregate cap are considered overpayments that must be returned to CMS.
III. Recent Research Efforts
Beginning with their Report to Congress in 2009, MedPAC has presented comprehensive analyses of participation, enrollment and service provision under the hospice benefit (MedPAC, 2009). One of the key findings from this work concerned the pattern of visits provided to beneficiaries during a hospice episode. Visit intensity is high during the first and last few days of an episode and relatively very low during the middle of the episode. For this reason the profile has sometimes been referred to as the “U” shaped visit intensity curve. Beginning in 2010, hospices were required to provide more detailed information about number of visits, time increments for the visits and the discipline of the person that provided the visit. Later research using the more detailed data confirmed the “U” shaped pattern for visit intensity (MedPAC, 2011 - 2014; Abt 2013, 2014; Stearns et. al, 2014; Bogasky et. al., 2014). Moreover, more detailed analyses demonstrated that the visit profile did not vary substantially based on patient characteristics such as diagnosis or hospice characteristics such as location or size (Stearns et.al, 2014).
In the following sections, we provide the latest trends in hospice enrollment and utilization, as well as new analyses of the visit intensity profiles. Policy implications are then discussed based on these findings.
A. Trends in Provider Participation and Financial Performance
As displayed in Table 1, the number of hospices participating in the Medicare program increased significantly from 2000 to 2013 – from 2335 to 3951 providers. For profit hospices, which now account for more than half of all hospice providers, are responsible for most of the growth during this time period. The number of freestanding hospices also grew as the number of provider-based hospices declined.
Financial margins increased considerably in recent years for most hospices, particularly freestanding hospices as opposed to the provider based entities (Table 2). The financial margins for the freestanding for-profit hospices averaged 16.5% in 2012, more than twice the average margins for freestanding nonprofit facilities.
Table 1: Medicare Hospices, By Tax Status, Type and Urban/Rural, 2000 and 2013
| Hospice Type | 2000 | 2013 | ||
| Number of Hospices | % of All Hospices | Number of Hospices | % of All Hospices | |
| Note: Table 1 provides count and proportion of hospices with any Medicare service use in a FY The Provider of Service and CASPER files are used to determine provider tax status, facility type, and CBSA code. The counts may not sum to 100% because some hospices could not be identified in the files. | ||||
| All Hospices | 2,335 | 100% | 3,951 | 100% |
| Tax Status | ||||
| For Profit | 827 | 35% | 2,327 | 59% |
| Non Profit | 1,087 | 47% | 1,058 | 27% |
| Government | 420 | 18% | 559 | 14% |
| Facility Type | ||||
| Freestanding | 1,313 | 56% | 2,976 | 75% |
| Provider-based | 1,021 | 44% | 968 | 25% |
| Urban vs Rural | ||||
| Urban | 2,021 | 87% | 3,566 | 90% |
| Rural | 313 | 13% | 378 | 10% |
Table 2: Trends in Medicare Hospice Margins, 2006-2012
| Trends in Margins Over Time | Percent of Hospices 2012 | MedicareMargin 2006 | Medicare Margin 2011 | Medicare Margin 2012 |
| Source: MedPAC, March 2015 Report | ||||
| All hospices | 100% | 6.4% | 8.8% | 10.1% |
| Tax Status | ||||
| For Profit (all) | 59% | 12% | 14.8% | 15.4% |
| For Profit (freestanding) | 51% | 12.7% | 15.9% | 16.5% |
| Non Profit (all) | 35% | 1.5% | 2.4% | 3.7% |
| Non Profit (freestanding | 15% | 5.8% | 6.4% | 7.7% |
| Type | ||||
| Freestanding | 71% | 9.7% | 11.8% | 13.3% |
| HHA-based | 13% | 3.8% | 6.1% | 5.5% |
| Hospital- based | 15% | -12.7% | -16% | -16.8% |
B. Trends in Beneficiary Enrollment
The number of hospice episodes in a year has grown over time from over 400,000 in 2000 to 1.3 million in 2013. The start of a hospice episode is defined as the date of election and the end is defined as the date of death or live discharge. More importantly from the perspective of how the benefit is used, the percent of Medicare decedents who die in hospice care has more than doubled from 22% to 46% during those fiscal years (Table 3). The percent of decedents using hospice is slightly higher for beneficiaries enrolled in Medicare Advantage (MA) than for those in the traditional fee for service (FFS) program. When an MA beneficiary elects hospice care, the traditional Medicare program makes the payments to the hospice as well as covering any care unrelated to the terminal illness.
Table 3: Medicare Decedents and Hospice Use, FY 2000 and 2013
| Enrollment Type | Number of Decedents | Used Hospice | Died in Hospice | % of Decedents w/ Hospice | |
| FY 2000 | All | 1,943,532 | 525,884 | 426,888 | 22% |
| FFS | 1,643,644 | 416,870 | 337,363 | 21% | |
| MA | 299,888 | 109,014 | 89,525 | 30% | |
| FY 2013 | All | 2,136,141 | 1,332,797 | 993,128 | 46% |
| FFS | 1,588,635 | 959,964 | 720,506 | 45% | |
| MA | 547,503 | 372,833 | 272,622 | 50% |
Table 4 displays the distribution of hospice episodes by diagnosis in 2000 and 2013. By 2000, 54% of patients had diagnoses other than cancer, and in 2013 that number had grown to 74%. Mean episode length was 123 days in 2013 as compared with 76 days in 2000 (not in the Table). Alzheimer’s/dementia patients exhibit longer average stays; and a higher percent of these stays exceed 180 days relative to patients with other diagnoses.
Table 4: Hospice Episodes by Length and Diagnosis, FYs 2000 and 2013
| Category % of Episodes 2000 | % of Episodes 2013 | Mean Episode Length in days 2013 | % Episodes 1-7 Days | % of Episodes 181+ Days |
| All Diagnosis 100 | 100 | 123 | 25 | 22 |
| Cancer 46 | 26 | 70 | 25 | 11 |
| Non-Cancer 54 | 74 | 141 | 26 | 27 |
| Alzheimer / Dementia 8 | 19 | 202 | 17 | 38 |
| Heart Disease 11 | 15 | 141 | 25 | 27 |
C. Trends in Length of Hospice Episodes
Figure 1 displays the 15 year trends in the distribution of hospice episodes categorized by episode length. The most notable numbers are at the end the distribution. On one hand, approximately 25% of enrollees each year enter hospice less than one week prior to death. This trend is problematic because episodes of less than 7 days are generally considered too short of a time period for beneficiaries to fully benefit from hospice services, thus raising potential quality of care issues for these patients. The constant percent of short episodes may be a result of the decision-making difficulties faced by physicians and families in these circumstances rather than attributable to the payment method. Due to the financial incentives discussed above, the growth in long episodes may be related to the current payment method that overpays days in the middle of the episode. Since the hospice benefit was intended for patients with a prognosis of life expectancy less than six months, examining episodes of more than 180 days is a relevant way to examine this trend. The percent of all episodes that were more than 180 days grew from approximately 12% in 1998 to nearly 23% in 2009 and has remained relatively constant since. The implementation of the requirement for a face-to-face encounter prior to recertification in 2010 may be partly responsible for the flattening of the growth trend in these episodes. It should be noted that some number of long stays are to be expected due to the uncertainties in estimating longevity.
Figure 1:
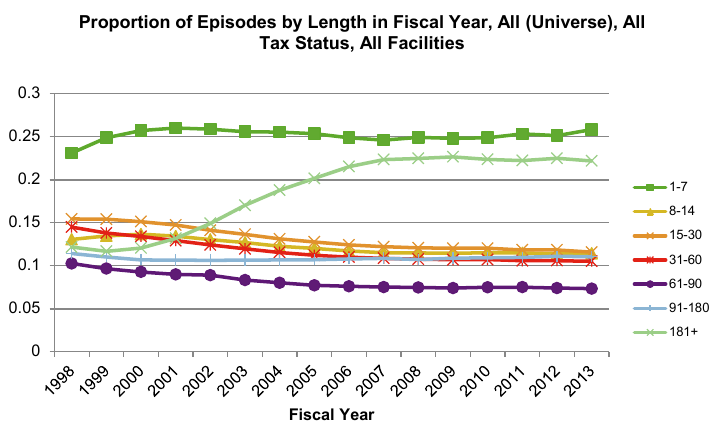
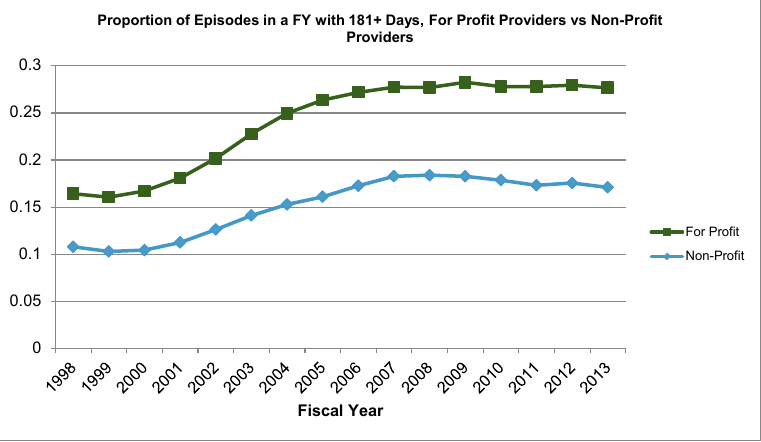
Figure 2 illustrates the increasing trend in hospice episodes of more than 181 days by hospice profit status. For-profit hospices continue to have a higher proportion of episodes of more than 181 days as compared to non-profit hospices.
In addition to the overall trend toward longer stays, these longer episodes are concentrated in a relatively small proportion of hospices. Table 5 displays characteristics of hospices when ranked by the percent of their RHC days attributable to patients whose episodes exceed 180 days. The top ten percent of hospices have more than half of their overall RHC days attributable to episodes of more than 180 days. The average episode for these providers is 220 days, well beyond the six month period associated with hospice eligibility. Moreover, average daily visit intensity (measured by wage-weighted visit units, described in more detail below) decreases with the average episode length while the live discharge rate increases with the average episode length.
Table 5:Statistics by Decile of Facilities Ranked by % RHC Days for Episodes > 180 Days
| Decile | Percent of RHC Days for Stays >180 Days | Mean Length of Episode | Wage Weighted Visit Units (WWVU) | Percent Discharged Alive Among All Episodes | Estimate Hospice Exceeded Cap |
| 1 | 5.2% | 49.5 | 20.4 | 14.3% | 0.3% |
| 2 | 14.8% | 62.3 | 18.1 | 14.2% | 0.3% |
| 3 | 20.6% | 70.8 | 19.0 | 13.5% | 0.6% |
| 4 | 25.3% | 82.0 | 20.4 | 14.7% | 0.8% |
| 5 | 29.9% | 96.4 | 18.2 | 15.7% | 1.4% |
| 6 | 33.8% | 108.0 | 17.2 | 16.5% | 1.7% |
| 7 | 37.4% | 117.9 | 17.4 | 15.6% | 2.0% |
| 8 | 41.1% | 134.3 | 16.0 | 16.5% | 5.1% |
| 9 | 45.7% | 155.7 | 16.3 | 17.0% | 6.5% |
| 10 | 55.4% | 220.3 | 15.8 | 18.1% | 23.6% |
D. Utilization of Hospice Services and Visit Intensity
Most research and policy proposals have focused on hospice’s RHC services. As Table 6 indicates, RHC services are provided to most hospice enrollees while the other services are provided with substantially lower frequency. Overall, 87% of hospice episodes use RHC services, and 68% use only RHC services. Both CHC and IRC services are used with the lowest frequency across all diagnoses.
Table 6: Utilization of Four Hospice Services Types, 2013
| Category | % Stays with Any RHC | % Stays with only RHC | % Stays with Any CHC | % Stays with Any IRC | % Stays with Any GIC |
| All Diagnoses | 87% | 68% | 6% | 5% | 23% |
| Cancer | 88% | 65% | 7% | 4% | 26% |
| Non-Cancer (total) | 86% | 69% | 6% | 5% | 21% |
| Alzheimer / Dementia | 95% | 78% | 7% | 5% | 11% |
| Heart Disease | 88% | 69% | 7% | 6% | 21% |
In this section, we analyze the visit intensity curves that have been the basis for concerns over the current payment system and stimulate consideration of new payment policy proposals. There are two dimensions to measuring RHC visit intensity: the number of visit units (in 15 minute increments) and the discipline of the person providing the visit. We developed a single measure of resource use that combines these dimensions. Specifically, we calculated daily wage-weighted visit units (WWVUs)2 for each patient during their hospice stay. The 2012 Bureau of Labor Statistics (BLS) hourly wage data were used in the calculation of WWVUs. In order to compute a WWVU, one-fourth of the BLS hourly wage rate for each visit discipline (i.e., skilled nursing, medical social services, home health aide, and an average for therapies) was multiplied by the corresponding number of visit units reported on hospice claims. It is important to note that while WWVU represents a single value resource measure, it is not intended to measure the full costs, or even the full labor costs, of providing hospice care. Instead, the WWVUs measure visit intensity, which represents an important component of hospice costs.
We calculated the WWVUs for each individual on each day of their hospice episode. We then aggregated the WWVUs for all individuals on a given day (e.g. day 1, day 2) or a given group of days (e.g. days 31-60). Using these calculations, we plotted the visit intensity curves to compare the WWVUs over episodes of varying lengths. Previous research demonstrated several characteristics of the visit intensity curves:
- Visit intensity is much higher for the first and last few days of an episode than for the middle days – there is an approximate “U” shaped relationship.
- The longer the episode, the greater is the visit intensity at the beginning and the end relative to the middle – that is, the U shape is more pronounced for longer episodes.
- The number of days in hospice care is the primary determinant of the WWVUs – that is, the visit intensity curve does not vary substantially with other patient level factors (e.g., diagnosis, gender) or hospice level factors (e.g., size or location).
The results are summarized below. Figures 3 and 4 update the charts displayed in previous work using 2013 claims data. Figure 3 displays the visit intensity for RHC, CHC and IRC visits by discipline while Figure 4 includes only RHC visits. The pattern of visit intensity by time in episode category has not changed in 2013 relative to previous years. That is, the observed care profile is remarkably constant over time for hospice enrollees. While the visit intensity declines rapidly after the first few days, it becomes flat after sixty days until the last week of the episode.
In addition, there are some differences in the composition of the disciplines providing the visits over the episode. The majority of the overall WWVUs during the beginning and ending of the episodes are accounted for by skilled nurses. During the relatively low intensity middle days, the visit composition is more equally distributed between skilled nursing and home health aides.
Figure 3: Average WWVU per day, all episodes with any service in FY 2013
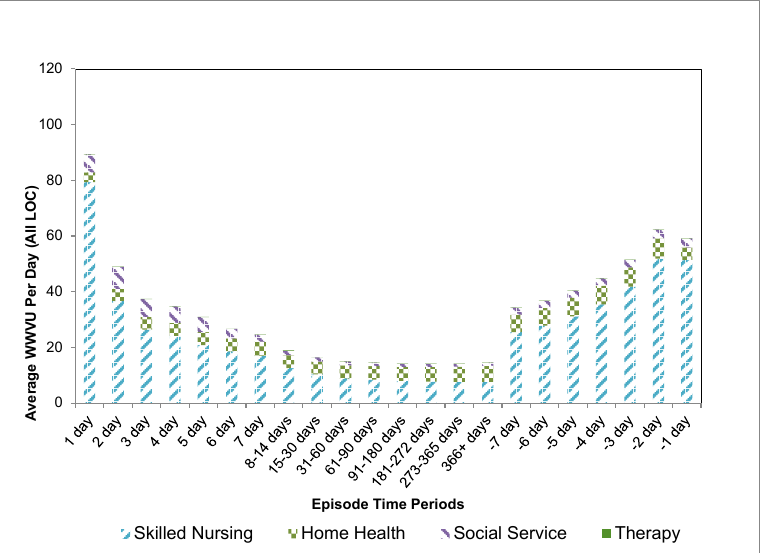
Figure 4: Average RHC WWVU per day, all episodes with any service in FY 2013

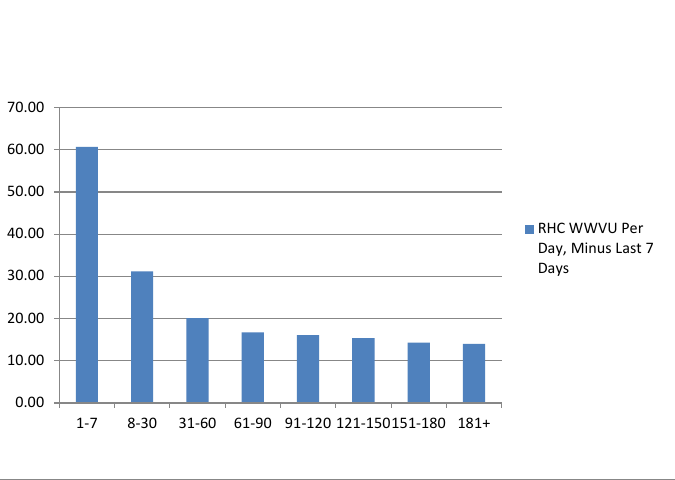
In Figures 3 and 4, each time category includes all enrollees regardless of their overall episode length. Figure 5 provides the information in a slightly different manner. Each bar represents the average daily WWVUs for individuals with completed episodes in the noted time categories. For example, the average daily WWVUs for all persons whose completed stays were between 8 and 30 days are represented by the second bar on the Figure. Here again, WWVUs decline with episode length, but those with episodes of up to sixty days exhibit higher average visit intensity than those with longer stays.
Figure 5: RHC Wage-Weighted Visit Units Per Day, Minus Last 7 Days, All Episodes Ending in CY 2013
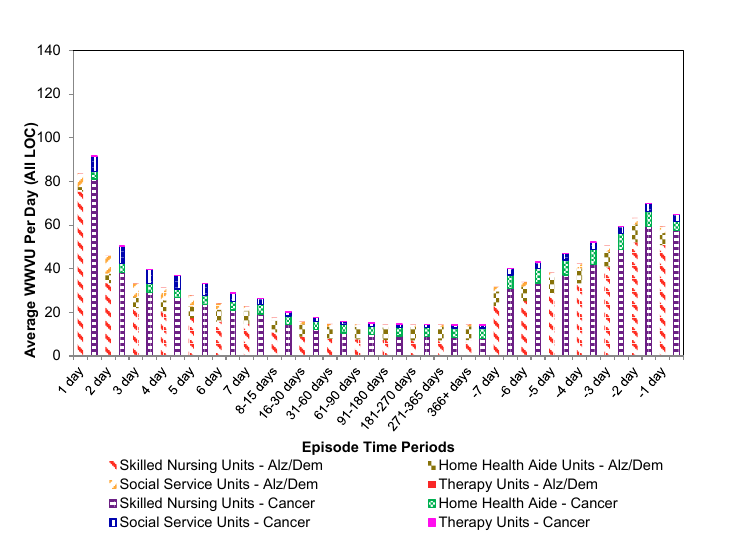
Another important finding has been that in general, the visit intensity profile does not differ among patient diagnoses. Figure 6 compares these curves for enrollees with a diagnosis of cancer to enrollees diagnosed with Alzheimer’s and dementia. The visit profiles are very similar. Cancer patients do exhibit slightly higher visit intensity during the first and last days of their episodes.
Figure 6: Average WWVUs Alzheimer/Dementia as Compared to Cancer Episodes With Any Service in FY 2013
IV. Conclusion
Nearly half of all Medicare beneficiaries who die in a year elect to use the hospice benefit, whichprovides many important services to both beneficiaries and their family members. Hospiceprovides support for beneficiaries who may choose to die at home, surrounded by family andfriends.
While the hospice benefit and payment structure have not changed substantially since the benefit was enacted, the data analyzed in this Issue Brief demonstrate that much has changed in terms of the hospice industry and the patient population using the benefit. The analyses confirm previous research on the visit intensity profiles during hospice episodes. Concerns have been raised that the “U” shaped visit profile in conjunction with the current constant per diem payment structure overpays for the relatively less intensive middle days of the episode. To better reflect costs of providing services, MedPAC has been recommending since 2009 that the payment system be modified so that the per diem rates at the beginning and end of episodes would be higher than those paid during the middle of the episode.
In the FY 2016 proposed hospice rule (Medicare Program; FY 2016 Hospice Wage Index and Payment Rate Update and Hospice Quality Reporting Requirements), CMS is proposing a tiered payment system for RHC in conjunction with a Service Intensity Adjustment (SIA). Theproposed tiered payment system for RHC would replace the current single RHC level per diem rate with two new RHC per diem rates for patients who require RHC level of care during a hospice election.3 The first tier RHC per diem rate of $188.20 would be paid for each RHC level of care for days 1-60 of a hospice election. For day 61 and all subsequent days during a hospice election, HHS is proposing a second tier RHC per diem rate of $147.34. These rates were based on the analyses described above – the relative level of the two rates is based on the average WWVUs for the first sixty days relative to the average for days 61+ and separate adjustments to assure total payments for RHC services are budget neutral to current policy. The SIA adjustment provides additional payment for visits during the last 7 days of life in hospice care for patients who do not reside in a nursing home or SNF.
As noted, the FY 2016 proposal followed several years of research by MedPAC, CMS and ASPE, to analyze relevant data and provide analyses to best inform policy considerations. The results of these research efforts are consistent with each other. The significant amount of time and resources devoted to this research effort recognized the importance of the hospice benefit and the special circumstances of the beneficiaries it serves, as well as of their families.
Acknowledgement
ASPE/Office of Health Policy would like to acknowledge Alex Pao, Acumen LLC and Kyle Price, Acumen LLC for their programming support.
References
Abt Associates (2013). Medicare Hospice Payment Reform: Hospice Study Technical Report. Prepared for the Centers for Medicare and Medicaid Services. Accessed April 2015 Center for Medicare and Medicaid Services Hospice Center/Research and Analyses http://www.cms.gov/Center/Provider-Type/Hospice-Center.html
Abt Associates (2014). Medicare Hospice Payment Reform: Analyses to Support Payment Reform. Prepared for the Centers for Medicare and Medicaid Services. Accessed April 2015 Center for Medicare and Medicaid Services/Research and Analyses http://www.cms.gov/Center/Provider-Type/Hospice-Center.html
Bogasky, S., Sheingold, S., & Stearns, S. C. (2014). Medicare’s Hospice Benefit: Analysis of Utilization and Resource Use. Medicare & Medicaid Research Review, 4(2), E1–E14.
Centers for Medicare and Medicaid Services (2014). Update to Hospice Payment Rates, Hospice Cap, Hospice Wage Index, Quality Reporting Program and the Hospice Pricer for Fiscal Year (FY) 2015 Medicare Learning Network Matters MM8876. Accessed April 2015 http://www.cms.gov/site-search/search-results.html?q=MM8876
Holland, J., Keene, J., Kirkendall, A., & Luna, N (2014). Family Evaluation of Hospice Care: Examining Direct and Indirect Associations with Overall Satisfaction and Caregier Confidence. Palliative and Supportive Care / FirstView. http://dx.doi.org/10.1017/S1478951514000595
Kelley, A., Deb, P., Du, Q., Carlson, M., & Morrison,S. (2013). Hospice Enrollment Saves Money For Medicare And Improves Care Quality Across Number Of Different Lengths-Of-Stay. Health Affairs, 32(3), 552-561.
Medicare Payment Advisory Commission, 2009. Report to Congress: Medicare payment policy. Washington, DC: MedPAC. Chapter 6 March 2009 Report Accessed April 2015 http://www.medpac.gov/-documents-/reports
Medicare Payment Advisory Commission, 2011. Report to Congress: Medicare payment policy. Washington, DC: MedPAC. Chapter 11 March 2011 Report Accessed April 2015 http://www.medpac.gov/documents/reports/Mar11_EntireReport.pdf?sfvrsn=0
Medicare Payment Advisory Commission, 2012. Report to Congress: Medicare payment policy. Washington, DC: MedPAC. Chapter 11 March 2012 Report Accessed April 2015 http://www.medpac.gov/-documents-/reports
Medicare Payment Advisory Commission, 2013. Report to Congress: Medicare payment policy. Washington, DC: MedPAC. Chapter 5 June 2013 Report Accessed April 2015 http://www.medpac.gov/documents/reports/chapter-5-medicare-hospice-polic...(june-2013-report).pdf?sfvrsn=4
Medicare Payment Advisory Commission, 2014. Report to Congress: Medicare payment policy. Washington, DC: MedPAC. Chapter 12 March 2014 Report Accessed April 2015 http://www.medpac.gov/-documents-/reports
Medicare Payment Advisory Commission, 2015. Report to Congress: Medicare payment policy. Washington, DC: MedPAC. Chapter 12 March 2015 Report Accessed April 2015 http://www.medpac.gov/-documents-/reports
Rhodes, R., Mitchell, S. Miller, S., Connor, S., & Teno, J. (2008) Bereaved Family Members’ Evaluation of Hospice Care: What Factors Influence Overall Satisfaction with Services? Journal of Pain and Symptom Management, 35/4,365-371.
Stearns, S.C, Sheingold, S., & Zuckerman, R. (2014). Explaining Variation in Hospice Visit Intensity for Routine Home Care, Medical Care, 52:1(56-62).
Taylor, D. H., Ostermann, J., Van Houtven, C. H., Tulsky, J. A., & Steinhauser, K. (2007). What length of hospice use maximizes reduction in medical expenditures near death in the US Medicare program? Social Science & Medicine, 65(7), 1466-1478.
Teno, J., Casarett, D., Spence, C., & Connor, S. (2012). It Is “Too Late” or Is It? Bereaved Family Member Perceptions of Hospice Referral When Their Family Member Was on Hospice for Seven Days or Less. Journal of Pain and Symptom Management, 43(4), 732-738.
1 The per diem payment rates are divided into a labor and non-labor portion. The labor portion is adjusted by the applicable wage index value. Hospices which fail to report quality data to CMS have their market basket reduced by the applicable percentage points.2 The term wage-weighted visit unites (WWVUs) may be used interchangeably with wage-weighted minute units (WWMUs) referenced in the FY 2016 Medicare Hospice NPRM.3 The two tiers of RHC per diem rates will continue to be updated by the applicable market basket. The proposed two tiers of RHC per diem rates will continue to be divided into a labor and non-labor portion. The labor portion of these two rates will be adjusted by the applicable wage index in accordance with the current rules.