
Although states have begun to rebalance their long-term care systems toward a greater emphasis on home and community-based services (HCBS), many low-income elderly, persons with physical disabilities, and persons with intellectual/developmental disabilities (I/DD) continue to reside in institutions such as nursing homes or intermediate care facilities for the intellectually disabled (ICFs/IID). Through an analysis of Medicaid enrollment and long-term care claims data, this report provides information on the characteristics of institutionalized enrollees, their stays, and the interaction of institutional services and HCBS. [85 PDF pages]
"Acknowledgments
We would like to express our appreciation to several individuals who contributed to this report: Cara Orfield, for research assistance; Carol Irvin, Charlie Lakin, and Bob Schmitz for providing insightful review and comments; Sandi Nelson, for reviewing the programming code; Cindy George, for editing the report; and Margaret Hallisey, for producing the report.
Acronyms
The following acronyms are mentioned in this report and/or appendices. Also see Appendix A for term descriptions.
| ACS | American Community Survey |
|---|---|
| FFS | Fee-For-Service |
| FY | Fiscal Year |
| HCBS | Home and Community-Based Services |
| ID/DD | Intellectual Disability or Related Developmental Disability |
| ICF/IID | Intermediate Care Facility for Individuals with Intellectual Disabilities |
| ICF/MR | Intermediate Care Facility for the Mentally Retarded (now ICF/IID) |
| LT | Long-Term Care (MAX file) |
| LTC | Long-Term Care |
| LTSS | Long-Term Services and Supports |
| MAS | Maintenance Assistance Status |
| MAX | Medicaid Analytic eXtract |
| MR/DD | Mental Retardation and Other Developmental Disabilities |
| MSIS | Medicaid Statistical Information System |
| MSIS ID | MSIS Identification Number |
| PACE | Program of All-Inclusive Care for the Elderly |
| PS | Person Summary (MAX file) |
| SSI | Supplemental Security Income |
Executive Summary
Although states have begun to re-balance their long-term care (LTC) systems toward a greater emphasis on home and community-based services (HCBS), many low-income elderly, persons with physical disabilities, and persons with intellectual disabilities or related developmental disabilities (ID/DD) continue to reside in institutions such as nursing homes or intermediate care facilities for individuals with intellectual disabilities (ICFs/IID). Many of these individuals need complex or continual care that can be effectively provided only in an institution. Others would like to return to the community but have been unable to transition because of the lack of resources, such as affordable housing. Some residents might benefit from living in the community but are not fully aware of their options outside institutional care, and still others might prefer to continue living in the institution even if their needs could be met by HCBS.
Through an analysis of Medicaid enrollment and LTC claims data, this report seeks to provide researchers and policymakers with information on the characteristics of institutionalized enrollees, their stays, and the interaction of institutional services and HCBS, building on the earlier work of Wenzlow et al. (2008) by using more recent data and extending the analysis to residents of ICFs/IID.
To better understand the population of Medicaid enrollees living in nursing homes or ICFs/IID, we analyzed data from the Medicaid Analytic eXtract (MAX) from 2006 and 2007 to address the following two sets of research questions:
-
What are the characteristics of enrollees remaining in nursing homes and ICFs/IID and their stays?
- How many enrollees had new spells of nursing home care or ICF/IID care, what were their demographic characteristics, how did they become eligible for Medicaid, and how long were their stays?
- Did enrollees receiving nursing home or ICF/IID care also use HCBS before or after their institutional stay? Did they use both nursing home and ICF/IID care?
-
How does the length of institutional spells vary at the state-level with changes in state constraints and policies? State-level variables examined included the following:
- The percentage of Medicaid LTC spending allocated to HCBS, and the percentage of Medicaid LTC recipients using HCBS.
- The supply of nursing home beds per 1,000 elderly, the percentage of ICFs/IID that are large (more than 15 beds), and the percentage change in the number of ICFs/IID from 2006 to 2007.
Key findings from the analysis of enrollees living in nursing homes included the following:
-
Enrollees with nursing home stays tended to have either very short or very long spells of care (34 percent and 41 percent, respectively), indicating a mix of residents, some of whom likely need only temporary care while others will likely require access to nursing and medical services for the remainder of their lives.
-
Although most people with new nursing home spells were already enrolled in Medicaid before their spell began (69 percent), a significant number of enrollees with new spells (31 percent) were not enrolled in Medicaid prior to the beginning of their Medicaid-financed spell. Approximately half (49 percent) of these new enrollees qualified for benefits under "other" eligibility criteria -- which include the 300 percent rule. (The 300 percent rule allows individuals with income up to 300 percent of the Supplemental Security Income threshold to qualify for Medicaid assistance for institutional care.)
-
Among those with spells of six months or less, 30 percent used HCBS prior to receiving nursing home services, while more than one in four used HCBS following discharge.
-
Although the percentage of nursing home spells lasting three months or less was generally higher in states with larger investments in HCBS relative to nursing homes and higher HCBS utilization rates, these associations were not especially large.
-
Relative to 2001-2002, there were fewer elderly and people with disabilities enrolled in Medicaid in 2006-2007, and fewer of these individuals had either new or ongoing nursing home spells. The percentage of this population receiving care in nursing homes declined slightly in states that allocated a high proportion of their Medicaid LTC expenditures to HCBS while rising slightly in others.
The following key findings emerged from the analysis of enrollees residing in ICFs/IID:
-
Enrollees residing in ICFs/IID were generally younger adults who remained in residence for a year or longer. The vast majority (89 percent) qualified for Medicaid even before they were admitted to the ICF/IID, and those who qualified in advance generally retained the same maintenance assistance status upon admission.
-
More than 40 percent of enrollees living in ICFs/IID used HCBS before their ICF/IID stay, suggesting that it is not uncommon for an individual to use both community and institutional services rather than solely ICF/IID services.
-
Although few enrollees had both ICF/IID and nursing home stays during the study period, most of those individuals moved from nursing homes to ICFs/IID, rather than the other way around.
-
There was little meaningful relationship between lengths of ICF/IID spells and most state policy variables, although the percentage of stays lasting three months or less was lower in states that closed facilities during the study period.
In recent years, the percentage of elderly and disabled Medicaid enrollees living in nursing homes has declined. Although the reasons for this decline are not clear, states that have successfully begun to re-balance their LTC systems away from institutional care and toward HCBS would expect to experience such declines. The positive relationship between HCBS investment and use and shorter nursing home stays also suggests that continued expansion of HCBS might be a contributing factor in lowering rates of institutionalization, although many other factors not measured here are also undoubtedly involved.
New ICF/IID placements during our study period were relatively uncommon, reflecting the long lengths of stay of the typical ICF/IID resident, the well-established movement from placing developmentally disabled individuals in larger institutions toward greater reliance on community-oriented group homes and HCBS, and the smaller size of this population more generally. Because of the diverse and complex needs of this unique population, ICF/IID residents and those at risk of being placed in an ICF/IID will continue to need programs that are tailored to their individual circumstances. Because large state-run ICFs/IID and smaller community ICFs/IID represent significantly different care settings, additional research that explicitly considers utilization of services provided by these different types of ICF/IID is critical to fully understanding how low-income individuals with ID/DD are being served in different states, and how to serve them better.
Sizable minorities of both nursing home and ICF/IID residents used HCBS prior to their Medicaid-financed stays. To the extent that a given Medicaid enrollee is likely to need both HCBS and institutional care at different times in his or her life, systems of care that have a "no wrong door" policy -- according to which individuals requiring long-term services and supports have all options for services made available to them regardless of how they access the system -- hold the potential to ease transitions to and from the community. The small number of individuals who experienced multiple episodes of institutional care likely represents an important population requiring complex services for whom a key challenge is providing appropriate care tailored to their specific functional and medical needs.
Because this study is fundamentally broad and descriptive, the findings presented here lend themselves to only tentative conclusions but suggest directions for future study. Analyses that use detailed person-level and claim-level data, including the information available through MAX, are especially likely to enhance our understanding of what types of individuals are likely to benefit most from which type of care (institutional or HCBS), and under what circumstances.
I. Background and Objectives
Although states have begun to re-balance their long-term care (LTC) systems toward a greater emphasis on home and community-based services (HCBS), many low-income elderly, persons with physical disabilities, and persons with intellectual disabilities or related developmental disabilities (ID/DD) continue to reside in institutions such as nursing homes or intermediate care facility for individuals with intellectual disabilities (ICFs/IID). Through an analysis of Medicaid enrollee and LTC claims data, this report seeks to provide researchers and policymakers with information on the characteristics of these enrollees, their stays, and the interaction of institutional services and HCBS, building on the earlier work of Wenzlow et al. (2008) by using more recent data and extending the analysis to enrollees residing in ICFs/IID.
A. The Role of Medicaid Institutional Services in Long-Term Care
Many elderly and persons with physical disabilities or ID/DD receive care in institutions. Nursing homes serve the needs of the elderly and people with disabilities who have difficulty performing activities of daily living, such as eating or dressing, and who often have complex medical needs that require continual access to skilled nursing and medical care. ICFs/IID serve individuals with ID/DD who require specialized care and lack the necessary supports to live comfortably in the community. Many nursing home and ICF/IID residents are low-income individuals whose care is financed by state Medicaid programs. Kaye et al. (2010) estimate that Medicaid paid nearly 70 percent of nursing home residents' expenditures in 2004, after excluding three-month periods following a hospitalization. Medicaid ICF/IID expenditures in Fiscal Year (FY) 2009 for approximately 91,000 residents totaled roughly $12.5 billion, or $137,000 per resident (Lakin et al. 2010).
In recent years, states have actively sought to accommodate the desire of many individuals requiring long-term services and supports (LTSS), including those with low-incomes, to live in their communities. They have done this by beginning to "re-balance" their LTC systems by making HCBS more accessible to individuals who would otherwise qualify for institutional care. States have established diversion and transition programsin an effort to make HCBS more readily available to specific individuals who are either at risk of becoming institutionalized or currently living in an institution (O'Connor et al. 2006). Some have begun transitions and re-balancing through participation in the Money Follows the Person program (Irvin et al. 2010; Irvin and Ballou 2010), whereas others have a longer history of promoting HCBS that has continued in recent years (Kaye et al. 2009). This increased emphasis on promoting independent living is part of a larger historical trend that has seen a decline in the utilization of both nursing homes (Wiener et al. 2009) and ICFs/IID (Prouty et al. 2008) with the establishment of Section 1915(c) waivers in the early 1980s and the movement over the past three decades away from larger state-run ICFs/IID toward smaller group homes with a closer connection to the surrounding community. Adding further momentum to this shift was the Supreme Court's Olmstead decision in 1999, which held that persons with disabilities have the right to live and receive services in community settings if they are able and willing to do so.1
Despite the increased emphasis on HCBS, however, many Medicaid enrollees continue to receive services in institutions. Many of these individuals need complex or continual care that can be effectively provided only in an institution. Others would like to return to the community but have been unable to transition because of the lack of resources, such as affordable housing. Some enrollees might benefit from living in the community but are not fully aware of their options outside institutional care, and still others might prefer to continue living in the institution even if their needs could be met by HCBS.
A better understanding of who uses institutional LTC and how they use it is critical to the continued development of effective policy. Although re-balancing LTSS is an important and highly visible component of many states' LTC strategies, advocates believe there is still room for improvement. Further re-balancing, however, requires that states' LTSS programs meet the needs of those who are still institutionalized, recognizing that not all institutionalized participants are necessarily good candidates for community-based services. Furthermore, since states have been re-balancing for different lengths of time, and since the LTC needs of the population vary in their nature and scope from state to state, it is important to understand the characteristics of the institutionalized populations at the state level. More information about issues relating to these individuals, such as how they qualified for Medicaid benefits, might make it easier to identify barriers to care that need to be addressed.
B. Research Questions
To better understand the population of Medicaid enrollees qualifying for benefits on the basis of age or disability and living in nursing homes or ICFs/IID, we analyzed data from the Medicaid Analytic eXtract (MAX) from 2006 and 2007 to address the following two sets of research questions:
-
What are the characteristics of enrollees remaining in nursing homes and ICFs/IID and their stays?
- How many enrollees had new spells of nursing home care or ICF/IID care?
- How did the number of enrollees with new spells of nursing home care change over time?
- What were the demographic characteristics of enrollees who used nursing home or ICF/IID care?
- How did enrollees residing in nursing homes or ICFs/IID become eligible for Medicaid?
- How long did enrollees live in nursing homes or ICFs/IID?
- Did enrollees receiving nursing home or ICF/IID care also use HCBS before or after their institutional stay?
- Did enrollees use both nursing home and ICF/IID care?
-
How does the length of institutional spells vary at the state level with changes in state constraints and policies? State-level variables examined included the following:
- The percentage of Medicaid LTC spending allocated to HCBS.
- The percentage of Medicaid LTC users' total Medicaid expenditures accounted for by HCBS recipients.
- The percentage of Medicaid LTC recipients using HCBS.
- The percentage of potential Medicaid LTC recipients using HCBS.
- The supply of nursing home beds per 1,000 elderly.
- The percentage of ICFs/IID that are large (more than 15 beds).
- The percentage change in the number of ICFs/IID from 2006 to 2007.
- The percentage change in the number of large ICFs/IID from 2006 to 2007.
Given the differences in the characteristics and needs of the two populations, we performed the analyses separately for nursing home and ICF/IID utilization, although as part of our analysis of enrollees living in ICFs/IID, we also examined enrollees who had stays at both types of facility. Because Wenzlow et al. (2008) performed a similar analysis for enrollees receiving nursing home care using earlier data, we also compared some of the findings reported here to those from the earlier report.
C. Summary of Data and Methods
This report draws on MAX data to construct a profile of Medicaid enrollees and their Medicaid-financed institutional stays (also referred to as spells) in 2006 and 2007.2 We included in our sample enrollees who were elderly or entitled on the basis of disability to full-benefits and began spells of Medicaid-financed institutional care in the latter half of 2006 or in 2007. Because some disabled enrollees qualify for benefits on a basis other than disabled, it is important to note that references to disabled enrollees in this report indicate only those enrollees with a basis of eligibility (BOE) code in the MAX data corresponding to the disabled group. The first six months of 2006 were reserved as a look-back period, allowing us to examine aspects of enrollees' experience prior to their Medicaid-financed spell of institutional care.3 The sample included any individual with a Medicaid-financed nursing home stay during this period; consequently, our analysis reflects the experience of both LTC users and those receiving post-acute care.
To construct spells of care, we examined the beginning and end dates of claims for nursing home and ICF/IID services contained in the MAX Long-Term Care (LT) file. Because a spell of LTC can be interrupted by a hospitalization or for other reasons, we defined "new" spells of care conservatively: a claim for institutional services was interpreted as triggering the beginning of a new spell only if the individual to whom the services were provided did not incur a claim for the same type of institutional service (for example, nursing home or ICF/IID) in the two months prior to the beginning of the claim. In doing so, we followed the definition of a spell adopted by Wenzlow et al. (2008) in their earlier work. However, improvements in the MAX data and our methodology limit the extent to which we can make direct comparisons with the earlier results.
An important implication of our definition of spells is that an individual's actual nursing home stay in many cases began prior to the Medicaid-financed portion, as commonly occurs when an individual enters a nursing home as a private payer but then spends down her income and assets to Medicaid eligibility levels. For example, an individual who resided in a nursing home from November 1, 2006, through June 30, 2007, but who had Medicaid claims for nursing home services only from June 1, 2007, through June 30, 2007, would only be considered to have had a one-month (Medicaid-financed) spell of nursing home care in our analysis, even though that individual was actually institutionalized for eight months.
We included in the analysis only those states with fee-for-service (FFS) data that are both complete and believed to be reliable. Six states were excluded from all analyses: Arizona, Indiana, Maine, Minnesota, New Hampshire, and Utah. In addition, analyses of state policy variables, several of which related to HCBS spending and utilization at the state level, excluded seven other states that are believed to have unreliable HCBS data: Massachusetts, Michigan, Montana, Oregon, Pennsylvania, Rhode Island, and Texas.
A more detailed discussion of the MAX data and methods used to construct the analytic file and perform the analysis, along with their limitations, is in Appendix B.
In the following chapters, we separately discuss the characteristics of nursing home (Chapter II) and ICF/IID (Chapter III) residents and their Medicaid-financed spells of care. We also examine in each chapter how the percentages of stays that are very short (less than three months) or very long (more than one year) vary across states with changes in policy-related variables such as the percentage of enrollees of Medicaid-financed LTC who used HCBS. In Chapter IV, we discuss policy implications and directions for future research.
II. the Characteristics of Enrollees Using Nursing Home Services and Their Spells of CARE
To better understand the Medicaid enrollees who continue to reside in nursing homes even as HCBS has expanded in recent years, we examined the characteristics of enrollees residing in nursing homes and their spells of Medicaid-financed care, focusing on those enrollees who began new spells during the 18-month period from June 2006 through December 2007. To explore how the length of these institutional stays might be related to LTC policy, we also measured the association between the percentage of an individual state's institutional spells that lasted less than three months and a variety of state-level variables that reflect LTC policy.
A. Characteristics of Enrollees Using Nursing Home Services
1. How Many Enrollees Had New Spells of Nursing Home Care?
Of the nearly 12 million Medicaid enrollees living in selected study states who were elderly or eligible on the basis of disability, 694,111 enrollees, or about 6 percent, had at least one new nursing home spell (Table II.1).4 In some states, enrollees with new spells constituted a somewhat higher percentage, accounting for more than one in ten of all enrollees in Connecticut, Nebraska, North Dakota, and South Dakota who were either elderly or disabled.
Although enrollees with new spells represented only a small percentage of elderly or disabled Medicaid enrollees, they accounted for nearly half of the 1,556,712 enrollees who had a Medicaid-financed nursing home stay, demonstrating substantial turnover. Nearly half of all nursing home spells from the second half of 2006 through 2007 were new. The relatively high turnover in nursing home beds for Medicaid enrollees could have resulted from shorter stays due to hospitalization, death, or admissions for post-acute care. The percentage of new spells varied little across states, although new spells were especially common in Alaska (61 percent) and Oregon (57 percent), where stays tended to be shorter.5
| TABLE II.1. Medicaid FFS Nursing Home Use Among Aged or Disabled Enrollees Eligible for Full Medicaid Benefits Any Time Between July 2006 and December 2007 | |||||
|---|---|---|---|---|---|
| Total Number of Aged & Disabled Enrollees | Number of Enrollees with Nursing Home Spells | Number of Enrollees with New Nursing Home Spells | Percentage of Enrollees with New Nursing Home Spells | Percentage of Nursing Home Enrollees with New Nursing Home Spells | |
| All States | 11,922,095 | 1,556,712 | 694,111 | 5.8 | 44.6 |
| Alabama | 215,562 | 27,876 | 10,706 | 5.0 | 38.4 |
| Alaska | 22,542 | 1,345 | 815 | 3.6 | 60.6 |
| Arkansas | 147,070 | 19,767 | 7,731 | 5.3 | 39.1 |
| California | 1,848,937 | 135,073 | 70,588 | 3.8 | 52.3 |
| Colorado | 115,524 | 16,764 | 7,407 | 6.4 | 44.2 |
| Connecticut | 113,746 | 33,206 | 14,254 | 12.5 | 42.9 |
| Delaware | 24,219 | 4,048 | 1,653 | 6.8 | 40.8 |
| District of Columbia | 43,901 | 3,854 | 1,461 | 3.3 | 37.9 |
| Florida | 661,152 | 81,875 | 36,996 | 5.6 | 45.2 |
| Georgiaa | 315,975 | 41,558 | 16,594 | 5.3 | 39.9 |
| Hawaii | 44,956 | 5,128 | 2,268 | 5.0 | 44.2 |
| Idaho | 44,065 | 5,269 | 2,576 | 5.8 | 48.9 |
| Illinois | 467,613 | 83,217 | 38,558 | 8.2 | 46.3 |
| Iowa | 101,732 | 20,989 | 8,416 | 8.3 | 40.1 |
| Kansas | 85,305 | 16,532 | 7,370 | 8.6 | 44.6 |
| Kentucky | 249,333 | 30,556 | 15,676 | 6.3 | 51.3 |
| Louisiana | 239,281 | 32,124 | 14,396 | 6.0 | 44.8 |
| Maryland | 168,074 | 26,063 | 10,880 | 6.5 | 41.7 |
| Massachusetts | 379,285 | 58,382 | 28,055 | 7.4 | 48.1 |
| Michigan | 413,303 | 49,741 | 22,790 | 5.5 | 45.8 |
| Mississippi | 185,700 | 24,115 | 10,682 | 5.8 | 44.3 |
| Missouri | 266,561 | 43,706 | 19,985 | 7.5 | 45.7 |
| Montana | 26,767 | 5,635 | 2,404 | 9.0 | 42.7 |
| Nebraska | 55,381 | 12,722 | 5,888 | 10.6 | 46.3 |
| Nevada | 45,739 | 5,220 | 2,606 | 5.7 | 49.9 |
| New Jersey | 288,719 | 47,434 | 20,008 | 6.9 | 42.2 |
| New Mexico | 77,024 | 6,879 | 2,936 | 3.8 | 42.7 |
| New York | 1,097,394 | 158,009 | 60,324 | 5.5 | 38.2 |
| North Carolina | 426,342 | 47,534 | 22,570 | 5.3 | 47.5 |
| North Dakota | 17,766 | 5,672 | 2,201 | 12.4 | 38.8 |
| Ohio | 471,689 | 94,063 | 44,485 | 9.4 | 47.3 |
| Oklahoma | 152,507 | 24,417 | 10,655 | 7.0 | 43.6 |
| Oregon | 107,585 | 11,863 | 6,725 | 6.3 | 56.7 |
| Pennsylvania | 685,973 | 89,919 | 37,591 | 5.5 | 41.8 |
| Rhode Islanda | 59,865 | 11,436 | 4,360 | 7.3 | 38.1 |
| South Carolina | 216,208 | 18,471 | 8,101 | 3.7 | 43.9 |
| South Dakota | 23,255 | 6,413 | 2,647 | 11.4 | 41.3 |
| Tennesseea | 391,227 | 36,642 | 16,543 | 4.2 | 45.1 |
| Texas | 803,650 | 106,010 | 45,736 | 5.7 | 43.1 |
| Vermont | 29,604 | 3,987 | 1,840 | 6.2 | 46.1 |
| Virginia | 216,853 | 29,441 | 13,260 | 6.1 | 45.0 |
| Washington | 232,549 | 22,494 | 11,483 | 4.9 | 51.0 |
| West Virginia | 122,980 | 12,258 | 5,259 | 4.3 | 42.9 |
| Wisconsin | 207,083 | 36,421 | 15,557 | 7.5 | 42.7 |
| Wyoming | 12,099 | 2,585 | 1,075 | 8.9 | 41.6 |
| SOURCE: Mathematica analysis of 2006-2007 MAX data for 44 states and the District of Columbia with representative FFS nursing home and ICF/IID data (excludes data from Arizona, Indiana, Maine, Minnesota, New Hampshire, and Utah). NOTES: New spells are spells beginning on or after July 1, 2006.
| |||||
Three states -- California, New York, and Texas -- accounted for more than 25 percent of all enrollees with new spells (175,000), while seven states (including Florida, Illinois, Ohio, and Pennsylvania) accounted for nearly half of all enrollees with new spells. Consequently, the characteristics of both residents and spells discussed in this chapter were heavily influenced by these states.
2. How Did Nursing Home Utilization Change Over Time?
By allowing more individuals who might have otherwise required institutionalization to remain in the community, the expansion of HCBS programs might have contributed to changes in: (1) the number of elderly and persons with disabilities enrolled in Medicaid; and (2) the number and characteristics of enrollees living in nursing homes. Expansions of HCBS might encourage individuals who previously lacked access to community-based options to enroll in Medicaid, while also providing some institutionalized enrollees with the opportunity to transition back to their communities. As a result, both the number of enrollees who might become LTC users and the population and characteristics of enrollees living in nursing homes could change over time.
From 2001-2002 to 2006-2007, the number of Medicaid enrollees who were either elderly or disabled declined overall (by 3 percent) and in 32 of the 41 states for which reliable MAX data were available for both time periods (Table II.2).6 These results suggest that if increased access to HCBS led to greater Medicaid enrollment, other factors (such as rising incomes or changes in state Medicaid eligibility qualifications) had a much larger effect, resulting in the decline in enrollment. For example, the sharp decline in the number of elderly and persons with disabilities enrolled in Mississippi most likely reflected a policy change in 2005 that required face-to-face interviews in order to receive or renew benefits: from 2004 to 2006, the number of children and adults enrolled in Medicaid and the Children's Health Insurance Program fell by 62,000 (Lueck 2009).
There were slight declines in the use of nursing home care -- with the number of elderly or disabled enrollees who used Medicaid-financed nursing home services falling 4 percent and the percentage with new spells declining nearly 6 percent -- suggesting that in recent yearsnursing home beds have turned over more slowly. However, these modest overall changes masked substantial variation across states. A small number of states showed sharp increases in the number of enrollees with nursing home spells, including Alaska (a 35 percent increase), North Carolina (22 percent), and Rhode Island (18 percent). Similarly, the fraction of spells that were new declined in 27 of 42 states while showing substantial increases in Alaska (26 percent), Illinois (20 percent), and Kentucky (11 percent). This wide variation likely reflects a combination of influences, such as differences in the rates of expansion of HCBS programs, variation in the number of transitions from nursing homes to the community, different rates of change in the health of the Medicaid population, and differences in the extent to which nursing homes are used for post-acute care as opposed to LTC.
| TABLE II.2. Percentage Changes in Medicaid FFS Nursing Home Use from 2001-2002 to 2006-2007 | ||||
|---|---|---|---|---|
| Total Number of Aged & Disabled Enrollees | Number of Enrollees with Nursing Home Spells | Number of Enrollees with New Nursing Home Spells | Percentage of Nursing Home Spells That Are New | |
| All States | -2.9 | -3.5 | -5.9 | -2.4 |
| Alabama | -10.7 | -5.0 | -11.7 | -7.0 |
| Alaska | +6.7 | +34.6 | +69.1 | +25.6 |
| Arkansas | -12.6 | -10.1 | -9.5 | +0.7 |
| California | +3.7 | +1.8 | -1.4 | -3.1 |
| Colorado | -0.1 | -5.8 | -14.1 | -8.8 |
| Connecticut | -9.6 | -2.2 | -1.4 | +0.8 |
| Delaware | -4.2 | +3.7 | -6.2 | -9.6 |
| Florida | -15.3 | -12.4 | -24.5 | -13.8 |
| Georgia | -14.1 | -9.6 | -19.2 | -10.6 |
| Idaho | +3.9 | -10.5 | -19.9 | -10.4 |
| Illinois | +2.3 | -8.0 | +10.2 | +19.7 |
| Iowa | -3.7 | -8.6 | -11.1 | -2.8 |
| Kansas | -3.0 | -10.5 | -9.3 | +1.3 |
| Kentucky | -11.9 | +1.5 | +12.8 | +11.2 |
| Louisiana | -9.7 | -10.5 | -6.3 | +4.8 |
| Maryland | -10.0 | -0.3 | -7.2 | -7.0 |
| Massachusetts | -1.3 | -6.1 | -5.6 | +0.5 |
| Mississippi | -27.4 | +9.9 | +16.9 | +6.3 |
| Missouri | -4.1 | -1.3 | -2.5 | -1.2 |
| Montana | -16.4 | -6.8 | -11.6 | -5.1 |
| Nebraska | -5.9 | -4.5 | +0.6 | +5.3 |
| Nevada | -4.7 | -4.1 | -11.9 | -8.2 |
| New Jersey | -5.9 | -4.0 | -10.3 | -6.5 |
| New Mexico | +1.7 | -11.2 | -18.4 | -8.1 |
| New York | -7.4 | -4.8 | -13.2 | -8.8 |
| North Carolina | +4.5 | +22.0 | +15.8 | -5.1 |
| North Dakota | -20.2 | -7.2 | -15.5 | -9.0 |
| Ohio | -2.2 | -0.3 | +7.1 | +7.5 |
| Oklahoma | +0.1 | -10.8 | -17.3 | -7.3 |
| Oregon | -5.9 | -8.6 | -5.9 | +3.0 |
| Pennsylvania | +9.3 | +1.6 | -5.1 | -6.6 |
| Rhode Island | +6.9 | +18.3 | +19.2 | +0.8 |
| South Carolina | -5.2 | -8.6 | -6.6 | +2.1 |
| South Dakota | -10.0 | -3.3 | -1.9 | +1.5 |
| Texas | +13.4 | +0.4 | -4.6 | -4.9 |
| Vermont | -3.3 | -4.3 | -10.3 | -6.3 |
| Virginia | -3.7 | -4.2 | -9.9 | -6.0 |
| Washington | -1.1 | -12.1 | -13.2 | -1.2 |
| West Virginia | -4.7 | -2.5 | -10.6 | -8.3 |
| Wisconsin | -5.7 | -12.9 | -13.7 | -0.8 |
| Wyoming | -8.2 | -7.4 | -16.4 | -9.7 |
| SOURCE: Mathematica analysis of 2001-2002 and 2006-2007 MAX data for 41 states with representative FFS nursing home data in 2001-2002 and representative FFS nursing home and ICF/IID data in 2006-2007 (excludes data from Arizona, District of Columbia, Hawaii, Indiana, Maine, Michigan, Minnesota, New Hampshire, Tennessee, and Utah). NOTE: New spells are spells beginning between July 1, 2001, and December 31, 2002 (for 2001-2002 data) and between July 1, 2006, and December 31, 2007 (for 2006-2007 data). Total number of enrollees and enrollees with nursing home spells were also measured during these 18-month periods only and not during the full 2-year period. | ||||
States that allocated a relatively high proportion of their Medicaid LTC expenditures to HCBS experienced declines in the percentage of elderly or disabled enrollees who resided in nursing homes or had new spells of care, whereas those that allocated less to HCBS generally saw increases. Kaye et al. (2009) defined high-HCBS states as states that allocated more than the median proportion of Medicaid LTC spending to HCBS in 2005 and low-HCBS states as states that allocated less than the median.7 The percentage of aged or disabled enrollees with nursing home spells declined 3 percent in high-HCBS states from 2001-2002 to 2006-2007, compared with a 4 percent increase in low-HCBS states (data not shown). Although spending on HCBS is only one factor potentially driving changes in nursing home utilization, it is possible that declining rates of nursing home utilization in the group of high-HCBS states were partly the result of a greater orientation toward provision of community-based services.
3. Who Used Nursing Home Care?
As expected, enrollees with new spells of nursing home care were likely to be older, White women. Approximately 28 percent were at least 85 years old, with an additional 31 percent between ages 75 and 84 (Table II.3). The vast majority of all other enrollees with new nursing home spells were between ages 45 and 64. Three-quarters were White, and slightly less than two-thirds were female.
| TABLE II.3. Characteristics of Aged or Disabled Enrollees with New Medicaid-Financed Nursing Home Spells Between July 2006 and December 2007 | |
|---|---|
| Characteristic | Number or Percentage |
| Number of enrollees with new spells in all states | 694,111 |
| Percentage female | 64.9 |
| Percentage non-Hispanic White | 75.0 |
| Age (percentage of subgroup) | |
| Under age 21 | 0.3 |
| 21-44 years | 4.5 |
| 45-64 years | 19.4 |
| 65-74 years | 17.0 |
| 75-84 years | 31.1 |
| 85 years and older | 27.7 |
| Percentage with multiple new spells | 6.1 |
| Percentage with spells in both nursing homes and ICFs/IID | 0.1 |
| SOURCE: Mathematica analysis of 2006-2007 MAX data for 44 states and the District of Columbia with representative FFS nursing home and ICF/IID data (excludes data from Arizona, Indiana, Maine, Minnesota, New Hampshire, and Utah). NOTE: New spells are spells beginning on or after July 1, 2006. | |
Relatively few enrollees with new nursing home stays (6 percent) had multiple spells of care during the 18-month study period window. Thus, there is little evidence in these data of a pattern of multiple admissions or "frequent flyer" care that could suggest quality problems.
4. How Did Enrollees Residing in Nursing Homes Become Eligible for Medicaid?
Because nursing home care is expensive, many nursing home residents who did not qualify for Medicaid prior to admission qualify at some point during their stay as they spend down their assets to pay for care. Other residents, however, received Medicaid services prior to the beginning of their spell, perhaps qualifying under a different maintenance assistance status (MAS). To understand how nursing home residents qualified for care, we examined their MAS both two months prior to and at the beginning of their Medicaid-financed nursing home stays. Individuals may qualify for full Medicaid benefits according to cash assistance-related, medically needy, poverty-related, Section 1115 demonstration waiver-related, or other eligibility criteria. Those qualifying under cash assistance-related criteria generally have incomes below the Supplemental Security Income (SSI) standard. The "other" category includes individuals who qualify under the 300 percent rule, which permits persons with a level of need requiring institutionalization to qualify for Medicaid services if their income is less than 300 percent of the SSI standard. Many states have medically needy programs, in addition to or instead of the 300 percent rule, which allow individuals with higher incomes to "spend down" to Medicaid eligibility levels by offsetting their incomes against the costs of institutional care.8
We found that, in most states, more enrollees qualified for Medicaid services during the first month of their Medicaid-financed spell via the "other" MAS than any other eligibility category. In 34 of 45 states, "other" was the most common eligibility category, with at least 70 percent of all enrollees receiving benefits under this status in 23 states, and at least 50 percent receiving benefits under this status in 30 states (Table II.4). For all states together, roughly half of all enrollees qualified for benefits through the "other" category, compared with 22 percent who qualified via the cash assistance criterion and 21 percent who qualified through a medically needy program. Of the 34 states in which "other" was the most common way of qualifying for benefits, 30 had adopted the 300 percent rule, making it likely that many of the "other" enrollees actually qualified via this rule.9
After "other" criteria, most enrollees qualified via the medically needy or cash assistance pathways. Medically needy classifications were the most common pathway to benefits in nine states, with at least two-thirds of all enrollees who qualified for benefits qualifying under a medically needy program in seven of these states. Cash assistance recipients were the most common qualifying group in two of the states but the second most common group in 37 other states. Although poverty-related expansions were not the most common pathway to eligibility in any state, qualifying via poverty-related criteria was more common in states that had adopted poverty-related expansions to Medicaid eligibility but not the 300 percent rule, such as Hawaii, Massachusetts, and North Carolina.
| TABLE II.4. MAS in First Month of First New Medicaid-Financed Nursing Home Spell Among Aged or Disabled Enrollees Eligible for Full Medicaid Benefits Any Time Between July 2006 and December 2007 | ||||||
|---|---|---|---|---|---|---|
| States (by largest MAS group) | Total Number of Enrollees with new Nursing Home Spells | Percentage in MAS Group at Start of Spell | ||||
| "Other" | Cash Assistance-Related | Medically Needy | Poverty-Related | Section 115 Demonstration Waiver | ||
| "Other" | ||||||
| Iowabc | 8,416 | 94.1 | 5.5 | 0.1 | 0.1 | 0.0 |
| Wyomingc | 1,075 | 89.2 | 9.3 | 0.0 | 1.4 | 0.0 |
| Ohiod | 44,485 | 86.7 | 9.0 | 0.0 | 4.3 | 0.0 |
| Kansasbc | 7,370 | 86.6 | 11.5 | 0.8 | 1.1 | 0.0 |
| Tennesseeabc | 16,543 | 86.2 | 11.6 | 0.4 | 1.7 | 0.0 |
| Missourid | 19,985 | 85.0 | 14.7 | 0.0 | 0.3 | 0.0 |
| Louisianabc | 14,396 | 84.0 | 10.6 | 5.2 | 0.2 | 0.0 |
| South Dakotac | 2,647 | 82.2 | 15.2 | 0.0 | 2.6 | 0.0 |
| Georgiaabc | 16,594 | 81.6 | 17.9 | 0.1 | 0.3 | 0.0 |
| South Carolinac | 8,101 | 81.4 | 9.0 | 0.0 | 9.6 | 0.0 |
| Oregonc | 6,725 | 80.3 | 18.5 | 0.0 | 1.0 | 0.0 |
| Delawarec | 1,653 | 79.0 | 18.7 | 0.0 | 2.2 | 0.1 |
| Oklahomacd | 10,655 | 78.1 | 9.5 | 0.0 | 12.2 | 0.0 |
| Washingtonbc | 11,483 | 77.3 | 11.3 | 10.2 | 0.6 | 0.0 |
| Connecticutbd | 14,254 | 76.5 | 6.7 | 15.8 | 0.9 | 0.0 |
| Idahoc | 2,576 | 76.1 | 23.6 | 0.0 | 0.3 | 0.0 |
| Pennsylvaniabc | 37,591 | 74.5 | 11.7 | 10.6 | 3.2 | 0.0 |
| Virginiabcd | 13,260 | 73.2 | 17.4 | 6.9 | 2.5 | 0.0 |
| Texasc | 45,736 | 72.9 | 26.1 | 0.0 | 0.9 | 0.0 |
| New Mexicoc | 2,936 | 72.3 | 25.8 | 0.0 | 1.9 | 0.0 |
| Arkansasbc | 7,731 | 71.8 | 23.6 | 0.4 | 3.9 | 0.0 |
| West Virginiabc | 5,259 | 70.8 | 17.5 | 10.6 | 1.1 | 0.0 |
| Wisconsinbc | 15,557 | 70.1 | 15.2 | 12.5 | 1.9 | 0.4 |
| Nevadac | 2,606 | 69.1 | 27.7 | 0.0 | 3.1 | 0.0 |
| Floridabc | 36,996 | 65.4 | 25.8 | 0.3 | 6.6 | 1.7 |
| New Jerseybc | 20,008 | 65.2 | 15.7 | 13.2 | 5.9 | 0.0 |
| Vermontbc | 1,840 | 64.7 | 17.1 | 17.1 | 0.0 | 1.0 |
| Alabamac | 10,706 | 63.1 | 28.4 | 0.0 | 8.5 | 0.0 |
| Mississippic | 10,682 | 62.0 | 35.4 | 0.0 | 2.5 | 0.2 |
| Coloradoc | 7,407 | 55.1 | 44.5 | 0.0 | 0.3 | 0.0 |
| All States | 694,111 | 49.7 | 22.1 | 21.1 | 6.9 | 0.2 |
| Kentuckybc | 15,676 | 48.9 | 39.3 | 10.6 | 1.1 | 0.0 |
| Michiganbc | 22,790 | 47.8 | 14.8 | 12.1 | 25.2 | 0.0 |
| Rhode Islandabc | 4,360 | 45.5 | 22.3 | 32.0 | 0.2 | 0.0 |
| Massachusettsb | 28,055 | 30.0 | 27.3 | 14.5 | 26.2 | 2.0 |
| Medically Needy | ||||||
| North Dakotabd | 2,201 | 0.2 | 12.4 | 86.6 | 0.8 | 0.0 |
| Marylandbc | 10,880 | 0.3 | 14.4 | 84.9 | 0.4 | 0.0 |
| Montanab | 2,404 | 9.3 | 18.1 | 72.5 | 0.0 | 0.0 |
| New Yorkb | 60,324 | 0.6 | 28.9 | 68.8 | 1.3 | 0.2 |
| District of Columbiab | 1,461 | 4.6 | 23.1 | 68.4 | 3.8 | 0.0 |
| Nebraskab | 5,888 | 0.1 | 17.5 | 67.1 | 15.3 | 0.0 |
| Illinoisbd | 38,558 | 14.4 | 11.7 | 65.7 | 8.2 | 0.0 |
| North Carolinab | 22,570 | 0.0 | 20.9 | 44.3 | 34.8 | 0.0 |
| Hawaiibd | 2,268 | 0.2 | 29.0 | 36.6 | 33.4 | 0.7 |
| Cash Assistance | ||||||
| Alaskac | 815 | 28.1 | 71.5 | 0.0 | 0.2 | 0.0 |
| Californiab | 70,588 | 3.0 | 47.8 | 37.3 | 11.9 | 0.0 |
| SOURCE: Mathematica analysis of 2006-2007 MAX data for 44 states and the District of Columbia with representative FFS nursing home and ICF/IID data (excludes data from Arizona, Indiana, Maine, Minnesota, New Hampshire, and Utah). NOTES: New spells are spells beginning on or after July 1, 2006. Methods used to determine which states utilized the 300% rule or had a medically needy program in 2007 are described in Appendix B.
| ||||||
Prior to the beginning of the first spell of nursing home care, roughly three of every ten individuals who would ultimately receive Medicaid-financed nursing home care were not enrolled (Table II.5), with unenrolled individuals accounting for the plurality of persons with new spells in 22 of 45 states. This suggests that many individuals with new spells qualified for Medicaid for the first time because they required costly nursing home care. Because we considered only Medicaid-financed new spells in this analysis, it is highly likely that some individuals who were unenrolled two months prior to the beginning of their spell were actually residing in a nursing home at the time but did not yet qualify for Medicaid.
| TABLE II.5. MAS in the Two Months Preceding the First New Medicaid-Financed Nursing Home Spells of Aged or Disabled Enrollees Between July 2006 and December 2007 | |||||||
|---|---|---|---|---|---|---|---|
| States (by largest MAS group) | Total Number of Enrollees with new Nursing Home Spells | Percentage in MAS Group at Start of Spell | |||||
| Not Enrolled | "Other" | Cash Assistance-Related | Medically Needy | Poverty-Related | Section 1115 Demonstration Waiver | ||
| Not Enrolled | |||||||
| Montanab | 2,404 | 53.0 | 7.7 | 15.8 | 18.1 | 0.0 | 0.0 |
| North Dakotabd | 2,201 | 49.1 | 0.2 | 13.9 | 25.5 | 6.0 | 0.0 |
| Wyomingc | 1,075 | 45.9 | 33.0 | 9.6 | 0.0 | 5.6 | 0.0 |
| Pennsylvaniabc | 37,591 | 45.5 | 23.9 | 14.5 | 3.0 | 8.3 | 0.0 |
| Delawarec | 1,653 | 45.0 | 19.1 | 17.0 | 0.0 | 14.9 | 0.5 |
| South Dakotac | 2,647 | 44.7 | 20.7 | 19.9 | 0.0 | 10.2 | 0.0 |
| Marylandbc | 10,880 | 43.3 | 1.9 | 17.3 | 27.7 | 5.3 | 0.3 |
| Kansasbc | 7,370 | 40.8 | 37.4 | 11.4 | 2.7 | 3.5 | 0.0 |
| Iowabc | 8,416 | 40.8 | 37.6 | 10.8 | 3.0 | 3.3 | 0.1 |
| Michiganbc | 22,790 | 39.9 | 16.0 | 15.6 | 5.9 | 18.3 | 0.1 |
| Rhode Islandabc | 4,360 | 39.7 | 22.8 | 22.7 | 7.5 | 3.4 | 0.0 |
| New Jerseybc | 20,008 | 39.2 | 29.4 | 16.7 | 3.3 | 6.9 | 0.0 |
| West Virginiabc | 5,259 | 39.1 | 30.5 | 16.7 | 3.9 | 5.4 | 0.0 |
| Oklahomacd | 10,655 | 36.8 | 30.3 | 13.6 | 0.0 | 15.1 | 0.0 |
| Floridabc | 36,996 | 36.4 | 21.5 | 24.6 | 0.7 | 11.4 | 0.9 |
| Nebraskab | 5,888 | 36.3 | 0.1 | 17.0 | 20.7 | 22.4 | 0.0 |
| Coloradoc | 7,407 | 35.0 | 24.7 | 34.9 | 0.0 | 2.0 | 0.0 |
| New Mexicoc | 2,936 | 34.1 | 29.7 | 27.5 | 0.0 | 4.5 | 0.0 |
| Arkansasbc | 7,731 | 33.9 | 29.8 | 24.1 | 0.4 | 7.3 | 0.0 |
| Wisconsinbc | 15,557 | 33.9 | 22.3 | 15.0 | 4.4 | 3.5 | 17.6 |
| Massachusettsb | 28,055 | 32.4 | 8.2 | 26.9 | 7.7 | 19.3 | 2.4 |
| All States | 694,111 | 31.4 | 22.2 | 23.7 | 9.4 | 9.4 | 0.6 |
| Hawaiibd | 2,268 | 30.8 | 0.1 | 27.8 | 11.9 | 25.7 | 0.8 |
| "Other" | |||||||
| Ohiod | 44,485 | 35.8 | 47.0 | 8.4 | 0.0 | 5.3 | 0.0 |
| Tennesseeabc | 16,543 | 28.7 | 46.1 | 16.8 | 0.8 | 4.7 | 0.0 |
| Missourid | 19,985 | 32.5 | 45.3 | 17.8 | 0.0 | 1.0 | 0.0 |
| Washingtonbc | 11,483 | 29.7 | 43.1 | 16.0 | 5.1 | 2.8 | 0.0 |
| South Carolinac | 8,101 | 25.8 | 42.4 | 16.3 | 0.0 | 12.7 | 0.0 |
| Idahoc | 2,576 | 32.2 | 42.2 | 18.7 | 0.0 | 3.3 | 0.0 |
| Oregonc | 6,725 | 30.7 | 40.5 | 18.9 | 0.0 | 6.3 | 0.2 |
| Connecticutbd | 14,254 | 31.4 | 40.4 | 9.7 | 9.9 | 5.1 | 0.0 |
| Georgiaabc | 16,594 | 30.3 | 40.4 | 19.2 | 0.2 | 7.2 | 0.0 |
| Virginiabcd | 13,260 | 28.9 | 38.4 | 20.1 | 3.7 | 6.3 | 0.0 |
| Nevadac | 2,606 | 29.5 | 37.0 | 24.4 | 0.0 | 5.7 | 0.0 |
| Louisianabc | 14,396 | 32.9 | 36.7 | 16.1 | 1.5 | 9.8 | 0.0 |
| Texasc | 45,736 | 28.6 | 30.8 | 26.9 | 0.0 | 10.6 | 0.0 |
| Vermontbc | 1,840 | 23.6 | 27.1 | 17.2 | 18.4 | 0.2 | 11.0 |
| Cash Assistance | |||||||
| Alaskac | 815 | 15.2 | 9.7 | 72.1 | 0.0 | 0.9 | 0.0 |
| Californiab | 70,588 | 20.5 | 2.7 | 47.5 | 14.8 | 12.4 | 0.0 |
| Kentuckybc | 15,676 | 24.6 | 25.8 | 38.9 | 4.4 | 3.8 | 0.0 |
| New Yorkb | 60,324 | 31.4 | 0.7 | 35.5 | 26.2 | 1.9 | 0.5 |
| Mississippic | 10,682 | 19.4 | 21.7 | 35.3 | 0.0 | 20.8 | 0.9 |
| Alabamac | 10,706 | 29.9 | 11.7 | 34.5 | 0.0 | 20.0 | 0.0 |
| District of Columbiab | 1,461 | 19.4 | 8.8 | 29.8 | 25.1 | 13.3 | 0.1 |
| North Carolinab | 22,570 | 24.4 | 0.0 | 27.1 | 19.6 | 26.5 | 0.0 |
| Medically Needy | |||||||
| Illinoisbd | 38,558 | 17.7 | 13.2 | 11.6 | 45.0 | 10.6 | 0.0 |
| SOURCE: Mathematica analysis of 2006-2007 MAX data for 44 states and the District of Columbia with representative FFS nursing home and ICF/IID data (excludes data from Alaska, Arizona, Indiana, Maine, Minnesota, New Hampshire, and Utah). NOTES: New spells are spells beginning on or after July 1, 2006. Methods used to determine which states utilized the 300% rule or had a medically needy program in 2007 are described in Appendix B.
| |||||||
Other individuals did qualify for Medicaid benefits prior to the beginning of their spells, however, indicating that these individuals were living in the community or residing in hospitals in the two months prior to their first new spell. In 14 states, the plurality of individuals who would eventually have new spells qualified for Medicaid via the "other" pathway, while in eight other states, the plurality qualified via the cash assistance pathway. Some of the individuals who qualified via the "other" criteria likely qualified through their participation in an HCBS waiver program. However, since coverage is retroactive up to three months prior to application for benefits, it is likely that some individuals qualified for benefits upon admission and are reported in the data as Medicaid enrollees in the two months prior to admission only because Medicaid retroactively covered their unpaid medical bills.
The vast majority of individuals who were not enrolled in Medicaid prior to their first new spell of Medicaid-financed nursing care qualified for benefits during their stay either through the "other" channel (63 percent) or a medically needy program (30 percent) (Table II.6). It is likely that these individuals' incomes were sufficiently high that they could only qualify for benefits under the 300 percent rule or by spending down to eligibility levels.
| TABLE II.6. Transitions in MAS at the Start of first New Medicaid-Financed Nursing Home Spells Between July 2006 and December 2007 | ||||||
|---|---|---|---|---|---|---|
| Number in MAS Group 2 Months Before Start of Spell | Percentage in MAS Group at Start of Spell | |||||
| "Other" | Cash Assistance-Related | Medically Needy | Poverty-Related | Section 115 Demonstration Waiver | ||
| Not Enrolled | 217,766 | 63.2 | 3.0 | 30.0 | 3.7 | 0.2 |
| "Other" | 153,993 | 96.0 | 1.5 | 1.1 | 1.3 | 0.0 |
| Cash Assistance-Related | 164,737 | 8.8 | 86.1 | 3.9 | 1.2 | 0.0 |
| Medically Needy | 65,009 | 4.1 | 1.5 | 93.2 | 1.3 | 0.0 |
| Poverty- Related | 65,077 | 38.4 | 1.2 | 7.8 | 52.4 | 0.2 |
| Section 1115 Demonstration Waiver | 4,481 | 66.1 | 3.3 | 8.5 | 2.6 | 19.5 |
| SOURCE: Mathematica analysis of 2006-2007 MAX data for 44 states and the District of Columbia with representative FFS nursing home and ICF/IID data (excludes data from Arizona, Indiana, Maine, Minnesota, New Hampshire, and Utah). NOTE: New spells are spells beginning on or after July 1, 2006. | ||||||
The majority of those who qualified for full-benefits before admission to the nursing home continued to qualify under the same eligibility criteria once admitted, reflecting their low-income. Among those previously enrolled individuals whose status changed upon admission, approximately two-thirds qualified at the beginning of their Medicaid-financed stay under the "other" eligibility criteria.10
B. Characteristics of Enrollees' Nursing Home Spells
1. How Long Did Enrollees Live in Nursing Homes?
Three-quarters of enrollees with new spells of nursing home care had either very short stays or long-term stays (Figure II.1), with 34 percent of all elderly and disabled enrollees discharged within three months of the beginning of the spell and 41 percent having spells of one year or more.11 As suggested above, the shorter stays could be a combination of enrollees receiving some post-acute care, those who died shortly after admission, and those who were not able to be placed in other LTC services.
| FIGURE II.1. Length of First New Nursing Home Spells Among Aged or Disabled Medicaid Enrollees with New Medicaid-Financed Nursing Home Spells Between July 2006 and December 2006 |
|---|
 |
| SOURCE: Mathematica analysis of 2006-2007 MAX data for 44 states and the District of Columbia with representative FFS nursing home and ICF/IID data (excludes data from Arizona, Indiana, Maine, Minnesota, New Hampshire, and Utah). NOTES: New spells in this figure are spells beginning between July 1, 2006, and December 31, 2006, inclusive; spells are censored at December 31, 2007. 243,912 enrollees had new nursing home spells beginning between July and December 2006. The median length of first new spells was 211 days for nursing facilities. State-level detail is provided in Appendix Table D.1. |
2. Did Enrollees Receiving Nursing Home Care Also Use HCBS?
Although HCBS were introduced as an alternative to nursing home care, HCBS and institutional services could also be complementary services in an integrated system of care, with each type of service meeting a specific level of need. To understand the extent to which these services are used together, we examined patterns of HCBS use prior to and after a nursing home stay. Of all enrollees with new spells in 2007, more than one in five (22.6 percent) used HCBS prior to their stay. Among those with shorter spells of nursing home care -- beginning and ending during the first half of 2007 -- an even greater fraction (27.2 percent) had previously used HCBS. Similarly, 30 percent of enrollees with spells beginning and ending in the second half of 2006 used HCBS in the following year.
| TABLE II.7. HCBS Use Among Aged or Disabled Enrollees with New Nursing Home Spells Between July 2006 and December 2007 | |
|---|---|
| HCBS Use Category | Percentage |
| First new spells beginning in 2007 preceded by HCBS use in 2006 | 22.6 |
| First new spells beginning in 2007 and ending on or before June 30, 2007, preceded by HCBS use in 2006 | 30.3 |
| First new spells ending in 2006 followed by HCBS use in 2007 | 27.2 |
| SOURCE: Mathematica analysis of 2006-2007 MAX data for 37 states and the District of Columbia with representative FFS nursing home and ICF/IID data and valid HCBS data (excludes data from Arizona, Indiana, Maine, Massachusetts, Michigan, Minnesota, Montana, New Hampshire, Oregon, Pennsylvania, Rhode Island, Texas, and Utah). NOTES: New spells are spells beginning on or after July 1, 2006. HCBS includes 1915(c) waiver services, personal care services, residential care services, home health, adult day services, and private duty nursing services. Spells are censored at December 31, 2007. New spells beginning in 2007 preceded by HCBS use in 2006 refers to all spells beginning and ending at any time in 2007 (including spells censored as of December 31, 2007) that were associated with an enrollee who used HCBS at any time in 2006; the percentage is taken with respect to all first new spells beginning and ending (possibly censored) in 2007. The percentage of first new spells beginning in 2007 and ending on or before June 30, 2007 preceded by HCBS use in 2006 and the percentage of first new spells ending in 2006 followed by HCBS use in 2007 are defined analogously. State-level detail is provided in Appendix Table D.2. | |
In many states, enrollees living in nursing homes used HCBS at a substantially higher rate than the overall average.12 At least 35 percent of nursing home residents in six states (Connecticut, Idaho, Iowa, Missouri, New York, and Washington) used HCBS either before or after their nursing home stays.13
C. Associations Between Lengths of Stay in Nursing Homes and State Policy-Related Variables
Policymakers often want to know whether there is any association between their policies and the use of services at the state level. To explore this question, we assessed the relationship between the length of enrollees' nursing home stays and policy-related measures. Although these associations may be informative to those who seek to improve LTC services, we caution that causal relationships cannot be inferred from our findings.
Given states' efforts to re-balance their systems of LTSS toward greater provision of HCBS, it is natural to ask whether there is a relationship between the length of nursing home stays in a state and the amount of HCBS that the state provides. We examined the relationship between length-of-stay and four different measures of balance: (1) the percentage of Medicaid LTC expenditures allocated to HCBS; (2) the percentage of LTC users' total Medicaid expenditures accounted for by HCBS; (3) the percentage of Medicaid LTC recipients who used HCBS; and (4) the percentage of potential Medicaid LTC recipients -- namely, the number of low-income elderly or disabled individuals living in the state14 -- who used HCBS.
| TABLE II.8. Changes in the Percentages of Very Short and Very Long Nursing Home Spells Associated with Increases in State Policy Variables | ||
|---|---|---|
| Policy Change | Change in the Percentage of First New Spells Lasting Less Than 3 Months (percentage points) | Change in the Percentage of First New Spells Lasting More Than 12 Months (percentage points) |
| A 10 percentage point increase in the percentage of Medicaid LTC expenditures allocated to HCBS | +2.5 | -2.2 |
| A 10 percentage point increase in the percentage of LTC users' total Medicaid expenditures accounted for by HCBS users | +2.7 | -2.3 |
| A 10 percentage point increase in the percentage of Medicaid LTC recipients using HCBS | +3.5 | -2.8 |
| A 10 percentage point increase in the percentage of potential Medicaid LTC recipients using HCBS | +5.3 | -3.6 |
| An increase of 10 in the number of nursing home beds per 1,000 elderly | -2.6 | +2.2 |
| SOURCE: Mathematica analysis of 2006-2007 MAX data for 37 states and the District of Columbia with representative FFS nursing home and ICF/IID data and valid HCBS data (excludes data from Arizona, Indiana, Maine, Massachusetts, Michigan, Minnesota, Montana, New Hampshire, Oregon, Pennsylvania, Rhode Island, Texas, and Utah). Nursing home bed data were obtained from Houser et al. (2009) at http://assets.aarp.org/rgcenter/il/d19105_2008_ats_1.pdf (page 65). Figures for trimmed data are in Appendix Table D.3. NOTES: New spells in this table are spells beginning between July 1, 2006, and December 31, 2006, inclusive; spells are censored at December 31, 2007. HCBS includes 1915(c) waiver services, personal care services, residential care services, home health, adult day services, and private duty nursing services. | ||
In general, the percentage of nursing home stays lasting less than three months was higher in states that allocated a greater share of their Medicaid LTC expenditures to HCBS or had higher HCBS participation rates, although the magnitude of the measured associations was small. Increases of 10 percentage points in the four re-balancing measures were all associated with an increase in the percentage of first new spells lasting less than three months of 5 percentage points or less (Table II.8). There were corresponding decreases in the percentage of spells lasting more than 12 months.15 These findings, particularly those documenting positive relationships between HCBS spending/use as percentages of LTC spending/use and the percentage of stays lasting less than three months, are consistent with Wenzlow et al. (2008), who reached a similar conclusion using earlier data.16
| FIGURE II.2. The Relationship Between the Percentage of Medicaid LTC Expenditures Allocated to HCBS and the Length of Nursing Home Spells |
|---|
 |
| SOURCE: MAX, 2006-2007. |
As noted earlier, these are not necessarily causal relationships. Greater spending on HCBS could reflect a state's commitment to providing services in the community to a broad population or more intensive services to a limited population, both of which would enable more elderly and individuals with disabilities to continue living in the community. If so, the share of nursing home stays lasting three months or less might decrease as LTC users were either transitioned or diverted from nursing home care while individuals requiring shorter-term post-acute care continued to use nursing facilities. At the same time, as more enrollees who are able to live in the community begin to use HCBS, nursing homes might continue to admit only the most highly impaired LTC users, resulting in a potentially higher share of stays exceeding one year. The results reported here suggest, on balance, a shortening rather than a lengthening of stays with increased provision of HCBS (Figure II.2 and Figure II.3).
| FIGURE II.3. The Relationship Between the Percentage of Medicaid LTC Users' Total Medicaid Expenditures Accounted for by HCBS Users and the Length of Nursing Home Spells |
|---|
 |
| SOURCE: MAX, 2006-2007. |
Greater rates of HCBS utilization were also associated with somewhat shorter stays (Figure II.4 and Figure II.5). Although this could reflect an emphasis on providing HCBS as an alternative to institutional care in states with high-HCBS utilization rates, it is also possible that Medicaid programs in states with healthier populations are able to serve more of their enrollees in the community whereas less healthy states have higher rates of institutionalization, something that we did not control for in this study.
| FIGURE II.4. The Relationship Between the Percentage of Medicaid LTC Recipients Using HCBS and the Length of Nursing Home Spells |
|---|
 |
| SOURCE: MAX, 2006-2007. |
Finally, the length of nursing home stays was related to the supply of LTC beds in the state, with the percentage of stays lasting three months or less lower in states with a higher number of nursing home beds per 1,000 elderly living in the state (Figure II.6). This could reflect a number of influences. For example, a state might license a larger number of nursing home beds because of population characteristics or circumstances that necessitate providing more nursing home care. Iowa has one of the highest bed supplies but also the highest average age among nursing home residents of 81; in addition, it has a highly rural population, which makes provision of community services more difficult.
| FIGURE II.5. The Relationship Between the Percentage of Potential Medicaid LTC Recipients Using HCBS and the Length of Nursing Home Spells |
|---|
 |
| SOURCE: MAX, 2006-2007, and the ACS, 2007. |
In addition to the variables described above, we also examined the association between the percentage of stays lasting less than three months and two variables related to bed-hold policies: (1) the percentage of the per diem rate that the state's Medicaid program reimbursed for held beds in 2007; and (2) the maximum number of days that the program would reimburse for held beds. Large numbers of states were clustered at zero, 100 percent (in the first instance), or two weeks (in the second instance), and no meaningful associations were detected.17
Finally, the length of nursing home stays was related to the supply of LTC beds in the state, with the percentage of stays lasting three months or less lower in states with a higher number of nursing home beds per 1,000 elderly living in the state (Figure II.6). This could reflect a number of influences. For example, a state might license a larger number of nursing home beds because of population characteristics or circumstances that necessitate providing more nursing home care. Iowa has one of the highest bed supplies but also the highest average age among nursing home residents of 81; in addition, it has a highly rural population, which makes provision of community services more difficult.
| FIGURE II.6. The Relationship Between the Number of Nursing Home Beds Per 1,000 Elderly and the Length of Nursing Home Spells |
|---|
 |
| SOURCE: MAX, 2006-2007, and Houser et al. (2009). |
In addition to the variables described above, we also examined the association between the percentage of stays lasting less than three months and two variables related to bed-hold policies: (1) the percentage of the per diem rate that the state's Medicaid program reimbursed for held beds in 2007; and (2) the maximum number of days that the program would reimburse for held beds. Large numbers of states were clustered at zero, 100 percent (in the first instance), or two weeks (in the second instance), and no meaningful associations were detected.18
D. Summary of Nursing Home Findings
Enrollees with nursing home stays tended to have either very short or very long spells of care (34 percent and 41 percent, respectively), indicating a mix of residents some of whom likely need only temporary care (for example, post-acute cases) while others will likely require access to nursing and medical services for the remainder of their lives. A significant number of enrollees with new spells (31 percent) were not enrolled in Medicaid prior to the beginning of their Medicaid-financed spell, at which point approximately half (49 percent) qualified for benefits under "other" eligibility criteria -- which include the 300 percent rule -- while most others qualified under cash assistance-related or medically needy provisions. One possible explanation for this finding is that many enrollees had incomes that were higher than the SSI standard prior to beginning their Medicaid-financed spells, and some were already residing in the nursing home, paying for services through Medicare, private insurance, or out-of-pocket.
One of the most significant findings is that a substantial minority of enrollees with new spells also used HCBS at some point during 2006 or 2007. Among those with spells of six months or less, 30 percent used HCBS prior to receiving nursing home services, while more than one in four used HCBS following discharge. This suggests the possibility that a significant number of enrollees with nursing home stays used HCBS and institutional care in an integrated fashion and therefore that single-point of entry or "no wrong door" approaches to allowing individuals to access LTSS -- as embodied by the Aging and Disability Resource Centers and other approaches -- could be particularly valuable in helping individuals and their family members navigate the system of LTC as their needs change over time.
Although the percentage of nursing home spells lasting three months or less was generally higher in states with larger investments in HCBS relative to nursing homes and higher HCBS utilization rates (and the percentage lasting 12 months or more was generally lower), these associations were not especially large. This is not surprising, given the many variables that determine both length-of-stay and HCBS use that were not considered here. It is likely that further analysis of the relationship between patterns of HCBS and nursing home use at the person-level, as explained by individual enrollees' distinct characteristics and needs, will yield results with a clearer interpretation.
Relative to the 2001-2002 period studied by Wenzlow et al. (2008), there were fewer elderly and people with disabilities enrolled in Medicaid in 2006-2007, and fewer of these individuals had either new or ongoing nursing home spells. The percentage of this population receiving care in nursing homes declined slightly in states that allocated a high proportion of their Medicaid LTC expenditures to HCBS while rising slightly in others, and the positive associations between the percentage of spells lasting less than three months and the proportion of Medicaid LTC spending allocated to HCBS (as well as the percentage of Medicaid-financed LTC recipients using HCBS) observed in the earlier study were confirmed here with the more recent data.
III. the Characteristics of Enrollees Using ICF/IID Services and Their Spells of CARE
Medicaid enrollees with ID/DD generally benefit from access to a range of social and educational, employment-related, rehabilitative, and medical services tailored to their particular needs. To help meet these needs, states designed ICFs/IID to provide residential care and a variety of specialized services. In recent years, states have moved to serve the ID/DD population with HCBS, in part due to the Olmstead decision, which mandated that they be served in communities where appropriate. Consequently, people with ID/DD may live and receive services in a community setting or in an ICF/IID. Because many enrollees receiving HCBS live in group homes, and because not all ICFs/IID are large -- some have as few as four beds -- the distinction between ICF/IID and HCBS use is not a sharp one (despite the clean separation between the two types of service implied by some of the analyses below).
ICFs/IID were originally conceived as large institutions, but caregivers and policymakers quickly recognized the potential benefits of greater community integration, spawning the growth in the early 1980s of community ICFs/IID with between four and 15 beds (Prouty et al. 2008). The two types of ICFs/IID differ substantially. The number of individuals residing in large public ICFs/IID has decreased steadily over time (from 55,000 total residents in 1997 to 32,000 in 2009). Many states have either closed these facilities completely or downsized them as smaller institutions and community settings have gained favor as more integrated settings in which to deliver care. In still other states, however, state-run ICFs/IID areactive portals to the ID/DD service system, especially for crisis/emergency situations.19 While the populations of large institutions have declined, the number of individuals served by community ICFs/IID has remained more stable over time.20 Although they are of declining interest for new development, these "community" settings are noteworthy for both their stability as institutions and the stability of their resident populations over time.
Thus, although all ICFs/IID are technically institutions, the smaller community ICFs/IID represent an intermediate alternative on the continuum of ID/DD care between HCBS and care in larger institutions. Although we discuss ICFs/IID as a single group below, it is important to bear in mind that larger state-run ICFs/IID often look different from the smaller community ICFs/IID and the extent to which one type or another dominates varies extensively across states. These differences likely reflect different approaches to the care of the ID/DD population, including how HCBS is integrated with institutional services.21 Future research would benefit from the availability of data that permit the use of services in large state-run ICFs/IID and smaller community ICFs/IID to be explicitly analyzed and compared. Such data could be used to explore the movement of institutionalized individuals from larger care settings to smaller ones, as well as the variation in the use of services provided by large and smaller ICF/IID across states.
A. Characteristics of Enrollees Using Intermediate Care Facility for People with Intellectual Disabilities Services
1. How Many Enrollees Had New Spells of ICF/IID Care?
Few Medicaid enrollees used ICF/IID services. Of the nearly 12 million enrollees who were either elderly or eligible on the basis of disability between July 1, 2006, and December 31, 2007, only 93,761 had been in an ICF/IID, and only 9 percent (8,430) of those individuals -- representing less than one-tenth of 1 percent of all elderly or disabled enrollees -- had new spells of care. Thus, turnover in ICFs/IID was significantly lower than the turnover rate reported for enrollees in nursing homes (Chapter II). The number of enrollees residing in ICFs/IID was also relatively low compared to the number of enrollees with ID/DD who received HCBS waiver services in the community: in 2006, approximately 410,000 individuals were enrolled in waivers for individuals with ID/DD (MR/DD waivers) in the states analyzed here (Ng and Harrington 2009).
Differences across states in the number of spells or new spells were likely due in part to different state policies with respect to ICFs/IID. For example, Oregon and Vermont, which have been leaders in promoting community-based care for the ID/DD population, each had only a single ICF/IID in 2007 and correspondingly low numbers of ICF/IID spells (zero, in the case of Oregon).22 As mentioned above with respect to nursing home users, a disproportionate number of new ICF/IID spells were concentrated in a handful of large states, with California, Texas, New York, and Illinois together accounting for 45 percent of all new spells. Although the percentage of ICF/IID spells that were new was substantially higher in some states--including Alaska, Montana, South Dakota, Rhode Island, and Colorado--the actual numbers of new spells in these states were low, together accounting for only one percent of all new spells.23
| TABLE III.1. Medicaid FFS ICF/IID Use Among Aged or Disabled Enrollees Eligible for Full Medicaid Benefits Any Time Between July 2006 and December 2007 | |||||
|---|---|---|---|---|---|
| Total Number of Aged and Disabled Enrollees | Number of Enrollees with ICF/IDD Spells | Number of Enrollees with New ICF/IID Spells | Percentage of Enrollees with New ICF/IID Spells | Percentage of ICF/IID Enrollees with New ICF/IID Spells | |
| All States | 11,922,095 | 93,761 | 8,430 | 0.1 | 9.0 |
| Alabama | 215,562 | 253 | 32 | 0.0 | 12.6 |
| Alaska | 22,542 | b | b | b | b |
| Arkansas | 147,070 | 1,780 | 283 | 0.2 | 15.9 |
| California | 1,848,937 | 8,864 | 1,123 | 0.1 | 12.7 |
| Colorado | 115,524 | 150 | 30 | 0.0 | 20.0 |
| Connecticut | 113,746 | 1,261 | 115 | 0.1 | 9.1 |
| Delaware | 24,219 | 147 | b | b | b |
| District of Columbia | 43,901 | 695 | 89 | 0.2 | 12.8 |
| Florida | 661,152 | 3,060 | 135 | 0.0 | 4.4 |
| Georgiaa | 315,975 | 1,190 | 165 | 0.1 | 13.9 |
| Hawaii | 44,956 | 84 | b | b | b |
| Idaho | 44,065 | 617 | 93 | 0.2 | 15.1 |
| Illinois | 467,613 | 9,477 | 651 | 0.1 | 6.9 |
| Iowa | 101,732 | 2,332 | 167 | 0.2 | 7.2 |
| Kansas | 85,305 | 644 | 37 | 0.0 | 5.7 |
| Kentucky | 249,333 | 717 | 71 | 0.0 | 9.9 |
| Louisiana | 239,281 | 5,584 | 497 | 0.2 | 8.9 |
| Maryland | 168,074 | 342 | 19 | 0.0 | 5.6 |
| Massachusetts | 379,285 | 1,031 | 54 | 0.0 | 5.2 |
| Michigan | 413,303 | 143 | 20 | 0.0 | 14.0 |
| Mississippi | 185,700 | 2,921 | 336 | 0.2 | 11.5 |
| Missouri | 266,561 | 1,006 | 63 | 0.0 | 6.3 |
| Montana | 26,767 | 66 | 19 | 0.1 | 28.8 |
| Nebraska | 55,381 | 632 | 76 | 0.1 | 12.0 |
| Nevada | 45,739 | 144 | 22 | 0.0 | 15.3 |
| New Jersey | 288,719 | 3,074 | 177 | 0.1 | 5.8 |
| New Mexico | 77,024 | 274 | 34 | 0.0 | 12.4 |
| New York | 1,097,394 | 8,548 | 756 | 0.1 | 8.8 |
| North Carolina | 426,342 | 4,204 | 213 | 0.0 | 5.1 |
| North Dakota | 17,766 | 582 | 49 | 0.3 | 8.4 |
| Ohio | 471,689 | 7,793 | 617 | 0.1 | 7.9 |
| Oklahoma | 152,507 | 1,845 | 208 | 0.1 | 11.3 |
| Oregon | 107,585 | 0 | 0 | 0.0 | 0.0 |
| Pennsylvania | 685,973 | 4,077 | 193 | 0.0 | 4.7 |
| Rhode Islanda | 59,865 | 46 | b | b | b |
| South Carolina | 216,208 | 1,735 | 144 | 0.1 | 8.3 |
| South Dakota | 23,255 | 201 | 46 | 0.2 | 22.9 |
| Tennesseea | 391,227 | 1,280 | 36 | 0.0 | 2.8 |
| Texas | 803,650 | 12,696 | 1,225 | 0.2 | 9.6 |
| Vermont | 29,604 | b | b | b | b |
| Virginia | 216,853 | 1,917 | 193 | 0.1 | 10.1 |
| Washington | 232,549 | 59 | b | b | b |
| West Virginia | 122,980 | 569 | 92 | 0.1 | 16.2 |
| Wisconsin | 207,083 | 1,572 | 307 | 0.1 | 19.5 |
| Wyoming | 12,099 | 98 | 11 | 0.1 | 11.2 |
| SOURCE: Mathematica analysis of 2006-2007 MAX data for 44 states and the District of Columbia with representative FFS nursing home and ICF/IID data (excludes data from Arizona, Indiana, Maine, Minnesota, New Hampshire, and Utah). NOTES: New spells are spells beginning on or after July 1, 2006.
| |||||
Although much emphasis has been placed on re-balancing services for the ID/DD population toward community settings in the wake of the Olmstead decision, concerns have been raised about the lack of institutional capacity in some states for individuals with complex needs (Western Interstate Commission for Higher Education 2009). For example, because no ICF/IID was located in Alaska during the study period, it placed its four enrollees requiring institutional services in three Idaho facilities.
2. Who Used ICF/IID Care?
The majority of enrollees with new ICF/IID spells were male and under 65 years old, with a substantial number having multiple spells of care during the study period. Unlike nursing homes, whose residents are more likely to be female and elderly, 60 percent of the 8,430 enrollees with ICF/IID spells were male, and 38 percent were between 21 and 44 years old (Table III.2). Significant percentages of enrollees residing in ICFs/IID were younger than 21 (29 percent) or between 45 and 64 years old (27 percent).
| TABLE III.2. Characteristics of Aged or Disabled Enrollees with New Medicaid-Financed ICF/IID Spells Between July 2006 and December 2007 | ||
|---|---|---|
| Characteristic | Enrollees with One or More New ICF/IID Spells | Enrollees with Both New Nursing Home and New ICF/IID Spells |
| Number of Enrollees with New Spells in All States | 8,430 | 994 |
| Percentage female | 40.1 | 47.4 |
| Percentage non-Hispanic White | 72.1 | 80.7 |
| Age (Percentage of Subgroup) | ||
| Under age 21 | 29.0 | 4.4 |
| 21-44 years | 38.4 | 29.5 |
| 45-64 years | 26.5 | 49.0 |
| 65-74 years | 3.8 | 10.0 |
| 75-84 years | 1.5 | 5.4 |
| 85 years and older | 0.4 | 1.7 |
| Percentage with Multiple New Spells | 14.6 | 100.0 |
| Percentage with Spells in Both Nursing Homes and ICFs/IID | 11.8 | 100.0 |
| SOURCE: Mathematica analysis of 2006-2007 MAX data for 44 states and the District of Columbia with representative FFS nursing home and ICF/IID data (excludes data from Arizona, Indiana, Maine, Minnesota, New Hampshire, and Utah). NOTE: New spells are spells beginning on or after July 1, 2006. | ||
Of all enrollees with new spells of ICF/IID care, 15 percent had more than one new spell within the 18-month period between July 2006 and December 2007, and 12 percent had spells in both ICFs/IID and nursing homes (discussed in greater detail below). Older women were much more prevalent among those who used both ICFs/IID and nursing homes: slightly less than half of all enrollees who received both types of institutional care were female, and 17 percent were over 65 years old, compared with only 6 percent for enrollees with only ICF/IID spells. It is possible that some ICF/IID residents were moved to nursing homes as they grew older and required more complex and continual medical care, but the vast majority of enrollees with stays in both types of institution (83 percent) were younger than 65.
| TABLE III.3. MAS in First Month of First New Medicaid-Financed ICF/IID Spell Among Aged or Disabled Enrollees Eligible for Full Medicaid Benefits Any Time Between July 2006 and December 2007 | ||||||
|---|---|---|---|---|---|---|
| States (by largest MAS group) | Total Number of Enrollees with new ICF/IID Spells | Percentage in MAS Group at Start of Spell | ||||
| "Other" | Cash Assistance- Related | Medically Needy | Poverty- Related | Section 1115 Demonstration Waiver | ||
| Cash Assistance | ||||||
| Alaskac | e | e | e | e | e | e |
| Rhode Islandabc | e | e | e | e | e | e |
| Georgiaabc | 165 | 21.8 | 78.2 | 0.0 | 0.0 | 0.0 |
| New Mexicoc | 34 | e | e | e | e | e |
| Idahoc | 93 | e | 71.0 | e | e | e |
| Texasc | 1,225 | 33.1 | 66.6 | e | e | e |
| South Dakotac | 46 | e | 63.0 | e | e | e |
| Delawarec | e | e | e | e | e | e |
| Floridabc | 135 | 35.6 | 61.5 | e | e | e |
| Mississippic | 336 | 38.4 | 61.3 | e | e | e |
| North Carolinab | 213 | e | 60.1 | e | 33.3 | e |
| Michiganbc | 20 | e | e | e | e | e |
| District of Columbiab | 89 | e | e | e | e | e |
| Tennesseeabc | 36 | e | e | e | e | e |
| Montanab | 19 | e | e | e | e | e |
| Kansasbc | 37 | 43.2 | 56.8 | 0.0 | 0.0 | 0.0 |
| Wisconsinbc | 307 | 39.7 | 56.7 | e | e | e |
| Coloradoc | 30 | 43.3 | 56.7 | 0.0 | 0.0 | 0.0 |
| South Carolinac | 144 | 27.1 | 56.3 | 0.0 | 16.7 | 0.0 |
| Louisianabc | 497 | 44.1 | 55.3 | e | e | e |
| Arkansasbc | 283 | 46.3 | 52.7 | e | e | e |
| Californiab | 1,123 | 4.5 | 51.4 | 41.7 | 2.4 | 0.0 |
| North Dakotabd | 49 | 0.0 | 51.0 | 49.0 | 0.0 | 0.0 |
| Hawaiibd | e | e | e | e | e | e |
| All States | 8,430 | 32.5 | 48.2 | 15.4 | 3.9 | 0.1 |
| Massachusettsb | 54 | e | e | e | e | e |
| "Other" | ||||||
| Vermontbc | e | e | e | e | e | e |
| Washingtonbc | e | e | e | e | e | e |
| Wyomingc | 11 | e | e | e | e | e |
| Oklahomacd | 208 | 81.3 | 13.5 | 0.0 | 5.3 | 0.0 |
| Connecticutbd | 115 | 73.0 | 24.3 | 2.6 | 0.0 | 0.0 |
| Ohiod | 617 | 69.5 | 25.0 | 0.0 | 5.5 | 0.0 |
| Missourid | 63 | 66.7 | 33.3 | 0.0 | 0.0 | 0.0 |
| New Jerseybc | 177 | 66.7 | 30.5 | e | e | e |
| Iowabc | 167 | 60.5 | 39.5 | 0.0 | 0.0 | 0.0 |
| Virginiabcd | 193 | 57.0 | 38.9 | e | e | e |
| Nevadac | 22 | e | e | e | e | e |
| West Virginiabc | 92 | 53.3 | 43.5 | e | e | e |
| Pennsylvaniabc | 193 | 52.3 | 40.4 | e | e | e |
| Kentuckybc | 71 | 52.1 | 43.7 | e | e | e |
| Alabamac | 32 | 50.0 | 46.9 | e | e | e |
| Medically Needy | ||||||
| Nebraskab | 76 | e | e | 57.9 | e | e |
| New Yorkb | 756 | e | e | 55.7 | e | e |
| Marylandbc | 19 | e | e | e | e | e |
| Illinoisbd | 651 | 25.7 | 22.4 | 40.4 | 11.5 | 0.0 |
| SOURCE: Mathematica analysis of 2006-2007 MAX data for 44 states and the District of Columbia with representative FFS nursing home and ICF/IID data (excludes data from Arizona, Indiana, Maine, Minnesota, New Hampshire, and Utah). NOTE: New spells are spells beginning on or after July 1, 2006. MAX data reported no new ICF/IID spells in Oregon. Methods used to determine which states utilized the 300% rule or had a medically needy program in 2007 are described in Appendix B.
| ||||||
3. How Did Enrollees Residing in ICFs/IID Become Eligible for Medicaid?
More enrollees using ICF/IID services qualified for Medicaid benefits through cash assistance-related criteria than through any other pathway, with the vast majority already enrolled in Medicaid prior to admission. Across all 45 states, nearly half of all enrollees in ICFs/IID qualified for full-benefits via the cash assistance pathway in 2007, followed by "other" criteria (33 percent) and medically needy programs (15 percent) (Table III.3).24 In roughly half of states analyzed (23 out of 45), the majority of ICF/IID residents with new spells qualified for Medicaid at the start of their spell due to their low-incomes -- that is, they qualified under cash assistance-related criteria. Moreover, in all states except Illinois cash assistance-related criteria represented either the most common or second most common pathway to Medicaid eligibility. Finally, cash assistance was the most common pathway to eligibility in the two states with the largest number of new spells: California and Texas. "Other" criteria were the most common pathway to eligibility in 15 states -- one-third of which are 209(b) states -- while medically needy programs were the most common pathway in four states. As with enrollees in nursing homes, poverty-related expansions were a common pathway to eligibility in Hawaii, Massachusetts, and North Carolina.
In contrast to enrollees in nursing homes, most enrollees living in an ICF/IID were enrolled in Medicaid prior to their first spell of institutional care, with only 11 percent not enrolled two months prior to admission (Table III.4). Among those qualifying for benefits two months prior to their ICF/IID stay, most qualified either via cash assistance (48 percent) or "other" (24 percent). Cash assistance was either the most common or second most common pathway to eligibility in all states except Illinois. Thus, recipients of Medicaid-financed ICF/IID services generally had low-incomes and were not spending down available assets as many nursing home residents do. As with enrollees in nursing homes, retroactive eligibility for Medicaid benefits at the time of admission to the ICF/IID likely accounts for some of the observed enrollment in Medicaid two months prior to admission.
| TABLE III.4. MAS in the Two Months Preceding the First New Medicaid-Financed ICF/IID Spells of Aged or Disabled Enrollees Between July 2006 and December 2007 | |||||||
|---|---|---|---|---|---|---|---|
| States (by largest MAS group) | Total Number of Enrollees with new Nursing Home Spells | Percentage in MAS Group at Start of Spell | |||||
| Not Enrolled | "Other" | Cash Assistance- Related | Medically Needy | Poverty- Related | Section 1115 Demonstration Waiver | ||
| Cash Assistance | |||||||
| Alaskac | e | e | e | e | e | e | e |
| Rhode Islandabc | e | e | e | e | e | e | e |
| Vermontbc | e | e | e | e | e | e | e |
| Georgiaabc | 165 | e | 15.8 | 75.2 | e | e | e |
| South Carolinac | 144 | e | 17.4 | 67.4 | e | e | e |
| Michiganbc | 20 | e | e | e | e | e | e |
| Tennesseeabc | 36 | e | e | e | e | e | e |
| Marylandbc | 19 | e | e | e | e | e | e |
| Montanab | 19 | e | e | e | e | e | e |
| South Dakotac | 46 | e | e | 63.0 | e | e | e |
| District of Columbiab | 89 | e | e | 62.9 | e | e | e |
| Mississippic | 336 | e | 21.4 | 61.9 | e | e | e |
| New Mexicoc | 34 | e | e | 61.8 | e | e | e |
| Texasc | 1,225 | 16.5 | 16.0 | 60.7 | e | e | e |
| North Carolinab | 213 | e | 0.0 | 60.1 | e | 25.4 | e |
| Wisconsinbc | 307 | e | 36.5 | 57.3 | e | e | e |
| Louisianabc | 497 | e | 19.9 | 56.5 | e | e | e |
| Idahoc | 93 | 20.4 | e | 55.9 | e | e | e |
| Floridabc | 135 | e | 25.2 | 53.3 | e | e | e |
| Californiab | 1,123 | 6.0 | 3.9 | 53.3 | 33.0 | 3.5 | 0.0 |
| Alabamac | 32 | e | e | 53.1 | e | e | e |
| North Dakotabd | 49 | e | e | 53.1 | e | e | e |
| New Yorkb | 756 | e | e | 51.9 | e | e | e |
| Kansasbc | 37 | e | e | 51.4 | e | e | e |
| Delawarec | e | e | e | e | e | e | e |
| Hawaiibd | e | e | e | e | e | e | e |
| Arkansasbc | 283 | e | e | 48.8 | e | e | e |
| Pennsylvaniabc | 193 | e | e | 48.2 | e | e | e |
| Massachusettsb | 54 | e | e | 48.1 | e | e | e |
| All States | 8,430 | 10.9 | 23.8 | 47.8 | 10.8 | 5.7 | 0.1 |
| Coloradoc | 30 | e | e | 46.7 | e | e | e |
| Kentuckybc | 71 | e | e | 45.1 | e | e | e |
| West Virginiabc | 92 | e | e | 43.5 | e | e | e |
| Virginiabcd | 193 | e | e | 43.0 | e | e | e |
| Nevadac | 22 | e | e | e | e | e | e |
| "Other" | |||||||
| Oklahomacd | 208 | e | 37.0 | 34.6 | e | e | e |
| New Jerseybc | 177 | e | 62.1 | 18.1 | e | e | e |
| Ohiod | 617 | 10.2 | 61.8 | 21.2 | 0.0 | 5.7 | 0.0 |
| Wyomingc | e | e | e | e | e | e | e |
| Alaskac | 167 | e | 64.1 | e | 0.0 | 0.0 | 0.0 |
| Connecticutbd | 115 | e | 61.7 | e | e | e | e |
| Missourid | 63 | e | 69.8 | e | e | e | e |
| Washingtonbc | e | e | e | e | e | e | e |
| Medically Needy | |||||||
| Nebraskab | 76 | e | e | e | 48.7 | e | e |
| Illinoisbd | 651 | e | 29.3 | 16.3 | 30.7 | 15.7 | e |
| SOURCE: Mathematica analysis of 2006-2007 MAX data for 44 states and the District of Columbia with representative FFS nursing home and ICF/IID data (excludes data from Alaska, Arizona, Indiana, Maine, Minnesota, New Hampshire, and Utah). NOTES: New spells are spells beginning on or after July 1, 2006. MAX data reported no new ICF/IID spells in Oregon. Methods used to determine which states utilized the 300% rule or had a medically needy program in 2007 are described in Appendix B.
| |||||||
ICF/IID residents who were enrolled in Medicaid prior to admission generally continued to qualify for benefits according to the same eligibility criteria following admission, with 87-93 percent of those who qualified via the "other," cash assistance, and medically needy pathways remaining in the same MAS group (Table III.5). As with nursing homes, the percentage remaining in the poverty-related group (46 percent) was lower, with most of those enrollees qualifying for benefits under "other" criteria following admission. Among those residents who were not enrolled in Medicaid two months prior to admission, approximately half qualified for Medicaid via the "other" pathway, with the remainder qualifying via the cash assistance (29 percent) and medically needy (19 percent) pathways.
| TABLE III.5. Transitions in MAS at the Start of First New Medicaid-Financed ICF/IID Spells Between July 2006 and December 2007 | ||||||
|---|---|---|---|---|---|---|
| MAS Group Two Months Before Start of Spell | Number in MAS Group Two Months Before Start of Spell | Percentage in MAS Group at Start of Spell | ||||
| "Other" | Cash Assistance- Related | Medically Needy | Poverty- Related | Section 1115 Demonstration Waiver | ||
| Not enrolled | 915 | 49.2 | 29.0 | 18.5 | a | a |
| "Other" | 2,006 | 87.4 | 8.5 | 2.2 | a | a |
| Cash assistance | 4,028 | 7.8 | 87.0 | 4.5 | a | a |
| Medically needy | 912 | a | 5.6 | 92.9 | a | a |
| Poverty-related | 479 | 37.4 | 7.7 | 8.8 | 46.1 | 0.0 |
| Section 1115 demonstration waiver | 12 | a | a | a | a | a |
| SOURCE: Mathematica analysis of 2006-2007 MAX data for 44 states and the District of Columbia with representative FFS nursing home and ICF/IID data (excludes data from Arizona, Indiana, Maine, Minnesota, New Hampshire, and Utah). NOTES: New spells are spells beginning on or after July 1, 2006. MAX data reported no new ICF/IID spells in Oregon.
| ||||||
B. Characteristics of Enrollees' Intermediate Care Facility for People with Intellectual Disabilities Spells
1. How Long Did Enrollees Live in ICFs/IID?
Most enrollees living in ICFs/IID were long-term residents, with more than seven out of ten individuals with new spells staying for more than one year (Figure III.1). Some of these individuals might have required the level of services that can only be provided in an institutional setting. Others might have benefited from transitioning to the community, but their family members or guardians might have lacked information about community-based options or resources for facilitating a transition.
A second group of individuals, constituting 13 percent of all enrollees living in ICFs/IID, had very short stays of three months or less. In many cases, these short stays corresponded to ICF/IID closings. For example, Wisconsin -- which accounted for 23 percent (90 out of 390) of the very short spells that began in the second half of 2006 -- closed seven ICFs/IID between June 30, 2006, and June 30, 2007, four of which were larger facilities with 16 or more beds (Lakin et al. 2008; Lakin et al. 2007). California and New York, accounting for 20 percent of very short stays, also closed large facilities during this period.25
| FIGURE III.1. Length of First New ICF/IID Spells Among Aged or Disabled Medicaid Enrollees with New Medicaid-Financed ICF/IID Spells Between July 2006 and December 2006 |
|---|
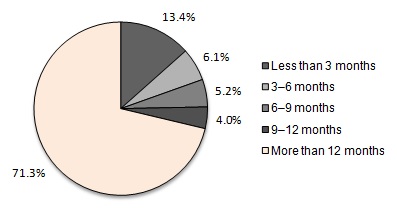 |
| SOURCE: Mathematica analysis of 2006-2007 MAX data for 44 states and the District of Columbia with representative FFS ICF/IID data (excludes data from Arizona, Indiana, Maine, Minnesota, New Hampshire, and Utah). NOTES: New spells in this figure are spells beginning between July 1, 2006, and December 31, 2006, inclusive; spells are censored at December 31, 2007. 2,908 enrollees had new ICF/IID spells beginning between July and December 2006. The median length of first new spells was 425 days for ICFs/IID. |
2. Did Enrollees with ICF/IID Stays Also Have Nursing Home Stays?
Ideally, an individual with ID/DD who qualifies for Medicaid benefits and requires LTSS will be placed in the environment best suited to address his or her specific needs. Individuals with complex medical needs who require more or less continual access to nursing care might be best served in a nursing home.26 Historically, however, the lack of availability of certain services has sometimes resulted in individuals being placed in inappropriate settings. Early in the development of the ICF/IID program, for example, many persons with ID/DD who did not require a high level of nursing care were placed in nursing homes rather than facilities specifically geared to their needs (Lakin and Hall 1990).27
The closure of larger ICFs/IID in recent years, combined with the greater emphasis on HCBS for the ID/DD population, raises the question of where enrollees who had previously used ICF/IID services were placed: in other ICFs/IID, in nursing homes, or in the community?
A substantial minority of enrollees in ICFs/IID were admitted to multiple types of institutions, with 994 of the 8,430 (12 percent) with ICF/IID admissions also receiving nursing home care during the 18-month study period (Table III.6). These 994 individuals represented a tiny share (0.1 percent) of all enrollees in nursing homes. Thus, while it is unusual for a nursing home resident to require ICF/IID care -- which requires a diagnosis indicating a need for such care -- it is not uncommon for ICF/IID residents to require nursing home services at some point.
| TABLE III.6. Use of Nursing Homes and ICFs/IID by Aged or Disabled Enrollees with Multiple Spells Between July 2006 and December 2007 | |
|---|---|
| Enrollees with Multiple Spells and the Order of Spells | Number or Percentage |
| Enrollees with both ICF/IID and nursing home spells | 994 |
| Percentage of all ICF/IID residents | 11.8 |
| Percentage of all nursing home residents | 0.1 |
| Enrollees with a first new ICF/IID spell followed by a nursing home spell | 122 |
| Percentage with no gap between spells | 46.7 |
| Percentage with a gap of 60 days or less between spells | 84.4 |
| Enrollees with a first new nursing home spell followed by an ICF/IID spell | 872 |
| Percentage with no gap between spells | 59.4 |
| Percentage with a gap of 60 days or less between spells | 93.2 |
| SOURCE: Mathematica analysis of 2006-2007 MAX data for 44 states and the District of Columbia with representative FFS nursing home and ICF/IID data (excludes data from Arizona, Indiana, Maine, Minnesota, New Hampshire, and Utah). NOTE: New spells are spells beginning on or after July 1, 2006. Spells are censored at December 31, 2007. | |
Most ICF/IID residents with nursing home spells lived in the nursing home prior to being admitted to the ICF/IID. Of the 994 enrollees in ICFs/IID who had multiple spells of institutional care, 872 moved from nursing homes to ICFs/IID, while 122 moved from ICFs/IID to nursing homes. Many of these enrollees appear to have been transferred directly: 59 percent of enrollees moving from a nursing home to an ICF/IID did so within one day, and similarly for 47 percent of enrollees moving from ICFs/IID to nursing homes. The gap between spells was less than 60 days for the vast majority of enrollees with spells of both types of institutional care. Given that ICF/IID residents who also have spells of nursing home care tend to be older (Table III.2), it is possible that ICF/IID-to-nursing home transitions occurred for enrollees with ID/DD who required more frequent or intensive nursing care as they grew older. Although it is unclear why a much larger number of enrollees transitioned in the opposite direction, some might have been admitted to nursing homes either while waiting for an ICF/IID bed to become available or to receive post-acute care within our observation period.
Several states -- including California, Florida, Illinois, Mississippi, Nebraska, Oklahoma, South Carolina, and Virginia -- had especially high percentages of nursing home spells following ICF/IID spells within two months.28 Among these states, there was no net change in the number of ICF/IID facilities from 2006 to 2007, although California and Illinois both closed larger facilities during this time. During the same period, Mississippi and South Carolina both closed smaller ICFs/IID, and Oklahoma actually added ICFs/IID. Consequently, it is possible that the closure of ICFs/IID in some states partially explained the use of nursing facilities by persons with ID/DD. It is also possible that downsizing among ICFs/IID that continued to operate further contributed to transitions, particularly of frail or elderly enrollees, from ICFs/IID to nursing homes.
3. Did Enrollees Receiving ICF/IID Care Also Use HCBS?
A large number of enrollees admitted to ICFs/IID used HCBS either before entering the ICF/IID or after returning to the community. More than 40 percent of all enrollees with ICF/IID spellsbeginning in 2007 used HCBS at some point, and 54 percent of those enrollees with shorter stays (beginning and ending in the first half of 2007) used HCBS in the previous year (Table III.7). Similarly, 53 percent of enrollees with shorter stays beginning and ending in the latter half of 2006 used HCBS at some point in 2007.29
| TABLE III.7. HCBS Use Among Aged or Disabled Enrollees with New ICF/IID Spells Between July 2006 and December 2007 | |
|---|---|
| HCBS Use Relative to First New Spell of Institutional Care | Percentage |
| First new spells beginning in 2007 preceded by HCBS use in 2006 | 42.4 |
| First new spells beginning in 2007 and ending on or before June 30, 2007, preceded by HCBS use in 2006 | 54.0 |
| First new spells ending in 2006 followed by HCBS use in 2007 | 52.7 |
| SOURCE: Mathematica analysis of 2006-2007 MAX data for 37 states and the District of Columbia with representative FFS nursing home and ICF/IID data and valid HCBS data (excludes data from Arizona, Indiana, Maine, Massachusetts, Michigan, Minnesota, Montana, New Hampshire, Oregon, Pennsylvania, Rhode Island, Texas, and Utah). NOTES: New spells are spells beginning on or after July 1, 2006. HCBS includes 1915(c) waiver services, personal care services, residential care services, home health, adult day services, and private duty nursing services. Spells are censored at December 31, 2007. New spells beginning in 2007 preceded by HCBS use in 2006 refers to all spells beginning and ending at any time in 2007 (including spells censored as of December 31, 2007) that were associated with an enrollee who used HCBS at any time in 2006; the percentage is taken with respect to all first new spells beginning and ending (possibly censored) in 2007. The percentage of first new spells beginning in 2007 and ending on or before June 30, 2007, preceded by HCBS use in 2006 and the percentage of first new spells ending in 2006 followed by HCBS use in 2007 are defined analogously. State-level detail is provided in Appendix Table D.6. | |
Thus, despite the higher percentage of long-term stays in ICFs/IID, as compared with nursing homes (Figure II.1 and Figure III.1), substantially higher percentages of ICF/IID residents used HCBS before or following their stays (Table II.7 and Table III.7). It was common for a person with ID/DD in the study sample to use both HCBS and ICF/IID services, rather than only ICF/IID services. It is unknown whether this reflects: (1) changing levels of need for persons with ID/DD -- whereby the same individual uses either HCBS or ICF/IID services depending on his or her needs at a point in time; (2) a trial-and-error approach to identifying the most appropriate care setting for the individual; (3) ICF/IID closings; or (4) ICFs/IID -- specifically state institutions -- serving as crisis/emergency placement sites for individuals already being served either via HCBS or in another ICF/IID, or for people entering the Medicaid system in a crisis/emergency circumstance who are awaiting an alternative placement as soon as such a placement can be arranged.
The aggregate statistics on HCBS use before or after stays mask substantial variation across states. Considering shorter ICF/IID spells that began and ended during the first half of 2007,all had been preceded by HCBS use in 2006 in six states, whereas none of these spells was preceded by HCBS use in 12 other states.30 Similarly, 100 percent of shorter spells beginning and ending in the latter half of 2006 were followed by HCBS use in 2007 in five states, whereas no such spells were followed by HCBS use in another 12 states. Some HCBS use following ICF/IID stays was likely tied to the closure of a facility. For example, Iowa and Wisconsin both closed at least one-fifth of their ICFs/IID between 2006 and 2007. In these states, rates of 2007 HCBS use following shorter spells in the second half of 2006 were 100 percent, and 89 percent, respectively. However, other states that expanded their ICF/IID capacity during this period, such as Kansas and Kentucky, also had high rates of HCBS use following institutional stays.
C. Associations Between Lengths of Stay in Intermediate Care Facilities for People with Intellectual Disabilities and State Policy-Related Variables
To understand how policy may be related to ICF/IID use, we assessed the associations between the length of enrollees' ICF/IID stays and policy-related measures. Although these associations may be informative to policymakers seeking to improve ICF/IID services and LTSS more generally for the ID/DD population, it is not possible to determine causal relationships from the data presented here.
In general, we found little relationship between the percentage of ICF/IID stays lasting less than three months and state policy variables such as the percentage of Medicaid LTC expenditures allocated to HCBS or the percentage of Medicaid LTC recipients using HCBS (Figures III.2-5), regardless of whether outlier states were included in the analysis. Similarly, there was no obvious association between the prevalence of very short ICF/IID stays and several structural variables, including the percentage of ICFs/IID with more than 15 beds in 2007 (Figure III.6) or the change in the number of ICFs/IID with more than 15 beds from 2006 to 2007 (not shown). However, there was a negative relationship between the percentage of ICF/IID stays that were very short and the percentage change from 2006 to 2007 in the number of ICFs/IID in a state, with a 10 percentage point decrease in the number of ICFs/IID in a state corresponding to a 5.2 percentage point increase in the percentage of stays that lasted less than three months (Figure III.7).31
| FIGURE III.2. The Relationship Between the Percentage of Medicaid LTC Expenditures Allocated to HCBS and the Length of ICF/IID Spells |
|---|
 |
| SOURCE: MAX, 2006-2007. NOTES: The relationship between the two variables was not statistically significant. |
| FIGURE III.3. The Relationship Between the Percentage of Medicaid LTC Users' Total Medicaid Expenditures Accounted for by HCBS Users and the Length of ICF/IID Spells |
|---|
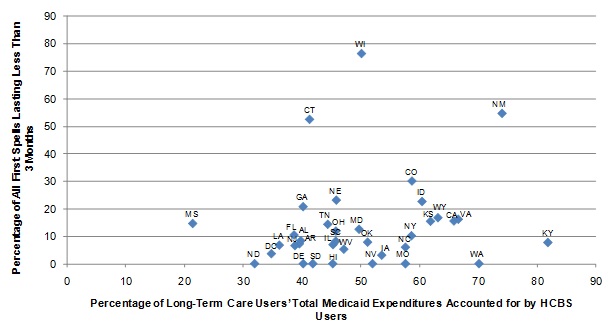 |
| SOURCE: MAX, 2006-2007. NOTES: The relationship between the two variables was not statistically significant. |
| FIGURE III.4. The Relationship Between the Percentage of Medicaid LTC Recipients Using HCBS and the Length of ICF/IID Spells |
|---|
 |
| SOURCE: MAX, 2006-2007. NOTES: The relationship between the two variables was not statistically significant. |
| FIGURE III.5. The Relationship Between the Percentage of Potential Medicaid LTC Recipients Using HCBS and the Length of ICF/IID Spells |
|---|
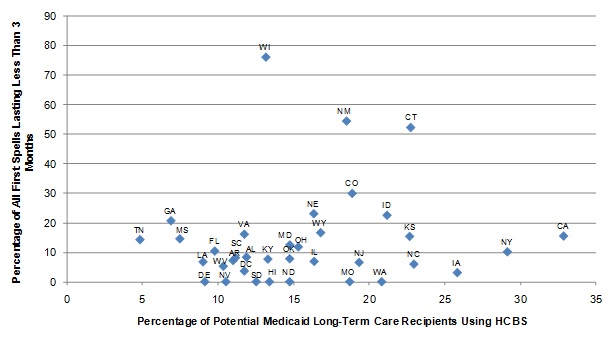 |
| SOURCE: MAX, 2006-2007. NOTES: The relationship between the two variables was not statistically significant. |
| FIGURE III.6. The Relationship Between the Percentage of ICFs/IID with More Than 15 Beds in 2007 and the Length of ICF/IID Spells |
|---|
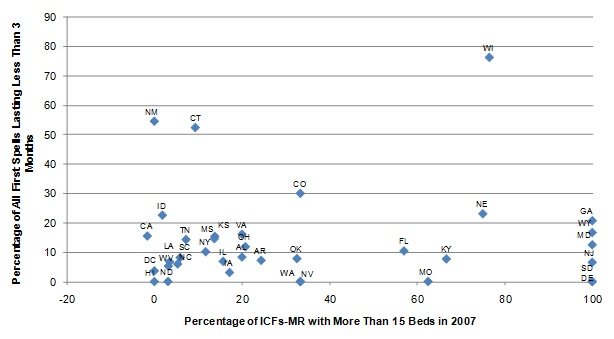 |
| SOURCE: MAX, 2006-2007. NOTES: The relationship between the two variables was not statistically significant. |
| FIGURE III.7. The Relationship Between the Percentage Change in the Number of ICFs/IID Between 2006 and 2007 and the Length of ICF/IID Spells |
|---|
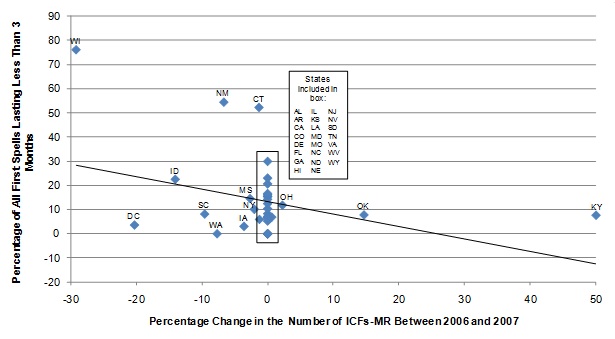 |
| SOURCE: MAX, 2006-2007; Lakin et al. (2008); Prouty et al. (2007). |
Because only a portion of elderly and people with disabilities who require LTC are part of the ID/DD population, we also examined the percentage of Medicaid LTC expenditures for enrollees with ID/DD only that were allocated to HCBS and continued to find no meaningful association with length-of-stay.
Assessing the relationship between policy-related variables and other lengths of stay (for example, the percentage of stays lasting more than one year)32 yielded similar results. Given the small population of ICF/IID users, most of whom are young or middle-aged adults who live in these facilities for very long periods of time,33 these results are not entirely surprising. To the extent that policy affects how individuals with an ICF/IID level of need receive their care, it is likely through the diversion of would-be residents to community-based services or smaller group homes.
D. Summary of ICF/IID Findings
Enrollees residing in ICFs/IID were generally younger adults who remained in residence for a year or longer. Among those who had shorter stays, it is likely that some of these resulted from either: (1) residents being transitioned to the community upon the closure of their facility; or (2) individuals entering the Medicaid system in certain states who are initially placed in state institutions (or other settings that receive people entering the residential service system) on a short-term basis while waiting for a placement in a more appropriate care setting to be arranged. The vast majority (89 percent) qualified for Medicaid even before they were admitted to the ICF/IID and those who qualified in advance generally retained the same MAS upon admission. This is not surprising since their disabilities are generally lifelong and often limit their ability to earn income.
More than 40 percent of enrollees living in ICFs/IID used HCBS before their ICF/IID stay, suggesting (as with nursing homes) that it is not uncommon for an individual to use both communityand institutional services rather than solely ICF/IID services. Although few enrollees had both ICF/IID and nursing home stays during the study period, most of those individuals moved from nursing homes to ICF/IIDs, rather than the other way around; these enrollees might have used nursing homes prior to their ICF/IID admission either for post-acute care or while waiting for an ICF/IID bed to become available.
There was little meaningful relationship between lengths of ICF/IID spells and state policy variables, although the percentage of stays lasting three months or less was lower in states that closed facilities during the study period.
IV. Policy Implications and Directions for Future Research
This study provided detailed information across 45 states and the District of Columbia on users of nursing home and ICF/IID care services in Medicaid FFS programs using 2006-2007 MAX data. Wenzlow et al. (2008) conducted a similar study using 2001-2002 data, but since that time states have accelerated their efforts to develop their HCBS programs. This study analyzed the characteristics of residents receiving care in nursing homes and specialized institutions for developmentally disabled adults (ICFs/IID). It also examined changes in the population of nursing home residents from 2001-2002 to 2006-2007.
A. Summary of Results and Policy Implications
Nursing Home Utilization. In recent years, the percentage of elderly and disabled Medicaid enrollees living in nursing homes has declined, a finding consistent with other recent studies (see, for example, Wiener et al. 2009). Although the reasons for this decline are not clear, states that have successfully begun to re-balance their LTC systems away from institutional care and toward HCBS would expect to experience such declines. In fact, we found that rates of nursing home utilization dropped in states that allocated a higher share of their Medicaid LTSS expenditures to HCBS, while rising in states allocating a lower share to HCBS. The positive relationship between HCBS investment and use and shorter nursing home stays also suggests that continued expansion of HCBS might be a contributing factor in lowering rates of institutionalization, although many other factors not measured here are also undoubtedly involved.
The Population of ICF/IID Residents. New ICF/IID placements during our study period were relatively uncommon, reflecting the long lengths of stay of the typical ICF/IID resident, the well-established movement from placing developmentally disabled individuals in larger institutions toward greater reliance on community-oriented group homes and HCBS, and the smaller size of this population more generally. ICF/IID residents were generally younger or middle-aged adults, the vast majority of whom had low-incomes even prior to being admitted (unlike nursing home residents). Because of the diverse and complex needs of this unique population, ICF/IID residents and those at risk of being placed in an ICF/IID will continue to benefit from programs that are tailored to their individual circumstances. Because large state-run ICFs/IID and smaller community ICFs/IID represent significantly different care settings, additional research that explicitly considers utilization of services provided by these different types of ICF/IID is critical to fully understanding how low-income individuals with ID/DD are being served in different states, and how to serve them better.
Use of Both Institutional Care and HCBS. Sizable minorities of both nursing home and ICF/IID residents used HCBS prior to their Medicaid-financed stays, suggesting that different types of LTSS are being used for the same individuals at different times, determined possibly by their changing levels of need or trial-and-error efforts to find the most appropriate service setting. To the extent that a given Medicaid enrollee is likely to need both HCBS and institutional care at different times in his or her life, systems of care that have a "no wrong door" policy -- according to which individuals requiring LTSS have all options for services made available to them regardless of how they access the system -- hold the potential to ease transitions to and from the community (Lind et al. 2010).
Multiple Episodes of Care. Multiple episodes of institutional care (separated by at least two months of living somewhere other than in a nursing home or ICF/IID) were uncommon, suggesting limited cycling in and out of institutions by the same individuals. However, the small number of individuals who did experience multiple episodes of care likely represents an important population requiring complex services for whom a key challenge is providing appropriate care tailored to their specific functional and medical needs. Moreover, while uncommon among LTC users generally, multiple spells of care among enrollees who were admitted to ICFs/IID during the 18-month period over which we observed them were not unusual; many of these individuals used both nursing home and ICF/IID services, usually in that order.
Eligibility for Medicaid Benefits. Although approximately 30 percent of nursing home residents were not enrolled in Medicaid two months before the beginning of their Medicaid-financed stay, the vast majority of ICF/IID residents (nearly 90 percent) were previously enrolled, with nearly half qualifying for benefits via cash assistance. In contrast, most nursing home residents qualified for benefits via "other" criteria (including the 300 percent rule) during their stays. The large percentage of ICF/IID residents who qualified for Medicaid prior to their stay might not be particularly surprising, since many disabilities are lifelong and (in the absence of and sometimes even with support services) limit an individual's ability to earn income. That nursing home stays often precipitate enrollment in Medicaid reflects the high cost of nursing home services for individuals with modest incomes and assets who previously did not require institutional care.
B. Directions for Future Research
Because this study is fundamentally broad and descriptive, the findings presented here lend themselves to only tentative conclusions but suggest directions for future study. Analyses that use detailed person-level and claim-level data, including the information available through MAX, are especially likely to enhance our understanding of what types of individuals are likely to benefit most from which type of care (institutional or HCBS), and under what circumstances.
Exploring the Continuum of LTC. As noted in Chapter III, although we treat HCBS and institutional care as separate types of service in this analysis, sharp distinctions are not always so easily made in reality. For example, small group homes for individuals with ID/DD might be financed through HCBS but appear identical in most respects to small community ICFs/IID.34 For moderately functionally impaired individuals who require nursing care, assisted living arrangements available through HCBS and nursing home services might look very similar. Greater knowledge of the nature of HCBS and institutional services provided by states' Medicaid programs, and how these services are changing over time, could contribute to a more complete understanding of how states have re-balanced their LTC systems and how to effectively continue re-balancing in the future.
Examining Level of Need. Enrollees with different levels of impairment require different services: although individuals with only mild limitations or family caregivers might benefit especially from access to HCBS, others who are severely impaired are far more likely to require institutional care. In assessing both the effectiveness of expansions of HCBS and the characteristics of those who continue to receive institutional services, future research that accounts for differences in individual levels of need in comparing populations using HCBS with those using institutional care would be valuable.
Defining Recipients of Medicaid-Financed LTC. This analysis included nursing home residents with very short stays (less than three months), even though many of these are likely to be individuals who require post-acute or respite care, rather than LTC. Future studies could seek to identify and exclude post-acute care users based on diagnoses and the presence of Medicare-financed services (which would require merging MAX data with Medicare claims data) to obtain a clearer profile of nursing home residents with LTC needs.
Examining Changes Over Time. Although comparisons across states such as those presented here can be informative, differences among states -- such as the extent to which states have re-balanced their LTC systems -- complicate the interpretation of any findings. These cross-sectional comparisons could be usefully supplemented with a more extensive study of changes over time, which could control for relevant differences in populations and policies among states. As with other avenues for future inquiry, performing the analysis at the individual level would facilitate understanding of changes in state populations of nursing home and ICF/IID residents as the states move toward greater provision of services in the community. The MAX data could be used to study changes over time as long as careful attention were paid to changes in the data that, if not explicitly addressed, could invalidate longitudinal comparisons.
Analyzing Transitions Between Types of Care. This analysis showed that use of multiple types of service -- either both nursing home and ICF/IID care or both institutional care and HCBS -- is not uncommon but was unable to determine why it occurs. A closer examination of the characteristics and circumstances in which transitions between different types of service occur would help policymakers assess whether individuals requiring LTSS are able to receive needed care and services in an appropriate environment.
References
Centers for Medicare and Medicaid Services. "Medicare Coverage of Skilled Nursing Facility Care." Baltimore, MD: Centers for Medicare and Medicaid Services, 2007. Retrieved from http://www.medicare.gov/publications/pubs/pdf/10153.pdf on January 4, 2011.
Centers for Medicare and Medicaid Services. "Medicaid At-A-Glance 2005: A Medicaid Information Source." Baltimore, MD: Centers for Medicare and Medicaid Services, 2005. Retrieved from https://www.cms.gov/MedicaidGenInfo/Downloads/MedicaidAtAGlance2005.pdf on September 23, 2010.
Houser, Ari, Wendy Fox-Grage, and Mary Jo Gibson. "Across the States: Profiles of Long-Term Care and Independent Living." Washington, DC: AARP, 2009. Retrieved from http://assets.aarp.org/rgcenter/il/d19105_2008_ats_1.pdf on December 8, 2010.
Irvin, Carol V., and Jeffrey Ballou. "The Starting Point: The Balance of State Long-Term Care Systems Before the Implementation of the Money Follows the Person Demonstration." Cambridge, MA: Mathematica Policy Research, 2010.
Irvin, Carol, Debra Lipson, Sam Simon, Audra Wenzlow, and Jeffrey Ballou. "Money Follows the Person 2009 Annual Evaluation Report." Cambridge, MA: Mathematica Policy Research, 2010.
Kaiser Commission on Medicaid and the Uninsured. "Medicaid Financial Eligibility: Primary Pathways for the Elderly and People with Disabilities." Menlo Park, CA: Kaiser Family Foundation, 2010. Retrieved from http://www.kff.org/medicaid/upload/8048.pdf on September 24, 2010.
Kaye, H. Stephen, Charlene Harrington, and Mitchell P. LaPlante. "Long-Term Care: Who Gets It, Who Provides It, Who Pays, and How Much?" Health Affairs, vol. 29, no. 1, 2010, pp. 11-21. Retrieved from http://content.healthaffairs.org/content/29/1/11.full.pdf+html on January 4, 2011.
Kaye, H. Stephen, Mitchell P. LaPlante, and Charlene Harrington. "Do Noninstitutional Long-Term Care Services Reduce Medicaid Spending?" Health Affairs, vol. 28, no. 1, 2009, pp. 262-272. Retrieved from http://content.healthaffairs.org/cgi/reprint/28/1/262 on December 6, 2010.
Lakin, K. Charlie, Kathryn Alba, and Robert W. Prouty. "Utilization of and Expenditures for Medicaid Institutional and Home and Community Based Services." In Residential Services for Persons with Developmental Disabilities: Status and Trends Through 2006, edited by Robert W. Prouty, Gary Smith, and K. Charlie Lakin. Minneapolis, MN: University of Minnesota, Research and Training Center on Community Living, Institute on Community Integration, 2007. Retrieved from http://rtc.umn.edu/docs/risp2006.pdf on December 9, 2010.
Lakin, K. Charlie, and Margaret J. Hall. "Medicaid-Financed Residential Care for Persons with Mental Retardation." Health Care Financing Review, vol. 11, no. 2, 1990, pp. 149-160.
Lakin, K. Charlie, Sheryl Larson, Patricia Salmi, and Amanda Webster. "Residential Services for Persons with Developmental Disabilities: Status and Trends Through 2009." Minneapolis, MN: University of Minnesota, Research and Training Center on Community Living, Institute on Community Integration, 2010. Retrieved from http://rtc.umn.edu/docs/risp2009.pdf on January 4, 2011.
Lakin, K. Charlie, Sheryl Larson, Pat Salmi, and Naomi Scott. "Residential Services for Persons with Developmental Disabilities: Status and Trends Through 2008." Minneapolis, MN: University of Minnesota, Research and Training Center on Community Living, Institute on Community Integration, 2009. Retrieved from http://rtc.umn.edu/docs/risp2008.pdf on December 9, 2010.
Lakin, K. Charlie, Naomi Scott, Kathryn Alba, and Robert W. Prouty. "Utilization and Expenditures for Medicaid Institutional and Home and Community Based Services." In Residential Services for Persons with Developmental Disabilities: Status and Trends Through 2007, edited by Robert W. Prouty, Kathryn Alba, and K. Charlie Lakin. Minneapolis, MN: University of Minnesota, Research and Training Center on Community Living, Institute on Community Integration, 2008. Retrieved from http://rtc.umn.edu/docs/risp2007.pdf on December 8, 2010.
Li, Yue. "Provision of Mental Health Services in U.S. Nursing Homes, 1995-2004." Psychiatric Services, vol. 61, no. 4, 2010, pp. 349-355.
Lind, Alice, Suzanne Gore, and Stephen A. Somers. "Profiles of State Innovation: Roadmap for Rebalancing Long-Term Supports and Services." Hamilton, NJ: Center for Health Care Strategies, 2010. Retrieved from http://www.chcs.org/usr_doc/Rebalancing_Roadmap_112210.pdf on December 21, 2010.
Lueck, Sarah. "Mississippi's Face-to-Face' Rule Blocks Coverage of Eligible People, Not Fraud." Washington, DC: Center on Budget and Policy Priorities, 2009. Retrieved from http://www.cbpp.org/files/3-25-09health.pdf on December 10, 2010.
Molinari, Victor, David Chiriboga, Laurence G. Branch, Soyeon Cho, Kristen Turner, Jing Guo, and Kathryn Hyer. "Provision of Psychopharmacological Services in Nursing Homes." Journals of Gerontology: Series B, vol. 65B, no. 1, 2009, pp. 57-60.
Ng, Terence, and Charlene Harrington. "Medicaid Home and Community-Based Service Programs: Data Update." Menlo Park, CA: Kaiser Family Foundation, 2009. Retrieved from http://www.kff.org/medicaid/upload/7720-03.pdf on December 23, 2010.
O'Connor, Darlene, Linda Long, Emma Quach, Laurie Burgess, and Ellie Shea-Delaney. "Diversion and Transition Services in the U.S.: Promising Practices and Options for the Future." Worcester, MA: Center for Health Policy and Research, University of Massachusetts Medical School, 2006. Retrieved from http://www.hcbs.org/files/84/4184/DiversionInventory_NationalReport.pdf on January 4, 2011.
Prouty, Robert W., Kathryn Alba, and K. Charlie Lakin. "Background and Summary of Medicaid Long-Term Care Programs." In Residential Services for Persons with Developmental Disabilities: Status and Trends Through 2007, edited by Robert W. Prouty, Kathryn Alba, and K. Charlie Lakin. Minneapolis, MN: University of Minnesota, Research and Training Center on Community Living, Institute on Community Integration, 2008. Retrieved from http://rtc.umn.edu/docs/risp2007.pdf on December 8, 2010.
Schneider, Andy, Risa Elias, Rachel Garfield, David Rousseau, and Victoria Wachino. "The Medicaid Resource Book." Washington, DC: Kaiser Commission on Medicaid and the Uninsured, 2002.
Western Interstate Commission for Higher Education Mental Health Program. "Alaskans At Risk of Out-of-State Placement Due to Complex Behavior Management Needs." Boulder, CO: Western Interstate Commission for Higher Education, 2009. Retrieved from http://www.hss.state.ak.us/dsds/pdfs/Issue_Analysis_and_Options_Brief_-_... on December 9, 2010.
Wiener, Joshua M., Wayne L. Anderson, and David Brown. "Why Are Nursing Home Utilization Rates Declining?" Research Triangle Park, NC: RTI International, 2009. Retrieved from http://www.hcbs.org/files/160/7990/SCGNursing.pdf on December 8, 2010.
Wenzlow, Audra T., Rosemary Borck, and Dean Miller. "An Investigation of Interstate Variation in Medicaid Long-Term Care Use and Expenditures." Draft report. Ann Arbor, MI: Mathematica Policy Research, 2011.
Wenzlow, Audra T., Robert Schmitz, and Jill Gurvey. "Volume II: Medicaid-Financed Nursing Home Services: Characteristics of People Served and Their Patterns of Care, 2001-2002." Cambridge, MA: Mathematica Policy Research, 2008. Retrieved from http://www.mathematica-mpr.com/publications/PDFs/medicaidfinanced.pdf on December 8, 2010.
Notes
-
Olmstead v. L.C. 527 U.S. 581 (1999).
-
Consequently, references in this report to "residents" or "recipients" of institutional care indicate only those institutionalized individuals enrolled in Medicaid.
-
Because our data were censored at the end of 2007, however, we limited the analysis to only those spells beginning in the latter half of 2006 when analyzing the length-of-spells. Details are in Appendix B.
-
Our sample was restricted to individuals enrolled in Medicaid at some point between June 1, 2006, and December 31, 2007, and living in non-excluded states (Arizona, Indiana, Maine, Minnesota, New Hampshire, and Utah). Enrollees with new spells of care included those using Medicaid-financed nursing home services for the first time, as well as those who had previously resided in a nursing home but had more recently been hospitalized or living in the community.
-
Approximately 67 percent of stays in Alaska and 53 percent of stays in Oregon lasted less than three months, compared with 47 percent for all states together (see Appendix Table D.1).
-
In addition to the six states excluded from the analysis of 2006-2007 data, three other states -- Hawaii, Michigan, and Tennessee -- and the District of Columbia were excluded from the earlier study based on 2001-2002 data (Wenzlow et al. 2008).
-
The high-HCBS states were Alaska, Arkansas, California, Colorado, Idaho, Illinois, Kansas, Massachusetts, Missouri, Montana, Nevada, New Mexico, New York, North Carolina, Oklahoma, Oregon, Texas, Vermont, Virginia, Washington, West Virginia, and Wyoming. All other states analyzed in this report were low-HCBS states.
-
Full definitions of the cash assistance-related, medically needy, poverty-related, Section 1115 demonstration waiver-related,and "other" criteria are in Appendix A.
-
The "other" category also includes those covered under more restrictive requirements than SSI standards in Section 209(b) states; three of the remaining four states with "other" as the plurality MAS category were Section 209(b) states.
-
Over three-fifths of the individuals (2,737 out of 4,481) who qualified for benefits through a Section 1115 demonstration waiver were enrolled in Wisconsin's Badger Care initiative two months prior to admission, but only 57 remained enrolled under Section 1115 criteria at the beginning of the Medicaid-financed spell, with the vast majority of the others qualifying under "other" criteria such as the 300 percent rule.
-
Because the study period ended on December 31, 2007, all spells that were active on that date were censored. To obtain more meaningful statistics regarding length-of-stay, for this portion of the analysis we followed Wenzlow et al. (2008) and considered only spells beginning in the last six months of 2006 to ensure that each spell could potentially last at least one year. (Otherwise, spells beginning, for example, in October 2007 would appear to represent short stays because they would be censored at the end of the year, yielding an incorrectly high number of shorter stays as a percentage of all stays.) We likewise limited the analysis to spells beginning in the latter half of 2006 when analyzing (below) the associations between length-of-stay and state policy variables.
-
Although a detailed analysis of the relationship between use of HCBS and nursing home services by the same individual was beyond the scope of this report, the person-level and claims-level data available through MAX are well suited for pursuing such an analysis in the future.
-
The number of elderly or disabled individuals in each state was estimated using the American Community Survey (ACS). See Wenzlow et al. (2011).
-
These associations were statistically significant at the 5 percent level or better.
-
Although many states characterized as "high-HCBS" states by Kaye et al. (2009) -- including Alaska, California, Colorado, Kansas, New Mexico, Vermont, and Washington -- tended to have higher values of all four re-balancing variables, and conversely for "low-HCBS" states, a small handful were clear outliers. For example, Alaska devoted nearly three-quarters of its Medicaid long-term care spending to HCBS, compared with approximately 40 percent for all states (Figure II.2). The positive associations between length-of-stay and the re-balancing variables remained positive when outlier states were excluded, but the strength of the associations was generally weaker than in Table II.8 (see Appendix Table D.3).
-
Data are available upon request.
-
Data are available upon request.
-
Populations in large private ICFs/IID are similarly decreasing. Between June 1997 and June 2009, their populations declined from 28,200 people to 18,400.
-
The population living in ICFs/IID serving 4-6 residents decreased about 7 percent from 21,500 in 1997 to 20,100 in 2009; the number of individuals in ICFs/IID serving 7-9 residents decreased by about 18 percent from 23,650 to 19,400 over the same period. (In the meantime, the number of HCBS recipients has grown from 223,200 to 562,000.)
-
For example, Indiana and Louisiana had comparable numbers of ICFs/IID in 2007 (533 and 513, respectively), but Louisiana had 18 large facilities (16 beds or more) whereas Indiana had only six (Lakin et al. 2008).
-
This was partly due to Oregon's extensive use of managed care, which limited the number of enrollees observed in our sample of FFS data.
-
It is not clear why the percentage of spells that were new was higher in these states, although the relatively small base of continuing spells was a contributing factor. (A new spell in a state with few previously existing spells will constitute a higher percentage of the total.) None of these states opened new facilities in either 2006 or 2007 (Lakin et al. 2009; Lakin et al. 2008; Lakin et al. 2007). However, these states' state institutions tend to serve emergency placements or placements of last resort, which could explain the higher percentage of new spells.
-
"Other" criteria include qualifying under the 300 percent rule, which allows individuals with income up to 300 percent of the SSI threshold to qualify for Medicaid assistance for institutional care. Medically needy provisions (a state option) allow individuals with higher incomes to qualify for Medicaid by deducting incurred medical expenses from their income and/or assets to determine financial eligibility. Poverty-related expansions enacted since 1998 allow states to, for example, elect to extend full Medicaid benefits to otherwise ineligible aged and disabled people up to 100 percent of the federal poverty level. More detailed definitions of the cash assistance-related, medically needy, poverty-related, Section 1115 demonstration-related,and "other" criteria are in Appendix A.
-
ICFs/IID can be used to provide respite care, which could also explain some shorter stays, but respite care is covered through HCBS waivers and does not include room and board, which the individual must finance with non-Medicaid sources of payment (Prouty et al. 2008). We believe it is more likely that some of the implausibly short ICF/IID stays reflected coding errors in the data.(For example, the relatively high percentage of ICF/IID stays lasting three months or less in Connecticut was the result of 20 one-day spells at a single facility.)
-
For individuals with ID/DD who have more limited medical needs, nursing services are available through Medicaid in ICFs/IID (both larger and community facilities) and community settings.
-
There is a larger literature on the similar question of to what extent persons with chronic mental illness have been treated in nursing homes and whether nursing homes are adequately equipped to provide appropriate treatment for people with mental illness (Molinari et al. 2009; Li 2010).
-
It is possible that the ICF/IID populations in some of these states might be older than those in other states and therefore at higher risk of requiring skilled nursing care on a regular basis.
-
Because most ICF/IID stays are very long, the population of individuals with new spells of ICF/IID care followed by HCBS use in our 18-month study period is unlikely to be representative of the population of all ICF/IID residents unless these shorter stays can be attributed primarily to ICF/IID closings and would have otherwise been long-stays had the facility remained open.
-
This relationship was largely driven by the data from Wisconsin, which closed eight large facilities during this time period (Lakin et al. 2008; Lakin et al. 2007); if Wisconsin is removed from the data, the association becomes insignificantly different from zero. Although the data are presented as a scatter plot with a regression line to facilitate comparisons to other figures, the large number of states with no change in the number of ICFs/IID from 2006 to 2007 suggests that a categorical data analysis is more appropriate than linear regression; applying this alternative approach resulted in similar findings.
-
Data are available upon request.
-
The measured median length-of-stay for ICF/IID spells in this analysis was 425 days, which is longer than the 12-month look-ahead period that we preserved when limiting the analysis to spells beginning in the second half of 2006; hence, the true median length-of-stay is some number greater than 425 days.
-
There are almost twice as many people living in agency-managed residential settings financed by HCBS than are living in ICFs/IID.
-
Now known as ICFs/IID.
-
Within a single benefit period, Medicare provides up to 100 days of such coverage. A benefit period begins upon admission to an inpatient hospital or skilled nursing facility, and ends 60 days after the date on which inpatient hospital or skilled nursing care was last used. In practice, Medicare usually reimburses less than 100 days of skilled nursing care for qualifying individuals.
-
Services covered under managed care (including any for LTC) generally cannot be identified in MAX as they are reported in "encounter records," which are known to be incomplete in MSIS and MAX.
-
Although admission dates provide additional information about institutional services that might not be captured in other MAX variables, not all states and facilities include admission dates on their claims records, and this information only reflects services used in the facility in which the person resided at the time the claim was paid.
Appendices
Appendix A. Glossary of Terms
This glossary summarizes the operational definitions of terms used in this report. For more general definitions of Medicaid terms, see Schneider et al. (2002).
Admission: Date at which an individual was reported to have been admitted to the institution for which a Medicaid claim has been paid. Admission may occur before the beginning of a Medicaid-financed institutional spell if a person entered the facility with a separate source of payment -- for example, Medicare or private insurance -- before Medicaid began covering services.
Adult (BOE Group): A BOE group that includes pregnant women and caretaker relatives in families with dependent children. (Adults who are eligible for Medicaid due to disability are coded as disabled.)
Age: Age is defined as the enrollee's age at the beginning of his or her first new Medicaid-covered institutional spell between July 1, 2006, and December 31, 2007.
Aged (BOE Group): A BOE group that includes enrollees age 65 or older who qualified for Medicaid due to their age.Because some states code all people over 65 as aged, enrollees who were older than 65 but were categorized in another BOE group in MAX were recorded as aged for this study.
Basis of Eligibility (BOE): Eligibility grouping that traditionally has been used by CMS to classify enrollees as children, adults, aged, or disabled.
Cash Assistance-Related (MAS Group): A MAS group that includes persons receiving SSI benefits or mandatory state supplements and those who would have qualified under the pre-welfare reform Aid to Families with Dependent Children rule. Among aged and disabled enrollees, the cash assistance-related MAS group consists of people satisfying the first, SSI-related requirement.
Child (BOE Group): A BOE group that includes persons under age 18 or under age 21 in states electing to cover older children. (Children who are eligible for Medicaid due to disability are coded as disabled.)
Disabled (BOE Group): A BOE group that includes persons of any age (including children) who are unable to engage in substantial gainful activity by reason of any medically determinable physical or mental impairment that can be expected to result in death or that has lasted or can be expected to last for a continuous period of at least 12 months. Because disabled people over 65 are often but not always categorized as aged, all disabled people over 65 were recoded as aged in this study.
Dual-Eligibles: Persons dually enrolled in Medicare and Medicaid. In MAX, dual-eligibles are identified as people in the Medicaid Statistical Information System (MSIS) with matching records in the Medicare Enrollment Database, indicating enrollment in both Medicare and Medicaid in at least one month during the study period.
Fee-For-Service (FFS): A payment mechanism in which payment is made for each utilized service and does not include services provided under capitated arrangements.
Home and Community-Based Services (HCBS): Services covered under Section 1915(c) waivers and personal care, residential care, home health care, adult day care, and private duty nursing services that are mandatory or are provided at state option. Because unduplicated measures of HCBS waiver use and service-specific use are not available in the MAX PS files, this analysis identified HCBS recipients as those who were either enrolled in an HCBS waiver or used one or more of the following state plan community-based services: personal care, residential care, home health care, adult day care, and private duty nursing.
Intermediate Care Facility for Individuals with Intellectual Disabilities (ICF/IID): Medicaid-financed facilities for the care of ID/DD. These institutions are an optional Medicaid benefit that states may choose to offer; they are required to have four or more beds and offer treatment or rehabilitative services to people with ID/DD.
Maintenance Assistance Status (MAS): Eligibility grouping traditionally used by CMS to classify enrollees by the financial-related criteria by which they are eligible for Medicaid. MAS groups include cash assistance-related, medically needy, poverty-related, 1115 demonstration waiver, and other.
Managed Care: Payment mechanism used to manage health care, including services provided by health maintenance organizations or PACE, prepaid health plans, and primary care case management plans. Services provided under managed care plans are not included in the measures summarized in this report.
Medically Needy (MAS Group): An MAS group that includes persons qualifying for Medicaid through the medically needy provision (a state option) that enables states to cover persons with higher incomes who may have significant medical expenses. Persons with income above the medically needy threshold can deduct incurred medical expenses from their income and/or assets -- or "spend down" their income/assets -- to determine financial eligibility.
Other (MAS Group): An MAS group that comprises a mixture of mandatory and optional coverage groups not reported under the other MAS categories, including many institutionalized aged and disabled people qualifying under the "300 percent rule," which allows individuals with income up to 300 percent of the SSI threshold to qualify for Medicaid assistance for institutional care; those qualifying through HCBS waivers; individuals ineligible for SSI due only to their Social Security Disability Insurance benefits; and those covered under more restrictive requirements than SSI standards in Section 209(b) states. This MAS group also includes many other groups, such as children receiving Title IV-E foster care payments or adoption assistance and caretaker relatives.
Poverty-Related (MAS Group): An MAS group that consists of persons qualifying through any poverty-related Medicaid expansions enacted from 1988 on. For example, states can elect to extend full Medicaid benefits to otherwise ineligible aged and disabled people up to 100 percent of the federal poverty level. In addition, this group includes people qualifying only as Qualified Medicare Beneficiaries, Specified Low-Income Medicare Beneficiaries, or Qualified Individuals.
Program of All-Inclusive Care for the Elderly (PACE): A managed care plan that coordinates both acute care and LTC for eligible enrollees (those who are 55 and older, living in a PACE area, and otherwise eligible for nursing home care). A capitated payment mechanism is used for PACE plan enrollees. As a result, service-specific information is not available for services provided under PACE or other managed plans.
Restricted-Benefit Enrollees: Enrollees who receive limited Medicaid coverage, including unqualified aliens only eligible for emergency hospital benefits, Qualified Medicare Beneficiaries, and people eligible for only family planning services. Some enrollees may be eligible for a restricted set of services but are coded as full-benefit enrollees -- for example, those eligible for only prescription drug coverage and Medicare cost-sharing.
Section 1115 Demonstration Waiver (MAS Group): An MAS group that consists of people eligible for Medicaid via a state 1115 waiver program. The Secretary of Health and Human Services may authorize 1115 demonstrations to permit states to test innovative approaches to providing health services to low-income residents, including extending benefits to certain otherwise ineligible persons. Some states provide only pharmacy benefits or other limited services to 1115 enrollees, although a few states provide full Medicaid benefits to persons qualifying through 1115 provisions. Many 1115 waivers also have other provisions such as mandatory managed care coverage but the 1115 eligibility category only relates to eligibility extensions. Aged or disabled persons in the 1115 group typically qualify under poverty-related expansions.
Section 209(b) State: A state that elected to use more restrictive eligibility requirements than those of the SSI program, but these requirements cannot be more restrictive than those in place in the state's Medicaid plan as of January 1, 1972. Section 209(b) states include Connecticut, Hawaii, Illinois, Indiana, Minnesota, Missouri, New Hampshire, North Dakota, Ohio, Oklahoma, and Virginia.
Spell: A period during which a person received Medicaid-covered nursing home or ICF/IID services. Because MAX data were available only through December 31, 2007, at the time of this study, all spells are censored on that date.
Appendix B. Data and Methods
The 2006 and 2007 MAX Person Summary (PS) and Long-Term Care (LT) files were the primary data sources for this study. In this chapter, we summarize these data and describe the construction of institutional spells. We then describe the construction of the analytic file and conclude with a discussion of the strengths and limitations of the MAX data for assessing patterns of institutional use.
CMS produces the MAX data from the MSIS, to which states submit enrollee eligibility and claims data on a quarterly basis. MAX is an extract of MSIS designed for research use. Each year of MAX data consists of a person-level summary file -- containing data on enrollees' eligibility, demographic characteristics, and a summary of claims -- and claims files that include detailed data on claims for services used during the calendar year.
Appendix C. State Nursing Home and ICF/IID Anomalies
The MAX data contain a variety of anomalies, many of which are specific to individual states. The anomalies most likely to affect analyses of nursing home or ICF/IID care are listed below, by state. A full list of anomalies is available from the CMS website at https://www.cms.gov/MedicaidDataSourcesGenInfo/07_MAXGeneralInformation.asp. Unless otherwise indicated, all anomalies and notes below relate to 2007 MAX data.
As a result of these anomalies, six states were excluded from all analyses: Indiana, Maine, and Utah, because complete 2007 data were not available for these states; Arizona, because it provides most long-term services via managed care arrangements, whereas this study analyzes services provided on a FFS basis; Minnesota, because the state was transitioning many of its enrollees using long-term care to managed care during the study period; and New Hampshire, because its expenditure data for HCBS relative to institutional long-term care varied substantially from corresponding CMS Form 64 data in 2007.
Analyses of the association between median length-of-stay and state policy variables omitted seven other states because the quality of their HCBS data was believed to be unreliable: Massachusetts, Michigan, Montana, Oregon, Pennsylvania, Rhode Island, and Texas.
-
All States. (1) Service tracking claims: expenditures reported as service tracking claims are not included in MAX as they cannot be attributed to specific persons for specific services. (2) Day count: the states use a variety of time periods for billing long-term care services ranging from weekly to monthly and sometimes reflecting the actual time period with covered days. This means that the number of covered days per claim varies between and within states.
-
Alabama. No relevant anomalies or notes.
-
Alaska. (1) The average Medicaid payment amount for nursing facility claims is about two times higher than the national average, but is consistent across years. (2) Relatively few Medicaid enrollees have nursing facility claims because Alaska has a small elderly population and active HCBS waiver program. It also has a state-operated Pioneers Home System, not included in Medicaid, which provides services for many people who otherwise might be covered by Medicaid.
-
Arizona. Most people are enrolled in managed care and more than half the other Medicaid enrollees are in the Indian Health Service, so FFS distributions are unusual; the state was excluded for this reason.
-
Arkansas. No relevant anomalies or notes.
-
California. No relevant anomalies or notes.
-
Colorado. There was a large increase in FFS crossover claims in 2007.
-
Connecticut. No relevant anomalies or notes.
-
Delaware. No relevant anomalies or notes.
-
District of Columbia. No relevant anomalies or notes.
-
Florida. Admission date and patient status are missing on most claims.
-
Georgia. (1) Very few claims have leave days in 2006 even though Georgia covers leave days in several circumstances. (2) Institutional care expenditures as reported in the MAX data and on CMS Form 64 differed substantially (a variance of at least 33 percent in 2007).
-
Hawaii. The percentage of claims reporting leave days is below the expected range.
-
Idaho. No relevant anomalies or notes.
-
Illinois. Patient status is missing on all claims.
-
Indiana. The Indiana MAX file for 2007 was not complete as of the time of this writing; the state was excluded for this reason.
-
Iowa. No relevant anomalies or notes.
-
Kansas. If the state does not pay for all the covered days submitted by the provider on a claim, the covered days field is not corrected, only the payment amount.
-
Kentucky. No relevant anomalies or notes.
-
Louisiana. The admission date is missing on most records in 2006.
-
Maine. Maine has been unable to accurately report its inpatient, long-term care, or other claims as it does not have a functioning Medicaid Management Information System; the state was excluded for this reason.
-
Maryland. Maryland does not report leave days even though it covers leave days under some circumstances.
-
Massachusetts. (1) There was an increase of approximately 80 percent in the total number of crossover claims from 2006. (2) No leave days are reported although Massachusetts covers up to 35 leave days per year. (3) Massachusetts' HCBS data were believed to be unreliable (see Wenzlow et al. 2011 for details); the state was excluded from analyses of state policy variables for this reason.
-
Michigan. Michigan's HCBS data were believed to be unreliable (see Wenzlow et al. 2011 for details); the state was excluded from analyses of state policy variables for this reason.
-
Minnesota. (1) The ICF/IID covered days are missing on many ICF/IID claims in 2006. (2) Minnesota was transitioning many of its enrollees using long-term care to managed care during the 2006-2007 period; the state was excluded for this reason.
-
Mississippi. No relevant anomalies or notes.
-
Missouri. The admission date is not reported.
-
Montana. (1) Patient status is not available on most claims. (2) Montana's HCBS data were believed to be unreliable (see Wenzlow et al. 2011 for details); the state was excluded from analyses of state policy variables for this reason.
-
Nebraska. No relevant anomalies or notes.
-
Nevada. There were only a few claims with leave days reported in 2006 even though Nevada covers up to 24 leave days per year.
-
New Hampshire. (1) Many 2006 claims could not be properly adjusted because of how adjustment claims were submitted to MSIS. There are likely to be duplicates because only the original and replacement claims were reported and the voids were not included. Days are repeated on every claim, overstating covered days. (2) New Hampshire's expenditure data for HCBS relative to institutional long-term care varied substantially from corresponding CMS Form 64 data in 2007; the state was excluded for this reason.
-
New Jersey. No relevant anomalies or notes.
-
New Mexico. No relevant anomalies or notes.
-
New York. The admission date is missing on most claims.
-
North Carolina. No relevant anomalies or notes.
-
North Dakota. No relevant anomalies or notes.
-
Ohio. The admission date and patient status are missing on most claims.
-
Oklahoma. No relevant anomalies or notes.
-
Oregon. (1) The admission date is not reported. (2) Oregon's HCBS data were believed to be unreliable (see Wenzlow et al. 2011 for details); the state was excluded from analyses of state policy variables for this reason.
-
Pennsylvania. Pennsylvania's HCBS data were believed to be unreliable (see Wenzlow et al. 2011 for details); the state was excluded from analyses of state policy variables for this reason.
-
Rhode Island. (1) Rhode Island does not specify coverage of leave days in its state plan and no leave days are reported. (2) Institutional care expenditures as reported in the MAX data and on CMS Form 64 differed substantially (a variance of at least 33 percent in 2007). (3) Rhode Island's HCBS data were believed to be unreliable (see Wenzlow et al. 2011 for details); the state was excluded from analyses of state policy variables for this reason.
-
South Carolina. (1) The admission date and patient status are missing on most claims. (2) South Carolina does not report leave days on claims, although it covers leave days in many situations.
-
South Dakota. No relevant anomalies or notes.
-
Tennessee. Institutional care expenditures as reported in the MAX data and on CMS Form 64 differed substantially (a variance of at least 33 percent in 2007).
-
Texas. (1) The admission date and patient status are missing on most claims. (2) Leave days: leave days are not reported. (3) Texas' HCBS data were believed to be unreliable (see Wenzlow et al. 2011 for details); the state was excluded from analyses of state policy variables for this reason.
-
Utah. (1) The Utah MAX file for 2007 was not created as of the time of this writing because the state had not submitted acceptable eligibility files; the state was excluded for this reason. (2) The admission date and patient status are missing on most institutional claims in 2006.
-
Vermont. Very few leave days are reported.
-
Virginia. No relevant anomalies or notes.
-
Washington. No relevant anomalies or notes.
-
West Virginia. No relevant anomalies or notes.
-
Wisconsin. No relevant anomalies or notes.
-
Wyoming. No relevant anomalies or notes.
Appendix D. Supplementary Data Tables
| TABLE D.1. Length of First New Nursing Home Spells Among Aged or Disabled Medicaid Enrollees with new Medicaid-Financed Nursing Home Spells Between July 2006 and December 2006, by State | ||||||
|---|---|---|---|---|---|---|
| Number of Enrollees with New Nursing Home Spells | Distribution of Length of First Spell (percentage) | |||||
| Less Than 3 Months | 3-6 Months | 6-9 Months | 9-12 Months | More Than 12 Months | ||
| All States | 243,912 | 34.1 | 12.8 | 7.4 | 5.1 | 40.6 |
| Alabama | 3,709 | 29.2 | 12.5 | 5.9 | 4.8 | 47.7 |
| Alaska | 328 | 67.4 | b | b | b | b |
| Arkansas | 2,675 | 24.1 | 12.8 | 7.9 | 5.7 | 49.5 |
| California | 24,215 | 47.4 | 12.6 | 6.1 | 3.8 | 30.1 |
| Colorado | 2,579 | 27.5 | 12.9 | 8.5 | 6.3 | 44.8 |
| Connecticut | 5,091 | 38.3 | 11.2 | 6.2 | 4.3 | 40.0 |
| Delaware | 574 | 27.7 | 11.3 | 6.6 | 4.5 | 49.8 |
| District of Columbia | 576 | 36.3 | 7.6 | 7.3 | 6.4 | 42.4 |
| Florida | 15,218 | 39.1 | 14.1 | 7.6 | 5.3 | 33.9 |
| Georgiaa | 5,954 | 22.6 | 13.3 | 8.0 | 6.0 | 50.0 |
| Hawaii | 777 | 45.3 | 11.2 | 4.2 | 3.9 | 35.4 |
| Idaho | 860 | 34.4 | 13.3 | 7.3 | 5.7 | 39.3 |
| Illinois | 13,388 | 30.9 | 15.1 | 8.7 | 5.6 | 39.7 |
| Iowa | 2,887 | 26.4 | 11.2 | 7.6 | 5.6 | 49.3 |
| Kansas | 2,583 | 24.0 | 12.8 | 8.4 | 6.2 | 48.7 |
| Kentucky | 5,614 | 42.1 | 11.1 | 6.3 | 5.6 | 34.9 |
| Louisiana | 5,063 | 24.9 | 13.9 | 9.2 | 6.0 | 45.9 |
| Maryland | 3,819 | 25.0 | 13.6 | 8.5 | 5.6 | 47.4 |
| Massachusetts | 9,571 | 39.7 | 13.4 | 6.8 | 4.8 | 35.3 |
| Michigan | 7,967 | 31.8 | 13.2 | 7.6 | 5.3 | 42.1 |
| Mississippi | 4,076 | 42.2 | 11.0 | 5.8 | 3.8 | 37.2 |
| Missouri | 6,774 | 36.6 | 11.7 | 6.9 | 4.8 | 39.9 |
| Montana | 846 | 32.7 | 11.0 | 6.9 | 4.5 | 44.9 |
| Nebraska | 2,055 | 37.9 | 12.3 | 7.4 | 4.8 | 37.7 |
| Nevada | 870 | 33.3 | 14.6 | 10.2 | 6.3 | 35.5 |
| New Jersey | 6,708 | 26.4 | 13.7 | 8.5 | 5.4 | 46.0 |
| New Mexico | 1,065 | 32.8 | 12.7 | 8.5 | 5.4 | 40.7 |
| New York | 21,539 | 34.5 | 11.9 | 6.7 | 4.8 | 42.1 |
| North Carolina | 7,702 | 31.4 | 12.6 | 7.7 | 5.5 | 42.7 |
| North Dakota | 779 | 24.8 | 12.1 | 6.5 | 6.4 | 50.2 |
| Ohio | 16,276 | 36.7 | 12.7 | 7.5 | 4.6 | 38.5 |
| Oklahoma | 3,799 | 30.0 | 12.6 | 7.9 | 5.2 | 44.4 |
| Oregon | 2,231 | 52.7 | 10.1 | 5.7 | 4.2 | 27.3 |
| Pennsylvania | 12,867 | 25.5 | 12.8 | 8.0 | 5.3 | 48.4 |
| Rhode Islanda | 1,531 | 31.1 | 10.7 | 7.6 | 4.8 | 45.9 |
| South Carolina | 2,616 | 29.1 | 12.3 | 8.6 | 5.4 | 44.7 |
| South Dakota | 943 | 27.8 | 12.5 | 6.8 | 5.2 | 47.7 |
| Tennesseea | 5,960 | 22.6 | 14.9 | 9.3 | 6.5 | 46.6 |
| Texas | 15,026 | 29.3 | 12.4 | 7.2 | 5.6 | 45.6 |
| Vermont | 643 | 40.1 | 10.7 | 8.1 | 3.9 | 37.2 |
| Virginia | 4,600 | 29.0 | 13.0 | 8.4 | 6.2 | 43.5 |
| Washington | 3,988 | 43.5 | 13.6 | 7.1 | 5.0 | 30.7 |
| West Virginia | 1,788 | 29.5 | 12.5 | 7.9 | 5.9 | 44.3 |
| Wisconsin | 5,428 | 33.7 | 13.0 | 7.2 | 4.6 | 41.5 |
| Wyoming | 354 | 32.8 | 9.6 | 7.3 | 6.5 | 43.8 |
| SOURCE: Mathematica analysis of 2006-2007 MAX data for 44 states and the District of Columbia with representative FFS nursing home and ICF/IID data (excludes data from Arizona, Indiana, Maine, Minnesota, New Hampshire, and Utah). NOTES: New spells in this table are spells beginning between July 1, 2006, and December 31, 2006, inclusive; spells are censored at December 31, 2007.
| ||||||
| TABLE D.2. HCBS Use Among Aged or Disabled Enrollees with New Nursing Home Spells Between July 2006 and December 2007, by State | |||
|---|---|---|---|
| Percentage of First New Spells Beginning in 2007 Preceded by HCBS Use in 2006 | Percentage of First New Spells Beginning and Ending During the First Half of 2007 Preceded by HCBS Use in 2006 | Percentage of First New Spells Ending in 2006 Followed by HCBS Use in 2007 | |
| All States | 22.6 | 30.3 | 27.2 |
| Alabama | 33.3 | 29.3 | 34.6 |
| Alaska | 20.8 | 30.4 | 27.7 |
| Arkansas | 24.9 | 32.5 | 18.2 |
| California | 33.6 | 40.2 | 34.0 |
| Colorado | 29.0 | 36.3 | 30.2 |
| Connecticut | 29.4 | 42.6 | 45.4 |
| Delaware | 16.7 | 23.8 | 25.8 |
| District of Columbia | 16.9 | 19.7 | 23.6 |
| Florida | 10.8 | 16.2 | 12.1 |
| Georgiaa | 10.8 | 12.1 | 7.4 |
| Hawaii | 13.2 | 18.3 | 18.2 |
| Idaho | 35.8 | 43.3 | 37.9 |
| Illinois | 14.8 | 21.6 | 15.5 |
| Iowa | 30.2 | 43.3 | 40.0 |
| Kansas | 22.0 | 35.1 | 24.6 |
| Kentucky | 24.6 | 25.5 | 27.3 |
| Louisiana | 5.2 | 7.6 | 5.2 |
| Maryland | 9.1 | 11.8 | 11.1 |
| Mississippi | 15.7 | 21.3 | 19.3 |
| Missouri | 30.5 | 41.0 | 38.3 |
| Nebraska | 24.4 | 30.2 | 30.0 |
| Nevada | 16.9 | 21.2 | 17.2 |
| New Jersey | 19.6 | 25.3 | 18.1 |
| New Mexico | 25.0 | 35.3 | 29.5 |
| New York | 31.0 | 40.7 | 39.4 |
| North Carolina | 30.1 | 35.4 | 26.3 |
| North Dakota | 19.2 | 25.6 | 19.7 |
| Ohio | 21.1 | 31.7 | 34.9 |
| Oklahoma | 27.5 | 38.1 | 25.0 |
| South Carolina | 17.3 | 20.1 | 10.7 |
| South Dakota | 15.7 | 19.9 | 15.6 |
| Tennesseea | 3.8 | 5.7 | 6.0 |
| Vermont | 30.6 | 35.0 | 45.2 |
| Virginia | 20.3 | 25.0 | 31.3 |
| Washington | 33.0 | 37.8 | 39.5 |
| West Virginia | 16.2 | 24.1 | 18.3 |
| Wisconsin | 14.4 | 22.7 | 23.0 |
| Wyoming | 23.9 | 36.6 | 31.0 |
| SOURCE: Mathematica analysis of 2006-2007 MAX data and the ACS 2007 Public Use Microdata Sample for 37 states and the District of Columbia with representative FFS nursing home and ICF/IID data and valid HCBS data (excludes data from Arizona, Indiana, Maine, Massachusetts, Michigan, Minnesota, Montana, New Hampshire, Oregon, Pennsylvania, Rhode Island, Texas, and Utah). NOTES: New spells in this table are spells beginning between July 1, 2006, and December 31, 2006, inclusive; spells are censored at December 31, 2007. HCBS includes 1915(c) waiver services, personal care services, residential care services, home health, adult day services, and private duty nursing services.
| |||
| TABLE D.3. Change in the Percentage of Very Short and Very Long Nursing Home Stays Associated with an Increase in State Policy Variables, Trimmed Data | |||
|---|---|---|---|
| Policy Change | Change in the Percentage of First New Spells Lasting Less Than 3 Months (percentage points) | Change in the Percentage of First New Spells Lasting More Than 12 Months (percentage points) | States Excluded on the Trimming Process |
| A 10 percentage point increase in the percentage of Medicaid LTC expenditures allocated to HCBS | +1.7 | -1.8 | Alaska & Mississippi |
| A 10 percentage point increase in the percentage of LTC users' total Medicaid expenditures accounted for by HCBS users | +3.7 | -3.0 | Kentucky & Mississippi |
| A 10 percentage point increase in the percentage of Medicaid LTC recipients using HCBS | +2.0 | -2.0 | Alaska & Tennessee |
| A 10 percentage point increase in the percentage of potential Medicaid LTC recipients using HCBS | +4.0 | -2.7 | California & Tennessee |
| An increase of 10 in the number of nursing home beds per 1,000 elderly | -1.5 | +1.5 | Alaska & Iowa |
| SOURCE: Mathematica analysis of 2006-2007 MAX data for 37 states and the District of Columbia with representative FFS nursing home and ICF/IID data and valid HCBS data (excludes data from Arizona, Indiana, Maine, Massachusetts, Michigan, Minnesota, Montana, New Hampshire, Oregon, Pennsylvania, Rhode, Island, Texas, and Utah). Nursing home bed data were obtained from Houser et al. (2009) at http://assets.aarp.org/rgcenter/il/d19105_2008_ats_1.pdf (page 65). NOTE: New spells in this table are spells beginning between July 1, 2006, and December 31, 2006, inclusive; spells are censored at December 31, 2007. HCBS includes 1915(c) waiver services, personal care services, residential care services, home health, adult day services, and private duty nursing services. The states with the highest and lowest values for each state policy variable were excluded from calculations. | |||
| TABLE D.4. Use of Nursing Homes and ICFs/IID by Aged or Disabled Enrollees with Multiple Spells Between July 2006 and December 2007 | ||||||
|---|---|---|---|---|---|---|
| Number of Enrollees with Multiple Spells | Percentage of Enrollees with Multiple Spells Who Had Spells in Both Nursing Homes & ICFs/IID | Percentage of ICF/IID Spells Followed Immediately by Nursing Home Spell | Percentage of ICF/IID Spells Followed Within 60 Days by Nursing Home Spell | Percentage of Nursing Home Spells Followed Immediately by ICF/IID Spell | Percentage of Nursing Home Spells Followed Within 50 Days by ICF/IID Spell | |
| All States | 42,677 | 2.3 | 15.6 | 28.6 | 1.2 | 1.9 |
| SOURCE: Mathematica analysis of 2006-2007 MAX data for 44 states and the District of Columbia with representative FFS nursing home and ICF/IID data (excludes data from Arizona, Indiana, Maine, Minnesota, New Hampshire, and Utah). NOTES: New spells are spells beginning on or after July 1, 2006. Spells are censored at December 31, 2007. The percentages of ICF/IID spells were computed relative to the total number of ICF/IID spells for those enrollees with multiple spells of institutional care between July 1, 2006, and December 31, 2007, and similarly for the percentages of nursing home spells. | ||||||
| TABLE D.5. Length of First New ICF/IID Spells Among Aged or Disabled Medicaid Enrollees with New Medicaid-Financed ICF/IID Spells Between July 2006 and December 2006 | ||||||
|---|---|---|---|---|---|---|
| Number of Enrollees with New ICF/IID Spells | Distribution of Length of First Spell (percentage) | |||||
| Less Than 3 Months | 3-6 Months | 6-9 Months | 9-12 Months | More Than 12 Months | ||
| All States | 2,908 | 13.4 | 6.1 | 5.2 | 4.0 | 71.3 |
| SOURCE: Mathematica analysis of 2006-2007 MAX data for 44 states and the District of Columbia with representative FFS nursing home and ICF/IID data (excludes data from Arizona, Indiana, Maine, Minnesota, New Hampshire, and Utah). NOTES: New spells in this table are spells beginning between July 1, 2006, and December 31, 2006, inclusive; spells are censored at December 31, 2007. Alaska, Oregon, and Vermont had no reported ICF/IID spells beginning between July and December 2006. | ||||||
| TABLE D.6. HCBS Use Among Aged and Disabled Enrollees with New ICF/IID Spells Between July 2006 and December 2007, by State | |||
|---|---|---|---|
| Percentage of First New Spells Beginning in 2007 Preceded by HCBS Use in 2006 | Percentage of First New Spells Beginning and Ending During the First Half of 2007 Preceded by HCBS Use in 2006 | Percentage of First New Spells Ending in 2006 Followed by HCBS Use in 2007 | |
| All States | 42.4 | 54.0 | 52.7 |
| Alabama | 50.0 | 0.0 | 100.0 |
| Alaska | b | b | b |
| Arkansas | 16.9 | 100.0 | 8.3 |
| California | 39.3 | 34.0 | 20.0 |
| Colorado | 75.0 | 100.0 | 66.7 |
| Connecticut | 57.5 | 100.0 | 81.8 |
| Delaware | b | b | b |
| District of Columbia | 17.6 | 0.0 | 50.0 |
| Florida | 42.5 | 0.0 | 0.0 |
| Georgiaa | 17.6 | 33.3 | 60.0 |
| Hawaii | b | b | b |
| Idaho | 48.4 | 33.3 | 28.6 |
| Illinois | 50.4 | 45.0 | 33.3 |
| Iowa | 72.5 | 100.0 | 100.0 |
| Kansas | 66.7 | 50.0 | 50.0 |
| Kentucky | 77.6 | 100.0 | 100.0 |
| Louisiana | 18.8 | 10.0 | 33.3 |
| Maryland | 27.3 | 0.0 | 100.0 |
| Mississippi | 23.8 | 38.5 | 26.7 |
| Missouri | 43.9 | 33.3 | 0.0 |
| Nebraska | 28.0 | 50.0 | 33.3 |
| Nevada | b | b | b |
| New Jersey | 35.3 | 16.7 | 28.6 |
| New Mexico | 30.4 | 50.0 | 0.0 |
| New York | 61.0 | 75.8 | 64.0 |
| North Carolina | 52.7 | 28.6 | 40.0 |
| North Dakota | 72.4 | 33.3 | 0.0 |
| Ohio | 41.6 | 43.5 | 50.0 |
| Oklahoma | 21.5 | 50.0 | 25.0 |
| South Carolina | 70.5 | 62.5 | 66.7 |
| South Dakota | 34.4 | 100.0 | 50.0 |
| Tennesseea | 13.6 | 0.0 | 0.0 |
| Vermont | b | b | b |
| Virginia | 45.8 | 71.4 | 72.7 |
| Washington | b | b | b |
| West Virginia | 26.0 | 50.0 | 0.0 |
| Wisconsin | 63.0 | 69.1 | 89.1 |
| Wyoming | b | b | b |
| SOURCE: Mathematica analysis of 2006-2007 MAX data and the ACS 2007 Public Use Microdata Sample for 37 states and the District of Columbia with representative FFS nursing home and ICF/IID data and valid HCBS data (excludes data from Arizona, Indiana, Maine, Massachusetts, Michigan, Minnesota, Montana, New Hampshire, Oregon, Pennsylvania, Rhode Island, Texas, and Utah). NOTES: New spells in this table are spells beginning between July 1, 2006, and December 31, 2006, inclusive; spells are censored at December 31, 2007. HCBS includes 1915(c) waiver services, personal care services, residential care services, home health, adult day services, and private duty nursing services. Alaska and Vermont had no reported ICF/IID spells beginning between July and December 2006.
| |||