
U.S. Department of Health and Human Services
The Impact of Disability Trends on Medicare Spending
Brenda C. Spillman
The Urban Institute
September 2, 2005
PDF Version: http://aspe.hhs.gov/daltcp/reports/distrnd.pdf (60 PDF pages)
This report was prepared under contract #HHS-100-97-0010 between the U.S. Department of Health and Human Services (HHS), Office of Disability, Aging and Long-Term Care Policy (DALTCP) and the Urban Institute. For additional information about this subject, you can visit the DALTCP home page at http://aspe.hhs.gov/_/office_specific/daltcp.cfm or contact the ASPE Project Officers, William Marton and Hakan Aykan, at HHS/ASPE/DALTCP, Room 424E, H.H. Humphrey Building, 200 Independence Avenue, S.W., Washington, D.C. 20201. Their e-mail addresses are: William.Marton@hhs.gov and Hakan.Aykan@hhs.gov.
The opinions and views expressed in this report are those of the authors. They do not necessarily reflect the views of the Department of Health and Human Services, the contractor or any other funding organization.
TABLE OF CONTENTS
- DATA
- Measurement of Disability and Other Characteristics
- Medicare Claims Data
- Standardization of Estimates
- Constructing the Counterfactual
- SPENDING AND UTILIZATION BY THE NONDISABLED AND DISABLED
- Spending by Service
- Utilization by Service
- COMPOSITION OF THE DISABLED AND NONDISABLED POPULATIONS
- Spending by Type of Disability
- Changes in Age, Gender, and Disability Experience
- IMPLICATIONS FOR FUTURE SPENDING
- Disability Trend Assumptions
- Spending Assumptions
- Projection Results
- Impacts of Population Aging
- LIST OF FIGURES
- FIGURE 1: Medicare Total Spending, Enrollees Age 65+: CMS Data and NLTCS 1984-1999
- FIGURE 2: Medicare Spending Per Enrollee Age 65+: CMS Data and NLTCS 1984-1999
- FIGURE 3: Age Comparison, All Medicare Elderly and FFS Only
- FIGURE 4: Disability Comparison, All Medicare Elderly and FFS Only
- FIGURE 5: FFS Disability Rate, Impact of Age and Gender Standardization
- FIGURE 6: Total Medicare Spending, Impact of Age and Gender Standardization
- FIGURE 7: Per Capita Medicare Spending, Impact of Age and Gender Standardization
- FIGURE 8: Percentage Change in Per Capita Medicare Spending Due to Disability Decline
- FIGURE 9: Disability Trend by Type
- FIGURE 10: Percentage Change in Per Capita Medicare Spending Due to Disability Decline
- FIGURE 11a: Equipment Only, Per Capita Spending by Service, Relative to Counterfactual
- FIGURE 11b: IADL Help, Per Capita Spending by Service, Relative to Counterfactual
- FIGURE 11c: ADL Help, Per Capita Spending by Service, Relative to Counterfactual
- FIGURE 11d: Institutional, Per Capita Spending by Service, Relative to Counterfactual
- FIGURE 12: Projected Change in Age Distribution, Persons Age 65 or Older, 1999-2019
- FIGURE 13: Impact of Aging on Projected Actual Disability Rate, Persons Age 65 or Older
- LIST OF TABLES
- TABLE 1: Medicare Spending by Chronic Disability 1984-1999
- TABLE 2: Per Capita FFS Medicare Spending and Relative Spending by Disability and Type of Spending 1984-1999, Standardized by Age and Gender
- TABLE 3: Medicare Acute Care Utilization 1984-1999, Standardized by Age and Gender
- TABLE 4: Medicare SNF and Home Health Care Utilization 1984-1999, Standardized by Age and Gender
- TABLE 5: Per Capita FFS Medicare Spending and Relative Spending by Type of Disability, 1984-1999, Age and Gender Standardized
- TABLE 6: Changes in the Composition of the Nondisabled and Disabled Populations, Relative to the Counterfactual, 1999
- TABLE 7: Changes in Composition by Disability Type Relative to the Counterfactual, 1999
- TABLE 8: Disability Assumptions for Projections, 2004-2019
- TABLE 9: Spending Assumptions for Projection of Age and Gender Standardized Per Capita Spending 2004-2019
- TABLE 10: Projected Age and Gender Standardized Medicare Spending Per Capita Spending 2004-2019
- TABLE 11: Projected Actual Medicare Spending Per Capita, 2004-2019
EXECUTIVE SUMMARY
It is now generally agreed that there has been a significant decline in the elderly disability rate in the United States since the early 1980s, but much less is known about implications of the decline for Medicare spending. This is in part because uncertainty persists about the extent to which the aggregate disability decline reflects improvements in health. If declines are not due--or not entirely due--to improvements in health, this suggests uncertainty about the implications of disability declines for future Medicare costs.
Underlying the downward trend in aggregate disability, are different trends for different types of disability:
-
Most of the decline occurred for persons reporting chronic help with only instrumental activities of daily living (IADLs)--activities such as housekeeping and meal preparation associated with the ability to live independently.
-
The prevalence of chronic disability managed solely with the use of assistive devices increased significantly.
-
There was, at most a modest reduction in assistance with activities of daily living (ADLs), which are associated with poorer health and more serious disability.
-
The trend in the prevalence of institutional residence was flat.
The purpose of this study is to better understand the relationship between disability declines and Medicare costs, and what Medicare spending patterns may suggest about the relationship between disability and health. To that end, the study examines actual patterns of Medicare spending and utilization that occurred over the period of declining disability between 1984 and 1999, and how they differ from what might have been expected had disability not changed. Spending is examined in the aggregate, by service, and by type of disability, and implications for the relationship between disability, Medicare spending, and health are discussed. Based on the results, Medicare spending projections are developed under various assumptions about how disability and spending are likely to change over the over the next several years.
Data and Methods
The basic analytic strategy in this study is to compare actual Medicare spending per capita--and per capita spending by persons with chronic disability relative to persons without chronic disability--with counterfactual estimates assuming that disability rate declines had not occurred. The counterfactual takes into account not only the aggregate trend in disability but differences in trends for the four different types of disability. Differences between the counterfactual and the actual values reflect the impact of declining disability on spending.
Data are from the 1984, 1989, 1994, and 1999 waves of the National Long-Term Care Survey (NLTCS), merged with Medicare claims data. The NLTCS is a nationally representative survey of Medicare enrollees aged 65 or older designed to identify those who are chronically disabled in one or more ADLs or IADLs and to collect detailed data on their disability, service use, family support, and health and demographic characteristics. The samples are drawn from Medicare enrollment files and represent both community and institutional residents.
Disability is defined as receiving help (including supervision) or using equipment to perform ADL activities, being unable to perform IADLs without help because of health or disability, or living in an institution, which is defined as a group setting with medical supervision. The ADLs included in the present analysis are eating, getting in and out of bed (transferring), getting around inside, dressing, bathing, and toileting. The included IADLs are light housework, laundry, shopping, meal preparation, getting around outside, managing money, taking medications, and telephoning. Chronic disability is defined as receiving help (including standby help, or supervision) or using equipment for any of these 14 activities for at least 90 days, or being in an institution.
Chronically disabled individuals are assigned to one of the four mutually exclusive disability groups identified above, defined by residence, type of disability, and receipt of help. Community residents are classified as receiving ADL assistance if they reported chronic help with any ADL, as receiving only IADL help if they report chronic help with IADL activities but no chronic ADL help, and as independent with equipment if they reported no chronic help with any activity but used assistive devices to perform at least one activity. The final group comprises all persons residing in institutional settings.
Medicare fee-for-service claims data for the years 1982-2000 have been linked to all persons surveyed in any wave of the NLTCS. Because Medicare data are not available for managed care enrollees they are excluded from the analysis. In order to link Medicare utilization and spending with a baseline disability measure, an analysis period was constructed for each survey year that begins with the earliest survey interview date and ends one year later. The analysis focuses on total spending and spending for four types of service that are most analytically important for trends: inpatient hospital spending; combined Part B physician supplier, durable medical equipment, and outpatient spending; skilled nursing facility (SNF) spending; and home health spending.
Spending and utilization estimates are standardized to the 1999 age and gender distribution. To examine the counterfactual of spending if the disability rates had not changed, comparison estimates were produced after further standardizing the sample to 1984 disability rates by age and gender.
Major Findings
-
As a group, the nondisabled, who made up an increasing proportion of the older population, became more expensive on a per capita basis.
-
Spending for persons with chronic disability fell progressively, so that the gap in spending between the disabled and nondisabled progressively narrowed.
-
These spending patterns were observed for all of the four major service areas examined.
Within the disabled population:
-
The two least expensive groups--persons managing their disability with only equipment, a group increasing in prevalence, and persons with help only with IADLs, a group with falling prevalence--became more expensive.
-
The two most costly groups--persons who received help with ADLs or were institutionalized, whose age-adjusted prevalence has fallen--became less expensive.
-
Increases in hospital, SNF, and home health use for the two less disabled groups, relative to the counterfactual, may indicate poorer or less stable health owing to changes in the composition of these groups.
Projections of future spending were made using two assumptions about how disability will change over the 20 years between 1999 and 2019 and three spending projection methods. The disability assumptions were:
-
The age and gender standardized aggregate disability rate will decline at the historical rate of 1.4 percent per year observed between 1984 and 1999.
-
Historical trends in the four underlying types of disability will continue, generating a lower, 0.5 percent per year decline in standardized aggregate disability.
Spending projections, at historical rates, were made using per capita total spending for the nondisabled and the disabled, per capita spending by service for the nondisabled and the disabled, and projected per capita total spending by type of disability. Projection results revealed that all spending projection methods that take disability rates into account generated higher future spending than naïve projections ignoring disability. The highest projected spending was for spending by service.
-
Savings under the assumption of a 1.4 percent per year age and gender standardized disability decline were modest, ranging from 5 percent to 7 percent depending on the spending method by 2019.
-
Savings under the assumption of a 0.5 percent per year decline, assuming that underlying standardized trends in type of disability continue, ranged from 2 percent to 2.6 percent.
-
When projected changes in the age and gender distribution were taken into account, the influx of younger persons after 2009 when the Baby Boom begins to enter Medicare moderated spending, savings for the larger disability decline fell, and savings for the smaller decline based on underlying trends by disability type rose.
-
Savings continued to be larger for the larger disability decline assumption, except for spending projected by service, underscoring the important of changes in service mix for future Medicare spending.
Summary and Discussion
The Medicare spending patterns observed in the NLTCS appear to indicate subtle changes in both service use and composition of the nondisabled and disabled population, as well as for subgroups of the disabled population defined by type of activity and use of assistance. Specifically, as seen, when the population is standardized to the 1999 age and gender distribution, both persons without disability and those able to manage disabilities solely with equipment or requiring help only with IADLs appear to have become steadily more expensive for Medicare on a per capita basis than if disability not declined. The reverse was true for persons with more severe disability, defined here as requiring ADL help or being institutionalized, who appear to have become less expensive. As a result of these patterns, the gap in spending between the nondisabled, the disabled as a whole, and for persons with more serious disability progressively narrowed, while the spending gap for persons with less serious disability widened slightly, relative to the counterfactual if disability rates had not changed.
The results provide evidence that the link between disability declines, better health, and lower Medicare spending is complex. If persons who do not report chronic disability and persons who manage all disabilities with equipment continue to become relatively more expensive for Medicare and continue to increase in prevalence, Medicare savings from declining spending and prevalence of more serious disability requiring long-term care would be offset to some extent. Among the nondisabled, persons with a prior history of disability were found to be nearly as expensive for Medicare as the currently disabled and far more expensive than persons reporting no current or prior disability. Although this group is quite small and showed no consistent growth between 1984 and 1999, this suggests that recovery from disability and recovery of health are not synonymous, at least as measured by Medicare spending.
Finally, controlling for age and gender, both hospital and post-acute spending were higher for persons with less serious disability than they would have been for persons with these disability profiles in the past. It is possible that this indicates environmental improvements that allow more independent function--or even no perception of disability--among persons with medical conditions associated with higher costs. It is also possible that such improvements have reduced the ability to measure disability consistently over time, so that some of the decline observed reflects measurement error rather than improvements in physical functioning, further confounding the ability to rely on reductions in disability rates as a proxy for improved population health (Cornman, Freedman, and Agree 2005).
In the current policy and demographic climate, with the retirement of the Baby Boom looming, there is considerable pressure to assess implications of disability declines for public program costs and particularly for Medicare. In fact, the period covered by the projections in this study stops just short of the aging of the early Baby Boom cohorts into ages where disability rates are high. However, the findings in this study and others highlight the importance of more critical thinking about where research should focus in order to understand causes of disability rate declines and the importance of observed declines in current disability for future health costs.
INTRODUCTION
It is now generally agreed that there has been a significant decline in the elderly disability rate in the United States since the early 1980s (Spillman 2004; Freedman, Martin, and Schoeni 2002; Schoeni, Freedman and Wallace 2001; Manton and Gu 2001; Waidmann and Liu 2000; Waidmann and Manton 1998). Much less is known about the implications of the decline for Medicare spending. This is in part because uncertainty persists about the extent to which the aggregate disability decline reflects improvements in health rather than improvements in the environment in which the disabled elderly function. If declines are not due--or not entirely due--to improvements in health, this in turn suggests uncertainty about the implications of disability declines for future Medicare costs. In particular, the projections of the magnitude of any beneficial impacts of disability declines on future spending may be overstated to the extent that disability declines reflect environmental accommodation rather than better health.
Consistent with evidence in other studies, Spillman (2004) found a clear downward trend in the aggregate prevalence of disability in the older American population from 1984 to 1999. This decline was not monolithic, however. Trends differed for different aspects of disability.
-
Most of the decline occurred for those reporting chronic help with only instrumental activities of daily living (IADLs)--activities such as housekeeping and meal preparation associated with the ability to live independently.
-
The prevalence of chronic disability managed solely with the use of assistive devices increased significantly.
-
There was, at most a modest reduction in assistance with activities of daily living (ADLs), which are associated with poorer health and more serious disability.
-
The trend in the prevalence of institutional residence was flat.
Moreover, much of the disability decline was attributable to such IADLs as money management and shopping, which have seen dramatic advances in technology and services over the last two decades. When both human help and equipment use were considered, no individual ADL declined in prevalence. Bathing was the sole ADL for which there was a significant decline in human assistance, and in that case, the decline was offset by an increase in use of assistive devices. Support for this finding with respect to ADL disability was found in a project designed to examine and resolve apparent inconsistency in elderly ADL disability trends across several data sources (Freedman et al. 2004). In that study, consistent evidence was found of decline in disability defined as help with ADLs during the 1990s but not when disability was defined as using either help or equipment to perform ADLs. Although other studies have not examined individual activities, the finding that declines are concentrated at the lower end of the disability spectrum also is consistent with other evidence (Schoeni, Freedman and Wallace 2001; Waidmann and Liu 2000).
The purpose of this study is to better understand the relationship between disability declines and Medicare costs, and what Medicare spending patterns may suggest about the relationship between disability and health. To that end, the study examines actual patterns of Medicare spending and utilization that occurred over the period of declining disability between 1984 and 1999 and how they differ from what might have been expected had disability not changed. Data are Medicare records merged to four waves of the National Long-Term Care Survey (NLTCS), a nationally representative survey of the Medicare elderly used in Spillman (2004). Spending is examined in the aggregate, by service, and by type of disability, and implications for the relationship between disability, Medicare spending, and health are discussed. Based on the results, Medicare spending projections are developed under various assumptions about how disability and spending are likely to change over the over the next several years.
BACKGROUND
The conceptual framework used in an Institute of Medicine Report (1991) and based on Nagy (1965) is useful in thinking about the potential relationship between disability and medical costs. In this framework, pathology (disease or trauma) may lead to impairment of an organ or organ system, which, in turn, may or may not result in physical or functional limitations, such as inability to climb a flight of stairs. Whether pathology results in limitation, depends on the type and severity of the impairment and on other characteristics, such as the health of other body systems. Whether a functional limitation results in disability, particularly as measured by ADLs and IADLs, depends critically on individual and social expectations and characteristics of the environment in which the individual functions. Pathology, impairment, and functional limitation clearly are related to health and therefore would be expected to be related to health care use and cost. The link between disability and health care costs is less direct.
For example, environmental characteristics, such as microwave ovens, prepared meals, and access to electronic or telephone banking and bill payment, all of which have become more common over the last two decades, may affect the individuals ability to carry out IADL functions with no change in health. Similarly, scooters, wheelchairs, and home modifications, such as grab bars and raised toilet seats, may enable independent performance of ADL functions, again, with no change in health.
The trend in disability measured by ADL and IADL limitation is not the only evidence that patterns of functioning--and potentially health--among the elderly have changed in recent years. Related findings from a variety of data sources have been reported. Using data from the 1984-1993 Survey of Income and Program Participation, Freedman and Martin (1998) found a decrease in functional limitations. Freedman, Aykan, and Martin (2001), using the 1993 Assets and Health of the Oldest Old Survey and the 1998 Health and Retirement Survey found a decline in the proportion of persons age 70 or older who were cognitively impaired and speculated that improved cognitive functioning may contribute to the decline in IADLs observed in other data sources.
Two studies using data from the Supplements on Aging to the 1984 and 1994 Health Interview Surveys, (Freedman and Martin 2000; Crimmins and Saito 2000) found increases in the prevalence of various chronic conditions associated with disability, but some evidence of improved function among persons with these conditions. Freedman and Martin found an accompanying decline in functional limitations among those with chronic conditions. Crimmins and Saito (2000) found declines in both functional limitations and IADLs for women, but not for men, and some significant increases in ADLs for both men and women. In both studies the authors note that the increase in chronic disease prevalence may have been due to earlier diagnosis and improved treatments, both of which may suggest greater use of medical care and higher spending. If this is true, then improvements in functional status among those with chronic disease might be found to be associated with higher spending, depending on the period over which medical spending is measured and whether improved treatment translates into persistently higher spending.
A direct link between improvements in functioning and health care spending has not yet been made empirically. In fact, other changes in medical technology and practice also may suggest higher costs associated with disability declines. For example, such mobility enhancing procedures as hip and knee replacements have risen dramatically in recent years, raising the possibility that disability improvements may be in part the result of higher Medicare spending. If this is true, then continued improvements in disability may contribute to rising Medicare costs over time, especially in the aggregate.
Changes in Medicare policy also affect access to service and patterns of service use, which in turn affect spending. Major events in Medicare policy and payment systems have occurred during the period covered by the present analysis with dramatic impacts on patterns of service use independent of disability trends, although there may have been differential impacts on those with and without chronic disability. Prospective payment for inpatient hospital care, which began in 1983, has substantially reduced the length of hospital stays (Centers for Medicare and Medicaid Services (CMS) 2002). The discharge rate initially fell precipitously, but has been rising sharply since 1993. The Medicare Catastrophic Coverage Act of 1988, significantly increased skilled nursing facility (SNF) benefits in the brief period before its repeal in 1989. Other policy changes that increased access to SNF and home health care contributed to dramatic increases in spending for these services through most of the 1980s and 1990s.
In response to the rapid growth rate, the Balanced Budget Act (BBA) of 1997 was enacted to regulate spending by instituting prospective payment for both SNF and home health care. Medicare SNF payments fell 14 percent in 1999 (CMS 2002), after the July 1998 implementation of SNF prospective payment. In large part due to provider payment increases in subsequent legislation, Medicare SNF spending grew 13.4 percent in 2000 and 22 percent in 2001. Medicare home health spending fell by 34 percent between 1997 and 2000 under the interim payment system (IPS) imposed by the BBA, largely as the result of dramatic reductions in less skilled visits, but rose 14.4 percent in 2001, under the prospective payment system that replaced the IPS in 2000 (Levit et al. 2003).
The present study examines trends in Medicare spending over the period of declining disability and what they may suggest about the relationship between disability health, health, and Medicare spending. Total Medicare use and spending and use and spending by service for those without and with chronic disability are described first. Patterns of spending then are compared for the four types of disability discussed above which had different trends over the analysis period: chronic disability in IADL only, chronic ADL disability managed entirely with assistive devices, chronic ADL disability with help, and institutional residence.
Finally, projections of disability and Medicare spending for the 20 years following the 1999 NLTCS are made, based on historical trends observed in the data. These projections take into account both changes in the composition of the population with chronic disability suggested by observed differences in underlying trends by type of disability and changes in the composition of Medicare spending. Specifically, projections are made under the alternate assumptions that: (1) aggregate disability declines at the historical rate, an assumption that has been used in studies such as Singer and Manton (1998); and (2) that future aggregate disability rates will reflect the outcome of the trends in the four underlying types of disability. Three alternate Medicare spending assumptions are used to explore the how forecasts differ when changes in the composition of Medicare spending and disability are taken into account.
ANALYTIC STRATEGY
The basic analytic strategy in this study is to compare actual Medicare spending per capita--and per capita spending by persons with chronic disability relative to persons without chronic disability--with counterfactual estimates assuming that disability rate declines had not occurred. The counterfactual takes into account not only the aggregate trend in disability but differences in trends for the four different types of disability. Differences between the counterfactual and the actual values reflect the impact of declining disability on spending.
Projections of the impact of disability declines on Medicare costs typically assume that declining disability implies reduced spending relative to a situation with no disability decline because of the consistently higher health care costs associated with disability. In simple terms, such projections are based on one or more of the following assumptions:
-
Persons with disability will continue to be more costly for the program than the nondisabled on a per capita basis.
-
The relationship between spending for persons reporting chronic disability and persons reporting no chronic disability--relative spending by the disabled--is consistent over time.
-
Declining disability prevalence reflects improvements in health, which in turn imply lower health care costs, so that declines in disability increase the number of low cost cases and decrease the number of high cost cases.
Taken together these assumptions imply in the extreme a one-to-one correspondence between disability and high Medicare spending, so that a decline in the proportion disabled translates directly to a decline in the proportion of high spending cases. In simplest form, both average spending for persons who are disabled and not disabled and relative per capita spending by persons with disability would remain the same. There would be an unequivocal decline in per capita Medicare spending.
The first premise of the current study is that factors other than health, such as environmental improvements that make functioning easier, health constant, may have contributed to or even driven disability trends. In the extreme, if all disability decline reflects factors other than health, a decline in disability simply shifts some high spending cases from disabled to not disabled, raising the average spending associated with the nondisabled but leaving average spending of persons with disability unchanged. Relative per capita spending by the disabled would fall, and per capita Medicare spending would be unchanged.
The second premise is that heterogeneity in disability may also imply heterogeneity among high spending cases, so that both the underlying trends in the four types of disability identified above and different levels of per capita spending that may be associated with each type of disability should be taken into account in forecasting the impact of disability declines on health care spending. In this case, it matters which types of disability decline because the composition of the nondisabled and disabled populations change. Varying impacts on per capita and relative per capita spending are possible. For example, if the decline in disability is in a type of disability associated with lower spending than the prior average for persons with disability, but higher than the prior average for persons without disability, average spending for both the disabled and the not disabled could rise. Impacts on relative spending by the disabled depend on the relative magnitudes of the increases in average spending, but per capita Medicare spending again would be unchanged.
Although these examples are highly stylized, they nevertheless provide a framework for interpreting observed patterns of spending and utilization relative to a counterfactual that takes into account trends in different types of disability, what these patterns may reveal about the likely importance of improved health in disability declines, and the implications for projections of future Medicare spending.
DATA
Data for this analysis are from the 1984, 1989, 1994, and 1999 waves of the NLTCS, merged with Medicare claims data. The NLTCS is a nationally representative survey of Medicare enrollees aged 65 or older designed to identify those who are chronically disabled in one or more ADLs or IADLs and to collect detailed data on their disability, service use, family support, and health and demographic characteristics. The samples are drawn from Medicare enrollment files and represent both community and institutional residents. In each survey year, the sample consists of a longitudinal component and a new sample of persons who turned 65 since the previous survey to maintain the cross-sectional representation of persons age 65 or older. In 1994 and 1999, supplemental samples of those age 95 or older were added to increase precision of estimates for the very old, where erosion of sample size due to mortality was more severe. Although the survey began in 1982, the 1984 survey, the first round in which interviews were conducted for an institutional sample, is used as the base year for this study.
Measurement of Disability and Other Characteristics
In the NLTCS, disability is defined as receiving help or using equipment to perform ADL activities, being unable to perform IADLs without help because of health or disability, or living in an institution, which is defined as a group setting with medical supervision. The ADLs included in the present analysis are eating, getting in and out of bed (transferring), getting around inside, dressing, bathing, and toileting. The included IADLs are light housework, laundry, shopping, meal preparation, getting around outside, managing money, taking medications, and telephoning.
For this study, chronic disability is defined as receiving help (including standby help, or supervision) or using equipment for any of these 14 activities for at least 90 days, or being in an institution. In addition, chronically disabled individuals are assigned to one of the four mutually exclusive disability groups identified above, defined by residence, type of disability, and receipt of help. Community residents are classified as receiving ADL assistance if they reported chronic help with any ADL, as receiving only IADL help if they report chronic help with IADLs but no chronic ADL help, and as independent with equipment if they reported no chronic help with any activity but used assistive devices to perform at least one activity. The last group includes a small group proportion (about 0.7 percent of the elderly in each survey year) whose only reported chronic disability was independent use of assistive devices for getting around outside, an IADL. The final group comprises all persons residing in institutional settings. The significance of these four groups for the present analysis is, as noted, that they exhibited different trends over the period of analysis. Thus, the composition of the group identified as chronically disabled changed over the period, and if Medicare spending differs by type of disability, the compositional change may have affected per capita spending by the disabled as well as the disabled.
Medicare Claims Data
Medicare fee-for-service (FFS) claims data for the years 1982-2000 have been linked to all persons surveyed in any wave of the NLTCS. Because Medicare data are not available for managed care enrollees they are excluded from the analysis. Medicare data are provided in two formats for the years covered by this analysis. For 1984-1990, a unified Medicare Automatic Data Retrieval System (MADRS) file is provided for each calendar year, containing all Part A and Part B records for each type of institutional provider and type of service. For 1991-2000, the claims information is provided in separate Standard Analytic File format Version I files for durable medical equipment (DME), home health, hospice, inpatient and SNF, outpatient, and Part B claims in each calendar year.1
In order to link Medicare utilization and spending with a baseline disability measure, an analysis period was constructed for each survey year that begins with the earliest survey interview date and ends one year later. All claims with dates falling within the analysis period were then selected for each survey year sample. Because the analysis period in each survey year spans parts of two calendar years, the two calendar year Medicare files corresponding to analysis period were combined prior to the selection.2
Comparability of Linked Medicare Data over Time
The different Medicare data formats data before and after 1991 could complicate the ability to identify trends over time. However, this analysis relies on a small number of key variables identifying dates of service, type of service, Medicare payments, and service units that are found in similar form in both data formats.3 In addition, there is no a priori reason to believe that differences arising because of data comparability issues would affect spending estimates for the nondisabled and the disabled differently. The analysis focuses on total spending and spending for four types of service that are most analytically important for trends and are consistently identifiable over time: inpatient hospital spending; combined Part B physician supplier, DME, and outpatient spending; SNF spending; and home health spending.
Comparability with External Estimates
Estimates from the NLTCS claims data were also compared with published CMS statistics on Medicare FFS spending, enrollment and service use by persons age 65 or older. Because the NLTCS represents the population age 65 or older estimates from the merged FFS claims would be expected to differ from CMS statistics primarily due to sampling. In addition, however, in some cases, CMS estimates may reflect changes in underlying definitions used for published statistics or for other undocumented differences between published data and tabulations of claims data.4 The key issue is to verify that the merged Medicare data generate spending estimates and trends that are substantially consistent with those observed for aged FFS enrollees in the Medicare program over the period of the analysis.
NLTCS spending estimates and trends are generally very similar to the CMS statistics and trends, as shown in Figure 1 and Figure 2. Solid lines show NLTCS values, and the gray, dashed lines show the corresponding CMS values. The dotted lines between the CMS values for 1984 and 1994 for Part B and home health spending indicate that the corresponding statistics for 1989 could not be found in published sources. The primary exception to similarity between the CMS and NLTCS values is in inpatient hospital spending and spending per enrollee, which are noticeably lower than CMS values in 1984 and 1989 and more similar in 1994 and 1999. This could result from differences in the published CMS data over time or from the change in the NLTCS data format. The result is a somewhat flatter slope for the NLTCS total and inpatient spending between 1984 and 1989 and a somewhat steeper slope between 1989 and 1994, but the overall trends are very similar.
Impacts of Managed Care
Excluding managed care enrollees from the analysis sample resolves the obvious downward bias in estimates of per capita spending that would result because they are missing claims. However, favorable selection into managed care would affect how well relative spending by FFS enrollees with and without chronic disability represents all enrollees. Research has found selection of healthier beneficiaries into Medicare managed care (Call et al. 1999; Hellinger and Wong 2001; Mello et al. 2003), but there is not yet consensus in the literature about whether selection effects persist over time or are attenuated as managed care penetration increases. Managed care enrollment generally rose through the 1980s and 1990s, and about 18.5 percent of aged Medicare beneficiaries in 2000 were enrolled in managed care plans.5
To investigate the issue, characteristics of FFS enrollees in the analysis sample and all NLTCS sample members were compared. Figure 3 and Figure 4 show the results for age and disability. Clearly, FFS enrollees are slightly older and somewhat more disabled than all Medicare elderly, and the difference, particularly in disability becomes larger over time. However, the increasing disability gap is due entirely to the increase in the proportion of the elderly enrolled in managed care; age and disability differences between FFS and managed care enrollees in the NLTCS actually narrowed. Managed care enrollment increased from about 4 percent of the NLTCS sample in 1984 to about 21 percent in 1999. Over the same period, the proportion of managed care enrollees who were chronically disabled rose from 14.9 percent in 1984 to 16 percent in 1999, and their disability level increased, with a nearly five percentage point increase (from 6.5 percent to 11.2 percent) in the percent who had chronic ADL limitations or were institutional residents. As a result, increasing managed care enrollment has a relatively modest impact on the validity of using FFS experience to represent the full Medicare elderly population.
Standardization of Estimates
Because the focus of the analysis is primarily on relative spending by the disabled and nondisabled and on comparisons with comparable estimates if disability had not changed within each survey year, spending estimates are not adjusted for underlying medical price inflation. That is, both the disabled and the nondisabled are subject to the same increases over time. On the other hand, changes in the age and gender composition of the older population directly affect disability rates. To control for these factors, spending and utilization estimates are standardized to the 1999 age and gender distribution.
Figure 5 shows the impact of the standardization on the disability rate among FFS enrollees, and Figure 6 and Figure 7 show the impact on total and per capita Medicare spending, respectively. The standardization clearly has a large impact on the disability trend, primarily due to the strong relationship between rising age and chronic disability. The proportion of Medicare FFS enrollees age 85 or older rose from 9.4 percent in 1984 to 12.6 percent in 1999, and the proportion under age 75 fell from about 60 percent to about 52 percent (not shown). As a result, after age and gender standardization, the proportion disabled in 1984 is 25.1 percent, about three percentage points higher than the actual 1984 rate of 22.3 percent. The impact on total spending is modest, however, and entirely accounted for by the higher disability rate after standardization to the 1999 age distribution. Impacts on per capita spending by persons without and with chronic disability are negligible.
Constructing the Counterfactual
To provide counterfactual estimates of spending if the rate of disability had not changed for comparison, an additional standardization was done. In this standardization, it was assumed that the proportion with each of the four types of disability remained at the 1984 level, within gender and age classes. Factors adjusting the rate by type of disability within each cell were applied to the age and gender adjusted sample weights and counterfactual spending utilization estimates were computed.
This counterfactual differs from one based on a simple standardization of the proportion of the population in the gross classes of disabled and nondisabled because it holds constant both the proportion disabled and the composition of the disabled population over time. Therefore, comparisons of age and gender standardized per capita spending by the disabled with this more detailed counterfactual allows for the possibility that changes in the composition of disability affect per capita spending. Thus, for example, because the rate of IADL disability has fallen and the rate of disability managed solely with assistive devices has increased since 1984, in the counterfactual estimates of spending and utilization, the representation of persons with IADL disability is larger and the representation of persons managing their disabilities with only equipment is smaller than their actual representation in the later years.
SPENDING AND UTILIZATION BY THE NONDISABLED AND DISABLED
Age and gender standardized annual Medicare FFS spending grew from $50.7 billion to $143 billion between 1984 and 1999 (Table 1). Although this represents a 7.2 percent per year increase in total spending, it is 4.7 percent--about $7 billion--lower than if the disability rate had not fallen. Interestingly, however, although the number of nondisabled persons was 6 percent higher in 1999 than with no change in disability rate, their spending was nearly 7 percent higher. Conversely, there was a 17.8 percent drop in the number of chronically disabled persons relative to the counterfactual, but their actual spending was about 19 percent lower.6
As a result, per capita spending, which adjusts for the number of persons in each group, also was 4.7 percent lower than the counterfactual for all Medicare FFS enrollees, but 0.8 percent ($34) higher for persons without disability and about 1.7 percent ($168) lower for persons with chronic disability, net of the change in the number of persons in each group (Figure 8). Spending by the disabled relative to the nondisabled was about 2.5 percent lower than it would have been if disability rates had not fallen. That is to say, the gap in per capita spending between the disabled and the nondisabled was slightly smaller. In fact, although relative spending by the disabled appears to have risen through 1994 before falling slightly in 1999, it actually declined relative to the counterfactual beginning in 1989.7
It is important to note that the actual changes in age and gender standardized per capita spending relative to the counterfactual are small for both the disabled and nondisabled, and, in fact, the counterfactual estimates lie well within two standard deviations of the age and gender standardized estimates. Nevertheless, the trend in the differential in per capita spending by the nondisabled and the disabled relative to the counterfactual appears to have been downward, at least since 1989. Because the counterfactual affects per capita spending only by adjusting the representation of the nondisabled and persons with each type of disability in the population, this suggests that there may have been changes in either the service composition of spending or the composition of the nondisabled and disabled populations.
Spending by Service
Per capita spending for each of the four basis services examined also decreased relative to what it would have been had disability not declined (Table 2). Although the largest percentage declines are in post-acute care, the 4.3 percent and 2.8 percent declines for inpatient hospital and Part B spending, representing $115 and $60 per person respectively, are more important in dollar terms because of the much higher per capita spending for these services. Per capita spending for SNF care was $35 lower than under the counterfactual, and per capita spending for home health was $41 lower.
As with per capita total spending, there is an indication for every service that spending gaps between the nondisabled and disabled narrowed after 1989, relative to what they would have been had disability rates not declined. This is most obvious for the two acute care services, with higher per capita spending in all years for the nondisabled than if disability rates had not changed, and lower per capita spending relative to the counterfactual after 1989 for the disabled. The nondisabled also had higher per capita spending for SNF and home health care in each year than under the counterfactual. For these services, however, per capita spending for the disabled did not fall below the counterfactual until 1999, although the differential between their actual and counterfactual per capita spending fell after 1989, as did relative spending. The impact of payment system changes after the 1997 BBA can be seen clearly for home health spending. Whereas per capita spending by both groups rose steadily for all other services, it actually declined for home health in 1999, with larger impacts on the disabled than the nondisabled.
Utilization by Service
Table 3 and Table 4 show the underlying patterns of utilization for acute and post-acute services, respectively. In general, for all utilization measures, the same pattern is seen as for spending, with overall utilization lower, utilization by the nondisabled higher, and relative use by the disabled lower than if disability rates had not changed.
Acute Care
For acute care, only inpatient hospital utilization follows this pattern (Table 3). Part B use rates are virtually unchanged relative to what they would have been with constant disability rates, but the utilization measure is crude, capturing no information about the types and number of Part B services.
The proportion of the nondisabled and of the disabled with any hospital use fell in the wake of prospective payment, which went into effect in 1983, but rose after 1989. Hospital days per capita fell throughout because of the continued impact of prospective payment on length of stay; days per hospital user fell by about four days for all persons, three days for the nondisabled, and about six days for the disabled between 1984 and 1999. However, use rates rose more for the disabled: 4.5 percentage points, compared with about one percentage point for the nondisabled. Nevertheless, all utilization measures were consistently higher for the nondisabled than if disability rates had not changed. For the disabled, utilization progressively fell relative to the counterfactual and was lower for all measures in 1999. As a result, relative use by the disabled also was lower than it would have been with constant disability rates.
SNF and Home Health
Both SNF and home health care utilization also show a narrowing of the gap between the disabled and the nondisabled relative to the counterfactual in 1999 (Table 4). In fact, for SNF use, the actual observed differential in use rates, days per capita, and days per user fell as well. Although SNF use is very uncommon among the nondisabled throughout, their use rate rose progressively relative to the counterfactual. The use rate by the chronically disabled also was higher in each year than if disability rates had not changed, but the magnitude of the difference fell consistently. As a result the relative rate of use by the disabled in 1999 was nearly 4 percent lower than it would have been with no disability rate change.
The decline in relative SNF use rate compared with the counterfactual is largely responsible for the narrowing of the gap in days per capita, which was 5.2 percent below what it would have been with no disability change in 1999. There were substantial reductions in the number of days of SNF care per user for both groups after 1989--more than ten days per user for the nondisabled and 33 days for the chronically disabled. Days per user for the nondisabled, however, showed little difference relative to the counterfactual and in 1999 were the same as they would have been with no disability change. Although days per user for the disabled were greater than they would have been with no change in disability through 1994, in 1999, after imposition of prospective payment, they were about 1.5 percent lower than the counterfactual.
The impacts of the payment system changes following the 1997 BBA are evident for home health care, with some reductions in the use rate but dramatic reductions in the number of visits per user for both the disabled and the nondisabled in 1999 under the IPS. Home health follows the general pattern of lower utilization overall, higher use by the nondisabled and lower relative use by the disabled when compared with the counterfactual, but impacts of both increases in use prior to the BBA and reductions following it are much larger for the disabled. The number of less skilled visits which were used more heavily by persons with chronic disability was a major component of the increases in use prior to the BBA and of the reductions in spending and utilization afterwards. Although the use rate for the disabled was lower than if disability rates had remained constant, visits per user were about 3 percent higher than the counterfactual in 1989 and 1994 before falling to about 2 percent below the counterfactual in 1999, when visits per user had fallen to 55 from their peak of about 109 in 1994. In contrast, use rates by the nondisabled rose relative to the counterfactual throughout, and although visits per user also were dramatically reduced, they were only modestly higher than the counterfactual in 1989 and 1994 and only slightly lower in 1999. As a result, in 1999 visits per capita for the nondisabled remained about 2.4 percent higher than if disability rates had not changed.
COMPOSITION OF THE DISABLED AND NONDISABLED POPULATIONS
This section examines whether compositional changes in the disabled and nondisabled populations occurred that might point to reasons for patterns of spending and utilization seen relative to what would have been expected with no change in disability. First, trends in the prevalence and per capita spending of each of the four underlying disability types, relative to counterfactual estimates, are examined. It will be recalled that the counterfactual holds constant the prevalence of each disability type by age and gender. Thus, changes in spending by disability type over time could contribute to differences between observed and counterfactual spending patterns for the disabled as a group. Second, changes in the composition of the nondisabled and disabled populations by age, gender and prior disability experience are examined. Changes in these characteristics, relative to the counterfactual populations, also may have affected spending patterns.
Spending by Type of Disability
Table 5 provides the population prevalence of each type of disability and spending associated with it in each survey year. In each year, the level of per capita spending follows a consistent pattern for community residents, with the nondisabled being the least expensive group, followed by community residents who are independent with equipment use, community residents receiving help with only IADLs, institutional residents, and persons receiving help with ADLs. Although nearly all institutional residents on the NLTCS have ADL disability, they are less expensive for Medicare than community residents with ADLs, consistent with findings in previous research (Saucier et al. 1998; Komisar, Hunt-McCool, and Feder 1997). In addition, community residents became much more expensive relative to all other groups after 1989.
Although the ordering of per capita spending persists in all years, both trends in the prevalence of each type of disability and in spending relative to the counterfactual differ across the groups. This is illustrated in Figure 9 and Figure 10. The age and gender standardized rates of all types of disability with assistance, including institutional residence, fell in prevalence, whereas the nondisabled and persons who are independent with equipment rose in prevalence. Spending trends differed for those with less severe and more severe disability. Persons independent with equipment and persons receiving only IADL help had higher Medicare per capita spending than if disability rates had not changed, while the two more highly disabled groups became relatively less expensive for Medicare than under the counterfactual. Thus, the trends in spending for persons receiving ADL help in the community or living in institutions--roughly 60 percent of persons with disability in each year--appear to drive the downward trend in spending for the disabled as a group. The spending gaps between the two less disabled groups and the nondisabled group also widened relative to the counterfactual, while gaps for the two more disabled groups narrowed.
The service detail in Table 5 shows that in 1999, relative to the counterfactual, persons independent with equipment had higher per capita spending for all services except Part B services, and persons receiving only IADL help had higher per capita spending for all services. The converse was true for the more disabled groups. In 1999, persons receiving ADL help were less expensive than the counterfactual for all but SNF care and institutionalized persons were less expensive for all services.
Trends in spending for individual services used by each disability group are more mixed, although potentially suggestive of poorer or less stable health among community residents, particularly the two less disabled groups. For example, for persons independent with equipment, spending appears to have consistently increased relative to the counterfactual only for hospital and SNF care (Figure 11a), while for persons receiving help only with IADLs, consistent increases relative to the counterfactual occurred only for hospital and home health care (Figure 11b).
The trends by service are most mixed for persons with ADL help, for whom both hospital and SNF spending appear to have increased relative to the counterfactual, as home health spending decreased between 1994 and 1999 (Figure 11c). This would seem to suggest the possibility of service use changes resulting from the imposition of the IPS for home health, although such changes have not been found in research focused on home health users (McCall et al. 2003). Persons in institutions became progressively less expensive for inpatient hospital, Part B, and home health services, relative to the counterfactual (Figure 11d), and for SNF services after 1994. (It should be recalled that institutional residence is determined at interview, while spending is for the year following interview, during which some institutional residents may have returned to the community and received home health care there.)
Changes in Age, Gender, and Disability Experience
Consistent with the small magnitudes of changes seen for spending, changes in the composition of the nondisabled and disabled population are small relative to the counterfactual, but in accord with the direction of the spending changes (Table 6). Both the nondisabled and the disabled are slightly older than if the disability rate had not changed, but the impact is larger for the disabled. The significance of age shifts for spending are different for the two groups because spending rises with age for the nondisabled, but falls with age for the disabled.
The disabled also are more likely to be women than if disability rates had not changed, and spending per capita is lower for women than for men, both by age and for persons with no previous disability among both the nondisabled and the disabled.8 This primarily reflects two factors. First, men are have higher mortality at each age and to have the greater health care costs associated with the end of life. Second, women are much more likely to be institutionalized, which, as seen, is associated with lower Medicare spending. These spending patterns by gender are consistent with those found by Bhattacharya et al. (2004) using other data sources.
It is also interesting to note that persons formerly but not currently disabled are twice as expensive as persons with no previous history of disability, although there was no change in the prevalence of this group relative to the counterfactual. This would seem to be evidence that recovery from disability as measured on the NLTCS is not associated with lower Medicare spending. In contrast, for the disabled, per capita spending for all persons and especially for men appears to be higher for persons first identified as disabled in the current survey round than for persons who have prior history of disability, but differences are not significant.9
Compositional changes by disability type also are in accord with observed changes in spending, although rarely statistically significant. For persons independent with equipment, the only significant compositional change is an upward shift in the age distribution relative to the counterfactual, although the percent previously disabled, the percent who are women, and the spending associated with each group appear to move in the direction consistent with the higher spending observed for this group. For persons receiving help with only IADLs, neither compositional changes nor spending increases relative to the counterfactual are significant, although all spending differences are positive. For persons receiving ADL help, only the increase in the proportion who are women, with lower average spending, was significant. All changes in spending relative to the counterfactual also are negative but not significant. For institutional residents, none of the apparent compositional changes are statistically significant, although again, they are in the direction of reduced spending associated with increased proportions persons age 85 or older, previously disabled, and women. Finally, although the proportion of each group with no prior disability--roughly 70 percent of the two less disabled groups and 60 percent of the two more disabled groups--was higher in 1999 than in 1989, there was a consistent upward trend only for persons with help only with IADLs.
IMPLICATIONS FOR FUTURE SPENDING
Although both total and per capita spending fell between 1984 and 1999 relative to what would have been expected had disability rates not declined, underlying trends in spending and population composition confirm heterogeneity that would not be captured by simple projections of future spending based on aggregate disability rates. Although magnitudes were for the most part small, and in fact, not statistically significant, the direction of changes was consistent. When the NLTCS samples were standardized to the 1999 age and gender distribution, relative to counterfactual estimates of spending if disability rates had not changed:
-
As a group, the nondisabled, who made up an increasing proportion of the older population, became more expensive on a per capita basis.
-
Spending for persons with chronic disability fell progressively, so that the gap in spending between the disabled and nondisabled progressively narrowed.
-
These spending patterns were observed for all of the four major service areas examined.
Within the disabled population:
-
The two least expensive groups--persons managing their disability with only equipment, a group increasing in prevalence, and persons with help only with IADLs, a group with falling prevalence--became more expensive.
-
The two most costly groups--persons who received help with ADLs or were institutionalized, whose age-adjusted prevalence has fallen--became less expensive.
-
Increases in hospital, SNF, and home health use for the two less disabled groups, relative to the counterfactual, may indicate poorer or less stable health owing to changes in the composition of these groups.
To investigate the potential implications of these patterns for forecasts of future spending, projections for the period from 1999 through 2019 were made, using two alternative assumptions about disability trends and three alternative assumptions about trends in Medicare spending. The projections are intended more to examine the importance of assumptions about how disability and spending patterns will change than to forecast actual future Medicare spending.
Disability Trend Assumptions
The first disability trend assumption is that the aggregate age and gender standardized disability rate continues to decline at the historic rate of 1.4 percent per year (Table 8). Under this assumption, by 2019, the aggregate standardized disability rate would be 14.8 percent. Although often used, this assumption by its nature ignores underlying disability trends and therefore carries with it no information about how the composition of the disabled population might change over time.
The alternative assumption is that each type of disability would continue to change at its historic age and gender standardized rate. Under this assumption, the standardized disability rate would be 17.8 percent in 2019, an average decline over the entire period of only 0.5 percent per year. In fact, the disability rate would decrease at a decreasing rate under this assumption and the aggregate trend would actually reverse by the end of the next five-year period, rising to 18.1 percent (not shown).
The composition of the chronically disabled population in 2019 also would be dramatically different under this assumption. The proportion independent with equipment would double from 19 percent in 1999 to 38.4 percent by 2019, the proportion with IADL disability would be reduced by half, and the proportion with ADL disability or institutionalized would fall from about 60 percent to slightly more than half of the older population with disability.
Spending Assumptions
Three spending assumptions are used to examine the impact of heterogeneity in service use and spending by type of disability on projections (Table 9). NLTCS Medicare spending data were used to generate the rates of change in per capita spending by disability used in the projections. The period over which historical annual rates of change were measured was limited to the period 1989-1999. This choice was made primarily to average out some of the short run impacts of the BBA by capturing part but not all of the period prior to its implementation. No projections of Medicare spending per capita by the older population--let alone age and gender standardized per capita spending--could be found against which to compare rates generated by the data. Even so, total spending and all services except SNF yielded rates of growth reasonably in accord with those projected by CMS actuaries for Medicare spending by enrollees of all ages (Heffler et al. 2005). The NLTCS computed annual growth rate for SNF spending over the period was about twice the CMS forecast of 6 percent long-range growth. In addition, it will be recalled that the NLTCS spending data track published CMS data for aged beneficiaries closely, so that the growth rates are similar to rates that can be calculated from CMS statistics for all elderly enrollees.
The first spending assumption is the simplest--that total spending per capita by the nondisabled and the disabled as a group increases at the historical rates for each group. Under this assumption, spending for the nondisabled increases at 7 percent per year, spending for the disabled increases at 7.6 percent per year, and relative spending by the disabled increases slightly over the period.
The second assumption is that spending by service will increase at the historical rate for the nondisabled and disabled, respectively. In this assumption, projections of per capita spending for the nondisabled and disabled are made for each service and summed to projected total spending per capita. When individual services are taken into account, the growth rate in total spending increases more for the nondisabled between 1999 and 2019, so that average annual growth over the period is 8 percent for each. Relative spending is essentially unchanged.
The final spending assumption is that total per capita spending by persons with each type of disability will continue to grow at historical rates. Thus, this assumption captures differences in the spending trends by type of disability seen in Table 6. In order to combine the spending trends by disability type into projected total spending by the disabled, a weighted average was constructed using the proportions with each disability type from the second disability trend methodology. Under this assumption relative spending by the disabled increases from about 2.4 in 2004 to 2.9 in 2019.
Because the first disability trend assumption changes only the aggregate rate, ignoring underlying trends, it implicitly scales each of the underlying trends so that together they result in a 1.4 percent per year decline. Combining this disability assumption with the final spending assumption has the affect of dampening the upward trend in prevalence and spending associated with persons who are independent with equipment and accelerating the downward trends in the three types of disability with assistance, which, in turn amplifies associated reductions in Medicare costs.
Projection Results
Table 10 provides the results of the projections of age and gender standardized spending per capita. The first panel shows the counterfactual estimates for each assumption about spending changes, assuming a constant age and gender standardized disability rate, as a base for considering the impact of different assumptions about how disability rates may change. The second panel shows estimates for the first disability assumption, that age and gender standardized aggregate disability continues to decline at 1.4 percent per year. Estimates in their third panel shows estimates for the second disability assumption, that the standardized rates of change in the four underlying disability types continue, generating a 0.5 percent per year decline. The first row of each panel provides a simple projection of per capita Medicare spending for all persons, ignoring disability.
Focusing first on the baseline estimate ignoring disability in the first panel, all more granular assumptions about how per capita spending will change that take disability into account result in progressively higher estimates than a simple projection of per capita spending for all persons using the historical rate of growth in total spending per capita. Projecting per capita spending for the nondisabled and disabled, ignoring compositional changes in either service mix or distribution by disability type (Spending Method 1), has the most modest effect, resulting in estimates about 5 percent higher by 2019. Allowing for differences in per capita spending by service for the nondisabled and the disabled (Spending Method 2) has the greatest effect, increasing estimates by 2019 more than 20 percent over estimates ignoring disability. The impact of taking only changes in the composition of the disabled population into account (Spending Method 3) is intermediate, raising spending estimates by about 9 percent by 2019 relative to estimates ignoring disability.
This general relationship also holds for both disability assumptions (Panels 2 and 3), with estimates taking spending by service into account generating the highest estimates and the smallest percentage savings relative to the first panel estimates assuming constant standardized disability rates. By 2019, savings to Medicare under the assumption of a continuing 1.4 percent decline in aggregate disability would be modest, ranging from about 5 percent for estimates taking into account changes in spending composition to nearly 7 percent for estimates taking into account changes in the disability profile of the disabled population. As noted, Spending Method 3, when combined with the constant 1.4 percent decline in the aggregate disability rate preserves the direction of the underlying trends by type of disability but dampens the upward trend in disability managed solely with equipment and the associated upward trend in spending for this group and accelerates the downward trend in disability with help and the declines in spending associated with the majority of the group receiving help.
Savings under the assumption of a 0.5 percent per year disability decline, based on the unconstrained underlying trends by type of disability, are less than half those under the constant aggregate 1.4 percent decline assumption for all spending assumptions. Savings by 2019 for the 0.5 percent per year assumption range from just under 2 percent for estimates taking spending by service into account to 2.6 percent for estimates taking disability composition into account.
Thus to summarize, not surprisingly, savings are greater for the larger decline in disability. For both disability assumptions, taking changes in the composition of spending into account results in the largest standardized per capita spending estimates, whereas taking changes in the composition of disability into account generates more modest increases but larger percentage savings. In absolute terms, savings per person are very similar for spending assumptions 1 and 2 and somewhat higher when changes in disability composition are taken into account--nearly $1,500 for the 1.4 percent decline by 2019 and more than $500 for the 0.5 percent decline.
Impacts of Population Aging
Future spending will depend not only on standardized disability trends, but also in complex ways on the impact of trends in age of the older population on both disability and spending. Aging of the population is associated with higher disability rates, because disability rises with age even if overall rates are declining. However, as seen in Table 6, upward shifts in the age distribution are associated with higher Medicare spending for the nondisabled but appear to moderate spending among persons with disability.
Over the 20 years covered by the spending projections, the age distribution of the older population will change significantly, according to projections from the Bureau of the Census.10 The aging of the Baby Boom generation will have more dramatic impacts during the period than increasing longevity among the current elderly (Figure 12). After 2004, as the youngest Baby Boomers begin to enter Medicare, the proportion of the older population who are age 65-74, for whom disability is relatively rare, rises, while the population age 85 or older, for whom disability is relatively common, rises through 2009 and then falls slightly.
The impact of these age composition changes on disability is to moderate the impacts of declining standardized rates under either disability assumption through 2009 (Figure 13). Actual rates are higher throughout than standardized rates under the assumption that standardized disability declines at 1.4 percent per year, although the difference between standardized and actual rates falls as the age distribution shifts toward younger ages. For the assumption of a standardized 0.5 percent per year decline, the actual disability rate falls slightly below the standardized rate by 2019. In fact, even under the assumption of a constant standardized 19.7 percent disability rate, changes in the age and gender distribution would cause the actual disability to fall to 19.1 percent of the older population in 2019.
Table 11 shows the combined impacts on projected spending of changes in the composition of the population and changes in the age and gender standardized disability rates. It is clear that the influx of the Baby Boom generation, which ultimately will dramatically increase the disabled population as it ages, has a moderating impact on Medicare spending through 2019. Actual costs under all assumptions are slightly higher in 2004 and 2009 than standardized estimates, and lower thereafter as the age distribution shifts downward.
Two observations are particularly noteworthy. First, although the assumption of a 1.4 percent per year standardized disability decline still yields higher savings than the alternate assumption when changes in population composition are taken into account, these savings are lower than standardized estimates in both absolute and percentage terms for all spending assumptions. Savings range from 3.6 percent to 5.5 percent, compared with 5 percent to nearly 7 percent for standardized estimates. The reverse is true for the 0.5 percent per year assumption taking disability composition into account, for which savings increase to a range of 3.4 percent to nearly 4 percent, compared with the range of 1.9 percent to 2.6 percent for standardized estimates. As a result, both projected spending and projected savings are more similar for the two assumptions than the standardized estimates were. In fact, when changes in the future age and gender composition of the population is taken into account, the assumptions yield very similar conclusions for the second spending assumption, which takes changes in service mix into account.
The second observation is that the first panel projections assuming a constant standardized disability rate continue to be larger than a naïve projection of per capita Medicare spending for all persons. These differences tend to be larger than for the standardized estimates and increase over time. The exception is the third assumption, which projects spending by type of disability. For this spending assumption, differences are smaller in 2014 and 2019. For both assumptions about disability decline, however, spending estimates taking either aggregate disability or disability by type into account are much more similar to the naïve projections. In other words, the gains--assuming that the estimates taking disability into account are better projections--are relatively small. On the other hand, estimates taking spending by service into account continue to be substantially higher than a naïve projection for both disability assumptions, which, as noted, yield very similar spending and savings results for this spending assumption.
SUMMARY AND DISCUSSION
The Medicare spending patterns observed in the NLTCS appear to indicate subtle changes in both service use and composition of the nondisabled and disabled population, as well as for subgroups of the disabled population defined by type of activity and use of assistance. Specifically, as seen, when the population is standardized to the 1999 age and gender distribution, both persons without disability and those able to manage disabilities solely with equipment or requiring help only with IADLs appear to have become steadily more expensive for Medicare on a per capita basis than if disability not declined. The reverse was true for persons with more severe disability, defined here as requiring ADL help or being institutionalized, who appear to have become less expensive. As a result of these patterns, the gap in spending between the nondisabled, the disabled as a whole, and for persons with more serious disability progressively narrowed, while the spending gap for persons with less serious disability widened slightly, relative to the counterfactual if disability rates had not changed. The direction of changes in spending relative to the counterfactual also was observed for the four major service categories examined, hospital, Part B, SNF, and home health.
Although the differences observed were small, and counterfactual estimates were well within two standard errors of counterfactual estimates, other research published since this study began reports similar findings. Chernew et al. (2005), using data from the Medicare Current Beneficiary Survey (MCBS) for 1992-2000, found that composition of the population and treatment intensity resulted in faster growth in total spending, including Medicare spending, cost-sharing, and other self-reported spending, among persons without disability and with only IADL disability. Moreover, spending growth fell as the number of ADL disabilities rose. As a result, spending ratios for the disabled fell relative to the nondisabled fell, as found in this study.
The current study also found changes in the composition of the older population consistent with the spending patterns. Specifically, there was an upward shift in the age distribution of both the nondisabled and the disabled populations in 1999, relative to the distribution if disability had not declined. For the nondisabled, this was associated with greater per capita spending, but for the disabled, per capita spending fell with age. There also was an increase in the proportion of the disabled who were women, and women also had lower per capita spending than men in 1999. This finding is consistent with findings from the MCBS (Bhattacharya et al. 2004) and with findings for Medicare spending in the final years of life for decedents of very advanced age using Medicare claims histories (Shugarman et al. 2004; Spillman and Lubitz 2000). Goldman et al. also found changes in the disease profiles of the nondisabled and the disabled, with larger increases in self-reported heart disease and diabetes among the nondisabled, consistent with their findings of increased spending by the nondisabled.
Projections of spending for the 20 years from 1999 to 2019 were made using two assumptions about future declines in disability, one assuming that declines would continue at the aggregate age and gender standardized rate of 1.4 percent per year observed between 1984 and 1999, and the other assuming that the rate of aggregate decline would be determined by continued trends for underlying disability types, specifically, increases in disability managed solely with equipment, decreases in IADL disability and smaller declines in ADL assistance and institutional residence. The second assumption resulted in a standardized aggregate disability rate decline of only 0.5 percent per year.
For an age and gender standardized population, savings to the Medicare program, relative to the counterfactual that 1999 disability rates persisted, were largest, not surprisingly, for the first assumption, ranging from 5 percent to nearly 7 percent in 2019. For the 0.5 percent per year decline determined by projecting trends in underlying types of disability, standardized savings were 2 percent to 2.6 percent. Projecting spending by service for the nondisabled and the disabled forecast the highest costs and the smallest savings, whereas projecting total per capita spending by type of disability forecast intermediate costs and the largest savings.
Projections allowing the age and gender distribution to change as projected by the Census for the relevant period revealed two particularly interesting observations. First, both actual disability rates and increases in per capita spending would be moderated between 2009 and 2019 as the Baby Boom generation begins to enter Medicare, even with no change in disability, although, of course, this influence will begin to reverse after 2019 as the earliest cohorts pass age 75.
Second, the change in age composition will reduce savings projected for the larger standardized disability decline assumption and increase savings for the smaller decline. The projected changes in the age and gender distribution reduce projected savings accruing to the larger aggregate decline to a range of 3.6 percent to 5.5 percent by 2019, but increase savings to a range of 3.4 percent to 3.9 percent for the smaller decline. In fact, spending and savings forecasts based on trends for individual services rather than total per capita spending for the nondisabled and disabled were immaterially different for the two disability assumptions. This suggests the importance of changes in service mix in determining the magnitude of beneficial impacts from disability declines.
The results also provide further evidence that the link between disability declines, better health, and lower Medicare spending is complex. If persons who do not report chronic disability and persons who manage all disabilities with equipment continue to become relatively more expensive for Medicare and continue to increase in prevalence, Medicare savings from declining spending and prevalence of more serious disability requiring long-term care would be offset to some extent. Among the nondisabled, persons with a prior history of disability were found to be nearly as expensive for Medicare as the currently disabled and far more expensive than persons reporting no current or prior disability. Although this group is quite small and showed no consistent growth between 1984 and 1999, this suggests that recovery from disability and recovery of health are not synonymous, at least as measured by Medicare spending.
Finally, controlling for age and gender, both hospital and post-acute spending were higher for persons with less serious disability than they would have been for persons with these disability profiles in the past. It is possible that this indicates environmental improvements that allow more independent function--or even no perception of disability--among persons with medical conditions associated with higher costs. It is also possible that such improvements have reduced the ability to measure disability consistently over time, so that some of the declines observed reflects measurement error rather than improvements in physical functioning, further confounding the ability to use reductions in disability rates as a proxy for improved population health (Cornman, Freedman, and Agree 2005).
In the current policy and demographic climate, with the retirement of the Baby Boom looming, there is considerable pressure to assess implications of disability declines for public program costs and particularly for Medicare. In fact, the period covered by the projections in this study stops just short of the aging of the early Baby Boom cohorts into ages where disability rates are high. However, the findings in this study and others highlight the importance of more critical thinking about where research should focus in order to understand causes of disability rate declines and the importance of observed declines in current disability for future health costs.
REFERENCES
Bhattacharya, J, D Cutler, DP Goldman, MD Hurd, GF Joyce, DN Lakdawalla, CWA Panis, and B Shang. 2004. Disability forecasts and future Medicare costs. Frontiers in Health Policy Research 7:74-94.
Call, KT, B Dowd, R Feldman, and M Maciejewski. 1999. Selection experiences in Medicare HMOs: Pre-enrollment expenditures. Health Care Financing Review 20(4):197-209.
Centers for Medicare and Medicaid Services. 2002. Program Information on Medicare, Medicaid, SCHIP, and Other Programs of the Centers for Medicare and Medicaid Services, Section III.D. Medicare Spending and Utilization by Service Sector. (http://www.cms.hhs.gov/charts/series/sec3-D.ppt#1)
Chernew, ME, DP Goldman, F Pan, and B Shang. 2005. Disability and health care spending among Medicare beneficiaries. Health Affairs Web Exclusive W5(September 26, 2005):R42-R52.
Cornman, JC, VA Freedman, and EM Agree. 2005. Measurement of assistive device use: Implications for estimates of device use and disability in late life. The Gerontologist 45(3):347-358.
Crimmins, E, and Y Saito. 2000. Change in the prevalence of diseases among older Americans: 1984-1994. Demographic Research 3(9). Available at http://www.demographic-research.org/Volumes/Vol3/9 (accessed November 2003).
Freedman, VA, H Aykan, and L Martin. 2001. Aggregate changes in severe cognitive impairment among older Americans: 1993 and 1998. Journals of Gerontology: Social Sciences 56B(2):S100-11.
Freedman, VA, E Crimmins, RF Schoeni, BC Spillman, H Aykan, E Kramarow, K Land, J Lubitz, K Manton, LG Martin, D Shinberg, and T Waidmann. 2004. Resolving inconsistencies in old-age disability trends: Report from a Technical Working Group. Demography 41(3):417-441.
Freedman, VA, and LG Martin. 2000. The contribution of chronic conditions to aggregate changes in old-age functioning. American Journal of Public Health 90:1755-60.
Freedman, VA, and LG Martin. 1998. Understanding trends in functional limitations among older Americans. American Journal of Public Health 88:1457-62.
Freedman, VA, LG Martin, and RF Schoeni. 2002. Recent trends in disability and functioning among older Americans: A critical review of the evidence. Journal of the American Medical Association 288:3137-46.
Heffler, S, S Smith, S Kehan, C Borger, MK Clemens, and C Truffer. U.S. health spending projections for 2004-2014. Health Affairs Web Exclusive 5(February 23, 2005):74-85.
Hellinger, FJ, and HS Wong. 2001. Selection bias in HMOs: a review of the evidence. Medical Care Research and Review 57(4):405-39.
Institute of Medicine. 1991. Disability in America: Toward a National Agenda for Prevention. Andrew M. Pope and Alvin R. Tarlov, eds. Washington, DC: National Academy Press.
Komisar, H, J Hunt-McCool, and J Feder. 1997. Medicare spending for elderly beneficiaries who need long-term care. Inquiry 34(4):302-10.
Manton, KG, and X Gu. 2001. Changes in the prevalence of chronic disability in the United States black and nonblack population above age 65 from 1982 to 1999. Proceedings of the National Academy of Sciences 98:6354-9.
McCall, N, J Korb, A Petersons, and S Moore. Constraining Medicare home health reimbursement: What are the outcomes? Health Care Financing Review 24(2):58-76.
Mello, M, SC Stearns, EC Norton, and TC Ricketts III. 2003. Understanding biased selection in Medicare HMOs. Health Services Research 38(3):961-992.
Nagi, S. 1965. Some conceptual issues in disability and rehabilitation. In Sociology and Rehabilitation, M.B. Sussman, ed. Washington, DC: American Sociological Association.
Saucier, P, L Bezanson, M Booth, J Bratesman, SJ Fralich, D Gilden, E Goldstein, D OConnor, C Perrone, and K Willrich. 1998. Linked data analysis of dually eligible beneficiaries in New England." Health Care Financing Review 20(2):91-108.
Schoeni, RF, VA Freedman, and RB Wallace. 2001. Persistent, consistent, widespread, and robust? Another look at recent trends in old-age disability. Journal of Gerontology: Social Sciences 56B:S206-S218.
Singer, BH, and KG Manton. 1998. The effects of health changes on projections of health service needs for the elderly population of the United States. Proceedings of the National Academy of Science 95:15618-22.
Spillman, BC. 2004. "Changes in elderly disability rates and the implications for health care utilization and cost. The Milbank Quarterly 82(1):157-194. (http://aspe.hhs.gov/daltcp/reports/hcutlcst.htm)
Waidmann, TA and K Liu. 2000. Disability trends among elderly persons and implications for the future. Journals of Gerontology: Social Sciences 55B:S298-307.
Waidmann, TA, and KG Manton. 1998. International Evidence on Trends in Disability among the Elderly. Report for the U.S. Department of Health and Human Services, Assistant Secretary for Planning and Evaluation, Office of Disability, Aging and Long-Term Care Policy. Available at http://aspe.hhs.gov/daltcp/reports/trends.htm.
NOTES
-
Clinical lab files also are provided for 1991-1994. They were excluded because they duplicated claims in Part B physician/supplier files, a finding confirmed by the CMS-funded Research Data Assistance Center. Because the hospice benefit did not begin until late 1983, there were no hospice claims in the 1984 analysis period and few in 1989. Hospice is included in total spending but not analyzed separately.
-
The initial intent was to construct a one-year analysis period for each individual beginning on the individuals interview date. The earliest interview data in each survey year was selected as an alternative because interview date was missing for a substantial proportion of the 1994 sample. Because interviews occur over a period of only a few months in each survey year, and most occur early in that period, this should not seriously affect the validity of the baseline disability measure.
-
The exception to comparability over time is Part B physician visit spending for the 1984-85 and 1989-90 analysis periods. In the MADRS files, payment records for office visits are annual summaries rather than individual records with service dates. All other Part B records in those years are itemized with service dates, allowing relevant records to be selected in the same way as for the 1994 and 1999 analysis periods. Based on the observation that in the aggregate office visits are roughly uniform across the year, a decision was made to apportion calendar year physician visit spending for the 1984 and 1989 analysis periods according to the proportion of the analysis year falling within each calendar year.
-
For example, CMS inpatient hospital spending in 1984 includes estimates of prospective payment system passthrough expenditures for costs such as direct medical education not included in the prospective payment system, whereas no such qualification was found in notes for CMS inpatient hospital spending in other years.
-
Calculated from CMS statistics on the age distribution of beneficiaries (http://www.cms.hhs.gov/charts/series/sec3-b1-9.pdf) and managed care enrollment by age (http://www.cms.hhs.gov/charts/series/sec3-a.pdf) in 2000.
-
It should be noted that the apparent decline in the number of FFS enrollees with chronic disability in Table 1 is the result of the rising proportion in managed care and therefore excluded from the analysis. When all enrollees are included, the number of persons with chronic disability rose from about 6.2 million to about 6.8 million over the 1984-1999 period despite the decline in the disability rate.
-
Changes in utilization, at least as indicated by the gross measure of whether any services were used, do not explain the differences in trend in per capita spending relative to the counterfactual (not shown). The proportion using any Medicare services increased steadily for both the disabled and nondisabled and was essentially unchanged form use rates with no change in disability. As a result, spending per Medicare service user follows the same pattern as spending per capita, with the disabled becoming less expensive relative to the nondisabled, although still more than twice as costly.
-
Estimates for the previously disabled by gender are not statistically different reflecting small sample size among the nondisabled and, most likely, heterogeneity in previous disability experience among both the nondisabled and the disabled.
-
About 35 percent of persons not chronically disabled on the 1999 NLTCS had no previous survey experience and thus no opportunity to report prior disability experience. More than 90 percent of these cases were age 70 or younger, where disability rates are low, however, Thus, it seems likely that any understatement of previous chronic disability is small.
-
Population Projections of the United States by Age, Sex, Race, Hispanic Origin, and Nativity: 1999 To 2100, Middle Series, Population Projections Program, Population Division, U.S. Census Bureau, Washington, D.C.: January 19, 2001 (http://www.census.gov/population/www/projections/natdet-D1A.html).
| FIGURE 1. Medicare Total Spending, Enrollees Age 65+: CMS Data and NLTCS 1984-1999 |
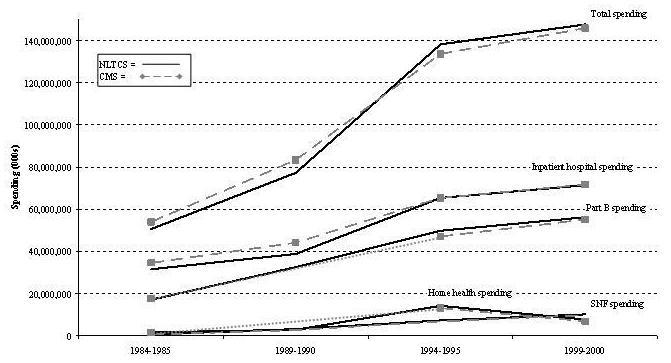 |
| FIGURE 2. Medicare Spending Per Enrollee Age 65+: CMS Data and NLTCS 1984-1999 |
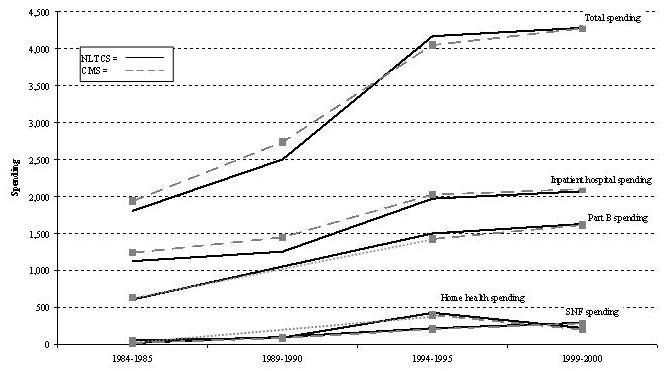 |
| FIGURE 3. Age Comparison, All Medicare Elderly and FFS Only |
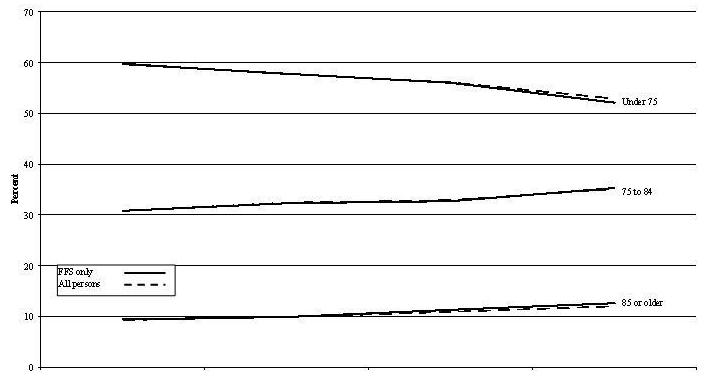 |
| FIGURE 4. Disability Comparison, All Medicare Elderly and FFS Only |
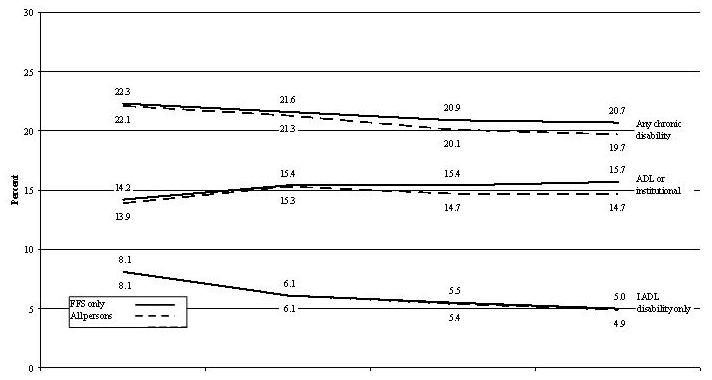 |
| FIGURE 5. FFS Disability Rate, Impact of Age and Gender Standardization |
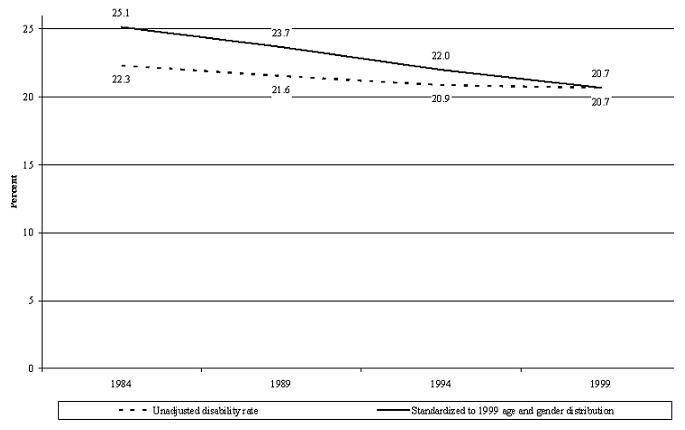 |
| FIGURE 6. Total Medicare Spending, Impact of Age and Gender Standardization |
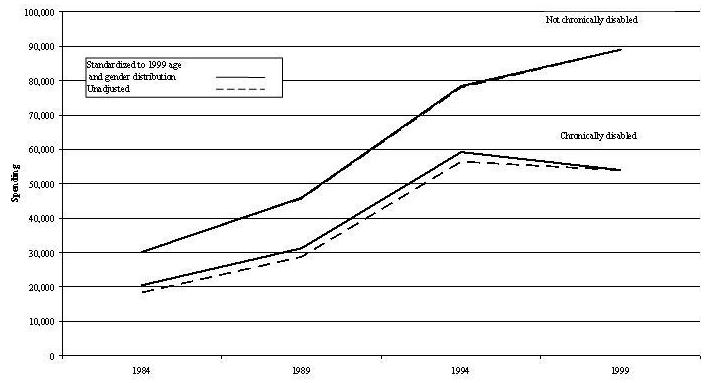 |
| FIGURE 7. Per Capita Medicare Spending, Impact of Age and Gender Standardization |
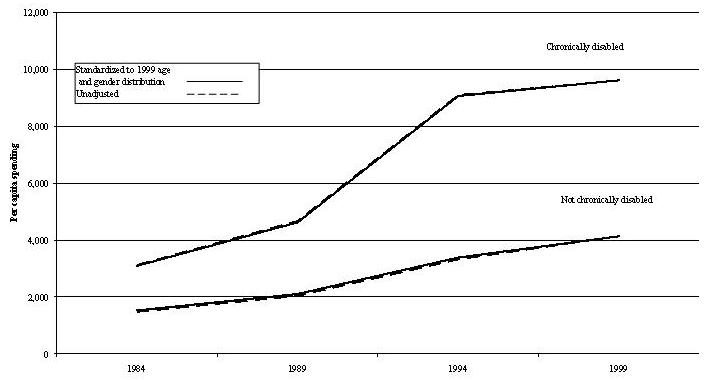 |
| FIGURE 8. Percentage Change in Per Capita Medicare Spending Due to Disability Decline |
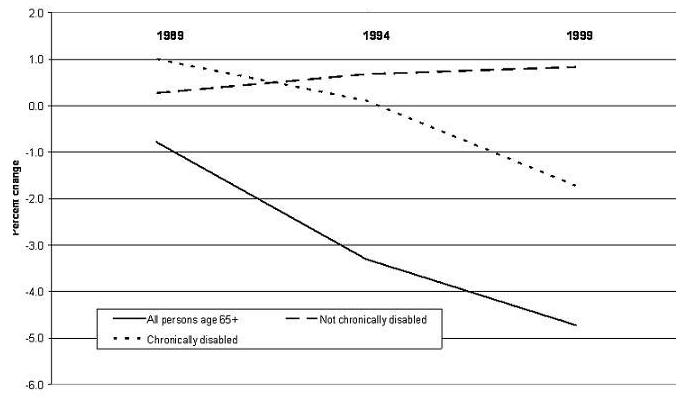 |
| FIGURE 9. Disability Trend by Type(1999 age and gender standardized) |
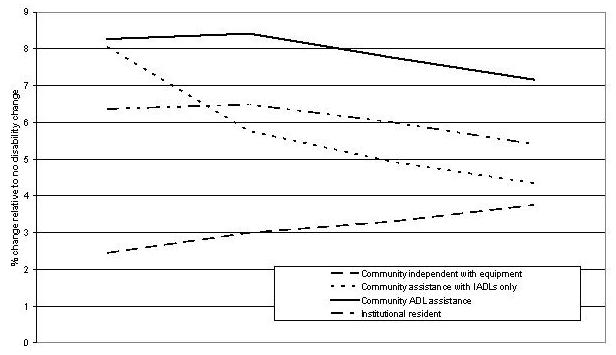 |
| FIGURE 10. Percentage Change in Per Capita Medicare Spending Due to Disability Decline |
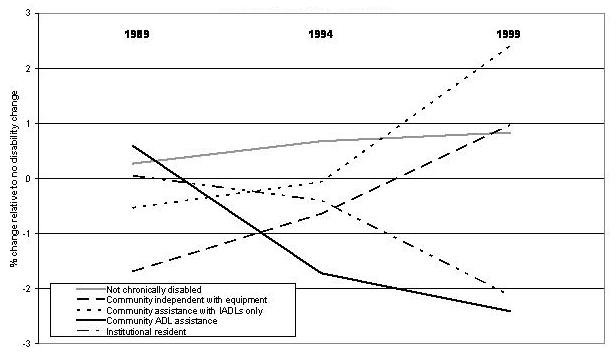 |
| FIGURE 11a. Equipment Only, Per Capita Spending by Service, Relative to Counterfactual |
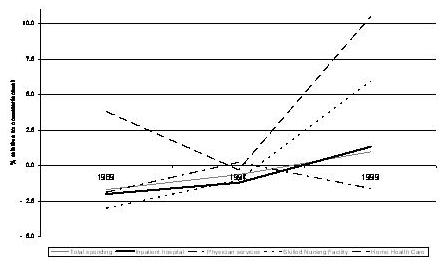 |
| FIGURE 11b. IADL Help, Per Capita Spending by Service, Relative to Counterfactual |
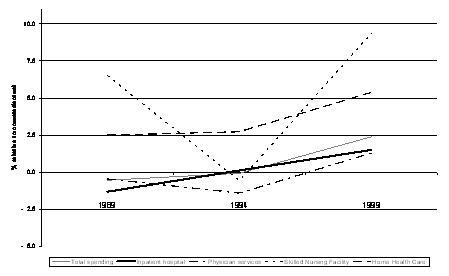 |
| FIGURE 11c. ADL Help, Per Capita Spending by Service, Relative to Counterfactual |
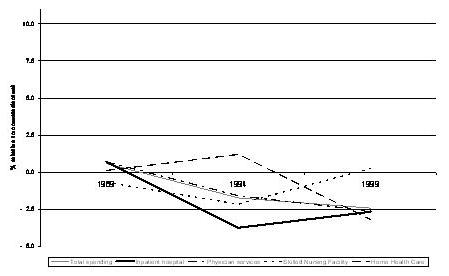 |
| FIGURE 11d. Institutional, Per Capita Spending by Service, Relative to Counterfactual |
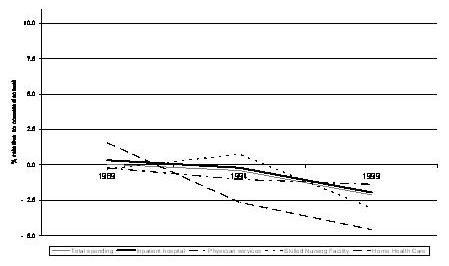 |
| FIGURE 12. Projected Change in Age Distribution, Persons Age 65 or Older, 1999-2019 |
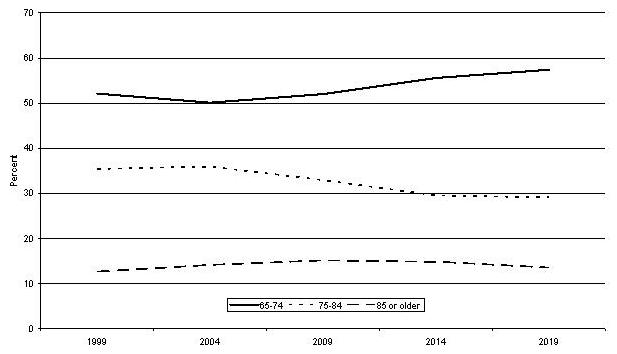 |
| FIGURE 13. Impact of Aging on Projected Actual Disability Rate, Persons Age 65 or Older |
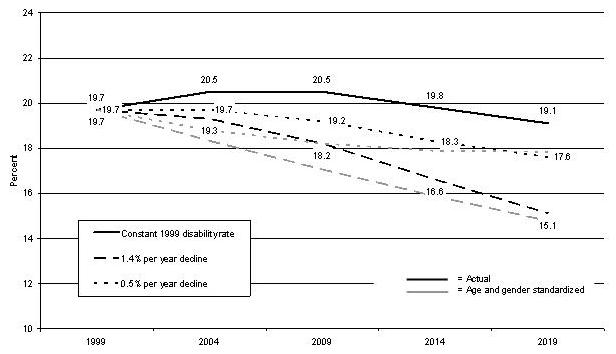 |
| TABLE 1. Medicare Spending by Chronic Disability 1984-1999 | |||||||
| 1984 | 1989 | 1994 | 1999 | Percent Change Due to Change in Disability Rate | |||
| 1989 | 1994 | 1999 | |||||
| FFS ENROLLEES | 26,392,451 | 28,568,439 | 29,724,552 | 27,165,941 | --- | --- | --- |
| Not chronically disabled | 19,756,211 | 21,806,358 | 23,182,427 | 21,547,715 | 2.0 | 4.2 | 6.0 |
| Chronically disabled | 6,636,240 | 6,762,081 | 6,542,125 | 5,618,226 | -5.9 | -12.5 | -17.8 |
| ANNUAL MEDICARE SPENDING (millions) | |||||||
| All persons age 65+ | 50,688 | 77,205 | 137,667 | 143,005 | -0.8 | -3.3 | -4.7 |
| Not chronically disabled | 30,157 | 45,954 | 78,434 | 89,030 | 2.2 | 4.9 | 6.8 |
| Chronically disabled | 20,531 | 31,251 | 59,233 | 53,975 | -4.9 | -12.4 | -19.2 |
| PER CAPITA MEDICARE SPENDING | |||||||
| All persons age 65+ | 1,921 | 2,702 | 4,631 | 5,264 | -0.8 | -3.3 | -4.7 |
| Not chronically disabled | 1,526 | 2,107 | 3,383 | 4,132 | 0.3 | 0.7 | 0.8 |
| Chronically disabled | 3,094 | 4,622 | 9,054 | 9,607 | 1.0 | 0.1 | -1.7 |
| Relative spending by chronically disabled | 2.0 | 2.2 | 2.7 | 2.3 | 0.7 | -0.6 | -2.5 |
| TABLE 2. Per Capita FFS Medicare Spending and Relative Spending by Disability and Type of Spending 1984-1999, Standardized by Age and Gender | |||||||
| 1984 | 1989 | 1994 | 1999 | Percent Change Due to Change in Disability Rate | |||
| 1989 | 1994 | 1999 | |||||
| PER CAPITA MEDICARE HOSPITAL SPENDING | |||||||
| All persons age 65+ | 1,195 | 1,351 | 2,171 | 2,536 | -0.8 | -2.9 | -4.3 |
| Not chronically disabled | 950 | 1,057 | 1,689 | 2,050 | 0.3 | 0.7 | 0.7 |
| Chronically disabled | 1,925 | 2,297 | 3,877 | 4,402 | 0.8 | -0.5 | -1.9 |
| Relative spending by chronically disabled | 2.0 | 2.2 | 2.3 | 2.1 | 0.4 | -1.2 | -2.6 |
| PER CAPITA MEDICARE PART B SPENDING | |||||||
| All persons age 65+ | 641 | 1,131 | 1,662 | 2,022 | -0.7 | -2.0 | -2.8 |
| Not chronically disabled | 543 | 968 | 1,416 | 1,777 | 0.1 | 0.2 | 0.5 |
| Chronically disabled | 932 | 1,657 | 2,534 | 2,964 | 0.2 | -0.2 | -1.5 |
| Relative spending by chronically disabled | 1.7 | 1.7 | 1.8 | 1.7 | 0.1 | -0.5 | -2.0 |
| PER CAPITA MEDICARE SNF SPENDING | |||||||
| All persons age 65+ | 23 | 114 | 248 | 356 | -0.1 | -5.7 | -9.0 |
| Not chronically disabled | 10 | 32 | 86 | 173 | 1.8 | 3.5 | 4.6 |
| Chronically disabled | 60 | 380 | 820 | 1,059 | 5.1 | 2.9 | -0.5 |
| Relative spending by chronically disabled | 5.9 | 11.9 | 9.5 | 6.1 | 3.2 | -0.5 | -4.9 |
| PER CAPITA MEDICARE HOME HEALTH SPENDING | |||||||
| All persons age 65+ | 62 | 101 | 490 | 274 | -1.3 | -7.1 | -13.0 |
| Not chronically disabled | 23 | 45 | 164 | 106 | 1.1 | 2.7 | 2.7 |
| Chronically disabled | 177 | 281 | 1,643 | 915 | 2.6 | 1.4 | -2.9 |
| Relative spending by chronically disabled | 7.6 | 6.3 | 10.0 | 8.6 | 1.4 | -1.2 | -5.4 |
| TABLE 3. Medicare Acute Care Utilization 1984-1999, Standardized by Age and Gender | |||||||
| 1984 | 1989 | 1994 | 1999 | Percent Change Due to Change in Disability Rate | |||
| 1989 | 1994 | 1999 | |||||
| INPATIENT HOSPITAL UTILIZATION | |||||||
| PERCENT USING INPATIENT HOSPITAL SERVICES | |||||||
| All persons age 65+ | 22.2 | 20.2 | 21.0 | 21.5 | -1.2 | -2.3 | -3.6 |
| Not chronically disabled | 18.1 | 16.3 | 16.9 | 17.4 | 0.4 | 0.7 | 1.1 |
| Chronically disabled | 34.5 | 32.9 | 35.7 | 37.4 | -0.5 | 0.0 | -0.6 |
| Relative use by chronically disabled | 1.9 | 2.0 | 2.1 | 2.2 | -0.9 | -0.7 | -1.7 |
| INPATIENT HOSPITAL DAYS PER CAPITA | |||||||
| All persons age 65+ | 3.2 | 2.8 | 2.5 | 2.2 | -0.5 | -3.6 | -5.7 |
| Not chronically disabled | 2.2 | 2.0 | 1.7 | 1.6 | 0.6 | 1.2 | 1.4 |
| Chronically disabled | 6.2 | 5.6 | 5.1 | 4.6 | 2.2 | 0.0 | -1.7 |
| Relative use by chronically disabled | 2.7 | 2.8 | 3.0 | 2.8 | 1.6 | -1.1 | -3.1 |
| INPATIENT HOSPITAL DAYS PER USER | |||||||
| All persons age 65+ | 14.6 | 14.1 | 11.8 | 10.4 | 0.7 | -1.3 | -2.1 |
| Not chronically disabled | 12.5 | 12.2 | 10.3 | 9.4 | 0.2 | 0.4 | 0.3 |
| Chronically disabled | 17.9 | 17.1 | 14.4 | 12.3 | 2.7 | 0.0 | -1.1 |
| Relative use by chronically disabled | 1.4 | 1.4 | 1.4 | 1.3 | 2.5 | -0.4 | -1.3 |
| PART B UTILIZATION | |||||||
| PERCENT USING PART B SERVICES | |||||||
| All persons age 65+ | 80.4 | 90.6 | 91.4 | 92.4 | 0.0 | 0.0 | -0.1 |
| Not chronically disabled | 77.7 | 89.5 | 90.2 | 91.3 | 0.0 | 0.1 | 0.1 |
| Chronically disabled | 88.3 | 94.3 | 95.8 | 96.8 | 0.1 | 0.5 | 0.3 |
| Relative use by chronically disabled | 1.1 | 1.1 | 1.1 | 1.1 | 0.1 | 0.4 | 0.2 |
| TABLE 4. Medicare SNF and Home Health Care Utilization 1984-1999, Standardized by Age and Gender | |||||||
| 1984 | 1989 | 1994 | 1999 | Percent Change Due to Change in Disability Rate | |||
| 1989 | 1994 | 1999 | |||||
| SKILLED NURSING FACILITY UTILIZATION | |||||||
| PERCENT USING SNF SERVICES | |||||||
| All persons age 65+ | 1.4 | 2.2 | 3.7 | 5.0 | 0.4 | -5.6 | -8.1 |
| Not chronically disabled | 0.6 | 0.7 | 1.6 | 2.6 | 2.3 | 3.7 | 4.3 |
| Chronically disabled | 3.6 | 7.1 | 11.2 | 14.4 | 5.3 | 1.2 | 0.3 |
| Relative use by chronically disabled | 6.0 | 9.6 | 6.9 | 5.7 | 2.9 | -2.3 | -3.8 |
| SNF DAYS PER CAPITA | |||||||
| All persons age 65+ | 0.7 | 1.4 | 1.3 | 1.6 | 1.0 | -5.9 | -10.2 |
| Not chronically disabled | 0.2 | 0.3 | 0.4 | 0.7 | 1.9 | 3.9 | 4.3 |
| Chronically disabled | 2.3 | 4.8 | 4.6 | 4.9 | 6.8 | 2.9 | -1.1 |
| Relative use by chronically disabled | 11.5 | 16.9 | 10.5 | 7.0 | 4.8 | -1.0 | -5.2 |
| SNF DAYS PER USER | |||||||
| All persons age 65+ | 54.2 | 60.5 | 36.0 | 31.6 | 0.6 | -0.3 | -2.4 |
| Not chronically disabled | 33.7 | 38.5 | 26.8 | 27.8 | -0.4 | 0.2 | 0.0 |
| Chronically disabled | 64.3 | 67.9 | 40.7 | 34.2 | 1.4 | 1.6 | -1.5 |
| Relative use by chronically disabled | 1.9 | 1.8 | 1.5 | 1.2 | 1.8 | 1.4 | -1.5 |
| HOME HEALTH CARE UTILIZATION | |||||||
| PERCENT USING HHA SERVICES | |||||||
| All persons age 65+ | 5.8 | 6.3 | 10.1 | 8.9 | -2.1 | -5.8 | -7.1 |
| Not chronically disabled | 3.2 | 3.8 | 5.9 | 5.5 | 0.5 | 1.7 | 2.8 |
| Chronically disabled | 13.7 | 14.2 | 25.1 | 22.0 | 0.1 | -1.4 | -1.0 |
| Relative use by chronically disabled | 4.3 | 3.7 | 4.2 | 4.0 | -0.5 | -3.1 | -3.6 |
| HHA VISITS PER CAPITA | |||||||
| All persons age 65+ | 1.4 | 2.0 | 8.0 | 3.6 | -1.2 | -7.0 | -13.0 |
| Not chronically disabled | 0.5 | 0.8 | 2.5 | 1.4 | 0.9 | 2.5 | 2.4 |
| Chronically disabled | 4.1 | 5.6 | 27.3 | 12.1 | 2.9 | 1.9 | -3.0 |
| Relative use by chronically disabled | 7.7 | 6.6 | 10.9 | 8.4 | 2.0 | -0.6 | -5.3 |
| HHA VISITS PER USER | |||||||
| All persons age 65+ | 24.8 | 31.3 | 78.6 | 41.1 | 0.9 | -1.3 | -6.3 |
| Not chronically disabled | 16.9 | 22.2 | 42.5 | 26.3 | 0.4 | 0.8 | -0.3 |
| Chronically disabled | 30.2 | 39.2 | 108.8 | 55.1 | 2.9 | 3.4 | -2.1 |
| Relative use by chronically disabled | 1.8 | 1.8 | 2.6 | 2.1 | 2.5 | 2.5 | -1.7 |
| TABLE 5. Per Capita FFS Medicare Spending and Relative Spending by Type of Disability, 1984-1999, Age and Gender Standardized | |||||||
| 1984 | 1989 | 1994 | 1999 | Percent Change Due to Change in Disability Rate | |||
| 1989 | 1994 | 1999 | |||||
| COMMUNITY INDEPENDENT WITH EQUIPMENT | |||||||
| Percent of persons | 2.5 | 3.0 | 3.3 | 3.8 | 22.4 | 34.8 | 53.3 |
| Total spending | 2,118 | 2,647 | 5,736 | 6,687 | -1.7 | -0.6 | 1.0 |
| Relative to not disabled | 1.4 | 1.3 | 1.7 | 1.6 | -2.0 | -1.3 | -0.1 |
| Inpatient hospital | 1,257 | 1,217 | 2,848 | 3,230 | -2.0 | -1.2 | 1.3 |
| Physician services | 771 | 1,249 | 2,006 | 2,611 | -1.9 | 0.2 | -1.6 |
| Skilled nursing facility | 18 | 52 | 379 | 461 | -3.0 | -1.0 | 6.0 |
| Home health care | 73 | 130 | 487 | 376 | 3.8 | -0.3 | 10.5 |
| COMMUNITY ASSISTANCE WITH IADLS ONLY | |||||||
| Percent of persons | 8.1 | 5.8 | 4.9 | 4.4 | -28.5 | -38.8 | -46.0 |
| Total spending | 2,789 | 3,738 | 6,933 | 8,576 | -0.5 | -0.1 | 2.4 |
| Relative to not disabled | 1.8 | 1.8 | 2.0 | 2.1 | -0.8 | -0.7 | 1.6 |
| Inpatient hospital | 1,750 | 1,874 | 3,043 | 4,007 | -1.3 | 0.1 | 1.5 |
| Physician services | 867 | 1,520 | 2,109 | 2,866 | -0.4 | -1.4 | 1.3 |
| Skilled nursing facility | 44 | 134 | 396 | 837 | 6.5 | -0.6 | 9.4 |
| Home health care | 128 | 201 | 1,176 | 774 | 2.5 | 2.7 | 5.4 |
| COMMUNITY ADL ASSISTANCE | |||||||
| Percent of persons | 8.3 | 8.4 | 7.8 | 7.2 | 1.8 | -6.1 | -13.4 |
| Total spending | 4,036 | 5,439 | 12,560 | 12,378 | 0.6 | -1.7 | -2.4 |
| Relative to not disabled | 2.6 | 2.6 | 3.7 | 3.0 | 0.3 | -2.4 | -3.2 |
| Inpatient hospital | 2,502 | 2,781 | 5,129 | 5,678 | 0.7 | -3.7 | -2.7 |
| Physician services | 1,114 | 1,884 | 2,803 | 3,462 | 0.7 | -1.6 | -2.6 |
| Skilled nursing facility | 46 | 182 | 971 | 1,185 | -0.7 | -2.1 | 0.3 |
| Home health care | 374 | 569 | 3,454 | 1,723 | 0.1 | 1.2 | -3.2 |
| INSTITUTIONAL RESIDENT | |||||||
| Percent of persons | 6.4 | 6.5 | 6.0 | 5.4 | 1.9 | -5.7 | -15.1 |
| Total spending | 2,632 | 5,272 | 8,089 | 8,796 | 0.1 | -0.4 | -2.1 |
| Relative to not disabled | 1.7 | 2.5 | 2.4 | 2.1 | -0.2 | -1.1 | -2.9 |
| Inpatient hospital | 1,655 | 2,546 | 3,508 | 3,844 | 0.3 | -0.2 | -1.9 |
| Physician services | 839 | 1,673 | 2,825 | 2,629 | -0.2 | -1.0 | -1.4 |
| Skilled nursing facility | 114 | 1,006 | 1,216 | 1,486 | -0.3 | 0.8 | -3.1 |
| Home health care | 24 | 48 | 322 | 334 | 1.6 | -2.6 | -4.6 |
| TABLE 6. Changes in the Composition of the Nondisabled and Disabled Populations, Relative to the Counterfactual, 1999 | ||||||||
| Not Disabled | Disabled | |||||||
| Actual | Actual - Counterfactual | Actual | Actual - Counterfactual | |||||
| Percent of Persons | Per Capita Spending | Percent of Persons | Per Capita Spending | Percent of Persons | Per Capita Spending | Percent of Persons | Per Capita Spending | |
| ALL | 100.0 | 4,132 | --- | 34 | 100.0 | 9,607 | --- | -168 |
| Age less than 75 | 59.3 | 3,589 | -1.5 | 4 | 24.4 | 10.811 | -1.6 | -401 |
| Age 75 to 84 | 33.7 | 4,750 | 0.5 | 1 | 41.4 | 10,095 | -0.2 | -82 |
| Age 85 or older | 6.9 | 5,771 | 1.0 | 53 | 34.2 | 8,159 | 1.8 | 54 |
| Not previously disabled | 98.6 | 4,073 | -0.1 | 31 | 64.2 | 9,875 | -0.9 | -235 |
| Previously disabled | 1.4 | 8,228 | 0.1 | 98 | 35.8 | 9,127 | 0.9 | -25 |
| MEN | 43.9 | 4,618 | 0.2 | 33 | 29.5 | 11,151 | -3.0 | -101 |
| Age less than 75 | 26.9 | 4,185 | -0.6 | 5 | 9.0 | 11,188 | -1.4 | -81 |
| Age 75 to 84 | 14.3 | 5,126 | 0.3 | 1 | 13.1 | 11,741 | -1.0 | 27 |
| Age 85 or older | 2.6 | 6,314 | 0.5 | 32 | 7.4 | 10,071 | -0.6 | -354 |
| Not previously disabled | 43.2 | 4,528 | 0.1 | 27 | 21.4 | 10,591 | -2.5 | -1,010 |
| Previously disabled | 0.6 | 10,799 | 0.0 | 221 | 8.1 | 8,506 | -0.5 | -1,772 |
| WOMEN | 56.1 | 3,753 | -0.2 | 32 | 70.5 | 8,961 | 3.0 | -103 |
| Age less than 75 | 32.4 | 3,093 | -0.9 | 0 | 15.4 | 10,591 | -0.2 | -584 |
| Age 75 to 84 | 19.4 | 4,471 | 0.3 | 0 | 28.3 | 9,337 | 0.8 | -55 |
| Age 85 or older | 4.4 | 5,452 | 0.5 | 37 | 26.8 | 7,628 | 2.4 | 290 |
| Not previously disabled | 55.4 | 3,717 | -0.2 | 32 | 42.7 | 9,038 | 1.6 | -205 |
| Previously disabled | 0.8 | 6,188 | 0.0 | -29 | 27.8 | 8,844 | 1.4 | 59 |
| TABLE 7. Changes in Composition by Disability Type Relative to the Counterfactual, 1999 | ||||
| Actual | Actual - Counterfactual | |||
| Percent of Persons | Per Capita Spending | Percent of Persons | Per Capita Spending | |
| EQUIPMENT ONLY | ||||
| Age less than 75 | 27.2 | 6,563 | -7.7 | 78 |
| Age 75 to 84 | 49.9 | 6,331 | -0.3 | 15 |
| Age 85 or older | 22.9 | 7,609 | 8.0 | -371 |
| Not previously disabled | 69.1 | 6,384 | -1.0 | 43 |
| Previously disabled | 30.9 | 7,363 | 1.0 | 82 |
| Men | 28.1 | 6,061 | -1.9 | -50 |
| Women | 71.9 | 6,931 | 1.9 | 90 |
| IADL HELP ONLY | ||||
| Age less than 75 | 30.1 | 10,858 | 0.8 | 242 |
| Age 75 to 84 | 43.0 | 8,588 | -1.9 | 209 |
| Age 85 or older | 26.9 | 6.005 | 1.1 | 175 |
| Not previously disabled | 71.1 | 8,637 | 0.3 | 109 |
| Previously disabled | 28.9 | 8,426 | -0.3 | 423 |
| Men | 32.4 | 8,623 | -1.8 | 389 |
| Women | 67.6 | 8,553 | 1.8 | 106 |
| ADL HELP | ||||
| Age less than 75 | 28.1 | 12,844 | -1.5 | -353 |
| Age 75 to 84 | 39.5 | 13,545 | 0.7 | -194 |
| Age 85 or older | 32.4 | 10,553 | 0.8 | -353 |
| Not previously disabled | 63.9 | 12,476 | -1.4 | -255 |
| Previously disabled | 36.1 | 12,204 | 1.4 | -389 |
| Men | 31.4 | 15,311 | -5.3 | -162 |
| Women | 68.6 | 11,038 | 5.3 | -33 |
| INSTITUTIONAL RESIDENT | ||||
| Age less than 75 | 13.0 | 11,079 | -1.0 | -799 |
| Age 75 to 84 | 36.7 | 10,156 | -0.9 | 49 |
| Age 85 or older | 50.3 | 7,216 | 1.9 | -68 |
| Not previously disabled | 55.5 | 10,207 | -0.2 | -284 |
| Previously disabled | 44.5 | 7,035 | 0.2 | -60 |
| Men | 25.7 | 10,856 | -0.3 | 16 |
| Women | 74.3 | 8,085 | 0.3 | -251 |
| TABLE 8. Disability Assumptions for Projections, 2004-2019 | ||||||
| Historical Annual % Change | 2004 | 2009 | 2014 | 2019 | Projected % Change 1999-2019 | |
| DISABILITY PROJECT METHOD 1: CONTINUING CONSTANT RATE OF CHANGE AT -1.4% PER YEAR CALCULATED FROM 1984-1999 PERIOD FOR ALL MEDICARE ELDERLY | ||||||
| TOTAL PERCENT CHRONICALLY DISABLED: METHOD 1 | -1.4 | 18.3 | 17.1 | 15.9 | 14.8 | -1.4 |
| DISABILITY PROJECTION METHOD 2: CONTINUING CONSTANT RATES OF CHANGE FOR INDIVIDUAL DISABILITY GROUPS CALCULATED FROM 1984-1999 PERIOD FOR ALL MEDICARE ELDERLY SUMMED TO OBTAIN OVERALL PERCENT CHRONICALLY DISABLED | ||||||
| TOTAL PERCENT CHRONICALLY DISABLED: METHOD 2 | 18.8 | 18.2 | 17.9 | 17.8 | -0.5 | |
| Percent independent with equipment | 3.1 | 4.4 | 5.1 | 5.9 | 6.9 | 3.1 |
| Percent assistance with IADLs only | -4.1 | 3.4 | 2.8 | 2.3 | 1.8 | -4.1 |
| Percent ADL assistance | -1.1 | 6.5 | 6.2 | 5.9 | 5.6 | -1.1 |
| Percent resident in institutions | -1.4 | 4.5 | 4.2 | 3.9 | 3.6 | -1.4 |
| DISTRIBUTION BY TYPE OF DISABILITY | 100.0 | 100.0 | 100.0 | 100.0 | ||
| Percent independent with equipment | 23.2 | 27.8 | 32.9 | 38.4 | ||
| Percent assistance with IADLs only | 18.3 | 15.3 | 12.6 | 10.2 | ||
| Percent ADL assistance | 34.7 | 34.0 | 32.8 | 31.1 | ||
| Percent resident in institutions | 23.9 | 22.9 | 21.7 | 20.2 | ||
| TABLE 9. Spending Assumptions for Projection of Age and Gender Standardized Per Capita Spending 2004-2019 | ||||||
| Historical Annual % Change | 2004 | 2009 | 2014 | 2019 | Projected % Change 1999-2019 | |
| PROJECTED MEDICARE SPENDING IN CONSTANT 1999 DOLLARS (ignoring disability) | 6.9 | 7,347 | 10,254 | 14,311 | 19,974 | 6.9 |
| SPENDING PROJECTION METHOD 1: CONTINUING CONSTANT RATE OF CHANGE FOR TOTAL SPENDING PER CAPITA BY NONDISABLED AND DISABLED CALCULATED FROM THE 1989-1999 PER CAPITA | ||||||
| PER CAPITA MEDICARE SPENDING: METHOD 1 | ||||||
| Not disabled | 7.0 | 5,785 | 8,101 | 11,343 | 15,882 | 7.0 |
| Disabled | 7.6 | 13,852 | 19,971 | 28,794 | 41,516 | 7.6 |
| Relative spending | 2.4 | 2.5 | 2.5 | 2.6 | ||
| SPENDING PROJECTION METHOD 2: CONTINUING CONSTANT RATE OF CHANGE FOR PER CAPITA SPENDING BY DISABLED AND NOT DISABLED, BY SERVICE TYPE, SUMMED TO OBTAIN OVERALL PER | ||||||
| PER CAPITA MEDICARE SPENDING: METHOD 2 | ||||||
| Not disabled | 7.0 | 5,852 | 8,449 | 12,548 | 19,401 | 8.0 |
| Disabled | 7.6 | 13,876 | 20,266 | 29,969 | 44,924 | 8.0 |
| Relative spending | 2.4 | 2.4 | 2.4 | 2.3 | ||
| SPENDING PROJECTION METHOD 3: CONTINUING CONSTANT RATE OF CHANGE FOR OVERALL PER CAPITA SPENDING BY NOT DISABLED AND SUBGROUPS OF DISABLED, COMBINED INTO OVERALL PER CAPITA SPENDING FOR DISABLED BY WEIGHTED AVERAGE USING PROPORTIONS OF DISABLED IN EACH GROUP | ||||||
| PER CAPITA MEDICARE SPENDING: METHOD 3 | ||||||
| Not disabled | 7.0 | 5,785 | 8,101 | 11,343 | 15,882 | 7.0 |
| Disabled | 7.6 | 14,034 | 20,659 | 30,674 | 45,990 | 8.2 |
| Relative spending | 2.4 | 2.6 | 2.7 | 2.9 | ||
| TABLE 10. Projected Age and Gender Standardized Medicare Spending Per Capita Spending 2004-2019 | ||||||||||||
| Disability Projection Method | ||||||||||||
| Baseline: 1999 Disability Unchanged | Method 1: 1.4% Annual Decline Based on Aggregate Chronic Disability | Method 2: 0.5% Annual Decline Based on Underlying Trends by Disability Type | ||||||||||
| 2004 | 2009 | 2014 | 2019 | 2004 | 2009 | 2014 | 2019 | 2004 | 2009 | 2014 | 2019 | |
| ESTIMATE NOT TAKING DISABILITY INTO ACCOUNT | 7,347 | 10,254 | 14,311 | 19,974 | 7,347 | 10,254 | 14,311 | 19,974 | 7,347 | 10,254 | 14,311 | 19,974 |
| SPENDING PROJECTION METHOD | ||||||||||||
| METHOD 1: CONSTANT RATE OF CHANGE IN TOTAL MEDICARE SPENDING FOR DISABLED AND NONDISABLED | ||||||||||||
| Per capita Medicare Spending | 7,374 | 10,438 | 14,779 | 20,930 | 7,263 | 10,125 | 14,112 | 19,668 | 7,302 | 10,261 | 14,464 | 20,455 |
| Absolute change in spending relative to no change in disability | -110 | -313 | -667 | -1,262 | -72 | -177 | -315 | -474 | ||||
| % change in spending relative to no change in disability | -1.5 | -3.0 | -4.5 | -6.0 | -1.0 | -1.7 | -2.1 | -2.3 | ||||
| % change relative to estimates ignoring disability | 0.4 | 1.8 | 3.3 | 4.8 | -1.1 | -1.3 | -1.4 | -1.5 | -0.6 | 0.1 | 1.1 | 2.4 |
| METHOD 2: CONSTANT RATE OF CHANGE IN SPENDING BY SERVICE FOR THE DISABLED AND NONDISABLED | ||||||||||||
| Per capita Medicare Spending | 7,432 | 10,776 | 15,978 | 24,426 | 7,322 | 10,464 | 15,312 | 23,170 | 7,361 | 10,600 | 15,663 | 23,954 |
| Absolute change in spending relative to no change in disability | -110 | -312 | -666 | -1,257 | -72 | -176 | -315 | -472 | ||||
| % change in spending relative to no change in disability | -1.5 | -2.9 | -4.2 | -5.1 | -1.0 | -1.6 | -2.0 | -1.9 | ||||
| % change relative to estimates ignoring disability | 1.2 | 5.1 | 11.6 | 22.3 | -0.3 | 2.0 | 7.0 | 16.0 | 0.2 | 3.4 | 9.4 | 19.9 |
| METHOD 3: CONSTANT RATE OF CHANGE IN SPENDING BY SERVICE FOR THE DISABLED AND NONDISABLED | ||||||||||||
| Per capita Medicare Spending | 7,409 | 10,574 | 15,149 | 21,811 | 7,297 | 10,242 | 14,410 | 20,328 | 7,336 | 10,387 | 14,800 | 21,253 |
| Absolute change in spending relative to no change in disability | -113 | -331 | -739 | -1,482 | -74 | -187 | -349 | -557 | ||||
| % change in spending relative to no change in disability | -1.5 | -3.1 | -4.9 | -6.8 | -1.0 | -1.8 | -2.3 | -2.6 | ||||
| % change relative to estimates ignoring disability | 0.9 | 3.1 | 5.9 | 9.2 | -0.7 | -0.1 | 0.7 | 1.8 | -0.1 | 1.3 | 3.4 | 6.4 |
| TABLE 11. Projected Actual Medicare Spending Per Capita, 2004-2019 | ||||||||||||
| Disability Projection Method | ||||||||||||
| Baseline: 1999 Disability Unchanged | Method 1: 1.4% AnnualDecline Based on Aggregate Chronic Disability | Method 2: 0.5% Annual Decline Based on Underlying Trends by Disability Type | ||||||||||
| 2004 | 2009 | 2014 | 2019 | 2004 | 2009 | 2014 | 2019 | 2004 | 2009 | 2014 | 2019 | |
| ESTIMATE NOT TAKING DISABILITY INTO ACCOUNT | 7,406 | 10,293 | 14,146 | 19,581 | 7,406 | 10,293 | 14,146 | 19,581 | 7,406 | 10,293 | 14,146 | 19,581 |
| SPENDING PROJECTION METHOD | ||||||||||||
| METHOD 1: CONSTANT RATE OF CHANGE IN TOTAL MEDICARE SPENDING FOR DISABLED AND NONDISABLED | ||||||||||||
| Per capita Medicare Spending | 7,514 | 10,599 | 14,776 | 20,744 | 7,418 | 10,327 | 14,209 | 19,676 | 7,428 | 10,369 | 14,324 | 19,945 |
| Absolute change in spending relative to no change in disability | -96 | -272 | -567 | -1,068 | -87 | -230 | -452 | -799 | ||||
| % change in spending relative to no change in disability | -1.3 | -2.6 | -3.8 | -5.1 | -1.2 | -2.2 | -3.1 | -3.8 | ||||
| % change relative to estimates ignoring disability | 1.5 | 3.0 | 4.5 | 5.9 | 0.2 | 0.3 | 0.4 | 0.5 | 0.3 | 0.7 | 1.3 | 1.9 |
| METHOD 2: CONSTANT RATE OF CHANGE IN SPENDING BY SERVICE FOR THE DISABLED AND NONDISABLED | ||||||||||||
| Per capita Medicare Spending | 7,576 | 10,950 | 15,950 | 24,047 | 7,482 | 10,692 | 15,432 | 23,130 | 7,489 | 10,720 | 15,486 | 23,200 |
| Absolute change in spending relative to no change in disability | -94 | -258 | -518 | -916 | -86 | -231 | -464 | -847 | ||||
| % change in spending relative to no change in disability | -1.2 | -2.4 | -3.2 | -3.8 | -1.1 | -2.1 | -2.9 | -3.5 | ||||
| % change relative to estimates ignoring disability | 2.3 | 6.4 | 12.8 | 22.8 | 1.0 | 3.9 | 9.1 | 18.1 | 1.1 | 4.1 | 9.5 | 18.5 |
| METHOD 3: CONSTANT RATE OF CHANGE IN SPENDING BY SERVICE FOR THE DISABLED AND NONDISABLED | ||||||||||||
| Per capita Medicare Spending | 7,540 | 10,677 | 14,942 | 21,057 | 7,440 | 10,388 | 14,322 | 19,859 | 7,451 | 10,437 | 14,461 | 20,196 |
| Absolute change in spending relative to no change in disability | -100 | -289 | -620 | -1,198 | -89 | -240 | -481 | -861 | ||||
| % change in spending relative to no change in disability | -1.3 | -2.7 | -4.2 | -5.7 | -1.2 | -2.2 | -3.2 | -4.1 | ||||
| % change relative to estimates ignoring disability | 1.8 | 3.7 | 5.6 | 7.5 | 0.5 | 0.9 | 1.2 | 1.4 | 0.6 | 1.4 | 2.2 | 3.1 |
To obtain a printed copy of this report, send the full report title and your mailing information to:
U.S. Department of Health and Human ServicesOffice of Disability, Aging and Long-Term Care PolicyRoom 424E, H.H. Humphrey Building200 Independence Avenue, S.W.Washington, D.C. 20201FAX: 202-401-7733Email: webmaster.DALTCP@hhs.gov
RETURN TO:
Office of Disability, Aging and Long-Term Care Policy (DALTCP) Home [http://aspe.hhs.gov/_/office_specific/daltcp.cfm]Assistant Secretary for Planning and Evaluation (ASPE) Home [http://aspe.hhs.gov]U.S. Department of Health and Human Services Home [http://www.hhs.gov]