
By:
Rose Chu and Richard Kronick
The Affordable Care Act brings an unprecedented level of scrutiny and transparency to health insurance rate increases. Evidence suggests that the Affordable Care Act contributed to a reduction in the rate of increase in premiums in the individual market since 2010. The proportion of rate filings in which the requested increase was 10 percent or more declined from 75 percent in 2010 to 34 percent in 2012, consistent with the increased scrutiny that such requests now receive. Available data for 2013 suggest that this pattern of slower premium growth has been maintained so far in 2013, with only 14 percent of requested rates at 10 percent or more. In addition, the average premium increase in 2012 was 30 percent below that in 2010.
Introduction
The Affordable Care Act brings an unprecedented level of scrutiny and transparency to health insurance rate increases. Thanks to the law, for the first time ever, insurance companies in all states cannot raise rates without accountability or transparency.equested an increase of 10 percent or more. It is plausible that insurers seeking to avoid scrutiny of their rate increase requests would have been more circumspect in proposing increases of 10 percent or more after implementation of the rate review requirement in September 2011 than prior to implementation. Second, we compare the rate of increase in 2011, 2012, and 2013 to increases in 2009 and 2010. If the Affordable Care Act is causing the rate of premium growth to decrease (or increase), then the rate of premium growth post-Affordable Care Act should be lower (or higher) than prior to implementation of the Affordable Care Act. However, decreases (or increases) in premium growth might be due to factors other than the Affordable Care Act. To control for general trends in health care costs, which have moderated substantially over the past few years, we compare the rate of increase in premiums in the individual market to the rate of increase in the market for employer sponsored insurance (ESI), using data from the MEPS-IC.
Results
Since 2010, there has been a decline in the proportion of rate filings in which the requested increase is at or above the Affordable Care Act threshold of 10 percent. In 2010, 75 percent of rate filings requested increases of 10 percent or more, a proportion that dropped to 34 percent in 2012 (See Figure 1).
| Source: Data from 9 states with 213 filings in 2009, 11 states with 238 filings in 2010, 15 states with 307 filings in 2011, 15 states with 283 filings in 2012, and 10 states with 77 filings in 2013. The 2013 results are incomplete for the 10 states that are included. |
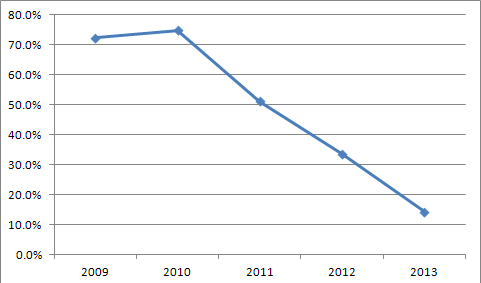 |
Although results for 2013 are still preliminary, the available data suggest that the slowdown in rate increases seen from 2010 to 2012 has continued into 2013. The proportion of policies with rate increases of 10 percent or more is much lower, 14 percent in 2013, than in any previous year (see Figure 1).
Policyholders
State
2009
2010
2011
2012
2013
Source: State insurance websites except directly from MN, NJ, and Washington State for 2009-2011
| Filings | |||||
|---|---|---|---|---|---|
| State | 2009 | 2010 | 2011 | 2012 | 2013 |
| 1States without prior approval authority Source: State insurance websites except directly from MN, NJ, and Washington State for 2009-2011 |
|||||
| AR | 19 | 19 | 10 | 8 | 5 |
| CA1 | no data | no data | 23 | 25 | 4 |
| CT | no data | no data | 12 | 15 | 7 |
| DE | no data | no data | 6 | 5 | no data |
| FL | 68 | 52 | 58 | 48 | no data |
| IN | no data | no data | 42 | 23 | 10 |
| ME | 5 | 8 | 4 | 5 | no data |
| MN | no data | 11 | 9 | 15 | 5 |
| NC | 21 | 20 | 9 | 18 | 4 |
| NJ1 | 17 | 21 | 17 | 11 | no data |
| OR | 33 | 25 | 30 | 26 | 6 |
| PA | no data | 21 | 27 | 40 | 25 |
| RI | 1 | 1 | 1 | 1 | no data |
| WA | 14 | 14 | 13 | 9 | 3 |
| WI1 | 35 | 46 | 46 | 34 | 8 |
| Total | 213 | 238 | 307 | 283 | 77 |
Endnotes
http://www.kff.org/healthreform/8376.cfm.)
http://www.healthcare.gov/news/reports/rate-review09112012a.html.)
http://meps.ahrq.gov/mepsweb/survey_comp/Insurance.jsp.)
http://meps.ahrq.gov/mepsweb/survey_comp/Insurance.jsp.)
http://www.healthcare.gov/news/reports/rate-review09112012a.html.)
http://cciio.cms.gov/archive/grants/rate-review-grants-map.html.)