
This is the fifth in a series of issue briefs highlighting national and state-level enrollment-related information for the Health Insurance Marketplace (Marketplace hereafter).1 This brief includes data for states that are implementing their own Marketplaces (also known as State-Based Marketplaces or SBMs), and states with Marketplaces that are supported by or fully run by the Department of Health and Human Services (including those run in partnership with states, also known as the Federally-facilitated Marketplace or FFM).
This brief also includes updated data on the characteristics of persons who have selected a Marketplace plan (by gender, age, and financial assistance status) and the plans that they have selected (by metal level); as well as additional data on the characteristics of people who have selected plans in the FFM and the plans they have selected. (Detailed state-level tables can be found in Appendix C, and in the Addendum to the March Marketplace Enrollment Report).2
Cumulative enrollment-related activity during the first five months (10-1-13 to 3-1-14) of the initial open enrollment period is reported for several metrics, including: the number of visits to the Marketplace websites, the number of calls to the Marketplace call centers, the number of persons who have been determined or assessed eligible by the Marketplaces for Medicaid or the Children’s Health Insurance Program (CHIP),3 and the number of persons who have selected a plan through the Marketplace. This report features cumulative data for the five-month period because some people apply, shop, and select a plan across monthly reporting periods.
The cumulative number of individuals that have selected a Marketplace plan between 10-1-13 and 3-1-14 (including those who have paid a premium and those who have not yet paid a premium) is more than 4.2 million.
Figure 1 and Table 1 show that, consistent with expectations,4 the proportion of young adults (ages 18 to 34) who have selected a Marketplace plan through the SBMs and FFM has remained strong. Young adults continued to account for 27 percent of the Marketplace plan selections during the fifth month, which was consistent with their share of plan selections during the fourth month (27 percent) and 3 percentage points higher than their share of plan selections during the first three months (24 percent). Meanwhile, the proportion of older adults (ages 35 and over) selecting a Marketplace plan has continued to decrease (from 70 percent during the first three months to 67 percent during the fifth month).
Figure 1
Trends in the Age Distribution of Individuals Who Have Selected a Marketplace Plan, 10-1-13 to 3-1-14
The proportion of young adults (ages 18-34) selecting a Marketplace plan (27%) remained constant during the fifth month of the initial open enrollment period, while the proportion of older adults (35 & over) selecting a Marketplace plan continued to decrease
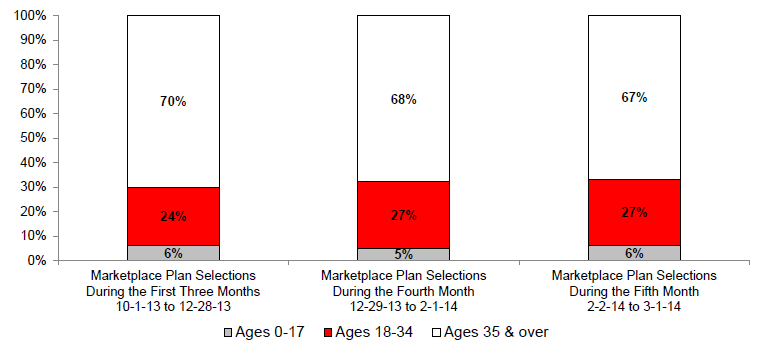
Notes: Represents cumulative monthly data on the number of unique individuals who have been determined eligible to enroll ina Marketplace plan through the SBMs and FFM, and have selected a plan (with or without the first premium payment having been received by the issuer). The percent distribution excludes plan selections where the age is unknown. During the first 3 months, 2.2 million individuals selected a plan; during the 4thmonth, 1.1 million selected a plan; and during the 5th month, 0.9 million selected a plan, for a total of 4.2 million Marketplace plan selections for 10-1-13 to 3-1-14.
Source: Centers for Medicare & Medicaid Services, as of 3-7-2014.
Table 1
| Trends in the Distribution of Marketplace Plan Selections By Age Group (based on data reported as of 3-7-14) | Cumulative Total, First Three Months 10-1-13 to 12-28-13 | Change, Fourth Month Only 12-29-13 to 2-1-14 | Change, Fifth Month Only 2/2/14 to 3-1-14 | Cumulative Total, First Five Months 10-1-13 to 3-1-14 | ||||
|---|---|---|---|---|---|---|---|---|
| Number | % of Total | Number | % of Total | Number | % of Total | Number | % of Total | |
| MARKETPLACE TOTAL | ||||||||
| Ages 0-17 | 126,735 | 6% | 60,192 | 5% | 64,329 | 6% | 251,256 | 6% |
| Ages 18-34 | 489,460 | 24% | 318,055 | 27% | 268,475 | 27% | 1,075,990 | 25% |
| Ages 35 & over | 1,442,012 | 70% | 796,138 | 68% | 669,284 | 67% | 2,907,434 | 69% |
| Subtotal With Available Data on Age | 2,058,207 | 100% | 1,174,385 | 100% | 1,002,088 | 100% | 4,234,680 | 100% |
| Unknown Age | 95,214 | n/a | -28,314 | n/a | -59,255 | n/a | 7,645 | n/a |
| Total, All Ages | 2,153,421 | n/a | 1,146,071 | n/a | 942,833 | n/a | 4,242,325 | n/a |
| SBM SUBTOTAL | ||||||||
| Ages 0-17 | 61,049 | 7% | 21,516 | 5% | 18,287 | 6% | 100,852 | 6% |
| Ages 18-34 | 212,909 | 25% | 114,187 | 27% | 84,549 | 26% | 411,645 | 25% |
| Ages 35 & over | 595,016 | 68% | 293,725 | 68% | 220,001 | 68% | 1,108,742 | 68% |
| Subtotal With Available Data on Age | 868,974 | 100% | 429,428 | 100% | 322,837 | 100% | 1,621,239 | 100% |
| Unknown Age | 88,017 | n/a | -26,515 | n/a | -61,502 | n/a | 0 | n/a |
| Total, All Ages | 956,991 | n/a | 402,913 | n/a | 261,335 | n/a | 1,621,239 | n/a |
| FFM SUBTOTAL | ||||||||
| Ages 0-17 | 65,686 | 6% | 38,676 | 5% | 46,042 | 7% | 150,404 | 6% |
| Ages 18-34 | 276,551 | 23% | 203,868 | 27% | 183,926 | 27% | 664,345 | 25% |
| Ages 35 & over | 846,996 | 71% | 502,413 | 67% | 449,283 | 66% | 1,798,692 | 69% |
| Subtotal With Available Data on Age | 1,189,233 | 100% | 744,957 | 100% | 679,251 | 100% | 2,613,441 | 100% |
| Unknown Age | 7,197 | n/a | -1,799 | n/a | 2,247 | n/a | 7,645 | n/a |
| Total, All Ages | 1,196,430 | n/a | 743,158 | n/a | 681,498 | n/a | 2,621,086 | n/a |
Note: These percentages are based on the total number of plan selections for which the applicable data are available, excluding plan selections with unknown data for age. (Source: Centers for Medicare & Medicaid Services, as of 3-7-2014.)
There was a 29 percent increase in the cumulative number of individuals who have selected a Marketplace plan during the month of February.
While the total number of new Marketplace plan selections was slightly lower in February when compared with the previous month of January (942,000 versus 1,146,000, respectively), the rate of Marketplace plan selections is expected to increase as the March 31, 2014 end of the initial open enrollment period approaches.
1 The previous Marketplace enrollment reports can be accessed at http://www.aspe.hhs.gov/health/reports/2012/ACA-Research/index.cfm.
2 The Addendum to the March Enrollment Report is available at http://aspe.hhs.gov/health/reports/2014/MarketPlaceEnrollment/Mar2014/i….
3 Data related to Medicaid and CHIP eligibility in this report are based on applications submitted through the Marketplaces. October through January data based on applications submitted through state Medicaid/CHIP agencies were released by the Centers for Medicare & Medicaid Services in a separate report, “Medicaid & CHIP: January 2014 Monthly Applications and Eligibility Determinations Report, February 28, 2014,” which can be accessed at http://www.medicaid.gov/AffordableCareAct/Medicaid-Moving-Forward-2014/…. Comparable February 2014 enrollment data based on applications submitted through state Medicaid/CHIP agencies will be released in a subsequent report.
4 The general expectation is that people who are older and sicker are more likely to select coverage earlier in the initial enrollment period, while “younger and healthier people will tend to wait until towards the end of the open enrollment period (which concludes March 31, 2014).” “The Numbers Behind “Young Invincibles” and the Affordable Care Act,” Larry Levitt, Gary Claxton and Anthony Damico, Kaiser Family Foundation, December 17, 2013, available at http://kff.org/health-reform/perspective/the-numbers-behind-young-invin….
"Anticipated Enrollment Growth in March
Based on the experience of private employers, the Federal Employees Health Benefits Program (FEHBP), Medicare Part D, Massachusetts’ Commonwealth Care, and the Children’s Health Insurance Program (CHIP), several factors drive enrollment rates, particularly in the early months of program operation,5 including:
- “Action-forcing” events — such as the end date of an open enrollment period or the start date for benefits — often result in a spike in enrollment activity.
- The length of a program’s pre-benefit period (i.e., the period between sign-up/enrollment and the receipt of benefits) also affects rates of initial enrollment: Shorter pre-benefit periods (e.g., 1 month) tend to generate higher initial enrollment rates than longer pre-benefit periods, during which the consumer may perceive little advantage to signing up or enrolling early.
Medicare Part D, which had a six-month open enrollment period, experienced faster initial rates of enrollment compared to Massachusetts Commonwealth Care, which allowed continuous enrollment throughout the year. However, initial take-up rates were slower for the State Children’s Health Insurance Program (CHIP), with only 60 percent of eligible children participating in CHIP in 2003, fully five years after states began implementing their CHIP programs in 1998.
Additionally, Medicare Part D and other programs such as employer sponsored insurance and the Federal Employees Health Benefits Program (FEHBP) have experienced a surge of enrollment as their respective open enrollment periods came to an end. For example, more than 1 million beneficiaries enrolled during the last week of the Medicare Part D initial open enrollment period.6 Additionally, data from FEHB show that nearly a quarter (22 percent) of the employees who changed their enrollment during the 2012 open enrollment season made their selection in the last two days before the season’s deadline. Based on this experience, a similar enrollment surge is expected in March as the close of the initial open enrollment period approaches for the Marketplace.
February Enrollment Growth
There was continued growth in total Marketplace plan selections in February, compared to the October-January period:
- Marketplace Total (SBMs and FFM) – there was a 29 percent increase in plan selections in February
- the 3,299,500 cumulative number in October-January rose by 942,800 in February to a cumulative five month total of 4,242,300
- SBMs – there was a 19 percent increase in plan selections in February
- the 1,359,900 cumulative number for October-January rose by 261,300 in February to a cumulative five month total of 1,621,200
- FFM – there was a 35 percent increase in plan selections in February
- the 1,939,600 cumulative number in October-January rose by nearly 681,500 in February to a cumulative five month total of nearly 2,621,100
The following are highlights of Marketplace enrollment-related information for the first five months of the initial open enrollment period (see Appendix C and the Addendum to the March Marketplace Enrollment Report for specific state-level data).
Cumulative Highlights for the period: October 1, 2013 – March 1, 2014
Marketplace Eligibility Determinations and Plan Selection
- Number of Eligible Persons who have Selected a Plan through the SBMs and FFM: 4.2 million
- Number of Persons who have had a Medicaid/CHIP Determination or Assessment through the Marketplaces: 4.4 million (does not include individuals applying through State Medicaid/CHIP agencies.)
Marketplace Plan Selection by Gender
- 45 percent7 of the persons who have selected a Marketplace plan are male
- 55 percent of the persons who have selected a Marketplace plan are female
Marketplace Plan Selection by Age
- 25 percent of the persons who have selected a Marketplace plan are between the ages of 18 and 34
- The percent of young adults who selected a Marketplace plan was 3 percentage points higher in January and February than it was from October through December (27 percent versus 24 percent)
- 31 percent of the persons who have selected a Marketplace plan are between the ages of 0 and 34
Marketplace Plan Selection by Metal Level
- 18 percent of the persons who have selected a Marketplace plan have selected a Bronze plan
- 63 percent of the persons who have selected a Marketplace plan have selected a Silver plan
- 11 percent of the persons who have selected a Marketplace plan have selected a Gold plan
- 6 percent of the persons who have selected a Marketplace plan have selected a Platinum plan
- 1 percent of the persons who have selected a Marketplace plan have selected a Catastrophic plan
Marketplace Plan Selection by Financial Assistance
- 83 percent of the persons who have selected a Marketplace plan have selected a Marketplace Plan with Financial Assistance8
FFM Marketplace Plan Selection by Gender and Age
- 26 percent of the males who have selected a Marketplace plan through the FFM are between 18 and 34
- 25 percent of the females who have selected a Marketplace plan through the FFM are between 18 and 34
FFM Marketplace Plan Selection by Gender and Metal Level
- 69 percent of the females who have selected a Marketplace plan through the FFM have selected a Silver plan
- 65 percent of the males who have selected a Marketplace plan through the FFM have selected a Silver plan
FFM Marketplace Plan Selection by Financial Assistance Status and Metal Level
- 74 percent of the persons who have selected a Marketplace plan with Financial Assistance through the FFM have selected a Silver plan
- 94 percent of the persons selecting a Silver plan in the FFM will be receiving Federal financial assistance in paying their premiums
- 26 percent of the persons who have selected a Marketplace plan without Financial Assistance through the FFM have selected a Silver plan
- 30 percent of the persons who have selected a Marketplace plan without Financial Assistance through the FFM have selected a Bronze plan
FFM Marketplace Plan Selection by Metal Level and Age
- 66 percent of the young adults between the ages of 18 and 34 who selected a Marketplace plan through the FFM selected a Silver plan
- 15 percent of the young adults between the ages of 18 and 34 who selected a Marketplace plan through the FFM selected a Bronze plan
- 10 percent of the young adults between the ages of 18 and 34 who selected a Marketplace plan through the FFM selected a Gold plan
- 5 percent of the young adults between the ages of 18 and 34 who selected a Marketplace plan through the FFM selected a Platinum plan
- 4 percent of the young adults between the ages of 18 and 34 who selected a Marketplace plan through the FFM selected a Catastrophic plan
- Young adults account for 91 percent of all catastrophic plan selections through the FFM
Monthly Data on Marketplace Plan Selection – As shown in Figure 2, the cumulative number of persons who have selected a Marketplace plan has increased considerably since the end of the fourth month of the initial open enrollment period.
Figure 2
Trends in the Cumulative Number of Individuals Who Have Selected a Marketplace Plan, 10-1-13 to 3-1-1
Over 4.2 million people have selected a Marketplace plan since October 1st, including 2.6 million who have selected a plan through the FFM
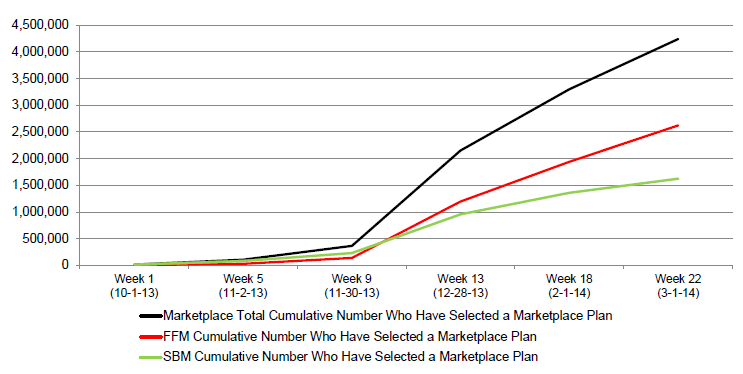
Notes: Represents cumulative monthly sums of data on the number of unique individuals who have been determined eligible to enroll in a plan through the FFM, and have selected a plan (with or without the first premium payment having been received by the issuer).
Source: Centers for Medicare & Medicaid Services, as of 3-7-2014.
Additionally, Table 2 shows that the cumulative number of young adults (ages 18 to 34) selecting a Marketplace plan grew faster than for other age groups when the five month period is compared to the four month period. The cumulative number of young adults selecting a Marketplace plan has increased by 33 percent (268,475) since February 1st (from 807,515 to 1,075,990). By comparison, there was a 30 percent increase in Marketplace plan selections for all other age groups during the same time period (from 2.4 million to nearly 3.2 million).
Table 2
| Trend In the Cumulative Number of Marketplace Plan Selections By Age Group (based on data reported as of 3-7-14) | Cumulative Total, First Four Months 10-1-13 to 2-1-14 | Cumulative Total, First Five Months 10-1-13 to 3-1-14 | % Change |
|---|---|---|---|
| MARKETPLACE TOTAL | |||
| Ages 18 to 34 | 807,515 | 1,075,990 | 33% |
| All Other Age Groups Combined | 2,425,077 | 3,158,690 | 30% |
| Subtotal With Available Data on Age | 3,232,592 | 4,234,680 | 31% |
| Unknown Age | 66,900 | 7,645 | -89% |
| Marketplace Total | 3,299,492 | 4,242,325 | 29% |
| SBM TOTAL | |||
| Ages 18 to 34 | 327,096 | 411,645 | 26% |
| All Other Age Groups Combined | 971,306 | 1,209,594 | 25% |
| Subtotal With Available Data on Age | 1,298,402 | 1,621,239 | 25% |
| Unknown Age | 61,502 | 0 | -100% |
| Marketplace Total | 1,359,904 | 1,621,239 | 19% |
| FFM TOTAL | |||
| Ages 18 to 34 | 480,419 | 664,345 | 38% |
| All Other Age Groups Combined | 1,453,771 | 1,949,096 | 34% |
| Subtotal With Available Data on Age | 1,934,190 | 2,613,441 | 35% |
| Unknown Age | 5,398 | 7,645 | 42% |
| Marketplace Total | 1,939,588 | 2,621,086 | 35% |
Notes: These percentages for Ages 18 to 34 and All Other Age Groups Combined are based on the total number of plan selections for which the applicable data are available, excluding plan selections with unknown data for age. The number of Marketplace plan selections with unknown age decreased significantly for the SBMs in comparison to the previous reporting period due to an increase in the completeness of data reporting for this metric.
Source: Centers for Medicare & Medicaid Services, as of 3-7-2014.
- Marketplace Plan Selections by Age – The proportion of Marketplace plan selections by persons between the ages of 18 and 34 has been increasing. Persons between the ages of 18 and 34 account for nearly a quarter (25 percent) of all Marketplace plan selections (SBMs and FFM) for the first five months of the initial open enrollment period (compared to 24 percent during the first three months of the initial open enrollment, and 27 percent during the months of January and February).
- SBMs: 25 percent between the ages of 18 and 34 (10-1-13 to 3-1-14).
- FFM: 25 percent between the ages of 18 and 34 (10-1-13 to 3-1-14).
Table 3 shows the age distribution of the Marketplace plan selections (SBMs and FFM) during the first five months of the initial open enrollment period.
Table 3
| Comparison of the Age Distribution of Marketplace Plan Selections (SBM & FFM) For the Five Month period: 10-1-13 to 3-1-14 (based on data reported as of 3-7-14) | Percent of Total Individuals Who Have Selected a Marketplace Plan (1) |
|---|---|
| Age < 18 | 6% |
| Age 18-25 | 10% |
| Age 26-34 | 16% |
| Age 35-44 | 16% |
| Age 45-54 | 23% |
| Age 55-64 | 30% |
| Age ≥659 | 0% |
| Total | 100% |
| Ages 18 to 34 | 25% |
(1) These percentages are based on the total number of plan selections for which the applicable data are available, excluding plan selections with unknown data for age. Additionally, these percentages have been rounded, and may not add to totals due to rounding errors. (Source: Centers for Medicare & Medicaid Services, as of 3-7-2014.)
Consumer Shopping – Marketplace plan selection is expected to continue to grow. Consumer interest in gaining health coverage continues to be strong among Americans who currently lack insurance – a recent Gallup survey found that 55 percent of uninsured adults say that they are likely to get health insurance in 2014, and the majority of those who intend to get insurance plan to use the Marketplace.10 Similarly, a recent McKinsey & Company survey found that most (65 percent) of the respondents who said that they intend to enroll in coverage are persons who were previously uninsured.11
Recent national surveys indicate that the number of Americans with health insurance coverage is growing. For example, Gallup has found that the percentage of uninsured Americans has decreased by 1 percentage point during the first quarter of 2014 (16 percent uninsured, compared to 17.1 percent in the fourth quarter of 2013).12 Similarly, McKinsey & Company’s February survey of consumers eligible to purchase individual coverage during open enrollment (either on or off the Marketplace) found that 27 percent of those surveyed who enrolled in health coverage in 2014 report they were previously uninsured (compared with 11 percent in earlier McKinsey surveys), and 10 percent of all respondents who self-identified as being previously uninsured said that they had enrolled in a product (compared with 3 percent in January).13
5 For additional information, please refer to Appendix C of the November Marketplace Enrollment Report, which can be accessed at http://www.aspe.hhs.gov/health/reports/2013/MarketPlaceEnrollment/rpt_en....
6 Centers for Medicare & Medicaid Services, “Enrollment Activity on May 15th,” Press Release, May 16, 2006
7 Based on the total number of plan selections for which the applicable data are available (excluding unknown).
8 Represents individuals who have selected a Marketplace plan, and qualify for an advance premium tax credit (APTC), with or without a cost-sharing reduction (CSR).
9 There are nearly 400,000 uninsured persons over the age of 65; some persons over 65 have selected Marketplace plans.
10 “Majority of Uninsured Say They Will Get Insurance,” Frank Newport, Gallup daily tracking poll, March 7, 2014, accessed at
http://www.gallup.com/poll/167786/majority-uninsured-say-insurance.aspx?....
11 McKinsey Center for U.S. Health System Reform, “Individual market enrollment: Updated view,” March 2014, accessed at healthcare.mckinsey.com/reform.
12 “U.S. Uninsured Rate Drops so Far in First Quarter of 2014,” Jenna Levy, Gallup Gallup-Healthways Well-Being Index survey, February 12, 2014, accessed at http://www.gallup.com/poll/167393/uninsured-rate-drops-far-first-quarter...
13 McKinsey Center for U.S. Health System Reform, “Individual market enrollment: Updated view,” March 2014, accessed at healthcare.mckinsey.com/reform.
Overview of Enrollment-Related Activity to Date
Selected a Marketplace Plan – To date, 4.2 million persons have selected a Marketplace plan during the first five months of the initial open enrollment period, including 1.6 million in SBMs and 2.6 million in the FFM (these numbers include those who have paid a premium and those who have not yet paid a premium, regardless of when their coverage begins).
The following are additional highlights of the preliminary data on the characteristics of Marketplace plan selections during the first five months of the initial open enrollment period (see Appendix A for national-level tables, and see the Addendum to the March Marketplace Enrollment Report for state-level tables).14
- Marketplace Plan Selections by Gender – The gender distribution of Marketplace plan selections has remained constant. More than half of the people who have selected a Marketplace plan through the SBMs and FFM during the first five months of the initial open enrollment period are female (55 percent of the total for the Marketplace as a whole, excluding plan selections where gender is unknown), while the remaining 45 percent are male. The comparable proportions for the first four months of the initial open enrollment period were 55 percent and 45 percent, respectively.
- SBMs: 54 percent female, 46 percent male (10-1-13 to 3-1-14).
- FFM: 56 percent female, 44 percent male (10-1-13 to 3-1-14).
By comparison, males account for half (50 percent) of the total non-elderly population in the United States (ages 0 to 64).15
- Marketplace Plan Selections by Metal Level – The proportion of Silver Marketplace plan selections has continued to increase. Silver plans account for nearly two-thirds (63 percent) of the Marketplace plan selections in the SBMs and FFM between 10-1-13 and 3-1-14 (compared with 62 percent during the first four months of the initial enrollment period).
- SBMs: 58 percent Silver (10-1-13 to 3-1-14).
- FFM: 67 percent Silver (10-1-13 to 3-1-14).
The metal level distribution of the remaining Marketplace plan selections (SBMs and FFM) are as follows: bronze (18 percent), gold (11 percent), platinum (6 percent), and catastrophic (1 percent).
- Marketplace Plan Selections by Financial Assistance Status – The proportion of Marketplace plan selections with financial assistance (i.e., Marketplace plan selections by individuals who are eligible to receive financial assistance) has also continued to increase. Based on data for the first five months of the initial open enrollment period, more than eight out of ten (83 percent) of the people who have selected a Marketplace plan through the SBMs and FFM are eligible to receive Federal financial assistance in paying their premiums.16 The comparable proportion for the first four months of the initial open enrollment period was 82 percent.
- SBMs: 81 percent in Marketplace plans with financial assistance (10-1-13 to 3-1-14).
- FFM: 85 percent in Marketplace plans with financial assistance (10-1-13 to 3-1-14).
Tax credits for premium assistance may be available to individuals with family incomes between 100 and 400 percent of the Federal Poverty Level (138 to 400 percent of FPL in states taking the Federally-funded option to expand Medicaid). These percentages are consistent with previous estimates.17
Additional Characteristics of FFM Marketplace Plan Selections – The following are highlights of preliminary data on additional characteristics of FFM Marketplace plan selections, based on cross-tabulations of the abovementioned metrics (see Appendix B for national-level tables, and see the Addendum to the Marketplace Enrollment Report for state-level tables).
- FFM Marketplace Plan Selections by Gender and Age
- Young adults (ages 18-34) accounted for 26 percent of all males selecting Marketplace plans through the FFM, compared with 25 percent of all females selecting Marketplace plans through the FFM, and 25 percent of all FFM Marketplace plan selections as a whole.
- Meanwhile, adding children ages 0 to 17 results in males between the ages of 0 and 34 accounting for nearly a third (33 percent) of all males selecting Marketplace plans through the FFM, compared with 30 percent for females, and 31 percent for all persons who selected a Marketplace plan through the FFM.
- FFM Marketplace Plan Selections by Gender and Metal Level
- Females were more likely to select Silver plans in the FFM (69 percent versus 65 percent for males).
- Males were more likely to select Bronze plans in the FFM (17 percent versus 15 percent for females).
- FFM Marketplace Plan Selections by Financial Assistance Status and Metal Level
- Persons selecting a Marketplace plan who are eligible to receive financial assistance were more likely to select Silver plans in the FFM (74 percent versus 26 percent for persons selecting a Silver Marketplace plan without financial assistance).
- Persons selecting a Marketplace plan without financial assistance were more likely to select Bronze plans in the FFM than other metal levels (30 percent versus 13 percent for persons selecting a Marketplace plan with financial assistance). They were also more likely to select gold, platinum and catastrophic plans than were persons who are eligible to receive financial assistance.
- More than nine out of ten (93 percent) of the persons selecting a Silver plan in the FFM are eligible to receive Federal financial assistance in paying their premiums.
- FFM Marketplace Plan Selections by Metal Level and Age
- Among young adults (ages 18 to 34), 66 percent selected a Silver plan, while 15 percent selected a Bronze plan, 10 percent selected a Gold plan, 5 percent selected a Platinum plan, and 4 percent selected a Catastrophic plan.
- Nearly one out of three (30 percent) of the nearly 543,270 persons who selected a standalone dental plan through the FFM are young adults (ages 18-34).
Table 4
|
Cumulative Marketplace Enrollment-Related Information
For the Five Month period: 10-1-13 to 3-1-14 (1) (based on data reported as of 3-7-14) |
Marketplace Total |
SBM
Total |
FFM
Total |
|---|---|---|---|
| Visits on the Marketplace websites (2) | 74,625,397 | 22,563,745 | 52,061,652 |
| Calls to the Marketplace call centers | 19,357,291 | 6,227,452 | 13,129,839 |
| Number of individuals who have selected a Marketplace plan | 4,242,325 | 1,621,239 | 2,621,086 |
| Males who have selected a Marketplace plan (3) | 45% | 47% | 44% |
| 18 to 34 year olds who have selected a Marketplace plan (3) | 25% | 25% | 25% |
| Individuals who have selected a Silver Marketplace plan (3) | 63% | 58% | 67% |
| Individuals who have selected a Marketplace plan with financial assistance (3) | 83% | 81% | 85% |
(1) The reporting period for the first 5 months is from 10-1-13 to 3-1-14. Any differences in reporting periods among states are noted in footnotes accompanying the tables in the Addendum to the March Marketplace Enrollment Report. See Appendix D for methodological information. Visitors to the Marketplace websites is the sum of monthly data and has been unduplicated to the extent possible; however, we do not believe that all duplication has yet been removed.
(2) While all SBMs have provided updated data on call center activity, not all SBMs have provided updated data on website visits.
(3) Percentages shown in this table are based on the total number of plan selections for which the applicable data are available, excluding plan selections with unknown data for a given metric (e.g., age, gender, etc.)
Source: Centers for Medicare & Medicaid Services, as of 3-7-2014.
Web Site and Call Center Volume – Interest in the Marketplaces continues to be high, as measured by visits on the SBM and FFM websites (over 74 million),18 and calls to the SBM and FFM call centers (over 19 million) through the end of February.).
14 The percentages cited in this section are based on the total number of plan selections for which the applicable data are available, excluding plan selections with unknown data for a given metric (e.g., age, gender, metal level, etc.) Aggregate data on the total number of plan selections with available data for a given metric, and the corresponding number of plan selections with unknown data for a given metric can be found in Appendix Table A1.
15 ASPE analysis of the 2010-2012 Current Population Survey Annual Social and Economic Supplement (CPS ASEC, covering calendar years 2009-2011), adjusted using ASPE’s TRIM3 microsimulation to include only estimated nonelderly U.S. citizens and others lawfully present.
16 This includes people who qualify for an advance premium tax credit (APTC), with or without a cost-sharing reduction (CSR).
17 For example, the Congressional Budget Office (CBO) estimates for CY 2014 were as follows: 6 million subsidized / 7 million total in Marketplace = 86% with financial assistance. (Source: "Effects on Health Insurance and the Federal Budget for the Insurance Coverage Provisions in the Affordable Care Act—May 2013 Baseline," May 14, 2013, accessed at http://www.cbo.gov/sites/default/files/private/cbofiles/attachments/44190_Effect....)
18 While all SBMs have provided updated data on call center activity, not all SBMs have provided updated data on website visits. In addition, duplication has been removed from the data on the cumulative number of website visitors to the extent possible; however, it is possible that not all duplication has been removed.
Methodological Overview
The data reported here have been generated by the information systems of the Centers for Medicare & Medicaid Services (CMS), based on information reported to CMS by SBMs, and information collected by the FFM for states with HHS-supported or fully run Marketplaces (including those run in partnership with states). Data for certain metrics are not yet available for some SBM states due to information system issues. (Please refer to Appendix D for additional methodological information.)
As discussed earlier, this report includes cumulative data for the five-month period (10-1-13 to 3-1-14) because some people apply, shop, and select a plan across more than one monthly reporting period. To the extent possible, these counts seek to avoid potential duplication associated with monthly reporting.
This report also includes preliminary data on the characteristics of persons who have selected a Marketplace plan (by gender, age, metal level, and financial assistance status for the SBMs and FFM; and for the FFM, by gender and age, gender and metal level, financial assistance status and metal level, and metal level and age). In some cases, the data for certain characteristics of Marketplace plan selections are not yet available. Detailed state-level tables can be found in Appendix C, and in the Addendum to the March Marketplace Enrollment Report.19
We believe that the information contained in this issue brief provides the most systematic “snapshot” of enrollment-related activity in the Marketplaces to date because the data for the various metrics are counted using comparable definitions for data elements across states, and between the SBMs and FFM. It is important to note that the SBM enrollment-related data that are reported in this issue brief represent state data that have been reported to CMS through March 7, 2014, and may differ from comparable data that have previously been publicly reported on SBM websites or in media reports because that data may be based on different time periods or metric definitions from those used in this report.
19 The Addendum to the March Enrollment Report is available at http://aspe.hhs.gov/health/reports/2014/MarketPlaceEnrollment/Mar2014/ib... .
Appendices
| Contents | |
|---|---|
| Appendix A: | Appendix A: Characteristics of Marketplace Plan Selection by Gender, Age, Metal Level, and Financial Assistance, 10-1-2013 to 3-1-201 |
| |
| |
| |
| |
| |
| Appendix B: | Summary of Additional Characteristics of FFM Marketplace Plan Selections, 10-1-2013 to 3-1-2014 |
| |
| |
| |
| |
| |
| Appendix C: | Total Marketplace Eligibility Determinations, and Marketplace Plan Selections by Marketplace Type and State, 10-1-2013 to 3-1-2014 |
| Appendix D: | Methodology and Technical Notes |
Note: The Addendum to the March Enrollment Report is available at http://aspe.hhs.gov/health/reports/2014/MarketPlaceEnrollment/Mar2014/ib_2014Mar_enrollAddendum.pdf .