
U.S. Department of Health and Human Services
Health and Disability Status of AFDC Families
Michele Adler
Office of the Assistant Secretary for Planning and EvaluationU.S. Department of Health and Human Services
1988
PDF Version: http://aspe.hhs.gov/daltcp/reports/afdc.pdf (17 PDF pages)
This paper was prepared by U.S. Department of Health and Human Services (HHS), Office of Disability, Aging and Long-Term Care Policy (DALTCP). It was included as part of the 1988 Proceedings of the American Statistical Association: Social Statistics. For additional information about this subject, you can visit the DALTCP home page at http://aspe.hhs.gov/_/office_specific/daltcp.cfm or contact the office at HHS/ASPE/DALTCP, Room 424E, H.H. Humphrey Building, 200 Independence Avenue, S.W., Washington, D.C. 20201. The e-mail address is: webmaster.DALTCP@hhs.gov. The Project Officer was Michele Adler.
The opinions and views expressed in this report are those of the author. They do not necessarily reflect the views of the Department of Health and Human Services.
A. OVERVIEW
The Aid to Families with Dependent Children (AFDC) population is made up almost entirely of young mothers and their children. Disability is not a common concern among those studying AFDC recipients, nor are AFDC recipients a common concern among those who study disability. This is because AFDC recipients are young and because, programmatically, there is another cash welfare program--Supplemental Security Income (SSI)--specifically targeted to the disabled.
It is, therefore, surprising to learn that women on AFDC are significantly more likely to be disabled than other women their age. According to the 1983/84 Survey of Income and Program Participation (SIPP), nearly one in four women on AFDC under the age of 45 (22 percent) report themselves as disabled compared to one in eleven (9 percent) such women not on AFDC. In fact, women on AFDC have disability rates nearly as high as women old enough to be their mothers (or grandmothers). For example, the age-specific disability rate for women on AFDC aged 35-44 is 45.9 per hundred--only slightly below the 52.4 per hundred rate for women aged 65-74.
AFDC mothers may not be the only disabled members of the family. Twelve percent of women on AFDC under the age of 45 report that they have at least one disabled child compared to only 3 percent not receiving AFDC.
The purpose of this paper is to examine the health and disability status of AFDC families using information gathered in the SIPP and to assess the implications for welfare work programs. No such analysis has been performed before, because SIPP was the first survey to collect extensive data on income, participation in AFDC and health and disability. This analysis primarily concerns the disability of women in AFDC families, as SIPP data on disabled children are, as yet, incomplete.
B. SOURCE AND LIMITATIONS OF THE DATA
Information from this paper came from the SIPP, a nationally representative survey of the noninstitutionalized American population. The SIPP is a longitudinal survey of adults (persons aged 15 years or older) obtained from a multi-stage stratified sample. Initial interviews began in October 1983 and were conducted in over 19,000 households (nearly 600 of which were on AFDC). Nine interviews or waves were conducted at four-month intervals.
Data in this paper are derived from the Wave 3 core questionnaire, the Wave 3 Topical Module on Education, Work History and Health and Disability, and the Wave 5 Topical Module on Welfare History.
The SIPP is an especially rich source of information on disability, because the questions were designed so that disability can be defined in several ways: in a variety of functional ways or as the receipt of disability benefits. Typically, disability is defined simply as the receipt of benefits from programs targeted on the disabled, such as Social Security Disability Insurance (SSDI) or SSI. Therefore, past analyses on disability have not included the AFDC population, as few AFDC family members receive SSDI or SSI. However, an analysis based on the 1957 Health Interview Survey indicated a high proportion of work disability among young, female heads of households (Morgan, et al.). For this analysis, disability is functionally defined as moderate or severe. Moderately disabled persons were those who reported difficulty with, but who could perform, one of the physical or sensory activities (i.e., walking, seeing, lifting). Severely disabled people were identified either as those who had difficulty with more than one physical or sensory activity or those who were unable to perform physical activities, such as lifting, walking, or climbing stairs, or who could not take care of their physical needs or get around without the help of another person.
C. THE AFDC AND SSI PROGRAMS
The AFDC program is targeted on low-income families, primarily headed by single women. The AFDC program is administered by the individual States, but jointly funded by both the Federal and State governments. In order to qualify for AFDC, a child must be deprived of parental care and support due to the death, incapacity, continued absence from the home, or, in some states, unemployment of a parent. AFDC families are typically composed of a single mother and her children. AFDC recipients are automatically enrolled in Medicaid, which pays for their health care.
The SSI program is targeted on poor persons who are aged, blind, or disabled. In order to qualify for the disabled component of SSI, a person must be, by reason of disability, unable to engage in any substantial gainful activity, because of a medically determined physical or mental impairment expected to last for at least 12 months or to result in death.
Benefits from both AFDC and SSI can be received in low-income families, but not by the same person. For example, disabled parents can receive SSI while also obtaining benefits from AFDC on behalf of their dependent children. In the case where the child is disabled, that child could receive SSI while his or her mother and siblings receive AFDC. A 1979 study (Rymer, et al.) found that 42 percent of disabled children on SSI lived in households which had received AFDC or State or local general assistance during the previous year.
Disabled women may be on the AFDC program, rather than SSI (only 7 percent of disabled women in AFDC families receive SSI), because the eligibility rules for SSI are so strict. SSI eligibility for the disabled is established only after medical review. In general, the younger a person is the harder it is to be determined as disabled through medical reviews. The amount of the monthly AFDC check varies by State, family size, and other circumstances. SSI benefits are generally greater than those from AFDC, so there is usually an incentive for AFDC families with disabled members to apply for SSI.
D. COMPARISONS OF DISABILITY
1. Percent Disabled
Young women aged 18-44 who receive AFDC are significantly more likely to be disabled than women of the same age who do not receive AFDC: 21.6 percent compared to 9.0 percent, respectively. In the general population, blacks are more likely to be disabled than whites, but these differences disappear among the AFDC population. The percentage of disabled white women on AFDC (22.0 percent) is virtually the same as for black women on AFDC (20.7 percent). However, very real differences exist between the races for women not on AFDC: 8.4 percent of whites and 13.1 percent of blacks are disabled. (See Table 1.)
2. Severity of the Disability
Disabled women on AFDC are also unlike their non-AFDC counterparts in another important respect: their disability is more likely to be severe than moderate. The exact opposite is true for the rest of the population. Fifty-eight (58) percent of disabled women on AFDC have a severe disability compared to 37 percent of disabled women not on AFDC. For both black women and white, the pattern is consistent. Severely disabled women outnumber those who are moderately disabled in the AFDC population and in the non-AFDC population, the moderately disabled outnumber those who are severely disabled.
3. Disability Rates
Disability depends principally on age, but income is also important. In general, disability rates are higher for older persons and for the poor. However, women on AFDC are still more likely to be disabled than other women even after income and age are taken into account.
Disability rates are nearly twice as high for poor (less than 200 percent of the poverty) women on AFDC as for poor women not on AFDC. The disability rate for women aged 25-34 is 19.5 per hundred for women on AFDC and 10.8 per hundred for women not on AFDC and the rate for women aged 35-44 for women on AFDC (46.1 per hundred) is significantly higher than for women not on AFDC (23.1 per hundred).
4. Conditions
Self-reported health conditions mainly responsible for disability are very much the same for women on AFDC as for other women. Back or spine problems are the single most common cause of work disability for women under age 45, regardless of whether or not they receive AFDC. The prevalence of this condition is virtually the same for both groups: 24.7 percent of disabled women on AFDC and 26.9 percent of disabled women not on AFDC reported problems with their back or spine as the main reason they were unable to work. The second most frequent reason (again the same for both groups) was "other" conditions: 23.7 percent for women who received AFDC and 19.1 percent for those who did not. Lung or respiratory trouble, at 11.1 percent, was the third most common cause of disability among AFDC recipients and the fifth (at 7.2 percent) for those not receiving AFDC.
E. COMPARISONS OF DISABLED AND NON-DISABLED WOMEN ON AFDC
1. Age
Disabled women on AFDC tend to be significantly older than their non-disabled counterparts. Disabled women are, on the average, 5.5 years older than non-disabled women: 32.3 years compared to 26.8 years. Similarly, severely disabled women tend to be significantly older--their average age is 33.8 years--than moderately disabled women, whose average age is 30 years.
Racial differences are small, with disabled black women tending to be slightly older than whites. The average age for disabled blacks is 33 compared to 32.4 for disabled whites. The average age for non-disabled blacks and whites on AFDC is almost identical: 26.3 years and 26.8 years, respectively.
Much of the overall youth associated with the AFDC population can be attributed to non-disabled women. Significant differences are found when looking at the percentage of AFDC women aged 35 or older: only 14.4 percent of non-disabled women are aged 35 or over compared to 44.6 percent of the disabled, 30.9 percent of the moderately disabled and 54.5 percent of the severely disabled.
2. Marital Status
Overall, women on AFDC who have never married (44 percent) outnumber those who are separated or divorced (41 percent), those who are still married (13 percent), and widows (1 percent). Nearly one-half (48.8 percent) of non-disabled women have never been married compared to one-third of moderately disabled (33.2 percent) and one-fourth (24.7 percent) of severely disabled women. There are racial differences, with blacks far more likely than whites to have never been married. However, disabled women are more likely to have been married, that is separated or divorced, regardless of race: 66.5 percent of disabled whites and 57.1 percent of disabled blacks are separated or divorced.
3. Children
The average number of children (2.5) is the same for disabled and non-disabled women on AFDC. However, disabled women are significantly more likely to have older children, reflecting their average older age. The youngest child is at least 6 year old for one-quarter (24 percent) of non-disabled women compared to nearly one-half (47.3 percent) of disabled women.
Disabled women not only have older children, but they also have a significantly greater chance of having a disabled child than non-disabled women on AFDC. Race is not a factor. Nearly one-fourth (23.3 percent) of disabled women on AFDC have a disabled child compared to 9.3 percent of non-disabled AFDC women. Furthermore, the more severely disabled an AFDC women is, the greater her chance of having a disabled child: 25.2 percent of severely disabled and 20.6 percent of moderately disabled women on AFDC have a disabled child. (See Table 2.)
4. Education
The educational attainment of AFDC recipients is low, but non-disabled AFDC recipients are slightly better educated than their disabled counterparts. (However, none of these differences are statistically significant.) Overall, one-half (49 percent) of non-disabled and 57.2 percent of disabled women on AFDC have not finished high school. Those who are severely disabled are even more likely not to have graduated from high school: 61.6 percent of severely and 51 percent of moderately disabled women do not have a high school diploma. Although whites are more likely to have graduated from high school than blacks, the same pattern for disabled and non-disabled occurs: 42.7 percent of non-disabled whites and 52.54 percent of disabled whites have not finished high school. Similarly, 52.2 percent of non-disabled and blacks and 56.2 percent of disabled blacks also have not graduated.
5. Welfare
Moderately disabled women have been on the AFDC rolls for roughly the same number of years as the non-disabled: 3.9 years and 3.8, respectively. However, the severely disabled (at 6.9 years) have been on AFDC significantly longer (about 3 years) than the non-disabled or the moderately disabled.
Blacks tend to report longer welfare stays than whites. However, regardless of race, the disabled report a greater length of time on welfare than the non-disabled. For whites, the difference is small: only one year separates the average length of time on AFDC for the disabled (4.3 years) and non-disabled (3.3 years). However, disabled blacks reported an average of 8.5 years on AFDC: nearly 4.5 years longer than non-disabled blacks (4.1 years).
Although most AFDC recipients also receive Food Stamps, the disabled are slightly more likely to get Food Stamps than the non-disabled: 73.4 percent of disabled and 84.5 percent of non-disabled AFDC recipients get Food Stamps. (See Table 3.)
6. Work Experience
Although severely disabled women tend to have been on the welfare rolls the longest and to be the most poorly educated, they are also, curiously enough, the most likely to have had some work experience. (However, none of these differences are statistically significant). Eighty-six (86) percent of severely disabled women reported work experience. Little difference exists between the proportion of moderately disabled and non-disabled women: 79.4 percent of the moderately disabled, and 78.7 percent of the non-disabled reported some work experience. More whites reported work experience than blacks, but the same pattern persisted, with the disabled tending to have slightly more experience than the non-disabled. Overall, disabled whites (at 91.6 percent) were the most likely to have work experience and non-disabled blacks (at 75.4 percent) the least.
7. Health Status and Medical Utilization
Self-reported health status is a good indicator of overall health and is highly correlated with disability. When asked how to rate their health status (excellent, very good, good, fair, or poor), women on AFDC are far more likely to report themselves as being in fair or poor health than the rest of the population. In turn, disabled women on AFDC are significantly more likely to report themselves in fair or poor health than those who are non-disabled. However, 13.7 percent of the non-disabled women and 59.6 percent of disabled women on AFDC report themselves in fair or poor health. Health status is worse for the severely, rather than for the moderately disabled: 72 percent of severely disabled and 42 percent of moderately disabled women are in fair or poor health.
Among the general population, the proportion of blacks in fair or poor health is slightly greater than that for whites. However, the proportion of disabled women with fair or poor health is virtually identical for both blacks and whites: 61.5 percent compared to 60.5 percent, respectively.
The average number of doctor visits (4.2) for non-disabled women on AFDC is slight;y fewer than the national average of 4.7. However, disabled women on AFDC reported a significantly higher average doctor visits (9.5). Severely disabled women had more (11 visits) and moderately disabled fewer (7.5 visits). Indeed, severely disabled women on AFDC average more doctor visits per year than the elderly--whose average is 8.3 visits.
F. WELFARE WORK PROGRAMS
Welfare work programs are seen by many as attempt to lessen dependency on AFDC. Federal law requires certain able-bodied AFDC recipients aged 16 years or older to register for work or job training. Exemptions are allowed if the individual is unable to participate due to illness or incapacity, advanced age, full-time student status, remoteness from a work registration facility, the need to care for an ill or incapacitated household member, or if that individual is in the last trimester of pregnancy or is already working 30 or more hours per week. State AFDC programs may require work registrants to participate in one of several work programs: the Work Incentive Program, the Community Work Experience Program, Work Supplementation, or Job Search.
In addition, States may obtain demonstrations from the Federal government to develop and establish work programs designed to decrease welfare dependency. Under these waivers, States can be more flexible in developing welfare work programs. For example, recipients are exempted from registering for work programs if their youngest child is under age six. However, States have the option of lowering the age to under three or maybe even younger.
The high level of disability among AFDC women has implications for how many women can realistically register for welfare work programs. Although there are provisions for exempting incapacitated persons from work program registration, the number of such individuals may be higher than previously believed. Nationwide, only 3 percent of AFDC parents are eligible for AFDC on the basis of incapacitation. The number of incapacitated persons is obtained by counting how many adults become eligible for AFDC on this basis. However, individuals are placed in this category only because when they do not come in under any other criteria. For example, a woman is both unmarried and incapacitated, she would be judged as eligible for AFDC because she is unmarried, not because she is incapacitated. AFDC program counts of the incapacitated are, therefore, artificially low.
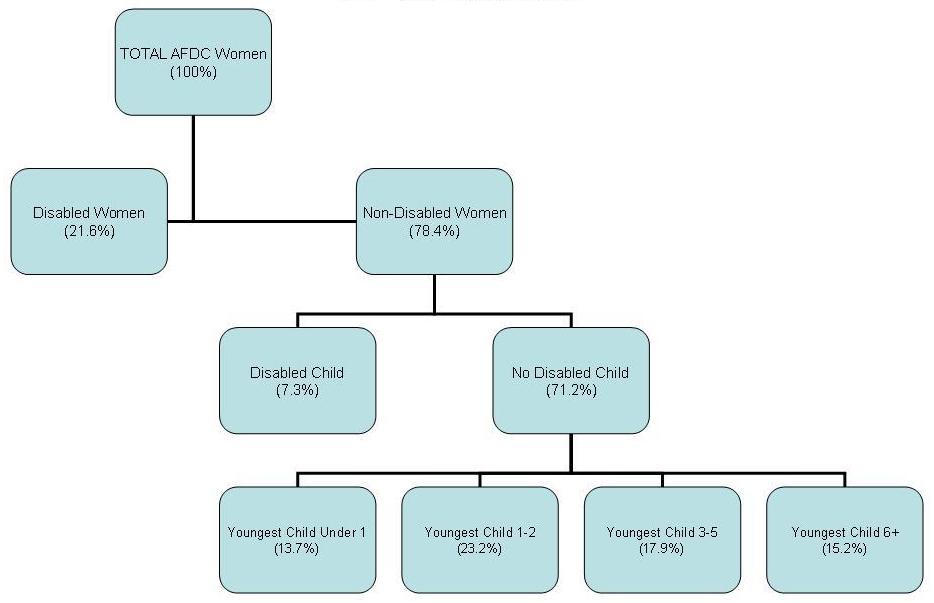
The following figure gives a breakdown of the percentage of AFDC women who would be eligible for welfare work programs if the prevalence of disability, as indicated in SIPP, is considered. However, it is important to note that disability which is self-reported in a survey, such as SIPP, may not entirely coincide with the process which welfare offices use to exempt persons on the basis of illness or incapacitation from work registration requirements. (See FIGURE 1.)
The percent of women eligible to register for work programs is arrived at after three steps. First, women who are disabled are exempted. Secondly, non-disabled women with disabled children are exempted. Finally, the age of the youngest child is considered (i.e. under one, under three, or under six years of age).
| Step 1 | 21.5 percent of women are exempt from registration because they are disabled. |
| Step 2 | Another 7.3 percent are exempt, because although they are not disabled, they have a disabled child. |
| Step 3 | States which require registration for mothers whose youngest child is under six would have only 15.2 percent eligible for work programs. States setting the age limit as under three would have 36.9 percent and States which would require all mothers whose youngest child is under age one would have 54.8 percent of the mothers available for registration. |
One reason for these somewhat low percentages is that the non-disabled AFDC mothers are younger and are actually more likely to have very young children (and thus be exempt from work registration requirements) than older, disabled mothers.
G. CONCLUSIONS
According to SIPP, women receiving AFDC are much more apt to be disabled than those not on welfare. The numbers are much higher than expected even after the usual predictors of disability (age, race, and income) have been considered. The number of disabled children living in AFDC families is also high.
Very little is known about why these women and their children are disabled. Disabilities can occur for many reasons, such as infectious diseases (AIDS), non-infectious diseases (hypertension), accidents, injuries, congenital abnormalities, or as the result of mental illness or drug or alcohol abuse.
Disabled and non-disabled women on AFDC differ in so many respects that it is easy to think of them as two separate populations, who may very well have entered and stayed on welfare for entirely different reasons. The non-disabled are younger, have younger and healthier children, have spent less time on welfare, and are more likely to be unmarried. The disabled, on the other hand, are older, more apt to have a disabled child, have longer stays on welfare, and are more likely to have separated from or divorced their husbands.
Disability should be considered in work welfare programs. These programs may have to be modified for the disabled or for those who have disabled children. At first glance, it appears far fewer women would be eligible for work programs if disability status is considered.
However, there are hopeful notes. More disabled than non-disabled women have a work history so they may be willing to work if their health improves. It may very well be premature to recommend specific ways to lessen the welfare dependency of disabled women until more is known about why they are disabled. However, many disabling conditions can be medically treated so that the disabled person is able to work again.
H. SOURCES
Committee on Ways and Means, U.S. House of Representatives: Background Material and Data on Programs within the Jurisdiction of the Committee on Ways and Means. Committee Print WMCP:100-29, Washington, DC, March 24, 1988.
Committee on Ways and Means, U.S. House of Representatives: Background Material and Data on Programs within the Jurisdiction of the Committee on Ways and Means. Committee Print WMCP:100-4, Washington, DC, March 6, 1987.
McNeil, J. and Lamas, E.: Disability, Functional Limitation, and Health Insurance Coverage: 1984/85. U.S. Bureau of the Census Current Population Reports, Household Economic Studies, Series P-70, No.8, Washington, DC, December 1986.
Morgan, J.; David, M.; Cohen, W.; and H. Brazer: Income and Wealth in the U.S. McGraw Hill, 1962.
Rymer, M., Reither, M., Goldman, R., and VandeVanter, M.: Survey of Blind and Disabled Children Receiving SSI Benefits. SSA Pub.No.13-11728, Social Security Administration, Washington, DC, 1980.
U.S. Bureau of the Census: SIPP Informational Booklet: 1984 Panel (Waves 1-9). Unpublished Document.
U.S. Bureau of the Census: SIPP Public-Use Data Tapes (Waves 1, 2, and 3; the Wave 3 Education, Work History, and Health and Disability Topical Module and the Wave 5 Welfare History Topical Module).
U.S. Bureau of the Census: Survey of Income and Program Participation User's Guide. Washington, DC, July 1987.
ACKNOWLEDGEMENTS: The author wishes to acknowledge the superb computer programming of Ruth Fu of the Office of Program Systems, ASPE. Her expert knowledge of the intricacies of the SIPP files and her many helpful suggestions should be used greatly contributed to the analysis. The author also wishes to thank Canta Pian of the DHHS for her overall guidance on the operation of the AFDC program and work welfare programs.
NOTE: The statements contained in this paper are solely those of the author and do not necessarily reflect the views and policies of the Office of the Assistant Secretary for Planning and Evaluation.
| FIGURE 1. AFDC Population Eligible for Welfare Work Programs |
 |
| TABLE 1. PERCENT AND TYPE OF DISABILITY FOR WOMEN UNDER AGE 45 BY RECEIPT OF AFDC--1984 SIPP | ||
| Percent On AFDC | Percent Not AFDC | |
| ALL RACES | ||
| Not Disabled | 78.4* | 91.0 |
| Disabled | 21.6* | 9.0 |
| - Moderately | 9.0 | 5.6 |
| - Severely | 12.6** | 3.4 |
| WHITES | ||
| Not Disabled | 78.0* | 91.6 |
| Disabled | 22.0** | 8.4 |
| BLACKS | ||
| Not Disabled | 79.3** | 86.9 |
| Disabled | 20.7 | 13.1 |
| * 95% Significant/** 90% Significant | ||
| TABLE 2. PERCENT OF WOMEN ON AFDC WITH AT LEAST ONE DISABLED CHILD--1984 SIPP | |
| Percent With Disabled Child(ren) | |
| ALL RACES | |
| Not Disabled | 9.3 |
| Disabled | 23.3* |
| -- Moderately | 20.6** |
| -- Severely | 25.2* |
| WHITES | |
| Not Disabled | 9.8 |
| Disabled | 23.3 |
| BLACKS | |
| Not Disabled | 8.0 (B) |
| Disabled | 24.7 (B) |
| * 95% Significant/** 90% Significant | |
| TABLE 3. LENGTH OF TIME ON AFDC AND PARTICIPATION IN OTHER WELFARE PROGRAMS FOR WOMEN ON AFDC, 1984 SIPP | ||
| Average Months On AFDC | Percent On Food Stamps | |
| ALL RACES | ||
| Not Disabled | 3.8 | 73.4 |
| Disabled | 5.6* | 84.5** |
| -- Moderately | 3.9 | 86.9** |
| -- Severely | 6.9* | 82.3 |
| WHITES | ||
| Not Disabled | 3.3 | 72.3 |
| Disabled | 4.3 | 80.1 |
| BLACKS | ||
| Not Disabled | 4.1 | 71.6 |
| Disabled | 8.5* | 85.8** |
| * 95% Significant/** 90% Significant | ||