
A Framework for Evaluating Quality Transparency Initiatives in Health Care
Final Report
Prepared by:
Ha T. Tu Johanna R. Lauer
April 15 , 2008
Prepared for:Office of the Assistant Secretary for Planning and Evaluation (ASPE)U.S. Department of Health and Human Services (HHS)
This report is available on the Internet at:http://aspe.hhs.gov/health/reports/08/quality/report.html
Printer Friendly Version in PDF format (59 pages)
TABLE OF CONTENTS
PROJECT DESCRIPTIONQUALITY TRANSPARENCY LITERATURE REVIEWPROGRAM EVALUATION FRAMEWORKPROGRAM EVALUATION FRAMEWORK AS APPLIED TO QUALITY TRANSPARENCYCASE STUDY 1: CALHOSPITALCOMPARECASE STUDY 2: MASSACHUSETTS HEALTH QUALITY PARTNERSKEY TAKEAWAY POINTSAPPENDIX 1: INTERVIEW RESPONDENTSAPPENDIX 2: KEY SOURCES ENDNOTES
LIST OF TABLES AND FIGURES
FIGURE 1: GENERIC LOGIC MODEL TABLE 1: BENNETT’S HIERARCHY FIGURE 2: GENERIC QUALITY TRANSPARENCY LOGIC MODEL FIGURE 3: GENERIC QUALITY TRANSPARENCY LOGIC MODEL CONTINUEDTABLE 2: GENERIC QUALITY TRANSPARENCY EVALUATION QUESTIONSTABLE 3: GENERIC QUALITY TRANSPARENCY EVALUATION METHODS
PROJECT DESCRIPTION
Research Objectives: To develop a conceptual framework for evaluating the impact of health care quality transparency initiatives. In developing this framework, three major research questions are addressed:
- What are the characteristics and processes of a program evaluation that will result in an effective and unbiased evaluation of a quality transparency initiative?
- What are the most important substantive issues (evaluation questions) that a program evaluator must address in assessing the impact of a quality transparency initiative?
- For those evaluation questions identified as being the most critical, what are the most feasible and cost-effective evaluation methods for measuring performance of the initiative?
Background and Brief Description
Unlike price transparency initiatives in health care, most of which have been launched only within the past few years, some quality reporting programs have been available to the public since the late 1980s. An assessment of early quality transparency programs suggests very limited impact, with consumers and purchasers rarely seeking out the relevant quality information and often not understanding or trusting it.[1]
Recently, quality transparency initiatives have not only increased in number but also gained prominence and visibility for several reasons. First, the Internet has enabled more quality information to be disseminated to broader audiences in a more timely, efficient and low-cost manner. In addition, advocates of health care consumerism have increasingly pushed for the public dissemination of provider quality data in tandem with price data to enable consumers to assess and shop for health services based on perceived value (a price-quality combination preferred by the consumer). The federal government has supported these efforts, with President Bush issuing an executive order in August 2006 requiring each federal agency that administers or sponsors a health care program to make provider quality information available to program beneficiaries or enrollees.[2]
While both private and public, and voluntary and mandatory, quality reporting programs have proliferated, little is known about what impact, if any, these initiatives have had on consumer awareness and shopping behavior or provider quality standards and competition. Indeed, there has been little discussion about how to apply a standardized evaluation framework for assessing the success or impact of quality transparency initiatives, which vary widely in stated objectives, as well as scope, resources and implementation approaches.
The aim of this project is to create a framework for assessing the impact of quality transparency initiatives in health care. This analysis is a companion study to an analysis The Center for Studying Health System Change (HSC) conducted for ASPE in 2007: A Framework for Evaluating Price Transparency Initiatives in Health Care. In this study, we draw on many of the findings reported in the price transparency analysis. In developing the framework for this study, we reviewed the literature on program evaluation and quality transparency and discussed the topic with experts (see Appendices 1 and 2). This report begins with an overview of the literature on quality transparency. Similar to our previous report on price transparency, this section is followed by a discussion of the framework and practice of program evaluation, which incorporates a literature review, insights offered by program evaluation experts, and our own analysis of the aspects of program evaluation most pertinent to assessments of quality transparency programs. The next section of the report is an in-depth discussion of how the standard program evaluation framework would be applied to quality transparency programs. We provide a detailed description of the steps involved in evaluating a “generic” quality transparency program, including the formulation of a logic model, evaluation questions and evaluation design. To provide more concrete examples, this section is followed by two quality transparency evaluation case studies. Although these case studies are by no means intended to be comprehensive evaluations, they highlight key ideas and methods that would be used by an evaluator of such programs. In the final section, we summarize our report with 10 key takeaway points that underline important concepts related to both the design and the evaluation of quality transparency programs.
QUALITY TRANSPARENCY LITERATURE REVIEW
Policymakers and health care researchers have investigated quality transparency for a number of years, and, consequently, there are many studies assessing specific transparency initiatives and the quality of their data.[3] However, the body of literature that provides a conceptual framework for an in-depth analysis of quality transparency issues is more limited. One of the seminal papers, which does objectively discuss the theory of quality transparency, is “The Public Release of Performance Data: What Do We Expect to Gain? A Review of the Evidence,” by Martin Marshall, et al. In this article, Marshall discusses how policymakers have advocated quality transparency as a mechanism to achieve a wide variety of goals: regulating providers of care, ensuring accountability, informing, promoting quality improvement, and encouraging cost control.[4] However, most researchers agree that based on what quality transparency initiatives realistically can achieve, their objectives and target audiences ought to be defined more narrowly. In another article, Marshall offers two general objectives for quality transparency initiatives: (a) to increase the accountability of health care organizations, professionals and managers, and (b) to maintain standards or stimulate improvements in the quality of care provided.[5]
Similar to the objectives, the target audience for quality transparency initiatives also can be misrepresented. Marshall explains how quality transparency programs typically name a variety of target audiences, including consumers, purchasers, physicians and/or provider organizations. In reality, however, each of these groups might not use the program and change their behavior. Although many quality transparency programs are aimed primarily at consumers, the literature is inconclusive about whether consumers actually use the Web sites or reports, and in particular, whether they alter their use of health care services as a result. Several studies have shown that consumers exposed to quality transparency initiatives continue to use hospitals with high mortality rates and that consumer decisions regarding hospitals are more likely to be influenced by anecdotal press reports than risk-adjusted mortality data.[6] Marshall attributes this phenomenon to a number of factors, including consumer difficulty in understanding the information, disinterest in the nature of the information available, lack of trust in the data, problems with timely access to the data and lack of choice. Nevertheless, one study of a specific quality transparency program reveals that consumers exposed to a public report of provider quality were much more likely than other consumers to have accurate perceptions of the relative quality of local hospitals, and these perceptions persisted for at least two years after the release of the report.[7]
In addition to consumers, quality transparency program designers often focus on purchasers of health care (e.g., employers and coalitions). However, evidence from the literature suggests that quality transparency has only a small, though possibly increasing, effect on purchasing behavior.[8] Similarly, although health plans are often involved in quality transparency programs, looking to steer their members to high-quality providers, studies have shown that managed care patients were in fact less likely to have surgery at lower-mortality hospitals.[9]
Individual physicians may also be a target audience for quality transparency initiatives, as they may use the information to either alter their own behaviors or refer their patients to high-performing specialists.[10] Yet, for the most part, individual physicians tend to view quality transparency with skepticism and consider it to be of minimal usefulness, particularly because of statistical concerns associated with profiling individual providers whose patients account for a much smaller sample size than for an entire institution.[11] In contrast, hospitals and provider organizations are widely considered to be the most appropriate and receptive target audience for quality transparency programs. Hospitals can compare their own quality metrics with those of competitors and poorly performing hospitals may be motivated to improve their own quality standards, through a phenomenon known as the “sunshine” effect. Furthermore, since hospitals are sensitive to their public image and potential legal risks, and often have the authority to act on suboptimal levels of performance and promote good standards of practice, they will likely respond to performance data as a “competitive opportunity or risk management imperative.”[12]
Previous research has addressed the importance of selecting quality measures that appropriately capture provider quality and meet the needs of the target audience(s). In general, quality transparency programs use one set or a mix of measures including the following: [13], [14]
- Patient experience—based on the patient’s opinion
- Structural—whether the provider has invested in infrastructure like electronic medical records that could improve the quality of care
- Process—whether the provider offered key therapies and interventions to patients who could benefit from them, based on the recommended guidelines for care
- Outcome—refers to the impact of the medical care provided
Each of these measures captures different aspects of the quality of care. Although outcomes measures are typically considered the most direct method for measuring health care quality, the difficulties associated with measuring outcomes, discussed below, have led experts to generally agree that the most accurate and comprehensive approach for measuring quality is to use a mix of the above measures.[15] However, when using outcomes measures (and sometimes process measures), it is important to carefully risk-adjust the data as differences in outcomes can be caused by variations in the patients’ conditions. Unfortunately, the current science of risk-adjustment is not sufficiently advanced; and, researchers have only been able to identify the clinical characteristics that influence mortality rates for a limited number of conditions. And, the extent to which risk adjustment should include demographic and socioeconomic factors is a matter of ongoing debate. Some experts argue that variables should only be controlled for if they account for a known biological difference (for example, women have smaller vessels, which makes it technically more difficult to perform bypass surgery), while adjusting for race or ethnicity could unfairly mask those hospitals that do not provide culturally competent care.[16] As a result, it is a challenge for quality transparency program designers to identify and use viable methods for risk-adjusting data, while acknowledging that even state-of-the-art methods still have their limitations, and that they will not be universally accepted (especially by providers).
In addition to selecting appropriate quality measures, program designers must also choose the most appropriate and relevant medical conditions for which to report quality metrics. The California HealthCare Foundation’s Quality Initiative details five criteria for selecting these conditions, including the following:
- Clinical significance—prevalence of condition; impact on quality and length of life
- Impact of quality of care on measured performance—conditions whose outcomes are not heavily influenced by factors other than quality (e.g. many co-morbidities)
- Magnitude of variation in quality—those conditions with greater variation in quality have the potential to have the most impact if accurate measures can be reported
- Practicality of measuring quality—important for reducing the reporting burden
- Contribution to the scope of provider performance assessment—whether the information will be relevant to a large number of consumers
These criteria are important to consider when developing a program to assess condition-specific quality; however, this should not be confused with a transparency program aimed at measuring overall hospital or medical group quality. In the latter case, program designers should select measurements that will provide both a comprehensive and accurate depiction of the organization’s/group’s overall quality levels.
In designing a quality transparency program, it is also important to select an appropriate source of data. Although the relevance of different data sources varies depending upon the type of quality measure, it is generally accepted that especially for outcomes measures, clinical data, collected by providers using patient charts, is superior to administrative data, derived primarily from insurance claims.[17] Administrative data are easier and much less costly to collect and review but have several shortcomings, including the following: (1) cases can be missed or misclassified, especially for non-reimbursable diagnoses; (2) pre-operative co-morbidities are often not reported separately from post-operative complications, impacting risk-adjustment; (3) administrative data are most often created for billing purposes rather than for monitoring of clinical care. While some quality transparency programs have developed methods to adjust administrative data, after auditing and comparing it against patient chart data, in an effort to more accurately capture provider performance, these solutions have major limitations.[18] Ideally, quality transparency programs would use clinical data that are both audited and validated to ensure the accuracy of the data and prevent providers from “gaming” the system, but such data collection and reporting approaches are very costly.[19]
There is a risk that quality transparency programs may have unintended adverse consequences, and the less well designed a program, the higher the risk. For example, inadequate risk adjustment of outcomes measures can lead to serious unintended effects: some physicians may avoid sicker patients in an attempt to prevent erosion in their quality rankings,[20] and other physicians (those who continue treating sicker patients) could be subjected to unfairly low quality rankings. A quality program that overemphasizes process measures may cause some providers to ignore their own clinical judgment, or their patients’ unique situations or preferences, and choose health care interventions that will help them achieve “target” quality ratings.[21] And while structural measures are simple to measure, it is often difficult to define their impact on health outcomes. An emphasis on structural measures may cause providers to devote resources to systems that may not actually improve quality of care.[22]
Two additional unintended effects could arise through the poor design of quality transparency programs. The first is an inappropriate focus on metrics that can be easily measured and have less of a reporting burden rather than metrics that are more difficult to measure but are substantively more important.[23] This may have the inadvertent effect of “lowering the bar” for quality of care, because providers will deliver those services on which they are measured. And second, in the absence of a national model for quality transparency programs, numerous entities, including state governments, other public organizations, private companies and health plans, have developed a wide variety of measures and programs for reporting quality, some of which are proprietary in nature (and thus may not provide true transparency to target audiences). As a result, a recent study by Michael J. Leonardi et al., “Publicly Available Hospital Comparison Web Sites,” found that rankings of providers can be quite inconsistent and contradictory, which could discredit quality reports and confuse consumers and purchasers.[24] In response, providers have already expressed considerable frustration and mistrust of quality rankings.[25]
In light of these issues, evaluators must carefully design evaluation questions and methods that take into account both the intended and unintended effects of quality transparency programs. Few studies have systematically developed such an evaluation framework; however, the article by Leonardi does outline several basic criteria, listed below, for assessing quality transparency programs, which could be used to develop a detailed framework.
- Web site accessibility—cost, requirement to sign up and visibility
- Data transparency—data source, statistical method and risk-adjustment
- Appropriateness—variety of types of quality measures (e.g. structural, process and outcomes), and procedure-specific vs. general measures
- Timeliness—frequency of data updates
- Consistency—variation from other transparency Web sites
Furthermore, Bridges to Excellenceâ, which operates physician pay-for-performance programs, recently completed an evaluation of its programs and developed several evaluation questions and methods for measuring their impact.[26] Using a variety of survey techniques, evaluators measured changes in physician/patient engagement, whether the programs were implemented as expected, and if the programs resulted in healthier patients. Although the Bridges to Excellence programs are quite different from typical quality transparency Web sites, the evaluation still provides a useful model for developing a framework for evaluating quality transparency programs.
These background papers, along with other analyses not specifically referenced here but noted in the Sources section, help to provide a framework for evaluating the success or impact of quality transparency programs. Specifically in the context of a program evaluation, the issues raised in these analyses help to shape the evaluation questions that an evaluator needs to ask about any quality transparency initiative under assessment.
PROGRAM EVALUATION FRAMEWORK
1. Types of Program Evaluation
Historically, program evaluations were used to determine the ultimate success or failure of a program. Over the years, however, program evaluation has evolved and become an integral part of the planning and implementation stages of program development. Program evaluation can be much more than a simple analysis of outcomes; it also can be a tool for program improvement. As a result, several kinds of program evaluation have emerged, each tailored to a specific stage of program development.
Although terminology varies slightly throughout the literature, there are three primary types of program evaluation that we have found most useful, including the following:
- Formative evaluation: This evaluation begins during the development of the program and is typically conducted by the program managers. The purpose of a formative evaluation is to develop a logic model and theory of change. A theory of change is a description of the environment in which the program will operate, the individuals involved in the program, the activities that will take place and the outcomes the program hopes to achieve.
- Process evaluation: Unlike typical goals-based evaluations, process studies examine how something happens and whether it has been implemented as planned. Consequently, process evaluations often try to take into account unexpected variables or outcomes.
- Summative evaluation: Also referred to as an outcomes or impact evaluation, this method is used to assess whether a mature project has achieved its goals. Unlike a formative evaluation, summative evaluations are conducted after the implementation of the program by objective observers. The analysis may focus on both long-term and short-term outcomes, as well as the reasons for their success or failure.
For a summative evaluation, it is especially important to choose an unbiased evaluator who will be able to offer an impartial analysis of both the impact of the program, as well as the logic model and theory of change. Although a program designer might initially have a better understanding of the program, an outside observer is more likely to question assumptions regarding causality, leading to a more thorough evaluation.
In the rest of this report, we will focus on summative evaluations as they are most applicable for studying quality transparency initiatives that have already been implemented; however, we will take a broad definition of summative evaluations, by including steps that would normally be conducted separately in formative and process evaluations. This approach can be particularly useful for studying poorly planned programs that have already been implemented. Overall, a generic summative evaluation includes activities in the following order:
- Define primary terms and identify the fundamental purpose of the program and evaluation
- Develop logic model for the program, if it was not already created during a previous formative evaluation
- Using the logic model, formulate evaluation questions that will meet the fundamental purpose of the evaluation
- Develop observable measures that will provide indicators for the evaluation questions drawn from the logic model
- Develop and implement evaluation design and data collection methods
- Revise logic model and/or program goals to reflect a more appropriate theory of change and program objectives
The following section will discuss each of these activities in greater depth, providing examples drawn from quality transparency programs.
2. Steps in a Summative Program Evaluation
2a. Develop definition of primary terms and identify evaluation purpose, program objectives and target audience
It is important to begin by defining the primary terms, such as “quality transparency,” discussed in the program to ensure that all stakeholders agree on what is being evaluated. After working definitions are developed, evaluators must then decide what is the fundamental purpose of the evaluation. Often, an evaluation may be conducted to determine whether a program is having a significant impact that warrants further funding. At its most basic level, however, a broad summative evaluation tries to answer two primary questions: first, whether the program has met its stated goals, and second, whether the goals are optimal. Evaluating optimality would include an assessment of whether program goals are feasible, and whether the program represents a constructive use of resources. It is also the role of the evaluator to question the stated objectives of the program and investigate whether there are any underlying issues driving the program that may or may not have a positive impact on the program outcome. Tied to the analysis of objectives is a review of the program’s target audience. Before beginning the evaluation, the evaluator must also consider whether the target audience is appropriate given the environmental constraints.
2b. Develop logic model
The second step in all evaluations is to develop a theory of change, which is graphically depicted in a logic model: a common tool used to lay out the program’s elements and describe the causal linkages that are assumed to exist for the program to achieve its goals. It is important to begin an evaluation with the development of a logic model, as it is later used to inform the choice of specific evaluation questions and measures.
Planners and managers of well-designed programs would construct a logic model during the initial design process or formative evaluation. Outside evaluators can then use that logic model for the summative evaluation. If a logic model does not already exist, evaluators must create the logic model, using their own independent knowledge, and also by consulting with the program manager and stakeholders when possible.
Although logic models may vary in design, they typically include six major elements, connected by arrows and illustrated below (Figure 1):
Figure 1: General Logic Model
"environmental factors" box with arrows pointing to boxes,( inputs, activites, outputs), and a table with "short-term", "intermediate", and "long-term" in the table contents beneath an "Outcomes" table header.
inputs-arrow pointing to "activities" box.
activities -arrow pointing to "outputs" box, and an arrow pointing from a "barriers" box.
outputs-arrow pointing to table with "short-term", "intermediate", and "long-term" in the table contents beneath an "Outcomes" table header.
The elements of the program are listed within each of the horizontal categories and the external factors acting on the program are listed above and below. Inputs include the resources that are used for the project, such as quality data or project funding. The activities are the actions taken by project managers to achieve the goals of the project; examples include data collection and Web site development. Outputs are the immediate results of the initiative, such as the number of consumers or providers who visited a quality transparency website. Outputs are often confused with outcomes; however, outputs are tied directly to a program activity and provide evidence that an activity has occurred, though not necessarily that a program has achieved its purpose. Outcomes, on the other hand, are the desired accomplishments or changes that show movement toward the program’s ultimate objectives. Outcomes typically are divided into short-term, intermediate and long-term subsets. In the case of quality transparency initiatives, a short-term outcome might be providers’ heightened awareness of their quality ratings; an intermediate outcome might be providers’ development of new quality control initiatives; and a long-term outcome, often the ultimate goal of the initiative, might be improved patient care and consequently better clinical outcomes.
In addition to these basic elements, logic models also include information on the program’s environment and barriers. Environmental factors describe the context in which the program operates. A well-designed program will take into account the environment, though it will not attempt to solve these larger external issues (which are often beyond the reach of the program). In a quality transparency logic model, one environmental factor would be that financial incentives to physicians may disproportionately reward the provision of some services relative to others, in ways that do not reflect optimal quality of care (e.g., physicians being paid more for procedures rather than, for example, discussions regarding medication management, which might benefit the patient more). Program planners and evaluators must be aware of the financial (and other) incentives, which can negatively affect the impact of the quality transparency initiative. A failure to identify such factors can lead to a poorly designed program as well as a flawed evaluation.
Barriers are a subset of environmental factors; they represent those external issues that the program attempts to address. Consequently, each barrier is matched with a program activity that is designed to reduce or eliminate it. Listing the barriers in the logic model allows program managers to identify the necessary steps that must be taken to achieve successful results. In a quality transparency model, a barrier might be that the entities collecting the data might use different data abstraction, coding and reporting practices, preventing the measures from being comparable across providers. A well-designed quality transparency program would develop standardized collection practices, and audit and validate the data, to ensure that it is accurate and comparable across providers.
2c. Formulate evaluation questions
The next step in a broad summative evaluation is the creation of evaluation questions, which guide the focus of the evaluation and delineate the different dimensions in which the program will be judged. The evaluation questions are developed by pairing the logic model with a framework known as Bennett’s hierarchy. Illustrated below (Table 1), next to the corresponding categories of a logic model, Bennett’s hierarchy is a list of the types of evidence that may be examined by an evaluator to determine the overall impact of the program.[27] Information from the lower levels helps to explain the results from the upper levels, which are often more long-term. Additionally, as the evaluator moves up the hierarchy, the evidence often becomes more difficult and expensive to obtain. For example, evidence of actions—behavioral changes in the target audience—may require consumer surveys and focus groups or interviews, while evidence of program resource use may simply require an expenditure review. It is, therefore, important to start at the bottom of the hierarchy and work up the ladder of questions, verifying that the program has met a minimum level of achievement, prior to expending significant resources to answer the upper-level evaluation questions. Evidence from further up the hierarchy, however, generally provides a stronger indication of whether the program has achieved its larger goals.
2d. Develop observable measures
In addition to defining the evaluation questions, researchers must translate the lines of inquiry into observable measures. This step operationalizes the qualitative evaluation questions into measurable indicators. Although the appropriate indicator might be obvious for some evaluation questions, such as those regarding funding, they may be more difficult to select for questions regarding abstract concepts like “leadership” or “knowledge.” For more complex questions, it may be necessary to select several indicators to capture the core issues adequately.
Once the observable measure is chosen for the evaluation question, the second step must be to define what level of change will be considered significant. It is important to define what constitutes significant change prior to beginning data collection as it prevents bias, ensuring that the results of the evaluation are not skewed by the evaluator’s beliefs.
2e. Develop and implement evaluation design and analyze findings
The next step is for evaluators to develop an evaluation design, determining the most precise and feasible methods for gathering data. Although one particular evaluation method might yield the most accurate information, it may be impractical given funding, staffing and time constraints. Therefore, feasibility must be a primary consideration when selecting one or multiple methodological approaches and data collection instruments for each evaluation question.
These evaluation methods fall into two general categories: quantitative and qualitative. An example of a quantitative tool would be a survey of the target audience to understand reactions to the program. Surveys are useful for gauging the response of a large group, but the information gathered is limited to the questions asked on the survey.
In contrast, qualitative methods, such as a focus group, can be helpful in collecting more in-depth information on the thought processes and behavioral changes of program participants. Since a focus group requires a greater time commitment from respondents, the sample size is much smaller than for surveys, though it yields more in-depth information, and is particularly helpful in understanding unexpected program results.
An additional qualitative method that may be used is a direct assessment by the evaluator of the program Web site or other program products. This should include an assessment of the validity and accuracy of the information disseminated by the program. In addition, the evaluator can perform the assessment from the perspective of the consumer—testing, for example, whether the information is presented in clear, easy-to-understand language and whether the Web site is well designed and easy to navigate. Although the evaluator’s assessment from the consumer perspective is not necessarily as credible as input from consumer focus groups, it is a cost-effective method for analyzing program features that affect end-users of the program.
Each of the methods discussed above has different strengths and limitations. Consequently, a mixed-method approach often yields the best results. By using several methods to answer each evaluation question, evaluators can develop a more complete understanding of the effects of the program. In addition, a mixed-method approach can reduce the chance of external factors either inflating or diluting the impact of the program. The influence of such factors can be particularly problematic when measuring long-term outcomes, which are more likely to be affected by the larger environment. Using a rigorous evaluation design will help ensure that evaluation data are collected and analyzed appropriately, and that the resulting evaluation report is based on sound conclusions.
2f. Revise logic model
In some situations, program designers may not have had the resources or expertise to develop a well-constructed program. This may result in a flawed or non-existent logic model and unrealistic program goals, which might become apparent during an evaluation. In this case, an evaluator, using knowledge of the program development process, and by consulting with experts and stakeholders, might offer recommendations on how to improve the program and revise the logic model. This step is called an explanatory evaluation and is sometimes included in a broad summative evaluation. An explanatory evaluation goes beyond simply measuring if the program met its goals and, instead, attempts to answer why the program failed or succeeded. Evaluators analyze the logic model, questioning each of the linkages between the components of the model, and make recommendations for revised activities, inputs and program goals where appropriate.
PROGRAM EVALUATION FRAMEWORK AS APPLIED TO QUALITY TRANSPARENCY
1. Framework of a Summative Evaluation of a Generic Quality Transparency Program
The following section applies the theory of program evaluation to quality transparency programs. To simplify this task, a generic quality transparency program was developed based on reviews of real quality transparency Web sites. The framework for a summative evaluation is then applied to the generic program to highlight the specific issues related to evaluating quality transparency initiatives.
It is important to remember that, unlike the programs discussed in the previous chapter, quality transparency initiatives are subject to the limitations of their environments. As a result, program designers might have to limit their objectives or activities because of time, funding, staffing or other constraints. Therefore, in evaluating quality transparency programs it is important to consider both the requirements for a well-functioning program and the resources available to the program.
The following evaluation questions and corresponding measurement processes can be visualized as a ladder. The uppermost rungs, or evaluation questions regarding long-term outcomes, only need to be reached during evaluations of the most well-designed and well-developed programs (those that show evidence of success on program outputs and short-term outcomes). For some quality transparency programs, it may only be necessary to conduct a mini-formative evaluation, analyzing the evaluation questions on the lowest rung of the ladder—those dealing with inputs or resources. Nevertheless, the following section will discuss the framework for a full summative evaluation, though we have made an effort to identify points at which evaluators might consider halting the evaluation for less-developed programs.
1a. Develop definition of primary terms and identify evaluation purpose, program objectives and target audience
Many organizations, including health plans, federal and state governments, employer groups and not-for-profit entities, are increasingly developing quality transparency programs. These initiatives are designed around a broad range of definitions of “quality health care” and “quality transparency.” For the sake of this paper, however, we use the definition for quality health care developed by the Agency for Healthcare Research and Quality (AHRQ), which states that quality health care is: “Doing the right thing, at the right time, in the right way, to achieve the best possible results.”[28] To focus our evaluation framework, we will use a definition of “quality transparency” that is drawn from several sources in the literature and aims to encourage the development of useful and influential quality transparency programs. Thus our definition of quality transparency is the provision of usable quality information to a specific audience that allows a comparison between a health care provider’s quality of care and a normative or community standard.[29], [30] Quality data are considered usable if the information is meaningful, accurate, comprehensive and reliable.[31]
Similar to the definition of “quality transparency,” the program objectives may vary depending upon the sponsor, resources and environmental factors. Furthermore, the sponsor may have underlying intentions, outside of the program’s publicly stated purpose, that can influence the program design. For example, in the case of insurers, although a program may be marketed as a quality comparison tool, the actual measures might include both quality and cost components, be more heavily weighted toward the latter with an objective of steering enrollees toward lower-cost providers. Therefore, evaluators must objectively question all aspects of the program and consider their effect on the program’s overall impact.
In general, however, quality transparency programs have two general goals, as defined by Marshall in his seminal article: (a) to increase the accountability of health care organizations, professionals and managers, and (b) to maintain standards or stimulate improvements in the quality of care provided.[32] It is not expected, however, that a quality transparency program would immediately meet these goals, but rather that they will eventually be achieved through the theory of change (as illustrated in the logic model discussed below). And while, ideally, a quality transparency program will seek to achieve both of these objectives, in some situations, environmental factors or lack of funds may prevent the sponsor from pursuing them in their entirety. For example, a quality transparency program might focus solely on reporting data for hospitals, rather than including the full spectrum of providers. Additionally, programs reporting on hospital quality might focus only on the most prevalent conditions or procedures. An evaluator, however, may still judge the program positively if it meets its stated goals and does not overstate its intentions. As explained in the previous chapter, a program evaluation is conducted first to determine if the program met its goals, and second to consider whether the goals were optimal and comprehensive.
Implicit in the selection of objectives is the identification of appropriate target audiences. Quality transparency programs may have a variety of target audiences including consumers, providers (both physicians and hospitals), health plans, employers and policymakers. This discussion of a generic quality transparency program will focus on two primary target audiences: consumers and providers. (Secondary target audiences are excluded from this discussion to keep the framework from becoming too detailed and unwieldy, and also because many quality transparency programs do not have secondary audiences such as health plans.) However, it is still important to clearly define whether the program is expected to influence all consumers and providers or a more limited subset. Many quality transparency programs are state-based and, therefore, only seek to influence the target audiences within that state. The consumer audience is further limited to the subset of consumers who are likely to need the services being rated (e.g., inpatient hospital services). Consequently, the evaluator must consider whether program designers have appropriately limited both their objectives and target audience.
1b. Develop logic model
As discussed in the previous chapter, the second step in an evaluation is to develop a logic model, which illustrates the components of the program and their causal linkages. Although the program designers should ideally develop the logic model, this does not always occur, even if the theory of change and objectives are well thought out. As a result, it becomes the role of the evaluator, through consultation with the program managers, to create the logic model so that its components can be analyzed. As an objective observer, however, the evaluator must be careful to delineate the true components, as well as underlying objectives, of the program in the logic model. In addition, the logic model should include all of the environmental factors and barriers that might influence the program, given its objectives.
The components of the logic model and the number of barriers vary depending on the scope of the program. For example, quality transparency programs frequently focus on reporting data for either physicians or hospitals. Depending on this focus, the quality measures will vary, as well as the data collection methods and outreach approaches.
To act as a guide for the creation of quality transparency logic models, we have attempted to create a generic logic model (see Figures 2 and 3). This logic model is not tailored specifically for reporting hospital or physician quality data, or for an insurer vs. a government program. Instead, it attempts to provide a comprehensive list of the activities necessary to achieve the objectives outlined above. In addition, the generic logic model includes the barriers and environmental factors that may affect quality transparency programs and, consequently, should be considered by evaluators when creating logic models for real programs. It may also be used as a comparison tool to identify missing components of real programs’ logic models. The generic logic model is presented graphically and its components are described in detail on the following pages.
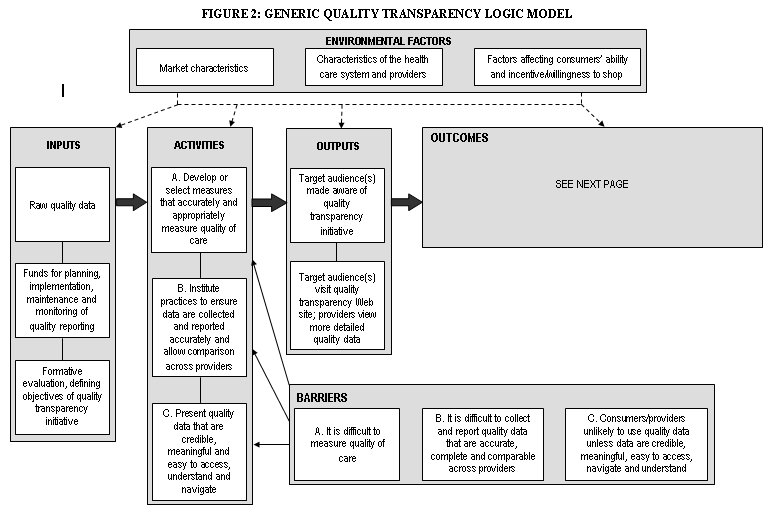
Box with "environmental factors" containing boxes:"market characteristics", "characteristics of the health care system and providers", and "factors affecting consumers’ ability and incentive/willingness to shop". From this box there are arrows drawn to boxes with the names: "inputs","activities","outputs", and "outcomes". A "barriers" box sits at the bottom of the image
inputs-contains these boxes: "Raw quality data", line drawn to: "Funds for planning, implementation, maintenance and monitoring of quality reporting", line drawn to: "Formative evaluation, defining objectives of quality transparency initiative". There is also an arrow that points from the "inputs" box to the "activities" box.
activities- contains these boxes: "Develop or select measures that accurately and appropriately measure quality of care", line drawn to: "Institute practices to ensure data are collected and reported accurately and allow comparison across providers", line drawn to:"Present quality data that are credible, meaningful and easy to access, understand and navigate". There is also an arrow that points from the "activities" box to the "outputs" box.
Barriers--contains these boxes: " It is difficult to measure quality of care", "It is difficult to collect and report quality data that are accurate, complete and comparable across providers", and "Consumers/providers unlikely to use quality data unless data are credible, meaningful, easy to access, navigate and understand". Three arrows from the "barriers" box point to,( "Develop or select measures that accurately and appropriately measure quality of care", "Institute practices to ensure data are collected and reported accurately and allow comparison across providers", and the "Present quality data that are credible, meaningful and easy to access, understand and navigate" boxes.
Large box with "Outcomes" at the top with " SHORT-TERM", "INTERMEDIATE I", "INTERMEDIATE II", and "LONG-TERM" as column headings.
Short-term -"TRACK 1: Providers (using own ratings)" above box containing: "Providers become more aware of their own quality ratings relative to their peers" with an arrow pointing toward the "intermediate II" column; "TRACK 2: Providers (using ratings of other providers)" above box containing " "Providers become more aware of quality ratings for other providers with whom they interact", this has an arrow pointing toward a box contaning, " Referral patterns shift to higher-performing providers; hospitals align with higher-quality physicians" in the "Intermediate I" column; TRACK 3: Consumers, above box containing, "Consumers become more aware of quality differences across providers", this has an arrow pointing toward a box contaning, "Consumers choose higher-performing providers, shifting market share of providers" in the "Intermediate" column.
Intermediate I - box containing, "Referral patterns shift to higher-performing providers; hospitals align with higher-quality physicians" with arrow point toward box containing "In response to the effect of the ratings on their public and professional reputations and shifts in market share, providers develop quality improvement initiatives" in the Intermediate II column; box containing "Consumers choose higher-performing providers, shifting market share of providers" , with an arrow pointing toward "In response to the effect of the ratings on their public and professional reputations and shifts in market share, providers develop quality improvement initiatives" in the "Intermediate II" column.
Intermediate II - box containing "In response to the effect of the ratings on their public and professional reputations and shifts in market share, providers develop quality improvement initiatives" with an arrow pointing toward a box containing "Improved patient care and, ultimately, better clinical outcomes" in the "Long -Term" column.
Long-Term-- box containing "Improved patient care and, ultimately, better clinical outcomes".
Inputs
Inputs are the resources necessary for the successful implementation and completion of program activities. The inputs for a quality transparency program include the following:
- Formative evaluation, defining the objectives of the quality transparency initiative
- Funds for planning, implementation, maintenance and monitoring of quality transparency initiative
- Raw quality data (e.g., patient chart data, administrative data)
Without access to appropriate quality data, the creation of a useful quality transparency Web site would be impossible, and without adequate funding, the creation of such a Web site would be difficult at best. Although a formal formative evaluation is not strictly necessary, it is vital to the success of the program that the designers rigorously consider all significant external factors that might affect the program and question both the components of the program and the assumed causal linkages. During this process, the designer should create a logic model and match each barrier with a corresponding activity to ensure that all external factors that must be dealt with to yield the stated objectives are being addressed. This process ensures a logical theory of change and, ultimately, the success of the program.
Environmental Factors
The environmental factors that affect quality transparency programs can be grouped into three conceptual categories: market characteristics, characteristics of the health care system and providers, and factors affecting consumers’ ability and incentive/willingness to shop. Within each of these categories are a number of external factors—listed below—that should be taken into account by planners and evaluators.
- Market characteristics:
- Regional/cultural variations can impact care processes and compliance with best practices.
- Markets characterized by high provider concentration, or provider shortages, may not allow for meaningful shopping. Additionally, providers that lack competition may not be motivated to improve quality.
- Characteristics of the health care system and providers
- The knowledge base regarding quality measurement and risk-adjustment methodologies is still evolving, and ratings based on existing methodologies may not adequately capture providers’ performance.
- Financial incentives sometimes are not aligned with quality measures.
- Provider organizations vary in resources and their ability to invest in infrastructure and quality improvement techniques.
- Competing and inconsistent quality measures across different quality transparency programs can place a heavy reporting burden on providers and confuse both providers and consumers.
- Providers who mistrust the quality reports and/or believe the quality measures or risk-adjustment methodologies are flawed, or who suspect they perform poorly, will not be motivated to participate unless there are financial incentives tied to quality improvement or participation is mandated.
- Physicians may be unwilling to use quality reports and change established referral and hospital admitting practices for reasons including: mistrust of reports, lack of time to consult reports and/or concern about disrupting established relationships.
- Factors affecting consumers’ ability and incentive/willingness to shop
- For services characterized by medical urgency, consumers have no time or ability to comparison shop.
- Consumers may trust word-of-mouth recommendations from their family/friends more than quality ratings.
- Consumers are not likely to use the quality transparency program unless they (or someone close to them) have an imminent need for the types of providers and/or services rated by the program.
- Consumers’ inclination to shop for high-quality providers varies depending on their age, education, general attitudes toward health care and other personal characteristics.
- Some consumers may not be aware that there is variation in the quality of providers and may lack an understanding of what is considered quality care.[33]
- Consumers in a health maintenance organization (HMO) or managed care plan that strictly defines which providers they can visit will have less of an incentive to compare providers’ quality ratings, unless they can afford to go out of network.
- Consumers may be reluctant to change physicians and sever existing relationships even if the physician has been rated poorly.
- The benefits of identifying and then using a higher-quality provider might be outweighed by the potential costs (e.g., increased transportation costs, time, the administrative burden of changing physicians).
Barriers
Unlike the environmental factors listed above, barriers are environmental factors that well-designed and -implemented programs can and should address (at least partially). Accordingly, each barrier should be matched to one or more program activities designed to address that barrier. In our generic logic model, we have broken down the possible barriers into three categories, each containing more specific barriers. Each of these individual barriers, listed below, has a corresponding activity that attempts to “solve” the issue. For a quality transparency program to meet its objectives, the majority (if not all) of the barriers must be addressed.
A. It is difficult to measure quality of care
- Some quality indicators are easier to measure than others; programs may inappropriately focus on easier-to-measure indicators rather than more meaningful indicators of quality.
- Transparency initiatives that only report one type of quality measure may be limited in their usefulness and have unintended effects.
- Although outcomes measures are considered to be the most effective method for evaluating quality of care, initiatives that only report outcomes measures are limited by the current state of knowledge and lack of consensus regarding these measures.[34] Furthermore, when outcomes measures are used, those that are not adequately risk-adjusted will not appropriately capture provider performance.
- Initiatives that only report process measures could encourage providers to solely focus on and overuse certain patient care processes regardless of whether they are the most appropriate treatment for the patient and actually improve health outcomes.[35]
- Initiatives that only report structural or indirect indicators that are less closely tied with actual health outcomes could frustrate providers or inappropriately encourage them to develop new systems that might not actually improve patient care.
- Initiatives that only report measures of patients’ perceptions often reflect communication processes and relationships with providers, which does not always correlate with quality of care and improved clinical outcomes and may be skewed by patients’ conditions.
B. It is difficult to collect and report quality data that is accurate, complete and comparable across providers
- Providers/vendors/health plans may not collect and report data using the same rigorous methods, leading to incomplete or inaccurate data that cannot be appropriately compared across providers.
- Providers may try to “game” the system by reporting higher performance rates than actually occurred.
- Programs using claims data may not accurately capture provider performance.[36]
- A heavy reporting burden may discourage provider participation or lead to careless data collection and reporting techniques.
- A long data-reporting period may obscure provider changes in quality over time. However, a reporting period that is too short may not capture sufficient data to allow for statistically discernible comparisons.
- Misleading quality ratings or data gaps on the Web site can result from poorly designed sampling and statistical methodologies and inaccurate, incomplete or insufficient data.
C. Consumers/providers are unlikely to use quality data unless it is credible, meaningful and easy to access, understand and navigate
Consumers:
- Consumers often are not aware of the existence of quality transparency resources or the benefits of using them.
- Consumers are more likely to respond to a single news report about a poorly performing hospital, rather than complicated quality reports.
- Consumers are unlikely to use Web sites that are not accessible, easy to navigate and understand, or responsive to user questions.
- Consumers may be frustrated by reports whose results make it difficult to distinguish between high- and low-performing providers. In addition, such a rating system would inspire few providers (only those marked as below average) to change their practices.[37]
- Consumers could be overwhelmed by information and unable to decide among providers.
- Consumers may need corresponding price information to assess comparative value across providers.
- Some consumers lack access to the Internet or are less comfortable using the Internet to obtain information.
Providers:
- Community stakeholders, especially providers, may not accept or participate in a program if it is perceived as (i) being imposed on them and (ii) using inappropriate or invalid quality measures and/or methods.
- Providers will not use quality transparency programs that are not adequately documented and do not provide clinically relevant quality data.
Activities
The activities are those actions that must be taken by a program manager to create a quality transparency program that achieves its objectives. The activities below are divided into three general categories, which are displayed on the logic model, and correspond to the barriers that they attempt to address.
A. Develop or select measures that accurately and appropriately measure quality of care
- Choose measures on which to report quality of care that:
- Have clinical significance—are both prevalent and significant
- Are less influenced by factors outside of quality of care—such as co-morbidities
- For which there is sufficient knowledge or evidence of steps that providers can take to improve clinical outcomes—an incurable disease would be inappropriate
- Vary in quality—unlike more automated procedures that are already standardized
- Have a low reporting burden for measuring the quality of care
- Contribute to a wider understanding of the provider’s performance—are not all focused in one area of care
- Are adequately validated and accepted by providers as best practices
- Choose quality measures that accurately capture the quality of care by using a mix of measures, including outcomes, process, structural and patient experience.
- Use the most state-of-the-art methods for risk-adjusting outcomes measures.
- For process measures, develop methodology to ensure that only those patients who should receive the services are being counted.
- Adjust patient experience measures based on the case mix of the patient population (e.g., age, gender, socioeconomics, co-morbidities etc.).
B. Institute practices to ensure data are collected and reported accurately and allow comparisons across providers
- Develop a standardized reporting procedure to ensure that all providers/vendors/health plans are reporting data in a consistent manner for the same distinct procedures or indicators. Program managers may also provide training, software and other support to ease the reporting burden on providers.
- Audit and validate data by comparing it to other sources. (If using claims data, compare a sample to medical records to ensure accuracy.)
- For claims data, after comparison with medical records, develop an algorithm to adjust claims data to correct for misreporting (typically underreporting).
- Choose an appropriate reporting period that allows the target audience to view recent data, but also provides sufficient sample size for statistical purposes.
- Develop rigorous methodologies to ensure completeness, integrity and statistical validity of the data (e.g., accurate assignment of patients to providers; development of valid sampling techniques and statistical testing methods).
C. Present quality data so that it is credible, meaningful and easy to access, understand and navigate
Consumers:
- Provide outreach to make consumers aware of the quality transparency Web site, the importance of clinical quality, and the variation among providers in clinical quality.
- Preface the report with concrete, significant and/or life-or-death examples to encourage the use of the Web site by consumers.
- Design the Web site to be user-friendly: easy to understand, navigate, compare providers, and generate provider-specific quality reports.
- Provide Web site instructions, definitions of each measure, and documentation in clear, accessible language for consumers.
- Provide support to Web site users who have questions or comments.
- Rate each provider relative to multiple benchmarks or cut-points, allowing users to distinguish between meaningful categories of providers.
- Provide decision aids to consumers to help them sort through the ratings and make appropriate decisions regarding their health care providers.
- Provide corresponding price data so that consumers can choose providers that are both high quality and efficient.[38]
- Report quality data through alternative information channels (e.g., print media) for consumers who would be less inclined to use the Internet.
- Provide outreach to other target audiences (health plans, employers, policymakers etc.) to encourage them to use the transparency program.
Providers:
- Engage important stakeholder groups—in particular the provider community that is being evaluated—in the design of the program (especially in the development of quality measures and methods),[39] and seek continuing input.
- Provide outreach to providers to make them aware of the quality transparency program.
- Provide detailed quality data that providers can use to implement quality improvement efforts.
- Provide additional detailed documentation of the Web site to providers.
Outputs
The outputs of the quality transparency initiative are two-fold:
- Target audiences are made aware of the quality transparency initiative.
- Target audiences visit the quality transparency Web site; providers potentially also view more detailed quality data.
Outcomes
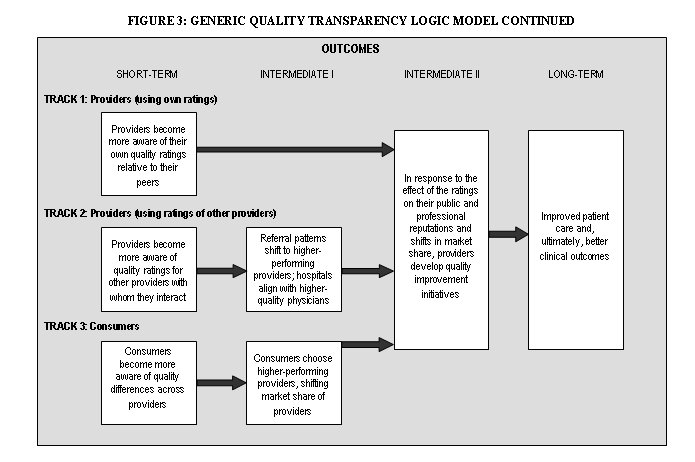
The following outcomes tracks are interrelated and converge over time. (See the logic model diagram for further information).
Track 1: Providers (when using their own ratings)
- Short-term: Providers become more aware of their own quality ratings relative to their peers.
- Intermediate II: In response to the effect of the ratings on their public image, providers institute quality improvement initiatives.
- Long-term: Improved patient care and, ultimately, better clinical outcomes
Track 2: Providers (when using ratings of other providers)
- Short-term: Providers become more aware of quality ratings for other providers with whom they interact (e.g., physicians become more aware of ratings for specialists and hospitals to whom they refer or admit patients; hospitals become more aware of ratings for physicians whom they employ or accept on staff).
- Intermediate I: In response, patient referral patterns will shift to higher-performing physicians and hospitals; hospitals will develop relationships with higher-performing physicians.
- Intermediate II: In response to the shift in market share, providers will respond by developing quality initiatives.
- Long-term: Improved patient care and, ultimately, better clinical outcomes
Track 3: Consumers
- Short-term: Consumers become more aware of differences in quality across providers.
- Intermediate I: Consumers will choose higher-performing providers and possibly through the viral effect, tell others (e.g., family, friends) about the quality ratings, which will lead more consumers to shift to higher-performing providers.
- Intermediate II: In response to the shift in market share, providers will respond by developing quality initiatives.
- Long-term: Improved patient care and, ultimately, better clinical outcomes
Unintended Outcomes[40]
- Even if data are risk-adjusted, providers may turn away sicker patients to protect their quality ratings or shift the sickest patients to higher-quality hospitals, which could overwhelm those institutions, unless payment incentives are created to encourage providers to care for sicker patients.[41]
- The use of process measures can encourage providers to focus solely on and potentially overuse certain patient care processes regardless of whether they are the most appropriate treatment for the patient and actually improve health outcomes.[42]
- One long-term outcome of a successful quality transparency program might be that hospitals specialize more and become “focused factories,” a development that could impair access. (Hospitals may decide to discontinue certain service lines because they cannot attract high-quality specialists, or they cannot attract enough patients needing a certain type of care, or a combination of both factors.)
- A potential positive effect might be that general improvements in clinical processes may provide collateral benefits to patients with conditions that are not part of quality measures. These improvements may not be directly measurable.
1c. Formulate evaluation questions
As discussed in the previous chapter on program evaluation, the evaluation questions are drawn from the logic model and meshed with the Bennett Hierarchy, which outlines the types of evidence or evaluation questions that must be gathered or researched to evaluate the program. The following table (Table 2) presents a broad list of evaluation questions based on the generic logic model. Each of the identified activities and barriers has a corresponding question in the table. In a real evaluation, these questions might vary or include sub-questions depending upon the local context. Nevertheless, these evaluation questions may guide evaluators and allow them to compare a real quality transparency program against our generic program, which was developed to achieve the general objectives.
| Logic Model | Bennett Hierarchy | Evaluation Questions |
| Outcomes (Long-term) | Impact |
|
| ||
| Outcomes (Intermediate) | Actions |
|
| ||
| ||
| Outcomes (Short-term) | Learning |
|
| ||
| ||
| Outputs | Reactions |
|
| ||
| Participation |
| |
| ||
| ||
| Activities | Activities |
|
| ||
| ||
| ||
| ||
| Inputs | Resources |
|
| ||
|
The evaluation questions and Bennett Hierarchy represent the framework of the entire evaluation, defining its scope and purpose; however, it should not be considered an immutable structure. Instead, it is helpful to think of the evaluation questions as a ladder, up which the evaluator must climb depending upon the characteristics and limitations of the program. Some quality transparency programs may lack a logical theory of change. For such programs, it is not necessary to consider evaluation questions from the outcomes or even outputs levels, since the program would not be able to achieve a minimum level of success at the inputs or activities levels. This is a pragmatic approach to program evaluation, meant to conserve resources, rather than misuse funds by evaluating programs that are unlikely to have had any impact.
1d. Develop observable measures
As the evaluator moves up the ladder of evaluation questions, he or she must select an observable measure and define the minimum level of success for each evaluation question. This step operationalizes the qualitative evaluation questions and converts them into measurable quantities. Although this is a simple process for evaluation questions on the inputs level, it can be more difficult for questions such as, “Did consumers who visited the Web site become more knowledgeable about the differences in quality of care across providers?” In this case, one indicator of improved knowledge could be the opinion of a participating consumer about whether their knowledge of quality differences has improved as a result of using the Web site. Alternatively, another indicator could be the ability of a consumer, who has actually shopped for and had a particular procedure, to name low-ranked and high-ranked providers for that procedure among providers in their geographic area.[44]
After selecting an appropriate indicator, the evaluator must also define what level of change will be considered significant or meaningful. This step should be taken before any data have been collected and analyzed, so that neither the evaluator nor the sponsor of the evaluation will be influenced by the data results. What constitutes a significant level of change will depend on the specifics of the program, including the resources consumed by the program and overall stakeholder expectations. Consequently, it would not be possible or appropriate to define a generic level of significant change for each evaluation question.
This process of selecting an observable measure and minimum level of success only needs to be completed for those evaluation questions that the evaluator deems necessary for judging the program. As discussed in the previous section, it is unnecessary to identify observable measures for higher levels of questions if the program is poorly planned and cannot pass the input/resources level.
1e. Develop and implement evaluation design and analyze findings
The evaluator’s next task is to develop the evaluation design or methods for each evaluation question and corresponding indicator. For some evaluation questions, such as those on the lower rungs of the ladder, in the inputs and activities levels, the selection of methods is fairly simple. For example, the majority of the activities evaluation questions can be answered through an analysis of the logic model and an assessment of the Web site by the evaluator, in some cases supplemented by interviews with program designers and managers, and an assessment of the Web site by a health literacy expert. For those programs that pass these lower levels of evaluation, however, the evaluator will need to use a wider (and much more resource-intensive) variety of qualitative or quantitative methods to measure the outputs and outcomes.
The evaluation methods must be selected based on both accuracy and feasibility, which can be a difficult trade-off. This issue is exemplified within the generic quality transparency program model by the evaluation question, “How many consumers visited the Web site?” Of the quality transparency programs that we have researched, program managers typically attempted to answer this question by collecting data on the number of Web site “hits,” or visits to the Web site. Although this is a very low-cost method, it does not provide accurate information on the target audience’s use of the program since there is no reliable method to discern whether the “hit” came from a true consumer or from other users such as researchers, government agency staff, commercial entities, etc. In addition, each unique visitor to the Web site can generate a large number of Web hits, so counting the number of Web hits is not an acceptable approximation of the number of Web site users. Consequently, it is necessary to conduct a survey of the target audience to estimate how many people used the Web site. Although this approach is much more expensive, it yields credible results while a Web-hit counter does not.
If an evaluator did conduct a survey, it would be most efficient to include questions relating to several evaluation questions, including the following:
- To what extent are consumers aware of the quality transparency initiative?
- Among those who are aware of the initiative, did they visit the Web site? If not, why not?
- Among those who visited the Web site, did they find the quality information useful in comparing providers? Did they find the Web site clear, accessible and user-friendly? Did they become more knowledgeable about provider quality ratings for the services they needed? Did they use quality information from the Web site to choose a provider?
If resource constraints were not a consideration, the ideal type of consumer survey to conduct would be a large survey based on a probability sample (such as a random telephone survey). Such a survey would generate results that are inferable to the general population, plus or minus the sampling error. However, given the resources likely to be available to most quality transparency evaluations, a large, random consumer survey is certain to be prohibitively expensive, in part because a very large sample likely would be needed to identify a large enough pool of respondents who had used the quality transparency Web site.
A more feasible consumer survey for an evaluator to conduct would be a survey based on a convenience sample. With this type of sample, sampling error is not known, so inferences to the population cannot reliably be made. However, these kinds of surveys, if properly designed and carried out, can provide a useful, relatively affordable way of estimating the magnitude of program outputs and outcomes.
The easiest convenience sample to use would be consumers who visited the quality transparency Web site, and the lowest-cost survey method would be a pop-up survey administered from the Web site. This type of survey could gather information on questions such as the Web site’s perceived usefulness and its effects on consumer knowledge and shopping behavior. However, a pop-up survey (or other survey based only on Web-site users) has important limitations: No information would be obtained about members of the target audience who did not visit the Web site, and no estimates of prevalence of Web site use among the target audience could be generated (because it is not possible to calculate a denominator for the measure).
An alternative convenience sample—one that is broader and more meaningful but also involves higher costs and greater effort than a sample of Web-site users—would be the subset of consumers who need and use the health services that are rated by the quality transparency initiative. One effective approach toward reaching these consumers is for the evaluator to first identify providers of the relevant services and then solicit cooperation from some of these providers in distributing the survey. For example, for a hospital quality transparency initiative, an evaluator might seek the cooperation of local hospitals in distributing copies of a brief survey to discharged patients. With this type of survey, information is not limited to consumers who visited the quality transparency Web site; data also can be collected and analyzed about awareness of the initiative and prevalence of Web site use among the larger pool of consumers needing and using the services rated by the program. In addition to collecting data directly, consumer surveys also serve as a useful tool for identifying respondents who are willing to be contacted later to participate in follow-up interviews or focus groups—methods that can enhance an evaluator’s understanding of consumer perceptions and behavior beyond what can be conveyed in survey questions and responses. Employing a mixed-method approach (consumer survey supplemented by focus groups or interviews) is likely to be the evaluator’s best strategy for gaining a clear understanding of the reach of the program and elements in need of improvement.
The tools used to assess a program’s reach and impact on consumers also are applicable when assessing reach and impact on a program’s other primary audience—providers. A combination of surveys, focus groups and interviews can be employed, depending on the specifics of the quality transparency program, the number and types of providers for whom it is reporting performance, and the resources available to the evaluation. Because provider surveys tend to be very costly to administer, and because these surveys may not capture detailed and nuanced provider responses, conducting interviews may be the most effective approach to understanding providers’ awareness of, use of information from, and reactions to the program.[45] Interviews should include not only the providers being reported by the quality transparency program, but also other providers who interact with (e.g., make referrals to) the rated providers, relevant provider organizations (e.g., state and local medical and hospital associations) and other community stakeholders.
For programs that have shown significant impact at the program output and short-term/intermediate outcome levels, ideally the evaluator should be able to develop measures and methods for assessing the program’s long-term impact. For all program evaluations, this stage represents the most challenging aspect of program evaluation, because (a) long-term outcomes may be very difficult to observe and measure; and (b) long-term outcomes may show a significant level of change because of factors other than the program being evaluated. The latter is particularly true of quality transparency programs, because changes in quality can result from so many factors—the influence of other quality transparency initiatives, pay-for-performance programs and other financial incentives, medical innovations, changes in information technology, market developments, regulatory and other policy interventions—not only occurring simultaneously but often interacting with one another.
To gauge the long-term effects of a particular quality transparency program, conducting interviews with key providers, stakeholders and experts may give the evaluator important insights into how substantial an impact that program might have made in achieving long-term objectives (improving provider performance) and any unintended outcomes the program might have had. If the prevailing opinion of these experts is that the program had made a positive impact on long-term objectives, ideally the evaluator then would be able to validate this by conducting a multivariate quantitative analysis to supplement the initial qualitative data collection approach.
The multivariate analysis, described in detail in our previous report for ASPE on price transparency,[46] involves a “difference-in-difference” estimation, to test whether the direction and magnitude of changes in provider quality ratings over time have significantly differed between “transparency markets” and “non-transparency markets,” after controlling for all observable differences in market characteristics. However, given the growth in quality transparency initiatives over time, it may be increasingly difficult to identify comparable (a) “non-transparency markets” to serve as control groups, and (b) “transparency markets” where providers are rated by only one transparency initiative; provider participation in multiple transparency programs makes it difficult, if not impossible, to isolate the effects of any single program. In addition, the numerous market characteristics that affect provider quality may be too difficult to observe and measure accurately to allow the multivariate model to control for them sufficiently. If a quantitative analysis is conducted, it is likely that the results would only be able to estimate the overall effect on provider quality of all quality initiatives collectively and other market changes in a community, rather than capture the effect of any single program.
To ensure that the appropriate data are collected accurately, a variety of methods should be used. For some evaluation questions, multiple methods should be employed in a specific order to increase efficiency and fully answer the evaluation question. Each data collection method, however, should only be implemented as necessary, depending upon the results of the lower inputs and activities evaluation levels. The following table (Table 3) summarizes the above discussion and lists the appropriate order of evaluation methods as they correspond to the evaluation questions.[47]
1f. Revise logic model
The final step in program evaluation is to revise the logic model as part of an explanatory evaluation. This process is particularly important for those quality transparency initiatives that have not been designed around a logical theory of change. Even for those programs, however, that reach a higher rung in the ladder of evaluation questions, the evaluator may still offer recommendations on methods for improving the program.
CASE STUDIES
The following two case studies are meant to provide examples of how evaluation processes might be applied to real-world quality transparency initiatives. Although program designers and managers were contacted by HSC researchers for each of the case studies, the following assessments are by no means intended to be comprehensive evaluations. Instead, we sought to highlight key ideas and methods that would be employed by an evaluator of such a program. Each case study will loosely follow the program evaluation framework but not provide final judgments regarding the impact of the program.
CASE STUDY 1: CALHOSPITALCOMPARE
Background
CalHospitalCompare.org is a free Web site introduced in March 2007 that rates California hospitals based on measures of clinical care, patient safety and patient experience. The Web site is the result of a partnership between the California HealthCare Foundation, the University of California at San Francisco Institute for Health Policy Studies, and the California Hospitals Assessment and Reporting Taskforce (CHART), an initiative that includes representatives from hospitals, health plans, health care purchasers and the business community, consumer advocacy groups, the research community, and government. When CHART was formed in 2004, the objective was to create a single set of performance measures and reporting processes, which would reduce the reporting burden on hospitals and allow consumers and purchasers to compare the quality of hospitals throughout the state. Since the start of the project, 216 hospitals[48]—which account for 78 percent of hospital admissions—have agreed to participate, as have most of the major health plans—which also provide financial support and encourage their enrollees to use the Web site.
CHART adopted more than 50 performance measures for use on the Web site, encompassing patient experience, process and outcome measures. Many of the measures pertain to the five most common reasons for hospitalizations: heart attack, heart failure, heart bypass surgery, pneumonia and maternity. In addition, CHART also includes measures applicable to all surgical patients or all medical patients. The performance measures are primarily drawn from national initiatives, such as the Joint Commission and the National Quality Forum (NQF).
Between 2005 and 2006, CHART developed standardized data collection methods and processes for aggregating and auditing the data; CHART also evaluated tools for translating the data into a consumer-friendly format.[49] Unlike other quality transparency efforts, CHART worked to ensure that each vendor managing the data collection efforts at the participating hospitals used the same strategies for teaching hospital staff how to collect and code the data. To further improve the reliability of the data, CHART developed slide presentations, videos and other training tools, which are all available on its Web site.[50]
Once the data are collected, CHART applies a variety of risk-adjustment models to its outcomes measures to account for variations in patient mix. These risk-adjustment models are drawn from national sources and vetted with hospital stakeholders in an effort to improve confidence in the data. For each measure, a hospital is rated on a five-point scale (from “superior” to “poor”), based on where the confidence interval for the hospital’s performance estimate falls relative to the benchmarks for the measure.
Since the CalHospitalCompare Web site was launched in March 2007, data have been updated on a quarterly basis. In 2008, the set of measures reported on the Web site is scheduled to expand to include pediatric (neonatal) measures and additional intensive care unit (ICU) measures.
Objectives and Target Audiences
The overall goal of CalHospitalCompare is to create a single, reliable source for California hospital performance information. By adopting standardized performance measures and data collection methods, program designers and managers hope to eliminate the need for additional, duplicative quality transparency initiatives, thus reducing the reporting burden on hospitals and allowing accurate quality comparisons across hospitals.
CalHospitalCompare managers identify the program as having three primary target audiences: consumers, hospitals and health plans. Consumers are the target audience for the CalHospitalCompare Web site, which aims to help them in identifying high-quality hospitals and to prepare them for their hospital stays by providing them with preparation checklists, tips for effective communication with hospitals, and other resources. In addition to the consumer-facing Web site, CalHospitalCompare provides each participating hospital with patient-level datasets on a quarterly basis, so that hospitals can analyze their own performance in detail and identify areas for improvement. Health plans also receive detailed (though not patient-level) datasets on hospital performance, with the expectation that the plans will use the information to talk to hospitals in their networks about how they can improve. The objectives and target audiences are referenced on the Web site.
Logic Model
Overall, the CalHospitalCompare logic model is similar to the generic model. The inputs, outputs and outcomes are primarily the same. In addition, all of the environmental factors still apply except for the following: “Competing and inconsistent quality measures across different quality transparency programs can place a heavy reporting burden on providers and confuse both providers and consumers.” Because of CalHospitalCompare’s multi-stakeholder collaborative approach and the promise that health plans will stop using disparate data collection and reporting strategies, the initiative has the potential to ease the reporting burden for hospitals. Instead of being an environmental factor, as it is for most quality transparency programs, this is a barrier that CalHospitalCompare has actively addressed.
The majority of the generic barriers also apply to the CalHospitalCompare program. The following barriers, however, are those that program managers have not attempted to address through any corresponding activity. It is the role of the evaluator to decide how important it is for the program not to have addressed these barriers.
- Consumers may need corresponding price information to assess comparative value across providers.
- Some consumers lack access to the Internet or are less comfortable using the Internet to obtain information.
In place of these two barriers, however, program managers did decide to address issues relating to language barriers by including an activity to create a Spanish-language version of the Web site.
Evaluation
As described in the chapter on program evaluation, an efficient evaluation will begin at the bottom of the Bennett Hierarchy and travel up the ladder as necessary. In the following section, we will describe the evaluation questions—primarily derived from the generic model—observable measures and data collection methods that would be used to evaluate the CalHospitalCompare program, as the evaluator moves up the Hierarchy.
Inputs/Resources
The following evaluation questions from the inputs/resources level of the generic model, allow the evaluator to assess the Web site at its most basic level.
- Did the program planners develop clear objectives, defining:
-
- the target audience(s)
- the types of behaviors that the initiative will impact
- how program activities will lead to desired outcomes?
- Are the objectives achievable given:
-
- the available quality data
- factors external to the program?
- Does the program have access to adequate funding and staffing for planning, implementation, maintenance and monitoring of the quality data collection and reporting activities?
For these questions, the observable measures are rather straightforward, including the stated objectives and target audience, and funds dedicated to the program. The data collection methods we used were discussions with program designers and managers; an analysis of the Web site; a review of underlying documentation and reports prepared by CHART, CalHospitalCompare, and related organizations; and an analysis of the logic model. Based on these sources we found that the theory of change underlying CalHospitalCompare was clearly and rigorously laid out in a report titled Creating a Statewide Hospital Quality Reporting System, authored by the researchers who would later become the chief architects of CalHospitalCompare.[51] Our analysis of the logic model suggests that, overall, the general objective—creating a single, reliable source for California hospital performance information that could be used by consumers, hospitals and insurers—is achievable given the available quality data and external factors.[52] Finally, the financial support that CHART and CalHospitalCompare receive (primarily from the California HealthCare Foundation, major insurers and hospital systems) appears more than adequate not only to maintain program activities but also to expand them.
Activities
Again, we will use the evaluation questions derived from the generic logic model to assess CalHospitalCompare. Each activities level question is listed below, followed by a description of the observable measures and data collection methods.
1. Do program managers select measures that accurately and appropriately measure the quality of care?
This question can be addressed using sub-questions such as the following: (a) whether the quality measures have been tested/validated and are widely accepted by providers; (b) whether an appropriate mix of measures is used; and (c) whether the measures accurately capture differences in patient populations.
For question (a), the evaluator can review documentation about the program’s quality measures and interview program managers. After a brief review, HSC researchers found that CalHospitalCompare’s measures have been extensively tested and validated. Many of the indicators—including those on heart attack, heart failure, pneumonia and surgical infection prevention—are measures that all hospitals are required to report to the Joint Commission for accreditation purposes; other measures, including a set of patient experience questions, are taken directly from the HCAHPS survey.[53] These measures are all well vetted and established. CalHospitalCompare also includes some new measures not yet reported by other quality transparency initiatives; these include ICU outcome and process measures, and additional patient experience measures beyond the HCAHPS items. In all cases, the new measures were extensively tested and validated by CHART, and approved by its steering committee (which includes a wide range of stakeholders, including hospitals) before public release on the Web site.
Question (b) can be answered by reviewing the mix of measures available on the Web site and interviewing program designers and managers. CalHospitalCompare has a larger set of measures than any other quality transparency initiative of which we are aware. It includes process measures for the five most common conditions for which patients are hospitalized, and outcome measures (mortality rates) for two conditions/treatments (heart bypass surgery and pneumonia). Additional process and/or outcome measures are reported for ICU patients, surgical patients and medical patients. Finally, patient experience measures are reported separately for maternity patients, medical patients, surgical patients and all patients. Although CalHospitalCompare already has a broader set of quality measures than other initiatives, program managers plan to add measures from other areas of care, including neonatal care and elective surgery, and to expand measures in current domains, including intensive care.
Question (c) can be addressed by evaluator review of program documentation, supplemented by interviews with program managers. HSC’s review of the Web site revealed that program managers account for differences in the patient population for process measures by using denominator exclusions, ensuring that only those who should be counted are included in the measure. A number of the process measures and their denominator exclusions are used by the Joint Commission and well established; and those that were developed by CHART are similarly detailed and well-validated. For outcome and patient experience measures, CalHospitalCompare accounted for differences in the patient population by using approaches that are widely accepted as state-of-the-art methods for risk adjustment. For each set of risk-adjusted measures, the Web site clearly documents the source of the methodology. To increase hospitals’ trust in and acceptance of the risk-adjustment methods, CalHospitalCompare managers also conducted data analyses applying different risk-adjustment models to each measure, then shared the results with hospitals. They were able to demonstrate that the particular model used generally had little effect on hospitals’ performance ratings relative to their peers. This program activity, while not visible on the consumer-facing Web site, has been important in enhancing hospital buy-in to the program and is an approach that other quality transparency programs may find worthwhile replicating.
2. Does the program ensure that data are collected accurately to allow comparisons across providers?
This question can be addressed by the following indicators: (a) whether data collection and reporting are standardized across providers, (b) whether the data are correct and appropriate for each measure, and (c) whether the data are current.
To assess whether data collection and reporting are standardized (sub-question a), the evaluator can review documentation describing program methods, if any, for ensuring uniform data abstraction, coding and reporting methods; the evaluator also would interview program managers. For a large, resource-rich evaluation, the evaluator might observe and validate primary data collection at provider sites, but this is not likely to be feasible for most evaluations. A review of CHART and CalHospitalCompare documentation, and discussion with program managers, shows that ensuring standardized data across providers has been an especially strong feature of the program. Many well-established measures, such as those reported to the Joint Commission and the Centers for Medicare and Medicaid Services (CMS), have had problems arising from widely varying abstraction and coding practices across hospitals and even within hospitals. CHART has provided ongoing training and support to California hospitals and vendors to ensure better, more standardized data collection practices, another valuable program activity that other quality transparency programs might consider replicating.
To measure the correctness and appropriateness of the data (sub-question b), the evaluator can assess whether the program has established quality assurance activities such as (but not necessarily limited to) the following activities:
-
- Validation of datasets delivered by providers
- Auditing of data (at point of primary data collection)
- Use of rigorous and well-established sampling and statistical methods
For each of these activities, evaluators can first review program documentation and interview program managers, then perform their own direct data reviews if necessary, and if feasible given the scope of the evaluation. The validation of datasets includes checks for logical errors, such as missing data that should be present (e.g., when a large acute care hospital is missing a month or more of data for a major domain of care), and obvious misclassification errors (e.g., when a hospital reports results for a service line that it does not provide). Before the inception of CalHospitalCompare’s data validation practices, many California hospitals had major data omissions and errors that went undetected because the organizations to which the hospitals were required to report, including the Joint Commission and CMS, had inadequate systems in place for identifying such errors. For data auditing, program managers and a review of program documentation showed that CalHospitalCompare has audit policies that vary by hospital size, so that the larger the hospital, the larger the number of records that need to be verified against patient chart data. In contrast, CMS’s current rules call for only five patient records to be audited per hospital per quarter, no matter the number of patients the hospital treats. Even for the smallest hospitals, CalHospitalCompare’s audit policy calls for an audit sample greater than five. Finally, to gauge the program’s methodological rigor, the evaluator can assess dimensions such as minimum sample size requirements, other reporting criteria (e.g., maximum relative standard errors), and the validity of statistical testing procedures.[54] A brief review by HSC researchers suggested that CalHospitalCompare applied rigorous statistical methods; in a full-fledged evaluation, the evaluators would need to assess this aspect of the program in greater detail.
The final observable measure relates to the currency of the data. The CalHospitalCompare Web site clearly states the data-reporting period for each domain of performance measures. For most domains, the reporting period is a 12-month period ending July 2007, which is very current. Mortality measures rely on older data (2004 for pneumonia, 2005 for bypass surgery), because it generally takes at least two years to obtain completed mortality data files; CalHospitalCompare reports the most current mortality data available. The Web site updates its data on a quarterly basis. Program managers suggest that six-month update intervals would be more efficient, but the quarterly updates reflect a desire by hospital stakeholders to use as current data as possible for quality improvement and a desire by consumer groups to have access to data as current as the hospitals.
3. Does the program present quality data that is credible, meaningful, and easy to access, understand and navigate?
This evaluation question can be addressed separately for (a) credibility, (b) meaningfulness, and (c) ease of access, comprehension and navigability. For (a) credibility, the provider group being assessed by the program is a very important target audience. An observable measure would be the degree of provider engagement and collaboration in the program, especially in the selection of measures and the collection, reporting and measurement of data. On this dimension, CalHospitalCompare has done particularly well; its parent organization CHART has involved hospitals, and the national and state hospital associations, intensively in program design and data measurement issues. As a result, the program appears to have a high degree of credibility and support in the provider community.
On the consumer side, measuring credibility (a) would involve assessing the degree to which (i) consumers trust the Web site and its sponsors, and (ii) consumers find the need for the information compelling. The evaluator can assess the Web site directly for consumer credibility, preferably in consultation with consumer experts. The CalHospitalCompare Web site states its sponsors/funders and objectives clearly and transparently; it emphasizes the involvement of stakeholders, such as consumer groups and public organizations, and of the hospitals themselves, which all may be helpful in gaining consumer trust, according to previous research on consumers. This information, however, is somewhat buried under an “About Us” tab; it is not readily apparent on the home page of the Web site. For (ii), the Web site has a page titled “Why Quality Matters,” but this also is not readily accessible from the home page. In addition, the Web site’s discussion of “Why Quality Matters,” while clearly stated, appears geared toward consumers with higher levels of health literacy. Its presentation may not be as persuasive to a broader audience of consumers, whom previous research suggests might find concrete, life-or-death examples of quality disparities more compelling.[55]
For (b), assessing how meaningful and useful the quality information is for consumers, the evaluator can assess the Web site directly, either with the direct involvement of consumer experts or relying on existing research from such experts. Consumer research has shown that most consumers find comparative provider quality information most meaningful when (i) it is presented to them in simple language (not complex clinical terms), (ii) the data are presented as grades or ratings rather than numerical estimates, and (iii) there are meaningful distinctions between superior and inferior performers. On all these dimensions, CalHospitalCompare does well. For (i), not only the performance measures, but the explanations of them, are in clear, everyday language vetted by health literacy experts and extensively validated in focus groups and cognitive testing. For (ii), CalHospitalCompare uses multiple benchmarks for each measure; a hospital is rated on a five-point scale (from “superior” to “poor”), based on where the confidence interval for the hospital’s performance estimate falls relative to the benchmarks.[56] The rating approach is clearly explained on the Web site. CalHospitalCompare’s use of color-coded icons to label the five performance categories has been shown in prior consumer testing to be effective with a broad range of consumers. In contrast, Web sites that only show consumers point estimates of performance measures (e.g., CMS’s process measures, shown as bar charts), with no grades/ratings attached, have been shown to confuse consumers as to whether differences across providers are meaningful.[57] For (iii), CalHospitalCompare’s use of multiple benchmarks and five-point rating scale help to create enough distinct categories that consumers and other users can identify superior and inferior performers for each condition or domain. In contrast, programs that follow a strict rule of detecting only differences that are at least two standard deviations from the mean (e.g., CMS’s mortality measures) identify almost all providers (typically 95 out of 100) as average performers—an approach that consumers are likely to find frustrating and not useful in helping them to choose or avoid particular hospitals.
For (c), assessing how easy to access, understand and navigate the Web site is, the evaluator can review the Web site directly, again preferably in consultation with health-care consumer experts. HSC’s assessment after a brief review is that CalHospitalCompare does well on these dimensions. The Web site is free, readily accessible, robust and easy to navigate. Search functions are clear and flexible: the user can search for hospitals by location (city, county or zip code), condition, or hospital name. One limitation to the location search function is that users cannot specify a distance to search (e.g., a 10-mile radius) from a particular location—a function that might be more useful to consumers than the current city/county/zip code specifications currently allowed by the Web site. The hospital reports generated by the Web site, as well as the instructions and underlying documentation, are transparent and easy to understand, reflecting the involvement of health literacy and other consumer experts, and consumers, in the Web site development.
For observable measures (b) and (c), evaluators must also asses how meaningful and accessible the quality data are for providers. As mentioned earlier, CHART provides detailed patient-level quality data to providers to inform their development of quality improvement initiatives. HSC did not review these spreadsheets, but a full-fledged evaluation would include an assessment of these spreadsheets, and interviews with hospitals about the usefulness and accessibility of the information.
4. Do program managers work to increase awareness of the program?
For this question, the evaluator can interview program managers and review outreach documents and other tools directly. Discussion with CalHospitalCompare managers revealed that the program has engaged in limited outreach efforts to date. Press releases have been issued (when the Web site was launched and with every quarterly update) to induce media coverage that would in turn increase consumer awareness. When the Spanish-language version of CalHospitalCompare was launched, program managers expanded outreach by distributing brochures at community clinics and other sites serving Spanish-speaking consumers and displaying banner ads at Spanish-language Web sites. After the addition of more maternity measures later in 2008, program managers plan to purchase ads at maternity-related Web sites.
5. Is each identified barrier addressed by an activity?
As discussed in the case study logic model section above, CalHospitalCompare does not report price data for hospital services, nor does it provide quality information for consumers through channels other than the Web site. Program managers believe that reporting price data are beyond the scope of the program and attempting to add that dimension would divert resources from their continuing efforts to expand and improve quality reporting. Program managers have discussed ways to increase the program’s reach to consumers beyond the Web site, by providing hard copies of the hospital information for display at public libraries and community centers, for example. A challenge they identified with this approach is that keeping those reports current (i.e., replacing them every quarter) would be costly.
Overall, HSC’s analysis indicates that CalHospitalCompare has addressed program barriers with activities that seem careful, rigorous and well implemented. As a result, an evaluation of the next level—program outputs—is warranted.
Outputs
An evaluation of program outputs assesses whether target audiences are aware of the program, whether they participated in the program (e.g., visited the Web site to use the quality information), and their perceptions of the program. On the consumer side, a consumer survey would be needed to address these observable measures, as discussed earlier (p. 29). CalHospitalCompare commissioned a Harris Interactive survey of California residents (n=1,000), asking about awareness of the program; about 5 percent of survey respondents responded that they were aware of the program. Program managers also have used counts of Web hits to gauge overall use, as well as pop-up surveys to obtain feedback about consumers’ (and other target audiences’) perceptions of and reactions to the program. On the provider side, program managers note that it is not necessary to measure hospital awareness of the program, which is about 100 percent. As for measuring the extent to which hospitals use the quality information they receive from the program and their reactions to this information, CHART has collected this information at various points by conducting non-random surveys, holding meetings with hospital executives, and soliciting hospitals’ comments at the CHART Web site. An evaluator would need to judge whether these efforts should be supplemented by other tools, such as additional surveys of and/or interviews with hospitals.
Outcomes
If the outputs stage of the evaluation suggests significant awareness and use of the program by the target audiences, the evaluator can then attempt to measure program impact as described earlier in this report (p. 30). The primary funder of CalHospitalCompare is planning to begin the first phase of an outcomes evaluation later in 2008. This evaluation will include a follow-up consumer survey of California residents, again conducted by Harris Interactive. This follow-up survey will not only ask again about awareness of the program, but also ask for the first time about use of the program and any impact on decision-making. The evaluation also will include a quantitative analysis of changes in performance measures since the program’s inception; program managers, however, are aware that performance changes cannot be attributed just to the impact of this program.
CASE STUDY 2: MASSACHUSETTS HEALTH QUALITY PARTNERS (MHQP)
Background
Massachusetts Health Quality Partners (MHQP) operates a free Web site (www.mhqp.org) that compares the performance of primary care physician groups in Massachusetts on a variety of clinical process and patient experience measures. MHQP was developed in 1995 by a broad coalition of physicians, hospitals, health plans, purchasers, consumers and government agencies working to improve the quality of health care in Massachusetts.
The data for the clinical process measures are drawn from administrative (claims) data gathered from the commercial HMO and point of service (POS) products of five major local health plans. The clinical measures themselves are based on the National Committee for Quality Assurance’s (NCQA) HEDIS® measure set, covering:
- Asthma care
- Colorectal cancer screening rates
- Depression in adults
- Diabetes care for adults
- Pediatric care
- Women’s health
Currently, the Web site reports data collected during calendar year 2005. The data are not risk-adjusted because they are based only on process measures. However, to account for underreporting errors that often arise from using claims data, MHQP uses a methodology to adjust these rates upward based on medical chart review. For each measure, each medical group’s performance rate (the percentage of patients who received the recommended service, among all of the group’s patients who should have received the service) is calculated and then compared to three benchmarks. Depending on where the medical group’s performance falls relative to the benchmarks, it receives a rating of one to four stars.
The patient experience data are presented separately from the clinical quality data on the Web site since the results are reported at the more granular practice-site level (each medical group may have several practice sites). The patient experience data covers several domains, including the quality of doctor-patient interactions and organizational features of care. Randomly selected HMO enrollees of five major health plans completed the survey between July and September 2005; all potential respondents were initially contacted by mail, but respondents could choose to complete the survey by mail or on a Web site. One to four stars were awarded for each patient experience measure based on the group’s performance relative to that of other surveyed medical groups.
In the future, MHQP hopes to expand the quality-reporting capabilities of the Web site by developing new clinical effectiveness and resource utilization measures for primary care physicians (PCPs) as well as specialists; develop outcomes measures using data drawn from patient charts; and incorporate data from Massachusetts Medicaid and Medicare patients.
Objectives and Target Audiences
The primary objective of MHQP is clearly stated on the Web site: to improve the quality of health care services delivered to the residents of Massachusetts through broad-based collaboration among health care stakeholders; and more specifically: to provide reliable information to help physicians improve the quality of care they provide their patients and help consumers take an active role in making informed decisions about their health care. Given these objectives, MHQP has two primary audiences: consumers and physicians. Prior to each release of quality data, program mangers review their target audiences and consider any limitations. Based on this analysis, the target consumers are those who would use a primary care physician and are motivated to use the Web site and actively manage their health care. The program also targets primary care physicians and medical group management (who would likely be involved in developing quality improvement initiatives). In addition, program mangers note that policymakers and health plans could be considered secondary audiences since the Web site could be used to inform debate surrounding the reform of the health care system or used by health plans to direct members to high-quality PCPs.
Logic Model
The MHQP logic model is fairly similar to the generic logic model discussed in the previous section. The primary difference is that quality data are not reported for individual providers, but rather medical groups or practice sites, which slightly alters the theory of change. In Track 3 of the outcomes section, consumers would shop for medical groups rather than PCPs. And for Track 1, providers would not view their own quality ratings but rather compare their medical group’s ratings to their competitors. As a result, the impact on the individual physicians’ reputations might be weaker, though it is likely that the medical group management would react more strongly to the ratings and develop quality improvement initiatives. Track 2 would not apply to the MHQP program because it does not target specialists or hospitals that would be involved in referral care.
The MHQP logic model would also be slightly simpler than the generic because of the following differences:
- The MHQP initiative only reports quality information using process measures and patient experience data. Therefore, the environmental factors, barriers and activities that apply to outcomes measures and structural measures are not applicable.
- Since the program only targets primary care physicians, it is less likely that consumers will be hampered by a medical emergency that could prevent shopping for a primary care medical group.
- The reporting burden barrier would also not apply to MHQP since the program uses administrative data.
- And furthermore, it is unlikely that providers would be able to game the claims system and inflate their performance ratings, eliminating the need for the corresponding barrier.
In addition, MHQP does not currently attempt to address the following barriers through any corresponding activity. It is the role of the evaluator to decide how important it is for the program to address these barriers.
- Consumers may need corresponding price information to assess comparative value across providers.
- Some consumers lack access to the Internet or are less comfortable using the Internet to obtain information.
Evaluation
Following the Bennett Hierarchy, we begin the evaluation at the bottom of the ladder.
Inputs/Resources
To analyze the inputs or resources of a program, the evaluator interviews program managers and reviews the logic model, Web site and program documentation. Using the same observable measures outlined in the CalHospitalCompare evaluation, we found that MHQP did develop clear objectives, target audiences and a theory of change. Although the program only reports quality data at the medical group and practice-site level, it clearly states this on the Web site and it is reflected in the objectives. Consequently, the broad objective of improving the quality of health care services should be achievable to a degree, though it is important to note the limitations of claims data and process measures. Program managers recognize these shortcomings and hope to eventually offer outcomes measures drawn from medical chart data. For now, the program is well funded through a variety of grants and contributions from participating health plans and has dedicated staff members. The evaluator next proceeds to the activities level evaluation to analyze whether the activities were implemented in such as way that the outputs and outcomes could actually be achieved.
Activities
As in the CalHospitalCompare case study, the activities level evaluation can be broken down using the five evaluation questions from the generic model.
1. Did program managers select measures that accurately and appropriately measure the quality of care?
This question is addressed using three sub-questions: (a) whether the quality measures have been tested/validated and are widely accepted by providers; (b) whether an appropriate mix of measures is used; and (c) whether the measures accurately capture differences in patient populations.
For question (a), a review of MHQP’s Web site and discussion with the program manager revealed that the process measures and patient experience survey questions are well tested and validated. MHQP reports 17 process measures for adult and pediatric primary care. These measures are drawn directly from NCQA’s HEDIS® 2006 measure set, which is used by health plans throughout the country and based on best practice guidelines. Similarly, the patient experience survey combines the best performing items from the Ambulatory Care Experiences Survey—developed by MHQP—and the Clinician/Group CAHPS® Survey—created by AHRQ. All survey questions underwent psychometric testing to ensure their reliability, validity and data quality.
Question (b) can be answered by reviewing the measures and interviewing program managers. Unlike the generic logic model, MHQP only reports two kinds of measures (process and patient experience). Although program managers hope to develop primary care outcomes measures (which are widely considered to be the best measure of quality), the medical chart quality data are not yet available and may require long-term monitoring of patients to establish hard clinical outcomes for chronic diseases. Given these shortcomings, and the backlash that could be expected from physicians who felt they were being unfairly rated, it is appropriate for MHQP to begin by only reporting well-validated process measures and patient experience data.
Although MHQP does not use outcomes measures, it is still important to consider question (c) and whether the process measures account for differences in the patient population by using standardized guidelines and coding methodology to determine which patients should be included in the denominator of the process measure. These steps ensure that only those patients who should receive the service are being counted. The MHQP Web site states that the sample population for each HEDIS® measure meets the required enrollment, demographic and clinical specifications as detailed by the NCQA, which uses well-validated guidelines for determining the denominator population for each process measure. Furthermore, additional information is attached to each process measure, explaining what is being measured and which patients are included in the rating. Program managers also capture differences in the population by case-mix adjusting the patient experience data based on age, gender, race/ethnicity and socioeconomic status. This step ensures that the characteristics of the patient survey respondent do not create biased results.
2. Does the program ensure that data are collected accurately to allow comparisons across providers?
This evaluation question can be broken down into three sub-questions: (a) whether the data collection practices are standardized, (b) whether the data are correct and appropriate for each rating, and (c) whether the data are current. To address whether the data collection processes for MHQP are standardized, (that is, whether or not each health plan is collecting and coding the claims data using the same techniques) evaluators can review program documentation, interview program managers, and if the evaluation has sufficient resources, evaluators could independently verify that the data are being collected in a standardized manner. For MHQP, however, an independent validation of the data collection processes would not be necessary as the quality information is drawn directly from the data reported to NCQA, which requires plans to conduct a compliance audit using an independent NCQA approved auditor, and clearly defines standardized methods for data collection. Additionally, MHQP contracts with an independent auditor who reviews the methods that MHQP uses to aggregate the information and calculate performance scores. Similarly, for the patient experience measures—as explained on the Web site—a standardized system was used for distributing the survey to health plan members and collecting the results.
Sub-question (b) considers whether or not the data are correct and appropriate for each rating. In order to achieve this, quality transparency programs like MHQP must take a number of steps including (though not limited to) the following:
- Validate the administrative data, checking for logic errors like missing data
- Aggregate data across the five health plans
- Properly attribute data to each physician and corresponding medical group
- Ensure that data are regularly and sufficiently audited
- Use rigorous sampling and statistical methods
Evaluators can confirm that the data are correct and appropriate by reviewing program documentation and interviewing program managers, and if the evaluation has sufficient resources, conduct an independent audit of the data or validate that there are no missing data or obvious coding mistakes. Discussions with the program manger revealed that unlike some quality transparency programs, MHQP devoted significant resources to developing appropriate adjustment, aggregation, attribution, auditing and statistical testing and sampling techniques. As discussed above, the data aggregation and attribution process is audited by independent contractors. Furthermore, each health plan participating in the NCQA program is required to compare their administrative data to a sampling of medical charts (approximately 400 per plan)—to confirm that the claims data aligns with the chart data. To further ensure the accuracy of the administrative data, MHQP developed a methodology to adjust the data so that it is better aligned with patient chart data. In addition, to confirm that ratings are assigned to the correct physicians, the data are first aggregated across the five participating plans and then the scores for each PCP are mapped to the corresponding medical group using a system that allows physicians to verify the groupings. Sampling procedures and the data refinement process for the patient experience data are similarly well designed and based on well-established statistical methods. For example, since practice sites vary in size, MHQP over-sampled small practice sites to ensure adequate sample sizes and statistically discernible results, which were only reported if they met a reliability threshold.
The final observable measure for evaluation question 2 relates to the currency of the data. The MHQP Web site clearly states the current reporting period (2005) for the process measures, and MHQP plans to update this data annually. However, the patient experience data (gathered between July and September 2005) is updated every other year because of the high cost of the survey. Although physicians and consumers might appreciate more timely information, the collection process for the administrative data and the expense of the patient experience survey limits the currency of the data.
3. Does the program present quality data that is credible, meaningful, and easy to access, understand and navigate?
The credibility of the program depends upon its acceptance by physicians and consumers. MHQP, like CalHospitalCompare, addressed this issue by organizing a broad-based coalition of physicians, hospitals, health plans, purchasers, consumers, and government agencies, ensuring that physicians in particular would be able to contribute to the development of the program and address any problems that could have later impacted its credibility. In addition, MHQP sends new datasets to physicians prior to their public release, allowing them to review the ratings and notify the program if any of the data appears inconsistent. For consumers, the evaluator must also consider whether the program and its sponsors are trusted and whether the information reported is considered compelling and useful. We briefly reviewed the MHQP Web site for this case study and found that it does explain in several places who funds the program and why the quality data are useful, though it does not use any concrete life-or-death examples to highlight the importance of the data, as suggested by experts in consumer health care.
In an evaluation, it also important to confirm that the data are meaningful and allow direct comparisons between providers. This step could be accomplished through consultation with health care consumer experts, a review of the Web site and interviews with program managers. Our brief review of the MHQP Web site revealed that the program is limited in that quality data are not reported for individual physicians but for medical groups and practice sites. Furthermore, since the process measures and patient experience measures are reported using different aggregation methods, each data set is reported on separate pages. As a result, consumers cannot easily compare medical groups using both process measure and patient experience data. Although this restricts the meaningfulness of the Web site for consumers, the methodological reasons for choosing aggregated groups are understandable (process measures reported for individual physicians may not be reportable or statistically significant because of small sample sizes and administering the patient experience survey for individual physicians would be prohibitively expensive).[58] And while MHQP reports data at a more aggregated level, the Web site does use star symbols and an appropriate number of benchmarks to help consumers differentiate between high- and low-performing medical groups.[59] It is also important, though, that the data be meaningful to physicians so that they can develop quality improvement initiatives. Like consumers, physicians are limited by not being able to view individual ratings. However, medical groups are more likely to institute quality improvement initiatives and would likely be aware of how individual physicians perform. Therefore, the aggregated quality ratings could still be quite effective by motivating medical groups to improve the services offered by their physicians, so as to raise the overall rating of the group.
Finally, to answer evaluation question 3, evaluators must also consider the ease of access, comprehension and navigability of the Web site, which is tied directly to the meaningfulness of the Web site. For consumers, this observable measure could be evaluated through consultation with a health literacy expert. In HSC’s discussion with a program manager, we learned that program designers did consult with a health literacy expert to ensure that the Web site language and format were accessible and understandable to the majority of consumers. In addition, the quality information on the Web site is easily searchable by zip code, medical group, physician office or physician name and accompanied by simple question and answer sections and instructions for contacting MHQP for further information. MHQP also provides tools to help consumers choose a physician and improve their health. Physicians use the same Web site as consumers and therefore benefit from the easy access and simple format; however, the simplified documentation might frustrate physicians looking for more detailed information. It is the role of the evaluator to determine whether the lack of physician-focused materials is a significant barrier for the program.
4. Do program managers work to increase awareness of the program?
This evaluation question is simply measured by reviewing the outreach efforts and informational materials developed by the program. In the case of MHQP, program managers worked closely with local newspapers to publicize the release of quality information and explain to consumers why the Web site is useful. In addition, program managers arranged for each of the participating health plan Web sites and relevant consumer and government Web sites to offer links to the MHQP site. On the provider side, program managers coordinated with the state medical society to announce the release of the data in its newsletter and worked with participating health plans to alert their network physicians to the Web site.
5. Is each identified barrier addressed by an activity?
As discussed in the case study logic model section above, MHQP does not currently attempt to address two barriers listed in the generic model by providing corresponding price data and quality information for consumers who are less inclined to use the Internet. Although these activities would be beneficial to consumers, it is not necessary to include them if managers believe the barriers to be outside the scope of the program. MHQP does, however, hope to eventually link price data to its quality reports, or at least begin to provide efficiency measures so that consumers can better understand the value of the health care service. Outside of the two barriers that are beyond the scope of the program, the analysis above suggests that MHQP does address, at least in part, the majority of the barriers detailed in the logic model. Those aspects that could be improved should be re-examined in light of the evaluation, and subsequently, the logic model revised. Overall, however, the inputs and activities level evaluation would suggest that the initiative warrants a higher level of evaluation, examining the program’s outputs.
Outputs
An outputs evaluation measures whether or not the target audience participated (used the Web site) and what their reactions were to the Web site. As discussed in the generic evaluation (see p. 29), the most appropriate method for analyzing consumer use and reaction to the program is a large survey based on a probability sample, or at the very least, a survey based on a convenience sample. To be cost-effective, the survey would include questions not only on the outputs—consumer awareness and use of the Web site—but also the short-term and intermediate outcomes (consumer knowledge of differences in physician quality and consumer shopping decisions). Currently, MHQP’s only method for measuring consumer use is to count Web site hits, which is generally considered an inaccurate method. Program managers also opted to not create a pop-up Web survey as they believed it would be distracting. Although MHQP would like to conduct a survey of consumers, they have been prevented by a lack of funds. On the physician side, participation and reaction could be measured through interviews or a survey. Although no formal evaluation or survey has been conducted to analyze the use of the MHQP program by physicians, program managers have heard anecdotal reports suggesting positive results. Ideally, evaluators would conduct formalized interviews with both physicians who used the Web site and those who did not to gain a better understanding of who participated in the program and their reactions. To be efficient, these interviews could also include questions regarding short-term outcomes (whether or not physicians became more knowledgeable of their quality ratings compared to their competitors). For some evaluations it can be useful to supplement these interviews with a survey; however, it would not be feasible for an MHQP evaluation, considering the expense of physician surveys.
Outcomes
If the evaluator concluded that the MHQP program was widely used by the target audiences, he or she might decide to conduct additional interviews or focus groups with consumers, physicians, stakeholders and experts to better understand the actions, impact and unintended consequences (or intermediate and long-term outcomes) resulting from the program. Only if these interviews suggested that the program had a strong impact would evaluators even consider conducting a multivariate analysis to measure the effect of the program on the state compared to other states without quality transparency programs. However, as discussed on pages 30-31, it may not be possible to isolate the effects of a single quality transparency program. More likely, evaluators would observe how quality of care and patient outcomes changed since the introduction of the program, which may only be able to measure how the sum of all quality transparency programs and other market changes have affected provider performance.
KEY TAKEAWAY POINTS
Although quality transparency program evaluation requires a very detailed approach, we identified key points that are particularly important for any evaluator to consider. The first six key points, listed below, relate to the design of quality transparency programs. We have included these points in our discussion of program evaluation since they represent useful standards against which quality transparency programs can be compared. The final four points, listed below, relate more generally to program evaluation and are meant to guide an evaluator in collecting useful and accurate information about the effects of the program.
1. Formative evaluations improve a program’s chance of success
A thorough formative evaluation, conducted in an early design phase of a program, requires program designers to lay out in specific terms their key objectives and target audiences. As part of this process, developing a detailed logic model requires them to identify precisely the program inputs and activities needed to achieve the desired objectives, the various environmental factors and barriers that may affect the program’s ability to achieve those objectives, and the exact assumptions that the program makes about causal linkages. One aspect of a formative evaluation that is particularly important is to define realistic target audiences and a theory of change, which is explained in detail in item 2.
By conducting a formative evaluation prior to program implementation, program managers/designers can avoid errors that may not become apparent until a summative evaluation is performed, at which point significant resources may already have been expended on processes that will not achieve the program’s objectives. Therefore, it is more cost-effective to conduct a formative evaluation than to wait for a summative evaluation. If formative evaluations have not been conducted, the summative evaluator must complete a formative evaluation as part of the summative evaluation. Determining program impact cannot reliably be done without first mapping out the program’s logic model and using that to guide the evaluation questions.
2. The size of the consumer target audience and the potential impact of the program on that audience should be realistically estimated
Quality transparency initiatives tend to state their target audiences in very general terms: “consumers” or “residents of a state.” Ideally, during an early stage of program development, program designers and managers should precisely identify their target audience taking into account the following principles: (a) the target audience of a quality transparency program is likely to be limited to those consumers who need and use the providers whose performance measures are reported by the program, and (b) the target audience is further limited by the environmental context in which the program operates. Using secondary data sources, an evaluator should be able to calculate realistic empirical estimates of the true target audience, which will be only a proportion—in some cases, a modest proportion—of all consumers.
Program managers and evaluators must also consider the theory of change and the relative impact that the program can be expected to have on consumers given the numerous environmental factors and barriers. Although quality transparency programs frequently cite consumers as their primary target audience, research indicates that providers may be the target audience most affected by such programs.[60] While many consumers may not be motivated to look up complex quality ratings, providers are likely to be driven by the public release of quality data to implement quality improvement initiatives to protect their public and professional reputations. These self-motivated actions may be more likely to improve the quality of care than shifts in market share driven by consumer demand. Evaluators must consider these issues when assessing a quality transparency program’s theory of change to ensure that program designers are not overestimating the program’s potential impact.
3. Programs that engage and collaborate with multiple stakeholders, especially the providers being assessed, are more likely to have an impact
Successful public quality transparency initiatives tend to build on a broad base of stakeholders from the earliest stages of program design. These stakeholders may include insurers, purchasers, consumer groups, policy makers and public organizations, but it is particularly important to include members of the provider community being assessed by the program. Engaging providers from the beginning will increase participation in the program (in voluntary transparency initiatives), help ensure clinical and practical relevance of the measures, and help increase acceptance by providers of the program’s measures and methods.
4. Programs should use a mix of measures to compensate for limitations in the state of knowledge on quality measurement
Outcomes measures represent the most direct method of capturing provider quality, but the science of linking provider behavior to patient outcomes is still in its infancy, so the body of validated outcomes measures is quite limited. In addition, for existing outcomes measures, even the most advanced risk-adjustment methods may not capture all differences in patient mix, meaning that outcomes assessments may not be entirely reliable, and excessive reliance on flawed assessments may have unintended consequences, such as providers avoiding the sickest patients. As a result, it is useful for programs to include a mix of other quality indicators, such as process, structural and patient experience measures. With regard to patient experience measures, some health professionals question their value, but these measures are very important to many consumers, even if a causal link to clinical outcomes is undetermined.
5. Programs should pay particular attention to the quality of the quality data
How accurately data are abstracted, coded, aggregated and reported, and how carefully data are audited and validated, will have profound effects on the usefulness of the performance ratings reported by the program. If two quality transparency programs report the same measures, one can have a much greater positive impact than the other by devoting resources to activities such as training vendors and staff at provider sites to collect data in an accurate, standardized manner; auditing sufficient samples of records; and validating datasets by checking for omissions, misclassifications and other errors. Similarly, if administrative data are used, program managers should develop rigorous methods to audit and validate the data.
6. Quality information should be presented to consumers in formats they find meaningful
Consumers find performance measures most useful when the information is presented to them as grades or ratings, and when there are enough—but not too many—categories of performance (4-5 categories are usually most effective). Presenting most consumers with just point estimates or confidence intervals leaves them confused about whether the differences they see across providers are significant. In addition, presenting consumers with ratings for which almost all providers fit into the “average” category (because of stringent two-standard-deviation rules) leaves consumers frustrated. An alternative—using multiple benchmarks to rank providers—helps to create meaningful categorizations of high and low performers that consumers find more useful.
7. Evaluator might be able to assess program impact without needing to proceed through all the levels of the evaluation process
For some programs with flawed inputs and activities, an evaluator might be able to determine at a very early stage of the evaluation that the program is unable to achieve its desired outcomes. In such cases, it would be a waste of evaluation resources to proceed through all of the evaluation levels depicted by the Bennett hierarchy. Instead, it might be more reasonable for the evaluator to shift to an explanatory evaluation, describing why the program in its current configuration is unable to make an impact and possibly suggesting alternative data sources and approaches (that may be more limited in scope but better targeted for achieving objectives).
Terminating an evaluation early in such cases makes sense particularly because evaluating higher-level questions (those having to do with program outputs and outcomes) is substantially more difficult and resource-intensive than evaluating lower-level questions, and often requires multiple observable measures and evaluation methods to address one question.
8. To measure a program’s reach to consumers, a survey must be conducted
Quality transparency programs frequently use counts of Web site “hits” to estimate the program’s reach to its target audiences. For several reasons, however, this is not an acceptable approximation of program reach. First, Web site hits are a misleading (inflated) indicator because (a) the Web site is visited by many non-consumers, such as researchers, government agency staff and the media; and (b) each user can generate a very large number of Web site hits. In addition, counts of Web site hits cannot convey any information about how useful the information was to consumers and whether it affected their behavior.
To gauge the extent of program reach, an evaluator must conduct a survey of the target audience. A probability-sample survey (such as a random survey) would be most statistically reliable and inferable, but its costs likely would exceed the resources available to most evaluation efforts. A convenience-sample survey would be more feasible; one approach would be to identify providers of the services whose performance measures are listed on the Web site and to solicit the cooperation of a subset of these providers in distributing a survey to consumers receiving the services. Such a survey could address both program outputs (awareness of the quality transparency initiative; use of the Web site; perceptions of the Web site) and outcomes (among Web site users, any knowledge gained and any changes in decision-making).
9. Program reach should not be confused with program impact
Some program managers and external observers of quality transparency initiatives use measures of program reach (e.g., the number of consumers visiting the Web site) as an approximation of program impact. However, as noted earlier in the report, program outputs are conceptually distinct from program outcomes. Success on program outputs (e.g., a significant proportion of the target audience visiting the Web site) is necessary but not sufficient to bring about success on program outcomes (e.g., a significant proportion of the target audience learning about and choosing higher-quality providers). And, it is the program outcomes that determine the success or impact of a program.
10. Isolating the long-term impact of any single quality transparency initiative may not be possible
It is not valid to observe changes in long-term outcomes (e.g., improved provider performance, better patient outcomes) and assume that the program was responsible for the changes. The observed changes could have been caused by a variety of factors external to the program, including other quality reporting efforts, pay-for-performance incentives, market developments, and technological changes. To assess whether the program made an impact, an evaluator needs to design and carry out a thorough qualitative analysis, identifying and interviewing a broad spectrum of local experts and stakeholders. If the results of this qualitative analysis suggest that the program may have had long-term impacts, ideally the data would permit the evaluator to proceed with a careful quantitative analysis (e.g., a difference-in-difference estimation) to test whether changes in long-term outcomes differed significantly in “transparency markets” vs. “non-transparency markets.” However, in the case of quality transparency initiatives, it may be increasingly unlikely, especially for hospitals, to find “non-transparency markets” to serve as control groups. In addition, providers face so many factors external to the program that disentangling the effects of all these factors may not be possible. In the big picture, quantitative analyses to examine changes in provider performance and patient outcomes are invaluable, but it is highly doubtful whether the changes measured by such analyses can be ascribed to any single program, no matter how detailed or sophisticated the multivariate model.
APPENDIX 1: RESPONDENTS
In accordance with HSC’s confidentiality policy, we do not reveal the names of our respondents or attribute comments to specific individuals in our report. The following is a list of respondents, categorized by topic:
Program Evaluation: 2 respondents (Mathematica Policy Research, Inc.)Specific Evaluation Methods: 2 respondents (1 HSC, 1 independent consultant)Quality Transparency: 1 respondent (academic researcher/expert and consultant on consumer issues and impact of quality reporting programs)CalHospitalCompare.org: 2 respondents (1 /University of California at San Francisco/ CHART/ CalHospitalCompare; 1 California HealthCare Foundation/ CHART/ CalHospitalCompare)Massachusetts Health Quality Partners: 1 respondent (Massachusetts Health Quality Partners/ Network for Regional Healthcare Improvement)
APPENDIX 2: KEY SOURCES
Quality Transparency
Bridges to ExcellenceÒ, BTE Program Evaluation (2007).
Dudley, R. Adams, Diane Rittenhouse and Richard Bae, Creating a Statewide Hospital Quality Reporting System, California HealthCare Foundation, The Quality Initiative (February 2002).
Gerteis, Margaret, Jessie S. Gerteis, David Newman and Christopher Koepke, “Testing Consumers’ Comprehension of Quality Measures Using Alternative Reporting Formats,” Health Care Financing Review, Vol. 28, No. 3 (Spring 2007).
Hibbard, Judith H. et al., “Increasing the Impact of Health Plan Report Cards By Addressing Consumers’ Concerns,” Health Affairs, Vol. 19, No. 5 (2000).
Hibbard, Judith H., et al., “Consumer Competencies and the Use of Comparative Quality Information: It Isn’t Just About Literacy,” Medical Care Research and Review, Vol. 64, No. 4 (August 2007).
Hibbard, Judith H., Jean Stockard and Martin Tusler, “Does Publicizing Hospital Performance Stimulate Quality Improvement Efforts?” Health Affairs, Vol. 22, No. 2 (March/April 2003).
Hibbard, Judith H., Jean Stockard and Martin Tusler, “Hospital Performance Reports: Impact on Quality, Market Share, And Reputation,” Health Affairs, Vol. 24, No. 4 (July/August 2005).
Hibbard, Judith H., Jean Stockard and Martin Tusler, “It Isn’t Just About Choice: The Potential of a Public Performance Report to Affect the Public Image of Hospitals,” Medical Care Research and Review, Vol. 62, No. 3 (June 2005).
Krumholz, Harlan M., “
Measuring Performance For Treating Heart Attacks And Heart Failure: The Case For Outcomes Measurement,” Health Affairs, Vol. 26, No. 1 (January/February 2007).
Laschober, Mary, “Hospital Compare Highlights Potential Challenges in Public Reporting for Hospitals,” Issue Brief No. 2, Mathematica Policy Research, Inc., Princeton, NJ (March 2006).
Laschober, Mary, et al., “Hospital Response to Public Reporting of Quality Indicators,” Health Care Financing Review, Vol. 28, No. 3 (Spring 2007).
Legnini, Mark W. for the National Quality Forum, Background Paper on Hospital Cost and Price Transparency: Usable, Audience-Specific Information on Costs and Prices (September 25, 2007).
Leonardi, Michael J., Marcia L. McGory and Clifford Y. Ko, “Publicly Available Hospital Comparison Web Sites,” Archives of Surgery, Vol. 142, No. 9 (September 2007).
Marshall, Martin N. et al., “Public Reporting On Quality In the United States and the United Kingdom,” Health Affairs, Vol. 22, No. 3 (May/June 2003).
Marshall, Martin N., et al., “The Public Release of Performance Data: What Do We Expect to Gain? A Review of the Evidence,” Journal of the American Medical Association, Vol. 283, No. 14 (April 12, 2000).
Normand, Sharon-Lise T. and David M. Shahian, “Statistical and Clinical Aspects of Hospital Outcomes Profiling,” Statistical Science, Vol. 22, No. 2 (2007).
Peters, Ellen, et al., “Less is More in Presenting Quality Information to Consumers,” Medical Care Research and Review, Vol. 64, No. 2, (April 2007).
Shaller, Dale et al., “Consumers and Quality-Driven Health Care: A Call to Action,” Health Affairs, Vol. 22, No. 2 (March/April 2003).
U.S. Government Accountability Office (GAO), GAO-08-555T, Hospital Quality Data: Issues and Challenges Related to How Hospitals Submit Data and How CMS Ensures Data Reliability (March 6, 2008).
Voices of Experience: Case Studies in Measurement and Public Reporting of Health Care Quality, California HealthCare Foundation (March 2001).
Werner, Rachel M. and David A. Asch, “The Unintended Consequences of Publicly Reporting Quality Information,” Journal of the American Medical Association, Vol. 293, No. 10 (March 9, 2005).
Program Evaluation
Evaluation Handbook, W.K. Kellogg Foundation (June 1, 2005).
Frechtling, Joy A., Logic Modeling Methods in Program Evaluation, John Wiley and Sons, Inc. (2007).
Frechtling, Joy A., The 2002 User-Friendly Handbook for Project Evaluation, National Science Foundation (NSF) Division of Research, Evaluation and Communication (January 2002).
Patton, Michael Quinn, Qualitative Research and Evaluation Methods, 3rd Edition, Sage Publications Inc. (2002).
Taylor-Powell, Ellen, Sara Steele and Mohammad Douglah, Planning a Program Evaluation, University of Wisconsin-Extension: Cooperative Extension (February 1996).
US General Accounting Office, GAO-02-923, Program Evaluation: Strategies for Assessing How Information Dissemination Contributes to Agency Goals (September 2002).
ENDNOTES
- Marshall, Martin N., et al., “The Public Release of Performance Data: What Do We Expect to Gain? A Review of the Evidence,” Journal of the American Medical Association, Vol. 283, No. 14 (April 12, 2000).
- Exec. Order No. 13,410, 71 Fed. Reg. 51,089 (August 28, 2006).
- Normand, Sharon-Lise T. and David M. Shahian, “Statistical and Clinical Aspects of Hospital Outcomes Profiling,” Statistical Science, Vol. 22, No. 2 (2007).
- Marshall, Martin N., et al., “The Public Release of Performance Data: What Do We Expect to Gain? A Review of the Evidence,” Journal of the American Medical Association, Vol. 283, No. 14 (April 12, 2000).
- Marshall, Martin, et al., “Public Reporting On Quality In the United States and the United Kingdom,” Health Affairs, Vol. 22, No. 3 (May/June 2003).
- Marshall, Martin N., et al., “The Public Release of Performance Data: What Do We Expect to Gain? A Review of the Evidence,” Journal of the American Medical Association, Vol. 283, No. 14 (April 12, 2000).
- Hibbard, Judith H., Jean Stockard and Martin Tusler, “Hospital Performance Reports: Impact on Quality, Market Share, And Reputation,” Health Affairs, Vol. 24, No. 4 (July/August 2005).
- Marshall, Martin N., et al., “The Public Release of Performance Data: What Do We Expect to Gain? A Review of the Evidence,” Journal of the American Medical Association, Vol. 283, No. 14 (April 12, 2000).
- Normand, Sharon-Lise T. and David M. Shahian, “Statistical and Clinical Aspects of Hospital Outcomes Profiling,” Statistical Science, Vol. 22, No. 2 (2007).
- Werner, Rachel M. and David A. Asch, “The Unintended Consequences of Publicly Reporting Quality Information,” Journal of the American Medical Association, Vol. 293, No. 10 (March 9, 2005).
- Normand, Sharon-Lise T. and David M. Shahian, “Statistical and Clinical Aspects of Hospital Outcomes Profiling,” Statistical Science, Vol. 22, No. 2 (2007).
- Marshall, Martin N., et al., “The Public Release of Performance Data: What Do We Expect to Gain? A Review of the Evidence,” Journal of the American Medical Association, Vol. 283, No. 14 (April 12, 2000).
- Dudley, R. Adams, Diane Rittenhouse and Richard Bae, Creating a Statewide Hospital Quality Reporting System, California HealthCare Foundation, The Quality Initiative (February 2002).
- Krumholz, Harlan M., “Measuring Performance For Treating Heart Attacks And Heart Failure: The Case For Outcomes Measurement,” Health Affairs, Vol. 26, No. 1 (January/February 2007).
- Dudley, R. Adams, Diane Rittenhouse and Richard Bae, Creating a Statewide Hospital Quality Reporting System, California HealthCare Foundation, The Quality Initiative (February 2002).
- Normand, Sharon-Lise T. and David M. Shahian, “Statistical and Clinical Aspects of Hospital Outcomes Profiling,” Statistical Science, Vol. 22, No. 2 (2007).
- Normand, Sharon-Lise T. and David M. Shahian, “Statistical and Clinical Aspects of Hospital Outcomes Profiling,” Statistical Science, Vol. 22, No. 2 (2007).
- Ibid.
- Normand, Sharon-Lise T. and David M. Shahian, “Statistical and Clinical Aspects of Hospital Outcomes Profiling,” Statistical Science, Vol. 22, No. 2 (2007).
- Werner, Rachel, “The Unintended Consequences of Publicly Reporting Quality Information,” Journal of the American Medical Association, Vol. 293, No. 10 (March 9, 2005); and Normand, Sharon-Lise T. and David M. Shahian, “Statistical and Clinical Aspects of Hospital Outcomes Profiling,” Statistical Science, Vol. 22, No. 2 (2007).
- Werner, Rachel, “The Unintended Consequences of Publicly Reporting Quality Information,” Journal of the American Medical Association, Vol. 293, No. 10 (March 9, 2005).
- Normand, Sharon-Lise T. and David M. Shahian, “Statistical and Clinical Aspects of Hospital Outcomes Profiling,” Statistical Science, Vol. 22, No. 2 (2007).
- Marshall, Martin, et al., “Public Reporting On Quality In the United States and the United Kingdom,” Health Affairs, Vol. 22, No. 3 (May/June 2003).
- Leonardi, Michael J., Marcia L. McGory and Clifford Y. Ko, “Publicly Available Hospital Comparison Web Sites,” Archives of Surgery, Vol. 142, No. 9 (September 2007).
- Hibbard, Judith H., Jean Stockard and Martin Tusler, “Does Publicizing Hospital Performance Stimulate Quality Improvement Efforts?” Health Affairs, Vol. 22, No. 2 (March/April 2003).
- Bridges to ExcellenceÒ, BTE Program Evaluation (2007).
- The following section describing Bennett’s hierarchy and its application is drawn directly from: Taylor-Powell, Ellen, Sara Steele and Mohammad Douglah, Planning a Program Evaluation, University of Wisconsin-Extension: Cooperative Extension (February 1996), http://learningstore.uwex.edu/Planning-a-Program-Evaluation--P1033C238.aspx (Accessed August 7, 2007).
- Agency for Healthcare Research and Quality (AHRQ), “Guide to Health Care Quality: You Know It When You See It,” Pub. No. 05-0088 (September 2005).
- Legnini, Mark W. for the National Quality Forum, Background Paper on Hospital Cost and Price Transparency: Usable, Audience-Specific Information on Costs and Prices (September 25, 2007).
- Normand, Sharon-Lise T. and David M. Shahian, “Statistical and Clinical Aspects of Hospital Outcomes Profiling,” Statistical Science, Vol. 22, No. 2 (2007).
- Legnini, Mark W. for the National Quality Forum, Background Paper on Hospital Cost and Price Transparency: Usable, Audience-Specific Information on Costs and Prices (September 25, 2007).
- Marshall, Martin, et al., “Public Reporting On Quality In the United States and the United Kingdom,” Health Affairs, Vol. 22, No. 3 (May/June 2003).
- This may also be considered a barrier, as it could be partially addressed by a quality transparency program that provides effective outreach and education to consumers about the variation in quality across providers and the importance of clinical performance in addition to patient experience factors.
- In addition, the use of outcomes measures is limited to common diseases and conditions, for which there is a sufficient sample size of patients.
- One exception to this barrier is when process measures are used to rate providers on whether or not they overuse certain procedures or services.
- Claims data has several shortcomings: (1) cases may be missed or misclassified, especially for non-reimbursable diagnoses; (2) co-morbidities and other patient characteristics are often not reported accurately, impacting risk-adjustment (for outcomes measures) and patient eligibility for the service being measured (for process measures) (3) coding may not reflect all the services performed by providers during a visit.
- Using a stringent two-standard-deviation rule to identify well- and poorly performing providers—an approach taken by several quality transparency programs, including the Centers for Medicare and Medicaid Services’ Hospital Compare Web site for its mortality estimates—means that, typically, 95% of providers will be in the average category, and only 2.5% (or 1 in 40) providers will be in each of the superior and inferior categories.
- For a discussion of appropriate methods for reporting price data, see “A Framework for Evaluating Price Transparency Initiatives in Health Care,” Report to the Assistant Secretary for Planning and Evaluation (ASPE) (October 2007).
- In developing quality measures and methods, it is important for program designers to consult national quality organizations and medical and specialty societies.
- A number of these unintended outcomes are drawn from: Dudley, R. Adams, Diane Rittenhouse and Richard Bae, Creating a Statewide Hospital Quality Reporting System, California HealthCare Foundation, The Quality Initiative (February 2002).
- This unintended outcome results from a barrier that is unlikely to be fully addressed by a program activity.
- Ibid.
- Evaluators must investigate both the intended and unintended effects of programs. For a discussion of potential unintended effects, see p. 25. Evaluators can investigate any unintended effects through qualitative interviews described in detail on p. 30.
- For additional information see: Hibbard, Judith H., Jean Stockard and Martin Tusler, “Hospital Performance Reports: Impact on Quality, Market Share, And Reputation,” Health Affairs, Vol. 24, No. 4 (July/August 2005).
- If provider surveys are conducted, follow-up interviews may be needed to obtain more detailed information about responses to and impact of the quality transparency program. Surveys of hospital executives may be more feasible and less costly than surveys of physicians, which typically have response rates that are lower (and declining over time).
- Tu, Ha T. and Johanna R. Lauer, “A Framework for Evaluating Price Transparency Initiatives in Health Care,” ASPE (October 2007).
- Those methods that should be conducted in a specific order are numbered, while those that are bulleted may be conducted in any order or combination depending on evaluation resources.
- The majority of hospitals that do not participate are small, rural hospitals or urban safety net hospitals with limited financial resources. Often these hospitals do not feel that the care they provide is appropriately represented by the performance measures, as in the case of small rural hospitals, who would typically transfer a complex case to a larger hospital, rather than apply the best practices on which the performance measures are based. CHART plans to continue to discuss these issues with the non-participating hospitals in order to better meet their needs and increase overall participation.
- California HealthCare Foundation (CHCF), “California Hospital Assessment and Reporting Taskforce (CHART)” (March 2007) available at: www.chcf.org/topics/hospitals/index.cfm?itemID=111065 (February 19, 2008).
- See https://chart.ucsf.edu
- Dudley, R. Adams, Diane Rittenhouse and Richard Bae, Creating a Statewide Hospital Quality Reporting System, California HealthCare Foundation, The Quality Initiative (February 2002).
- The formation of CHART in 2004 reflected the recognition by program designers that the total body of quality measures then available needed to be expanded, and that data reliability needed to be improved for the measures that did exist. CHART’s activities since 2004 have been focused on both developing useful new measures and improving data collection and reporting for existing measures, using a multi-stakeholder approach including strong hospital engagement.
- The Hospital Survey of the Consumer Assessment of Healthcare Providers and Systems (CAHPS) is administered by the U.S. Agency for Healthcare Research and Quality (AHRQ).
- Consistent with Joint Commission standards on minimum sample size, CalHospitalCompare does not report performance estimates and ratings for cases where hospitals have data for fewer than 30 patients.
- Hibbard, Judith H. et al., “Increasing the Impact of Health Plan Report Cards By Addressing Consumers’ Concerns,” Health Affairs, Vol. 19, No. 5 (2000).
- The benchmarks were specific to each condition or domain, but for most measures except patient experience, the top 10% of national performance was used as the high benchmark, the national average was used as the middle benchmark, and performance 10% below the national average was used as the low benchmark. For patient experience measures, national benchmarks do not yet exist; the CalHospitalCompare hospitals can only be compared to one another, using the 10th, 50th and 90th percentiles as the three benchmarks.
- Gerteis, Margaret, et al., “Testing Consumers’ Comprehension of Quality Measures Using Alternative Reporting Formats,” Health Care Financing Review, Vol. 28, No. 3 (Spring 2007).
- In addition, physicians may have initially reacted negatively to individual ratings; therefore, program managers chose to begin reporting ratings at the physician network level, and then the medical group level the following year, progressively shifting to a more granular level as physicians become more comfortable with the ratings and methodologies improved.
- Each medical group or practice site is graded on a scale of one to four stars, using three benchmarks or cut-points. The three benchmarks for the process measures are the national 50th percentile, the national 90th percentile, and the MHQP Massachusetts statewide rate. The majority of the patient experience measures use three cut-points at the 15th, 50th and 85th percentiles among all physician groups surveyed.
- See Hibbard (March/April 2003) and Marshall (2000).