
Brenda C. Spillman and Eva H. Allen
Urban Institute
Printer Friendly Version in PDF Format (76 PDF pages)
ABSTRACT
Medicaid health homes, authorized by Section 1945 of the Social Security Act, allows states to coordinate care and integrate services for Medicaid beneficiaries with multiple chronic physical, mental, or behavioral health conditions. The health home model is similar to the patient-centered medical home model, but targets high cost, high need populations and focuses on providing integrated physical, mental, and behavioral health care services, including links to nonclinical services and supports in the community. The Urban Institute, under the contract from ASPE, has conducted a five-year evaluation of the Medicaid health home option to assess the program implementation and its impacts on utilization and costs. The expectation is that improved access to integrated and coordinated primary and behavioral health care will reduce unnecessary use of costly facility-based care and result in lower spending. This fifth-year and final report presents findings from quantitative analysis of health home outcomes with respect to use of emergency room, inpatient hospital, and other facility-based care and Medicaid spending. The report also includes a brief description of the health home model and background on state programs included in the evaluation, as well as a summary of qualitative findings from previous reports.
DISCLAIMER: The opinions and views expressed in this report are those of the authors. They do not necessarily reflect the views of the Department of Health and Human Services, the contractor or any other funding organization.
TABLE OF CONTENTS
I. INTRODUCTION
II. OVERVIEW OF THE HEALTH HOME MODEL
III. OVERVIEW OF HEALTH HOME PROGRAMS EVALUATED
IV. METHODS
- Qualitative Activities
- Quantitative Activities
V. SUMMARY OF QUALITATIVE FINDINGS
- Baseline Characteristics of Health Home Enrollees
- Descriptive Utilization and Spending Estimates in the Base Year
- Difference-in-Differences Model Results
- Summary and Discussion of Model Results and Limitations
VII. CONCLUSION
APPENDICES
- APPENDIX A: Profile of Health Home Programs in the Evaluation
- APPENDIX B: Technical Appendix
LIST OF BOXES
- BOX B1. Matching Covariates
LIST OF FIGURES
- FIGURE 1: Most Prevalent Conditions, Primary Care Health Homes
- FIGURE 2: Most Prevalent Conditions, CMHC Health Homes
- FIGURE 3: Medicaid-only Primary Care Enrollees
- FIGURE 4: Medicaid-only CMHC Enrollees
- FIGURE 5: Dual Primary Care Enrollees
- FIGURE 6: Dual CMHC Enrollees
- FIGURE B1: Percent of Health Home Enrollees Age 65+
- FIGURE B2: Percent of Health Home Enrollees with Hispanic, Other, Unknown Race Ethnicity
- FIGURE B3: Percent of Health Home Enrollees With a SMI/SED Diagnosis in Base Year
LIST OF TABLES
- TABLE 1: Summary of Qualitative Findings from Evaluation States
- TABLE 2: Baseline Personal and Health Characteristics of Missouri Primary Care and CMHC Health Home Enrollees
- TABLE 3: Means of Per Person Per Month Baseline Utilization and Spending for Medicaid-only Health Home Enrollees and Comparisons, 2011
- TABLE 4: Means of Per Person Per Month Baseline Utilization and Spending for Dually Eligible Health Home Enrollees and Comparisons, 2011
- TABLE 5: Difference-in-Differences Estimates for Medicaid-only Beneficiaries Enrolled in Primary Care and CMHC Health Homes
- TABLE 6: Difference-in-Differences Estimates for Duals Enrolled in Primary Care and CMHC Health Homes
- TABLE B1: Summary of CEM Matching Results for Reported Analyses
- TABLE B2: Means of Per Person Per Month Baseline Utilization and Spending Dually Eligible Comparisons and Health Home Enrollees
- TABLE B3: Estimated Utilization and Spending for Medicaid Only Primary Care Health Home Enrollees and Health Home Effects Over the Evaluation Period
- TABLE B4: Estimated Utilization and Spending for Medicaid Only Primary Care Health Home Enrollees with At Least 9 Months of Exposure and Health Home Effects Over the Evaluation Period
- TABLE B5: Estimated Utilization and Spending for Medicaid Only CMHC Health Home Enrollees and Health Home Effects Over the Evaluation Period
- TABLE B6: Estimated Utilization and Spending for Medicaid Only CMHC Health Home Enrollees with At Least 9 Months of Exposure and Health Home Effects Over the Evaluation Period
- TABLE B7: Estimated Utilization and Spending for Dually Eligible Primary Care Health Home Enrollees and Health Home Effects Over the Evaluation Period
- TABLE B8: Estimated Utilization and Spending for Dually Eligible Primary Care Health Home Enrollees with At Least 9 Months of Exposure and Health Home Effects Over the Evaluation Period
- TABLE B9: Estimated Utilization and Spending for Dually Eligible CMHC Health Home Enrollees and Health Home Effects Over the Evaluation Period
- TABLE B10: Estimated Utilization and Spending for Dually Eligible CMHC Health Home Enrollees with At Least 9 Months of Exposure and Health Home Effects Over the Evaluation Period
ACRONYMS
The following acronyms are mentioned in this report and/or appendices.
| ABD | Aged, Blind or Disabled |
|---|---|
| ACA | Affordable Care Act |
| AIDS | Acquired Immune Deficiency Syndrome |
| ARCW | AIDS Resource Center of Wisconsin |
| BMI | Body Mass Index |
| CBHC | Community Behavioral Health Center |
| CCNC | Community Care of North Carolina |
| CCT | Community Care Team |
| CEDARR | Comprehensive Evaluation, Diagnosis, Assessment, Referral, Re-evaluation |
| CEM | Coarsened Exact Matching |
| CMHC | Community Mental Health Center |
| CMHO | Community Mental Health Organization |
| CMS | HHS Centers for Medicare & Medicaid Services |
| COPD | Chronic Obstructive Pulmonary Disease |
| CVD | Cardiovascular Disease |
| CYSHCN | Children and Youth with Special Health Care Needs |
| ER | Emergency Room |
| FFS | Fee-For-Service |
| FQHC | Federally Qualified Health Center |
| HbA1c | Glycated Haemoglobin |
| HHS | U.S. Department of Health and Human Services |
| HIV | Human Immunodeficiency Virus |
| LTSS | Long-Term Services and Supports |
| PCMH | Patient-Centered Medical Home |
| PCNA | Patient Care Networks of Alabama |
| PCP | Primary Care Provider |
| PCPCH | Patient-Centered Primary Care Home |
| PMP | Primary Medical Provider |
| PMPM | Per Member Per Month |
| RHC | Rural Health Clinic |
| Rx | Medical Prescriptions |
| SED | Serious Emotional Disturbance |
| SMI | Serious Mental Illness |
| SPA | State Plan Amendment |
| SPMI | Serious and Persistent Mental Illness |
EXECUTIVE SUMMARY
Medicaid health homes, authorized by Section 1945 of the Social Security Act, allows states to coordinate care and integrate services for Medicaid beneficiaries with multiple chronic physical, mental, or behavioral health conditions. The health home model is similar to the patient-centered medical home model, but targets high-cost, high-need populations and focuses on providing integrated physical, mental, and behavioral health care services, including links to nonclinical services and supports in the community. The Urban Institute, under contract with the Office of Assistant Secretary of Planning and Evaluation in the U.S. Department of Health and Human Services, has conducted a five-year evaluation of the Medicaid health home option to assess the program implementation and its impacts on utilization and costs. The expectation is that improved access to integrated and coordinated primary and behavioral health care will reduce unnecessary use of costly facility-based care and result in lower spending. This fifth-year and final report presents findings from quantitative analysis of health home outcomes with respect to use of emergency department, inpatient hospital, and other facility-based care and Medicaid spending. The report also includes a brief description of the health home model and background on state programs included in the evaluation, as well as a summary of qualitative findings from previous reports.
Overview of the Health Home Model
States may implement a health home program through a State Plan Amendment and are eligible to receive an enhanced 90% federal match during the first eight quarters of the program for providing enrollees with comprehensive care management, care coordination, health promotion, comprehensive transitional care, patient and family support, and referral to community and social support services. A wide variety of providers may serve as health homes, including primary care practices, hospitals, care management networks, and specialized providers such as home health agencies and community mental health centers (CMHCs). To qualify for health home services Medicaid beneficiaries must have at least: (1) two or more chronic conditions; (2) one chronic condition and be at risk of developing another; or (3) one serious mental illness. States may target specific geographic areas but health home enrollment must be offered to all eligible beneficiaries, including those who are dually eligible for Medicaid and Medicare.
Overview of Health Home Programs Evaluated
The evaluation includes the first 13 health home programs approved in 11 states with effective dates between October 1, 2011, and January 1, 2013. These include two programs each in Missouri and Rhode Island, and one program each in Alabama, Idaho, Iowa, Maine, New York, North Carolina, Ohio, Oregon, and Wisconsin. Except for Idaho and Oregon, all remaining states still operate their health home programs as of May 2017.
Broadly, the health home models in this evaluation fell into three categories: (1) medical home-like programs in Idaho, Iowa, Missouri (primary care health homes), and Oregon designated primary care practices as health home providers; (2) specialty provider-based programs in Missouri (CMHC health homes), Ohio, both Rhode Island programs, and Wisconsin delivered health home services through specialty providers; and (3) care management networks in Alabama, Maine, New York, and North Carolina relied on networks of providers or care management entities that partnered with primary care providers to coordinate care for health home enrollees. With few exceptions, most health home programs in the evaluation offered services statewide and included beneficiaries with a broad range of chronic physical, mental, or behavioral conditions. Per member per month (PMPM) payment was by far the most common method of reimbursing providers for health home services tendered.
Methods
The goals of the long-term evaluation of the Medicaid health home model are to assess: (1) what models, providers, and processes states are choosing for health homes; (2) the extent to which health homes increased coordination across clinical and nonclinical domains of care; and (3) whether health home services are associated with improved quality of care and utilization and spending outcomes. We used a mixed-methods approach; the first four years of evaluation activities focused on qualitative and quantitative data collection, and the final year focused on quantitative analyses. The qualitative component included document review, site visits, and annual telephone interviews with key stakeholders in each state to learn about the design of programs and track progress in implementing and operating the health home models.
The quantitative evaluation, which is the focus of this report, used administrative data to assess whether improvements have occurred in the rate of hospital admissions, emergency department visits, skilled nursing facility admissions, and Medicaid spending for health home enrollees. Using a difference-in-differences approach, we examined utilization and cost outcomes for health home participants and comparison groups in the year prior to the program effective date and over the intervention period, defined as the first eight quarters of the program during which each state received an enhanced federal match. Because of large lags in data availability and other data issues, we had to limit the analysis to Missouri's two health home programs, which represent the medical home-like and specialty provider-based health homes.
Summary of Qualitative Findings
Within the basic requirements for the health home option, states have considerable flexibility in developing their health home initiatives, including which providers serve as health homes, the types of chronic conditions targeted, and how health home services are defined and reimbursed. This resulted in considerable variation in program design. All states in the evaluation have experienced challenges in implementing and fine-tuning the programs. Important factors for successful health home implementation included state policies and program design choices (e.g., provider certification requirements), technical assistance and other implementation support to providers, availability of community resources (e.g., health information exchange system), and the facility of participating providers in adopting the new model of care. Despite challenging implementation, stakeholders across the 11 states believed that the health home approach to care resulted in better quality of care for enrollees, including improvements in care coordination and management, greater integration of behavioral and primary care, increased rates of transitional care, including follow-up after emergency department visits or hospitalizations, and improved access to social services and community-based supports.
Quantitative Findings
The quantitative analyses focused on Medicaid-only beneficiaries and duals enrolled in Missouri's two health home programs--primary care health homes and CMHC health homes--and comparison groups, examining utilization and spending in the year prior to the program effective date (2011) and over the intervention period (2012-2013).
We found that at baseline:
-
Among beneficiaries eligible only for Medicaid, primary care health home enrollees had total spending 7% higher than comparisons, while CMHC enrollees had total spending 70% higher than comparisons, primarily because of higher spending for Medicaid community-based long-term services and supports (LTSS), drugs, and other services included in the broad category of nonfacility care.
-
Dually eligible primary care enrollees had slightly lower Medicaid community-based LTSS spending relative to comparisons and lower Medicaid, Medicare and combined program spending.
-
Dually eligible CMHC health home enrollees had somewhat higher utilization and spending for community-based LTSS than comparisons, as well as higher combined Medicaid and Medicare spending owing to higher spending for nonfacility services; combined spending for targeted facility-based services was somewhat lower.
Predictions from difference-in-differences analyses show estimated marginal changes in per person per month use and spending for health home enrollees over the first two years of each program, relative to their outcomes if they have not been enrolled in the program. Our results indicate that Medicaid spending effects were stronger for CMHC enrollees, for dually eligible enrollees in each program, and for those with longer and more stable program exposure. Key findings include:
-
No significant savings were indicated for Medicaid-only enrollees in the primary care health home, but overall program spending did not increase significantly, suggesting at least partial offset of the PMPM program cost.
-
Medicaid program spending increased significantly for Medicaid-only CMHC enrollees as a group, but for the subset of enrollees with greater program exposure, both total spending and spending on services other than facility-based care was nearly $200 less.
-
Medicaid spending for targeted facility-based services was unchanged for Medicaid-only primary care enrollees and increased significantly for Medicaid-only CMHC enrollees, but fell significantly for dually eligible enrollees in both programs.
-
For dually eligible enrollees in each program, total Medicaid spending was significantly lower. The decline for primary care enrollees was about $100, compared with more than $250 for all CMHC enrollees, and nearly $400 for enrollees with greater exposure.
Although Medicare spending increased for duals in both programs, the reductions in Medicaid spending were sufficient to offset the higher Medicare spending for primary care enrollees and more than offset Medicare increases for CMHC enrollees. As a result, there was no significant change in total combined Medicaid and Medicare spending for primary care enrollees and all CMHC enrollees, but combined spending was about $150 lower for CMHC enrollees with greater health home exposure.
Conclusion
Our quantitative analysis did not generally find that health home enrollment was associated with reductions in facility-based spending, but found no significant increases in overall Medicaid spending. The exception was higher overall Medicaid spending for all Medicaid-only enrollees in the CMHC health home. But when we limited the analysis to the subset of these CHMC enrollees who had longer and more stable health home exposure, we found large significant reductions in overall Medicaid spending, suggesting that the ability of health homes to gain and maintain enrollee engagement is a key factor in health home performance. By examining spending net of the PMPM cost of the program, we also found evidence that changes in utilization and spending at least partially offset this cost. In some cases, such as CMHC enrollees with greater program exposure, reduced spending for services more than offset the program cost. Overall results thus show some successes and additional indications of movement toward meeting health home expectations in Missouri over the two-year evaluation period.
Given the scope of the evaluation, we were not able to look beneath broad utilization and spending patterns to better understand how the health home model changed the mix of services delivered to health home enrollees. Quantitative research in this area and, more importantly, examination of programs in additional states as data issues are resolved would strengthen the evidence base for states and policymakers with respect to performance of the model for different populations, provider types, and program designs.
I. INTRODUCTION
The Medicaid health home State Plan option, authorized by Section 1945 of the Social Security Act, allows states to develop and implement programs to coordinate care and integrate services for Medicaid beneficiaries with complex chronic physical, mental, or behavioral health needs.1 The health home model is similar in some ways to the patient-centered medical home (PCMH), but it is distinct in its focus on high-cost, high-need populations, comprehensive management and coordination of integrated physical, mental, and behavioral health care services, and facilitating access to nonclinical services and supports in the community. An important feature is the wide variety of providers who may become health homes, including primary care practices, hospitals, care management networks, and specialized providers such as home health agencies and community mental health centers (CMHCs). As of November 2016, 20 states and a District of Columbia have implemented a total of 29 health home programs.2
The Urban Institute has conducted the long-term evaluation of health home implementation and outcomes, under contract to the U.S. Department of Health and Human Services (HHS), Office of the Assistant Secretary of Planning and Evaluation over the last five years. The evaluation includes the first 13 health home programs approved in 11 states with start dates between October 1, 2011, and January 1, 2013. These include two programs each in Missouri and Rhode Island, and one program each in Alabama, Idaho, Iowa, Maine, New York, North Carolina, Ohio, Oregon, and Wisconsin. Brief profiles of the 13 health home programs are available in Appendix A. The evaluation findings will inform a 2017 Report to Congress on health home implementation and outcomes with respect to hospital, emergency department, and nursing facility use, and Medicaid spending.
This fifth-year and final report presents a brief summary of qualitative findings from the first four years of the evaluation and findings from quantitative analysis of key utilization and spending outcomes for health home enrollees and a comparison group of similar nonparticipating beneficiaries in the two health home programs implemented in Missouri. Outcomes examined are utilization and spending during a two-year intervention period, defined as the first eight quarters of the program during which each state received an enhanced 90% federal match for state Medicaid spending on health home services. The previous four qualitative evaluation reports focused on structure, processes, and implementation progress and experience with health homes in all 11 states included in the evaluation.3
II. OVERVIEW OF THE HEALTH HOME MODEL
The health home model is designed to enhance coordination and continuity of care for Medicaid beneficiaries with complex chronic conditions across various care types and settings and to provide a "cost-effective, longitudinal 'home' to facilitate access to an inter-disciplinary array of medical care, behavioral health care, and community-based social services and supports for both children and adults with chronic conditions."4 To implement health homes, states must obtain HHS Centers for Medicare & Medicaid Services (CMS) approval for a State Plan Amendment (SPA) to add health home services for the individuals they intend to target. Specific required health home services, for which states receive the enhanced federal match during the first eight quarters the SPA is in effect, are: (1) comprehensive care management; (2) care coordination and health promotion; (3) comprehensive transitional care, including appropriate follow-up; (4) patient and family support; (5) referral to community and social support services; and (6) use of health information technology to link services, as feasible and appropriate.5 States developing health home programs must consult with the HHS Substance Abuse and Mental Health Services Administration, and demonstrate that hospitals participating in the Medicaid program establish referral procedures for directing potentially eligible patients to health homes. The latter requirement reflects the central goal of reducing hospital admissions, emergency department visits, and admissions to nursing facilities.
Within the basic requirements, states have considerable latitude in designing their programs. For example, as noted earlier, a wide range of organizations may serve as health homes, including primary care clinics, hospitals, CMHCs and others, provided they meet standards for participation their state has developed. States also determine the composition of the health home team and the roles and responsibilities of each team member. The law allows states to develop alternative payment models other than capitated per member per month (PMPM) payments and to use tiered payments for enrollees according to their health status and for providers based on their qualifications.
To qualify for health home services Medicaid beneficiaries must have at least: (1) two or more chronic conditions; (2) one chronic condition and be at risk of developing another; or (3) one serious and persistent mental health condition. Qualifying conditions specified in the law are serious and persistent mental illness, substance use disorder, asthma, diabetes, heart disease, and obesity. States may select one or more conditions from this list, or, with CMS approval, other conditions, such as HIV/AIDS. States may choose to target individuals with a larger number of conditions or greater severity than the minimum criteria established by the law, and states define the "at-risk" criteria for themselves.
States may also focus on particular geographic areas and offer services to health home enrollees that are different in scope, duration, or quantity than those offered to other Medicaid beneficiaries without having to obtain a CMS waiver of statewideness or comparability requirements. Health home enrollment must be offered to all persons meeting the state's eligibility criteria who are categorically needy regardless of age, including beneficiaries who are dually eligible for Medicare and Medicaid and those receiving services under a Section 1915(c) home and community-based services waiver. States also may choose to offer health home enrollment to the medically needy and participants in Section 1115 Demonstrations.
III. OVERVIEW OF HEALTH HOME PROGRAMS EVALUATED
The 13 health home programs we evaluated are two programs each in Missouri and Rhode Island and one program each in Alabama, Idaho, Iowa, Maine, New York, North Carolina, Ohio, Oregon, and Wisconsin. Except for Oregon, which withdrew its health home SPA effective July 1, 2014, and Idaho, which withdrew its SPA on February 1, 2016, all states in this evaluation continue to operate their health home programs. Capsule descriptions of each health home program included in this evaluation are in Appendix A.
All states relied on pre-existing delivery structure and care coordination programs when developing their health home initiatives, often aligning their health home programs with other health system reforms. The programs reflect the substantial flexibility states have in designing their health home initiatives, with variation in the designated provider types, the chronic conditions targeted, and how health home services are defined and reimbursed. And although core elements of the model are the same across the 11 states, each state operationalized the elements to meet the specific needs of its health home population or fit into larger delivery system transformation efforts.
The health home models implemented in the evaluation states fall into three general categories. Idaho, Iowa, Missouri (primary care health homes), and Oregon implemented medical home-like programs, which are variations on or extensions of the PCMH. Health home providers in these states include primary care providers (PCPs), federally qualified health centers (FQHCs), rural health clinics (RHCs), and CMHCs. Specialty provider-based programs in Missouri (CMHC health homes), Ohio, both Rhode Island programs, and Wisconsin deliver health home services through specialized entities such as CMHCs that traditionally serve specific populations but integrate specialized care with primary care. Health home programs in Alabama, Maine, New York, and North Carolina use care management networks, which are networks of care management entities, direct physical and mental/behavioral health care providers, social services agencies, and other community organizations. In Alabama, Maine, and North Carolina, care management entities partner with PCPs to deliver health home services. In New York, health home lead agencies assembled a network of providers to form "virtual health homes" capable of providing, coordinating, and managing the full array of services and community supports needed by enrollees.
Most programs in the evaluation included beneficiaries with a broad range of chronic physical, mental, or behavioral conditions, but a few focus on specific populations. Missouri created separate health home programs for beneficiaries with chronic physical conditions and those with serious mental health conditions. Three of the 11 states focused on specific populations. Rhode Island's two programs focus on children and youth with special health care needs (CYSHCN) and adults with serious mental illness (SMI), respectively. Ohio focuses its program on adults with SMI and children with serious emotional disturbance (SED), and Wisconsin's program includes only beneficiaries with HIV/AIDS. The number of health home enrollees varies greatly across states, depending on several factors such as the number and type of qualifying conditions targeted, the size of the state Medicaid program, the number and type of participating providers, geographic coverage, and enrollment procedures. Nine of the 11 states in our evaluation offered health home services statewide from inception or, in the case of New York, quickly expanded to statewide coverage. Alabama started in one 21-county service area in July 2012 and did not expand its program statewide until April 2015. Ohio started in five counties, but initial plans to expand statewide have been postponed. Although technically statewide, Wisconsin's health home coverage area includes only the locations covered by the single designated HIV/AIDS health home provider.
Nearly all states in the evaluation chose some form of PMPM payment for health home services. The exception is Rhode Island's health home for CYSHCN, which uses a mix of fee-for-service (FFS) payments and established rates per 15-minute increment of time. In some states (Alabama, Idaho, Missouri, and Wisconsin), the health home PMPM is a fixed amount. In others, the rate varies depending on enrollee health status or case-mix (Iowa, New York, and North Carolina). Oregon developed tiered payment based on the provider qualification level. The PMPM rate in Ohio is based on staffing costs, indirect costs related to health home service provision, and projected caseloads. Except for New York, the states with care management networks (Alabama, Maine, and North Carolina), have separate rates for the care management provider and the PCP. In addition to the PMPM rate, Wisconsin pays its health home provider a flat fee to cover the initial assessment and development of a care plan for each new enrollee, which may be billed annually if reassessment is needed. For its health home for children with special-needs, Rhode Island also pays fixed rates for initial assessment and care plan and annual reassessments.
IV. METHODS
The evaluation of Medicaid health home programs in selected states began on October 1, 2011. The aims are to assess: (1) what models, providers, and processes states are choosing for health homes; (2) the extent to which state health home designs result in increased monitoring and coordination across clinical and nonclinical domains of care; and (3) whether health home services are associated with improved quality of care and outcomes, specifically, reduced emergency department visits, inpatient admissions, and nursing facility care, and lower costs. The expectation is that improved access to integrated and coordinated primary and behavioral health care, especially transitional care, and links to community-based services and supports will reduce unnecessary use of facility-based care and result in lower costs.
We used a mixed-methods design including:
-
Collection and analysis of qualitative data to understand the context and characteristics of health home-eligible populations, providers, and structures and processes of care. These activities focused on the initial year after the effective date of each SPA included in the evaluation.
-
Qualitative analyses to understand key aspects of program design and implementation that may affect service use outcomes and the cost of care. Interim outcomes assessed include progress in developing and putting in place structures and processes to improve quality, coordination, and management of care; transitional care; integration of physical and behavioral care; and access to community services and supports.
-
Quantitative analysis of administrative data to assess whether reductions have occurred in the use of facility-based care--emergency department, inpatient hospital, and nursing facility use--and Medicaid program spending.
The intervention period we defined for each program is the initial eight quarters during which states received an enhanced federal match for health home services, beginning with the SPA effective date. For quantitative analyses, we also initially defined a baseline period for comparison as the eight quarters immediately preceding the program effective date, later adjusted to the four quarters prior to the effective date. The first four years of evaluation activities focused on qualitative and quantitative data collection, and the final year focused on quantitative analyses and preparation of findings for use in the HHS Secretary's 2017 Report to Congress on the long-term evaluation of the health home program.
Qualitative Activities
To guide our qualitative data collection and analysis, we developed a set of research questions for implementation, operation, and outcomes (Table 1). Questions relating to implementation focused on structure and processes in each state such as choices of target populations and providers, the design of programs, the rationale for the design, and fundamental design elements. Questions relating to outcomes focused on successes and challenges in implementing and operating the model and the relative performance of different providers and models for different target populations. These research questions guided our site visits and development of tailored interview protocols for follow-up interviews to monitor and assess program progress over the intervention period.
Qualitative activities began with review of background materials and each SPA, and development of profiles summarizing the design and implementation context of each health home program included in the evaluation.6 We conducted site visits during the initial year of each program and three annual follow-up telephone interviews with key informants, including state program officials, providers, and provider associations. In the final round of follow-up calls, conducted after the end of the intervention period for each state, we asked about any updates or modifications to the health home program, the informant's overall assessment of program performance over the intervention period, and the outlook for the program sustainability after the 90% federal match ended. We also asked states to provide any evaluation reports or findings produced internally or by their contractors.
Quantitative Activities
This section provides an overview of our quantitative evaluation design and the steps required to carry it out over the course of the project. We developed a provisional data analysis plan early on and refined it as needed based on what we learned about the design of programs through our qualitative work. The quantitative evaluation uses a difference-in-differences design in which we examine utilization and costs outcomes for health home participants and a comparison group in the year prior to the program effective date and over the eight-quarter intervention period. Pre/post analysis of health home enrollees can identify changes in utilization and spending but not whether those changes differ from those for other similar Medicaid beneficiaries. In contrast, the difference-in-differences approach takes into account changes over time that are common to health home enrollees and a comparison group, so that marginal changes associated with health home enrollment can be measured.
The original intent was to conduct analyses for programs in each of the 11 evaluation states. Owing to lags in data availability in most of the states and reporting discontinuities resulting from a changeover in the CMS Medicaid state data reporting system, in this report, we present analyses for only Missouri's two health home programs, which began in January 2012, and provide examples of medical home-like and specialty provider-based health homes.
We provide both descriptive tabulations of utilization and costs for health home enrollees and comparisons at baseline, and results from difference-in-differences analyses for each program.
Data and Analysis File Development
It is challenging to identify suitable comparisons for a statewide program. To do so, we selected potential comparisons from 100% Missouri Medicaid claims and beneficiary files for the 2011 base year and for 2012 and 2013, the two years covering the eight-quarter evaluation period. The files were obtained under a data use agreement with CMS. We also obtained linked Medicare claims and beneficiary data for people who were dually eligible for Medicaid and Medicare (duals). Under a separate agreement with the state, we obtained health home participant identifiers, enrollment and disenrollment dates, and health home provider identifiers, as well as algorithms the state used to identify eligible participants. Missouri auto-enrolled eligible beneficiaries, based on a set of ICD-9 diagnosis codes and their relationship with a health home provider, but allowed beneficiaries to "opt-out" of enrollment. The state also provided information on whether beneficiaries opted out and other reasons for nonparticipation. We used the state-provided data to identify comparison groups of similar beneficiaries in the claims and beneficiary files from CMS.
To identify provisional comparison groups for Missouri, we first limited the analysis samples to cohorts of health home enrollees and other Medicaid beneficiaries in the state who met various requirements in the 2011 base year and survived until after the January 2012 health home start date. We applied basic requirements to both health home enrollees and potential comparisons to reduce potential biases in our quasi-experimental design. Among these requirements were a minimum level of full-benefit FFS Medicaid eligibility. We retained only cohort members who had at least one-quarter of full-benefit coverage in the base year (2011), 2012, and 2013, or who met the coverage criterion in the base year but died in 2012 or 2013. In practice, this generated very stable samples with 75%-85% of health home enrollees and potential comparison group members having 24 months of full-benefit coverage over the evaluation period. We also applied other state-specific rules to define the base year cohort, specifically Missouri's exclusion of beneficiaries enrolled in the Program of All-inclusive Care for the Elderly and those receiving hospice or nursing home care in the base year. We further excluded potential comparisons who had seen a health home provider in the base year and health home eligibles who were assigned to a health home provider but opted out or never enrolled.
For the remaining cohort of comparisons and enrollees, we analyzed Medicaid service claims (and for duals, Medicare claims) in the 2011 base year to construct indicators of whether treatment had been received for each health home diagnosis in the year prior to initiation of the program, as well as a summary measure of the health home eligibility classes defined by the state. Missouri prioritized persons with SMI, and others who had two or more of the targeted chronic conditions, one condition with the risk of developing another, or diabetes alone. We also constructed indicators of dual coverage status and whether an individual died during the evaluation period. The eligibility class measure and individual health home diagnoses, dual coverage status, whether an individual died during the evaluation period, age, sex, and race/ethnicity were used in a matching procedure to select comparisons who were as similar as possible to health home enrollees along dimensions we could measure.
We constructed per person per month utilization and spending measures from claims data for the base year and two evaluation years, focusing on the key utilization targets of the health home model: use of emergency departments, inpatient hospitals, and other facilities, notably nursing facilities, hereafter referred to as targeted facility-based services. We also created measures of total per person per month Medicaid spending on three categories: all services, the targeted facility-based services, and all other services. Although our initial cohort excluded beneficiaries who used Medicaid nursing or other long-term facilities in the base year, total facility-based service spending includes spending for persons who entered such facilities after the base year. For duals, we further examined Medicare spending and total Medicaid and Medicare spending in these three categories across both programs. To examine spending for each enrollee net of the health home PMPM payment to providers, we also constructed a measure with the appropriate PMPM for each month of enrollment. The PMPM to providers was $58.57 for primary care health home enrollees and $78.74 for CMHC health home enrollees over the duration of the evaluation period.
Matching and Analysis Methods
To match our health home enrollees with appropriate comparisons, we used a Coarsened Exact Matching (CEM) methodology, a relatively new alternative to propensity score and entropy balancing methods for reducing the imbalance between treatment and control groups in quasi-experimental designs.7 CEM sorts comparisons and treatment groups into strata defined by the researcher, based on multiple characteristics of sample members. The aim of balancing the samples is to avoid or reduce bias in the estimated treatment effects, in this case effects on health care utilization and spending associated with health home enrollment. The procedure excludes both comparisons and enrollees for whom no match can be found, so there is a tradeoff between the fineness of the strata and sample size. Because our samples of comparisons and enrollees were relatively large in each program, we were able to use fairly fine strata without large loss of sample. As noted, individual characteristics were age, sex, race, died during the evaluation period, and claims-based measures of the broad qualifying health home qualifying condition classification (no health home conditions, SMI/SED, two other chronic conditions, one condition and risk of another, and diabetes alone), 11 major condition categories (e.g., cardiovascular disease [CVD], respiratory disease, developmental delay, bipolar disorder), and two risk factors (tobacco use and obesity). The total number of strata in each matching procedure ranged from about 5,000 to nearly 8,000, and the number of strata containing health home enrollees and matched comparisons ranged from about 1,300 to 1,700. As part of the balancing, the CEM software creates analytic weights that increase or reduce the importance of comparisons in each stratum, so that when weights are used, the comparison group by construction has the same distribution across individual characteristics and the same correlation structure between characteristics as health home enrollees. The CEM weights also are scaled so that the sample sizes of comparisons and enrollees retained after matching are unchanged.
We conducted separate matching and analyses for Missouri primary care and CMHC health home enrollees, who differed significantly both with respect to personal characteristics and condition profiles. Within each health home program, we created separate samples of Medicaid-only beneficiaries, defined as being eligible only for Medicaid in the base year and throughout the evaluation, and duals, defined as being dually eligible for both programs in the base year, and conducted separate matching procedures and analyses for each subsample. A small number of Medicaid beneficiaries who enrolled in Medicare in 2012 or 2013 were excluded from the analysis samples. Missouri includes a significant proportion of duals in its health home programs. Because dual coverage is available only to persons who are age 65 or older or have disabilities, the characteristics of duals differ fundamentally from those of persons who are eligible for Medicaid only. Similarly, because Medicare is the first payer for most services other than long-term care, utilization and spending patterns for duals are different than those of Medicaid-only beneficiaries. Further, because Missouri is a 209B state with eligibility criteria more stringent than those for the Supplemental Security Income program, periodic gaps in Medicaid enrollment occur frequently because of the requirement to spend-down excess income.8 The Technical Appendix provides details of the matching process and results.
As noted, in addition to producing descriptive estimates of health home enrollee characteristics and baseline and evaluation period spending, we used difference-in-differences regression models to isolate differences in outcomes over time for health home enrollees relative to comparisons. The general model can be expressed as follows, with fixed effects for health home enrollment (H) and the time period (T1 for observations occurring in 2012, the first evaluation year, and T2 for observations during 2013):
| Outcomet = β0 + β1H + β2T1 + β3T2 + β4T1*H + β5T1*H + β6T2*H + ∑ Xi + ε |
β0 provides the baseline level for comparisons, β1 is the baseline difference from comparisons for health home enrollees, β3 and β4 are the levels associated with each of the evaluation years for comparisons, and β5and β6 indicate the differential in each of the evaluation years associated with health home enrollment, relative to the level for comparisons--the difference-in-difference.
We used logit models to estimate the probability of utilization (e.g., emergency department use) and generalized linear models with a log link for continuous outcomes. The coefficients indicating the health home effect size were estimated for the full samples of comparisons and health home enrollees. To further standardize the population, utilization and spending outcome predictions were made over only the health home enrollee population in each analysis, so that estimated differences represent outcomes for health home enrollees with and without estimated health home effects. As a sensitivity to examine the effect of greater exposure to the program, we repeated the matching process and all analyses for subsets of health home enrollees enrolled for at least nine of the first 18 months of the evaluation period. The CEM matching procedures and all analyses were conducted using Stata Version 14.0 statistical software (StataCorp 2015). All models were estimated with robust standard errors, and CEM weights were used in both descriptive tabulations and models.
Limitations
As with any quasi-experimental design, there are limitations to our ability to control for all factors that may affect results. Notably, as was true for all the states we studied, Missouri had existing delivery system reforms underway prior to and during the evaluation period. This prior activity is documented in an initial profile of the state produced early in the evaluation project.9 While we were able to control for some situations, we had no way to observe and control for all potential confounders. We also did not include controls for specific health home providers, but rather focused on the overall effect of the model on state utilization and spending patterns. Throughout the qualitative data collection, respondents in all states repeatedly told us that there were significant differences in the pace and success of implementation across health home providers. More fundamentally, informants stressed that eight quarters was a short time over which to realize significant improvements in care and outcomes, given that implementation of a new program and a new way of delivering services was an ongoing learning process.
V. SUMMARY OF QUALITATIVE FINDINGS
Over the four years of qualitative data collection, we focused on the implementation of the Medicaid health home model in the first 11 states, the approaches states used to design programs to meet the needs of target populations, and progress in developing processes and tools to support the model, including providers' experience with adopting the new approach to care. The Medicaid health home option aims to improve outcomes and reduce the cost of caring for Medicaid beneficiaries with serious chronic illness who require care across multiple clinical and nonclinical domains. In addition to their chronic physical or mental health conditions, many of these beneficiaries face a variety of socio-economic challenges. Factors such as lack of or unstable housing, inadequate nutrition, lack of reliable transportation, or substance abuse can have negative consequences for both their ability to access care and their health. The health home model's whole-person approach--encompassing comprehensive care management and coordination, integration of physical and mental/behavioral care, and links to nonclinical supports--thus has the potential to improve the overall health and quality of life for some of the most vulnerable Medicaid beneficiaries.
As documented in our previous reports, whether the potential is realized depends to a great extent on providers who, in some cases, have to make large changes in the way they deliver care to meet the model's requirements. Previous experience with the medical home model or population-based care management, existing relationships with outside clinical and nonclinical providers (e.g., hospitals, social service agencies), as well as organizational resources (e.g., ability to add staff, implement or upgrade electronic medical records), were reported as important facilitators of providers' ability to effectively implement the health home model. Besides provider characteristics, a variety of other factors may have been key to a successful implementation of the model. At the state and policy level, these factors include the extent of state-specific health home requirements (e.g., additional certifications, infrastructure development) and flexibility and responsiveness of state policies (e.g., ability of state agencies to address implementation challenges quickly and modify the model as needed), support available to providers to implement the program (e.g., provider guidelines, technical assistance, funding for practice transformation), and presence of other health system initiatives or reforms that may place added burden on providers (e.g., Medicaid expansion, PCMH demonstrations). At the community level, availability of community resources, such as adequate supply of specialty providers, housing vouchers, and transportation options, and infrastructure to exchange real-time patient data, played a role in how well providers could deliver all required health home services.
In our qualitative interviews, we included a variety of health home sites ranging from sole provider rural primary care practices to large urban clinics to capture variable experience with the new responsibilities inherent in the health home model and different patient populations. We found that even though program designs, populations targeted, and providers selected varied across the states, a common theme was that this new model of health care for Medicaid beneficiaries with complex physical, mental, and social conditions was not simple to operationalize and implement. At the time of our last qualitative interviews (Spring 2015) the health home program had been in place for four years in some states, yet many states and providers were still working out kinks in order to meet some of the model's requirements and goals, which may have affected the program outcomes and patient experience. In Table 1, we present a summary of findings drawn from the qualitative data collection to address the research questions guiding this evaluation. Additional details and discussion of each area of focus are available in the earlier reports identified in the right column.10
| TABLE 1. Summary of Qualitative Findings from Evaluation States | ||
|---|---|---|
| Research Question | Summary of Findings | Full Findings |
| Enhanced Federal Match | ||
| How are the states using the federal match? | In many states in the evaluation, the availability of the enhanced federal Medicaid match rate was cited as an important part of the motivation for implementing health homes. However, several states were already engaged in delivery system transformation and indicated that they would have pursued this model of care regardless of the match. How states used the enhanced federal match varied. In Oregon, for example, the enhanced match was used for enhanced PMPM payments to providers for health home services. North Carolina, on the other hand, used the enhanced federal match for general Medicaid program support and made no health home-related changes to provider payments. Most states indicated that they were planning to continue the health home programs even after the enhanced federal match ended. As of February 2017, only Idaho and Oregon had terminated their health home programs. | Second Annual Report Fourth Annual Report |
| Targeting Beneficiaries with Chronic Conditions | ||
| Has care coordination improved for individuals? | Most health homes reported improvements in care coordination and management, but offered only anecdotal evidence to support this observation. | Fourth Annual Report |
| Has chronic disease management improved? | The use of multidisciplinary care teams was broadly recognized as the most important change to emerge from health homes and an effective way to accomplish a whole-person approach and improve the management and coordination of care for members. Care team meetings, monthly calls, case conferencing, care plans, and referral tracking were considered helpful tools for care teams. The PMPM payment fostered care coordination by allowing coordinators to engage in activities essential to participants' care that are not billable in a FFS structure, such as case conferencing. | Third Annual Report Fourth Annual Report |
| Has chronic disease management improved? | Informants frequently cited data-sharing issues such as difficulty accessing, sending and receiving patient information as a significant challenge to effective care management and coordination. Transitional care after hospitalizations was a specific instance where the lack of timely electronic notifications of admissions or ER visits was a lingering issue, although informants generally reported that things have improved over the intervention period. Both New York and Iowa were working on enhancements to their notification systems. Informants reported that placing liaisons in hospitals and adding a social worker and pharmacist to the transition team were effective in improving transitional care. Timely notifications were a particularly thorny problem for enrollees who were dual eligibles, for whom Medicare was the first payer. | Third Annual Report Fourth Annual Report |
| Have patient experience and clinical outcomes improved? | Many providers we spoke with have collected and tracked their own data and reported positive trends in preventive screenings rates, immunizations, HbA1c levels, blood pressure, cholesterol readings, medication adherence, and other clinical measures. Some providers reported better outcomes for members continuously enrolled over a longer period of time as opposed to those exposed to the program short-term or intermittently. | Fourth Annual Report |
| Are beneficiaries and/or caregivers able to participate more effectively in decision-making concerning care? Is care more beneficiary-centered? Are beneficiaries better able to self-manage their conditions? | The importance placed on patient education and requirements for a patient-driven care plan encouraged providers to adopt new strategies, such as motivational interviewing, increased patient education, and an emphasis on patient-directed goal setting and shared decision-making. In general, providers and state officials felt that efforts to better inform and involve patients in their care have increased some enrollees' ability to better manage their conditions and advocate for themselves. Greater face-to-face and telephone contact between the care team or care coordinator and the enrollee seemed to promote engagement. In a few states, peer support specialists were used to support health home enrollees in disease self-management and lifestyle changes. | Third Annual Report Fourth Annual Report |
| Emphasis on Integration of Behavioral Health and Primary Care | ||
| Has the focus on better integrating care for selected populations resulted in cost savings? | Most states in the evaluation have not been able to conduct self-evaluation studies, most often because of insufficient infrastructure when the program began for collecting and analyzing data from providers. Only Iowa, Missouri, and Ohio conducted evaluations covering part of their early experience and published results, although a few other states were finalizing their reports or in the process of data analysis when we last spoke with them. For the most part, early results appear to indicate that the health home program was improving care for patients and, in some cases, having desired impacts on utilization and costs. For example, Missouri estimated that ER and inpatient hospital cost savings for the state Medicaid program from the first year of the health home initiative were more than $5.7 million for the primary care focused program and $2.9 million for the CMHC health homes.1 | Fourth Annual Report |
| How are participating providers integrating behavioral health and primary care? | Integration of physical health, mental health, and nonclinical support services is crucial to the success of health homes, but continued to be a challenge even in states with more experience with integration. Mental/behavioral health and PCPs in most of the states in this evaluation reported that paying attention to both physical and mental health issues was a significant culture change in the approach to patient care. Approaches to integration varied, largely based on providers' capacity and previous experience. Some health homes screened for either physical or behavioral/mental health conditions, referred patients to appropriate services in the community, and followed up on access and treatment. Others employed part-time or full-time primary care or behavioral health consultants, and others co-located primary care and behavioral health services in one setting. | Third Annual Report Fourth Annual Report |
| Requirement to Provide Linkages to Community-Based Supports | ||
| Have health homes improved access to community-based supports? | Most providers in our evaluation states reported significant growth in their ability to connect patients to nonclinical social services and supports. The exception were specialized types of providers, such as CMHCs, home health agencies, or FQHCs, which have traditionally provided or linked patients to these types of services and therefore saw limited to no impact of the health home program in this area. Generally, informants reported that the proportion of heath home enrollees who had disabilities requiring LTSS was small and that providers were often making referrals to these services prior to heath homes. The lack of stable housing and transportation were common problems for many health home enrollees, and often were challenging for providers to meet. Across states, many informants reported insufficient supply of affordable housing and rent supports. | Fourth Annual Report |
| Broadening of Types of Providers Offering Benefits | ||
| Which types of organizations are better suited to becoming health homes? | In states with medical home-like health home programs, FQHCs were found to be particularly successful in implementing the health home model due to their organizational structure and previously established connections with social service providers. Specialty-based health home providers also had benefited from prior experience with care coordination and linking patients to community support services, but some struggled with integration of primary and behavioral/mental health services, as well as transitional care. Providers using the care management network model to coordinate services generally performed well as health homes, but the degree of success was largely dependent on each health home's ability to build trust and develop relationships with both clinical and nonclinical provider organizations in the community. | Fourth Annual Report |
| Sustainability and Scalability | ||
| How could pre-existing medical home models be modified to address individuals with multiple chronic conditions and/or SMI? | Individuals with multiple chronic conditions tend to interact with a number of health care providers across multiple settings and their health status may change frequently, resulting in numerous transitions between care settings and providers. A heightened focus on transitional care--a required health home service--is therefore critical to ensuring continuity of care and preventing unnecessary utilization, and could enhance the PCMH model. Increasing recognition that social determinants of health, such as employment, income, nutrition, housing, and family supports, are important factors in health care use, spending, and outcomes, makes the health home requirement to coordinate enrollee care beyond medical settings to include social services and community supports a particularly relevant feature to enhance the medical home model. In interviews with health home providers, previous experience with patient-centered care management was cited as one of the most promising attributes of a successful health home. The medical home model thus appears to be a solid foundation for taking on an expanded set of services required by the health home model. | Third Annual Report Fourth Annual Report |
| What payment amount is sufficient to offset costs of these higher need populations? | Overall, the majority of providers we interviewed believed the health home payment rates were adequate to cover the cost of providing required health home services, but many felt that the payments were not sufficient to support the full cost of practice transformation, such as improving or adding electronic health records or hiring care managers. Few states in the evaluation have chosen to build an additional amount into provider payment rates to support practice transformation and infrastructure development. | Third Annual Report Fourth Annual Report |
| Which elements of health home models improved quality and produced cost savings and should be replicated? | Many health home providers have participated in multiple initiatives and pilots overlapping with the health home program. In particular, every state in our evaluation has implemented Medicaid primary care PCMH models, which share some fundamental attributes with the health home model. Informants reported that the various concurrent initiatives make it difficult to isolate health home effects and even more difficult, if not impossible, to attribute any impacts to a particular feature of the health home model. | Fourth Annual Report |
| SOURCES: Second Annual Report: Spillman, BC, E Richardson, A Spencer, E Allen. 2014. Evaluation of the Medicaid Health Home Option for Beneficiaries with Chronic Conditions: Annual Report--Year Two. Department of Health and Human Services, Office of the Assistant Secretary for Planning and Evaluation. https://aspe.hhs.gov/basic-report/evaluation-medicaid-health-home-option-beneficiaries-chronic-conditions-annual-report-year-two. Third Annual Report: Spillman, BC, EH Allen, AC Spencer. 2015. Evaluation of the Medicaid Health Home Option for Beneficiaries with Chronic Conditions: Annual Report--Year Three. Department of Health and Human Services, Office of the Assistant Secretary for Planning and Evaluation. https://aspe.hhs.gov/basic-report/evaluation-medicaid-health-home-option-beneficiaries-chronic-conditions-annual-report-year-three. Fourth Annual Report: Spillman, BC, EH Allen, N Lallemand, E. Hayes. 2016. Evaluation of the Medicaid Health Home Option for Beneficiaries with Chronic Conditions: Progress and Lessons from the First States Implementing Health Home Programs, Annual Report--Year Four. Department of Health and Human Services, Office of the Assistant Secretary for Planning and Evaluation. https://aspe.hhs.gov/basic-report/evaluation-medicaid-health-home-option-beneficiaries-chronic-conditions-progress-and-lessons-first-states-implementing-health-home-programs-annual-report-year-four.
| ||
VI. QUANTITATIVE FINDINGS
Expectations for the utilization and cost effects of the health home model are that use of and spending for costly emergency, inpatient, and other facility care will be reduced by providing comprehensive care management, coordination, and monitoring to improve access to timely, appropriate care. Because the cost implications differ by the type of service, overall impacts are uncertain and may change as the program matures. Besides the direct cost of health home PMPM payments to providers for health home enrollees, increased access to appropriate services outside of facilities, such as primary and specialty care, may increase spending for underserved people, whether or not the desired reduction in facility-based care is initially realized. Similarly, increased access to Medicaid-covered community-based long-term services and supports (LTSS), may increase costs initially but save money in the longer term by avoiding or delaying expensive nursing facility care.
In this section, we first provide demographic and health profiles of Medicaid-only beneficiaries and duals enrolled in Missouri's two health home programs (primary care health homes and CMHC health homes) and descriptive analysis of utilization and spending at baseline as context for results from the difference-in-differences models.
Baseline Characteristics of Health Home Enrollees
Most enrollees in each health home program, whether Medicaid-only eligible, or duals, were in the 45-64 age range (Table 2). Among Medicaid-only eligibles, few enrollees are age 65 or older, as would be expected, since about 96% of people 65 or older in the United States meet Medicare eligibility requirements. More surprising is that among duals, only 36% of primary care health home enrollees and 7% of CMHC health home enrollees were age 65 or older; the large majority of duals in either program qualified for Medicare on the basis of disability. Children were uncommon in Missouri's health homes, figuring more prominently in the CMHC health home, where 20% of enrollees were age 20 or younger, whereas only 7% of Medicaid-only enrollees in the primary care health homes and negligible proportions of duals were in that age group. Whites were a majority of enrollees in both programs, ranging from 62% in primary care health homes to 80% in CMHC health homes. Blacks represented a larger proportion of primary care than CMHC enrollees--less than 16% of CMHC enrollees but 30% of Medicaid-only primary care enrollees and 38% dual primary care enrollees. People of other race or ethnicity were a small proportion of Missouri's health home programs. Females made up about 60% of health homes enrollees and a slightly larger proportion of primary care health enrollees. The death rate over the course of the evaluation was low, the highest being 3.5% of duals in primary care health homes.
Based on our simulated classification of enrollees by health home condition eligibility, about one third of Medicaid-only primary care enrollees had received no Medicaid-covered services in the base year that were associated with any health home diagnosis, compared with about 13% of Medicaid-only CMHC enrollees, about 9% of primary care duals, and less than 2% of CMHC duals. Interestingly, about 17% of Medicaid-only primary care enrollees and a similar proportion of duals enrolled in primary care health homes had been treated for a SMI or SED in the base year. On the other hand, among CMHC enrollees, about 28% of those who were Medicaid-only and about 6% of duals had no treatment in the base year associated with any of the SMI or SED diagnoses used by the state to identify health home eligibility.
| TABLE 2. Baseline Personal and Health Characteristics of Missouri Primary Care and CMHC Health Home Enrollees | ||||
|---|---|---|---|---|
| Medicaid Only | Dually Eligible | |||
| Primary Care Health Homes | CMHC Health Homes | Primary Care Health Homes | CMHC Health Homes | |
| Number of persons | 9,792 | 9,324 | 6,438 | 5,742 |
| Age | ||||
| Birth to 20 | 6.8 | 20.7 | 0.0 | 0.0 |
| 21 to 44 | 30.1 | 38.6 | 15.3 | 34.1 |
| 45 to 64 | 58.9 | 40.5 | 48.7 | 58.9 |
| 65 or older | 4.2 | 0.3 | 36.1 | 7.0 |
| Race/ethnicity | ||||
| White | 61.6 | 80.2 | 59.2 | 83.8 |
| Black | 30.5 | 15.7 | 37.9 | 15.7 |
| Latino/Hispanic/other | 7.9 | 4.2 | 2.9 | 0.6 |
| Female | 63.1 | 59.0 | 67.4 | 59.7 |
| Died during evaluation | 1.6 | 0.6 | 3.5 | 0.7 |
| Simulated health home condition groupa | ||||
| No health home conditions | 33.0 | 12.6 | 8.5 | 1.7 |
| SMI/SED | 17.0 | 71.5 | 17.7 | 92.0 |
| 2+ chronic conditions (not SMI/SED) | 42.6 | 15.0 | 71.4 | 6.0 |
| One condition with risk/diabetes only | 7.4 | 0.9 | 2.4 | 0.3 |
SOURCE: Weighted tabulations for health home enrollees after matching using CEM. Comparisons characteristics are identical by construction after matching. See the Technical Appendix for details of the matching procedure and information on unmatched cases.
| ||||
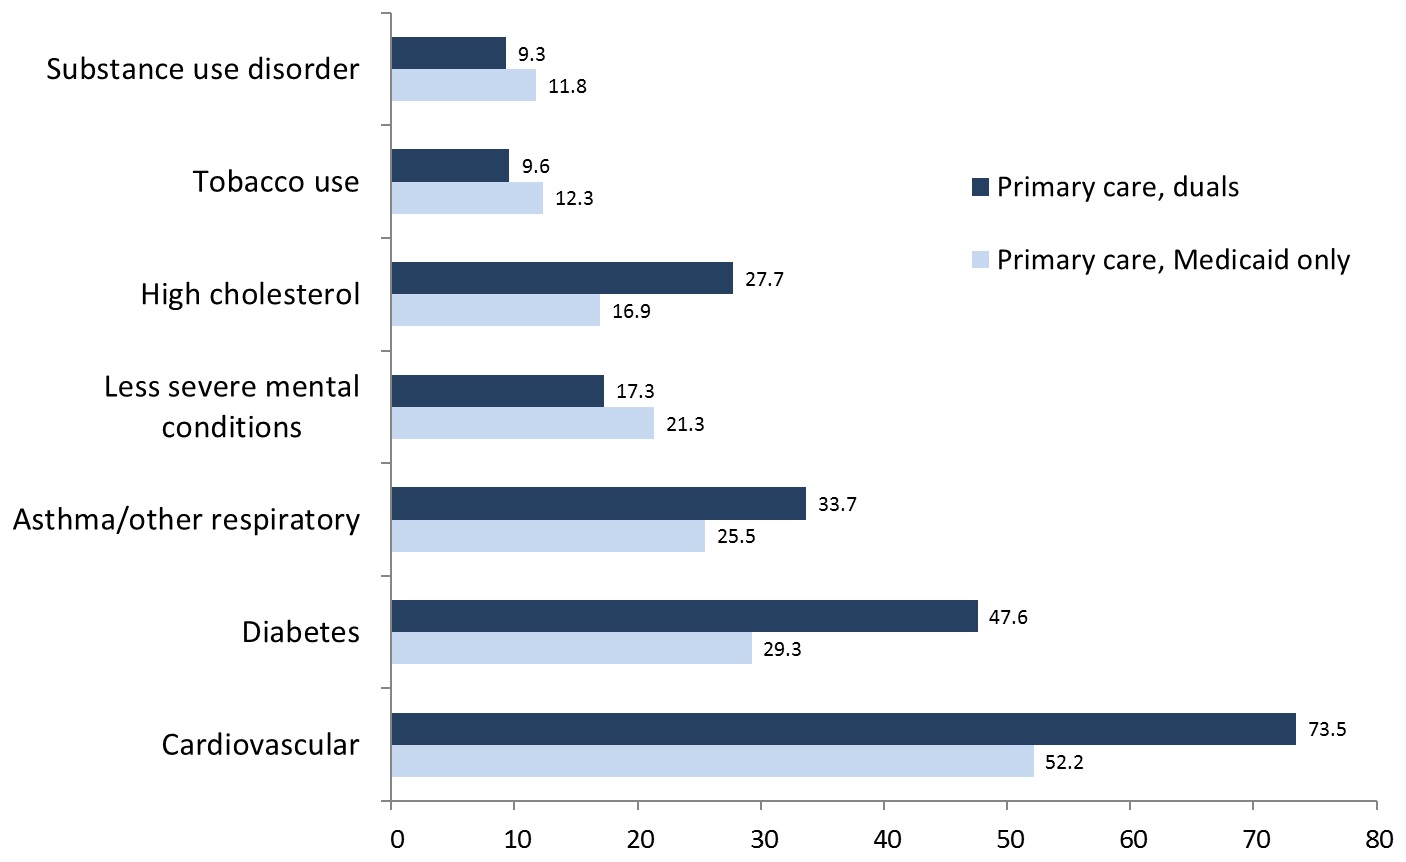
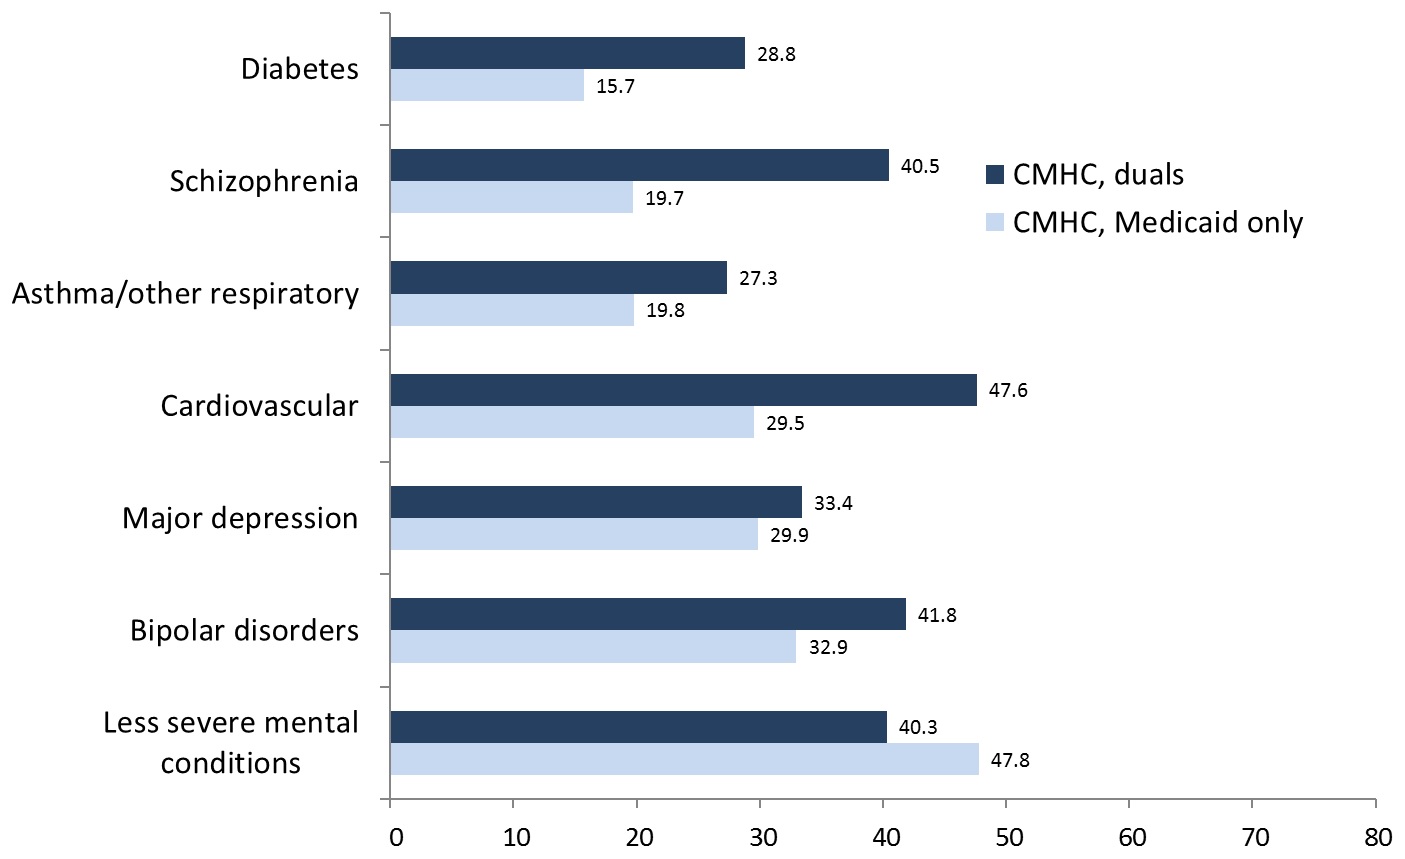
As would be expected, somatic conditions were most prevalent in the primary care health homes, with nearly three-quarters of duals and more than half of Medicaid-only beneficiaries having received treatment in the base year for cardiovascular conditions (Figure 1). Similarly, nearly half of duals and 30% of Medicaid-only primary care enrollees received treatment for diabetes, and more than 30% of duals and 25% of Medicaid-only beneficiaries were treated for respiratory conditions. Thus, the challenge for primary care health homes was to assure integration of care for these conditions with services for less severe mental health conditions such as depression or anxiety, tobacco use, and substance use disorders, which affected 10%-20% of enrollees, and SMI/SED, which combined affect nearly one in five enrollees, as seen in Table 2. Although the most prevalent health issues for CMHC enrollees were SMI/SED diagnoses, the challenge for these health homes was assuring integration of treatment for CVD, respiratory disease, and diabetes, which also were prevalent for CMHC enrollees, especially duals, and may be more prevalent than our treatment-based measures indicate (Figure 2).
| FIGURE 1. Most Prevalent Conditions, Primary Care Health Homes |
|---|
 |
| SOURCE: Tabulations of Medicaid and Medicare claims, 2011. |
| FIGURE 2. Most Prevalent Conditions, CMHC Health Homes |
|---|
 |
| SOURCE: Tabulations of Medicaid and Medicare claims, 2011. |
Descriptive Utilization and Spending Estimates in the Base Year
Base year use and spending for health home enrollees and comparisons are shown in Table 3 for Medicaid-only eligibles and Table 4 for duals. Utilization detail for emergency department and inpatient care, community-based LTSS, and prescription drugs are shown for Medicaid-only beneficiaries. Table 4 shows utilization detail only for community-based LTSS, which are covered only by Medicaid, because Medicare is the first payer for the other services. Our study cohort excludes people who used nursing homes in the base year, so nursing home spending is included in facility-based spending estimates only for 2012 and 2013, as cohort members entered facilities.
| TABLE 3. Means of Per Person Per Month Baseline Utilization and Spending for Medicaid-only Health Home Enrollees and Comparisons, 2011 | ||||
|---|---|---|---|---|
| Primary Care Health Homes | CMHC Health Homes | |||
| Comparisons | Enrollees | Comparisons | Enrollees | |
| Number of persons | 145,392 | 9,792 | 138,119 | 9,324 |
| Number of person months | 1,744,704 | 117,504 | 1,657,428 | 111,888 |
| Medicaid Utilization Outcomes | ||||
| Emergency Department Use | ||||
| Any ER use | 0.11 | 0.13 | 0.11 | 0.14 |
| Average visits per month | 0.14 | 0.19 | 0.15 | 0.19 |
| Average spending per month | $39 | $63 | $40 | $60 |
| Inpatient Hospital Use | ||||
| Any inpatient hospital use | 0.03 | 0.03 | 0.03 | 0.04 |
| Average admissions per month | 0.03 | 0.03 | 0.03 | 0.04 |
| Average days per month | 0.16 | 0.18 | 0.17 | 0.26 |
| Average monthly spending | $141 | $152 | $122 | $190 |
| Community-Based LTSS | ||||
| Any community-based LTSS use | 0.15 | 0.11 | 0.12 | 0.16 |
| Average monthly spending | $155 | $103 | $93 | $114 |
| Prescription Drugs--Average Monthly Spending | ||||
| Any prescription drug use | 0.71 | 0.75 | 0.72 | 0.81 |
| Average monthly spending | $415 | $404 | $445 | $662 |
| Spending Outcomes | ||||
| Medicaid Total Spending | $1,101 | $1,184 | $1,050 | $1,811 |
| Total ER, inpatient, other facility | $180 | $215 | $162 | $250 |
| Total spending all other services | $921 | $969 | $888 | $1,561 |
| SOURCE: Weighted tabulations of Medicaid claims in 2011 base year for enrollees and matched comparisons using weights produced by the matching procedure. Note that because the CEM weights are scaled to maintain the actual number of Medicaid beneficiaries matched, the weighted and unweighted number of persons and person months are identical. | ||||
Medicaid-only health home enrollees generally had equivalent or somewhat higher utilization and spending than comparisons. Differences are larger for CMHC enrollees. Primary care enrollees had total Medicaid spending 7% higher than comparisons, whereas total CMHC enrollee spending was 70% higher, mostly because of higher spending for community-based LTSS, drugs, and other services included in the broad category of spending for nonfacility care.
| TABLE 4. Means of Per Person Per Month Baseline Utilization and Spending for Dually Eligible Health Home Enrollees and Comparisons, 2011 | ||||
|---|---|---|---|---|
| Primary Care Health Homes | CMHC Health Homes | |||
| Comparisons | Enrollees | Comparisons | Enrollees | |
| Number of persons | 52,115 | 6,438 | 28,396 | 5,742 |
| Number of person months | 625,380 | 77,256 | 340,752 | 68,904 |
| Medicaid Utilization Outcomes | ||||
| Community-Based LTSS | ||||
| Any community-based LTSS use | 0.34 | 0.29 | 0.27 | 0.36 |
| Average monthly spending | $297 | $246 | $185 | $228 |
| Spending Outcomes | ||||
| Medicaid Total Spending | $704 | $683 | $692 | $1,198 |
| Total ER, inpatient, other facility | $14 | $25 | $18 | $25 |
| Total spending all other services | $690 | $658 | $675 | $1,173 |
| Medicare Total Spending | $1,422 | $1,212 | $1,435 | $1,403 |
| Total ER, inpatient, other facility | $387 | $350 | $319 | $254 |
| Total spending all other services | $1,035 | $862 | $1,116 | $1,149 |
| Total Spending Medicaid and Medicare | $2,126 | $1,895 | $2,127 | $2,601 |
| Total ER, inpatient, other facility | $401 | $375 | $336 | $279 |
| Total spending all other services | $1,725 | $1,520 | $1,791 | $2,322 |
| SOURCE: Weighted tabulations of Medicaid and Medicare claims in 2011 base year for enrollees and matched comparisons using weights produced by the matching procedure. Note that because the CEM weights are scaled to maintain the actual number of Medicaid beneficiaries matched, the weighted and unweighted number of persons and person months are identical. | ||||
Utilization and spending patterns at baseline were very different for duals (Table 4). Primary care enrollees had slightly lower Medicaid community-based LTSS utilization and spending relative to comparisons and lower Medicaid, Medicare and combined program spending at baseline. Conversely, CMHC enrollees who were duals had higher utilization and spending for community-based LTSS than comparisons as well as higher Medicaid spending for other nonfacility services. Combined Medicaid and Medicare spending was higher overall for CMHC duals relative to comparisons, but lower for targeted facility-based services. The latter result is not unexpected because of their lower Medicare spending on targeted services. Because Medicare is the primary payer for these facility-based services, Medicaid would pay only cost sharing in most cases. It should be noted that while we did not include enrollees or comparisons who first entered Medicare after 2011, some cohort members had only a partial year of Medicare enrollment in 2011, which could affect the Medicare estimates. About 75% of primary care enrollees, CMHC enrollees, and comparisons had 12 months of enrollment in 2011, however, and about 80% had at least six months, so we do not believe the effect on average per person per month spending is consequential.
Difference-in-Differences Model Results
Results of the difference-in-differences analyses are presented in Table 5 for Medicaid-only beneficiaries in the two Missouri health home programs, and Table 6 for duals. In each table estimates for all health home enrollees are juxtaposed with estimates for the subset of enrollees with at least nine months of exposure to the program over the first 18 months of implementation, from January 2012 through June 2013. Although the full samples of enrollees had fairly high exposure to the program, the selection increased the average exposure from about 15 months to 20 months and, perhaps more important, excluded enrollees who entered the programs only after October 2012 or had intermittent periods of enrollment. Table entries represent marginal changes in per person per month outcomes (e.g., percent of persons with inpatient hospital use, the number of days of use, and spending) for health home enrollees over one and two years, relative to outcomes if they not been enrolled in the program.
Medicaid-only Beneficiaries
Primary care enrollees. For the full sample of health home enrollees, we found no statistically significant reductions in use and spending for targeted facility-based services, except for a $6 per person per month decrease in spending for emergency services (Table 5). On the other hand, overall program spending did not increase significantly for health home enrollees. The number of inpatient admissions increased slightly, and both use and spending increased significantly over one year and two years for community-based LTSS and prescription drugs. Despite these increases, spending on services other than targeted facility-based care, net of the $58.87 primary care health home PMPM, fell significantly. This finding suggests that reduced spending for other services partially offset the increased cost of the PMPM. For enrollees with longer exposure to the program, patterns of utilization and spending were similar to those for the full sample, but decreases are larger for total program spending and spending on services other than facility-based care, net of the health home PMPM. Comparing the one-year and two-year spending increases for prescription drugs suggests the possibility that the initial increase in spending reflects an adjustment that may be leveling off over time, a pattern that is evident but weaker for the full population. Combined, the results suggest that, at a minimum, the primary care health home program did not increase Medicaid costs for Medicaid-only enrollees, and that effects on outcomes were larger among enrollees with longer and more stable exposure to the program.
CMHC enrollees. Greater program exposure appears to have greater effects for Medicaid-only enrollees in the CMHC health home program, but they are harder to interpret. We found significant increases in per person per month use and spending for emergency services and inpatient care for all enrollees. Over the two-year period, total Medicaid spending and spending on facility-based care increased significantly, as did total spending net of the $78.74 PMPM payment, indicating that there was no underlying reduction in service use or spending to offset the cost of PMPM payments. Conversely, within the group with at least nine months of health home exposure, no significant change occurred over the two-year evaluation period for emergency services and spending, and increases in inpatient use and spending were significant but far smaller than for the full CMHC enrollee population. Spending for prescription drugs, which rose by $30 per person per month for the full CMHC enrollee population, fell by $71 per person per month over the two years for enrollees with greater exposure. From an overall Medicaid spending perspective, there were significant and increasing declines over two years in total spending and spending on services other than facility-based care that more than offset the cost of the health home PMPM for enrollees with greater exposure, with no significant change in spending for facility-based care.
| TABLE 5. Difference-in-Differences Estimates for Medicaid-only Beneficiaries Enrolled in Primary Care and CMHC Health Homes | ||||||||||||||||
|---|---|---|---|---|---|---|---|---|---|---|---|---|---|---|---|---|
| Primary Care Health Home Enrollees | CMHC Health Home Enrollees | |||||||||||||||
| All | Enrolled >=9 Months | All | Enrolled >=9 Months | |||||||||||||
| 2011-2012 | 2011-2013 | 2011-2012 | 2011-2013 | 2011-2012 | 2011-2013 | 2011-2012 | 2011-2013 | |||||||||
| Medicaid Utilization Outcomes | ||||||||||||||||
| Emergency Room Use | ||||||||||||||||
| Any ER use | 0.002 | 0.001 | 0.002 | 0.000 | 0.009 | ** | 0.007 | ** | 0.004 | 0.002 | ||||||
| Average visits per month | 0.002 | 0.002 | -0.001 | -0.003 | 0.025 | ** | 0.021 | ** | 0.011 | 0.007 | ||||||
| Average spending per month | -$1 | -$6 | ** | -$1 | -$9 | ** | $14 | ** | $10 | ** | $7 | * | $2 | |||
| Inpatient Hospital Use | ||||||||||||||||
| Any inpatient hospital use | 0.000 | 0.002 | 0.000 | 0.001 | 0.008 | ** | 0.007 | ** | 0.006 | ** | 0.005 | ** | ||||
| Average admissions per month | 0.001 | 0.003 | * | 0.001 | 0.002 | 0.013 | ** | 0.014 | ** | 0.006 | ** | 0.006 | * | |||
| Average days per month | 0.011 | 0.016 | 0.008 | 0.010 | 0.113 | ** | 0.151 | ** | 0.049 | * | 0.072 | ** | ||||
| Average monthly spending | $10 | $18 | $10 | $17 | $79 | ** | $111 | ** | $21 | $58 | ** | |||||
| Community LTSSa | ||||||||||||||||
| Any community LTSS use | 0.013 | ** | 0.027 | ** | 0.015 | ** | 0.031 | ** | -0.004 | 0.038 | ** | -0.005 | 0.040 | ** | ||
| Average monthly spending | $29 | ** | $49 | ** | $21 | ** | $43 | ** | $8 | $5 | $6 | $3 | ||||
| Prescription Drugs | ||||||||||||||||
| Any Rx drug use | 0.015 | ** | 0.015 | ** | 0.018 | ** | 0.005 | * | 0.020 | ** | 0.026 | ** | 0.010 | ** | -0.004 | * |
| Average monthly spending | $23 | ** | $17 | * | $33 | ** | $6 | $4 | $30 | * | -$33 | -$71 | ** | |||
| Spending Outcomes | ||||||||||||||||
| Medicaid Total Spending | $23 | $25 | $31 | -$19 | $89 | ** | $147 | ** | -$78 | * | -$197 | ** | ||||
| Total ER, inpatient, other facility | $7 | $6 | $1 | -$7 | $85 | ** | $105 | ** | $15 | $31 | ||||||
| Total spending all other services | $6 | $8 | $26 | -$19 | $8 | $41 | * | -$104 | ** | -$254 | ** | |||||
| Medicaid Spending Net of Health Home PMPMb | -$20 | -$22 | -$28 | -$82 | ** | $31 | $77 | ** | -$166 | ** | -$279 | ** | ||||
| Net spending all other services | -$38 | ** | -$39 | ** | -$35 | * | -$82 | ** | -$50 | * | -$30 | -$193 | ** | -$338 | ** | |
| SOURCE: Weighted analyses of Medicaid claims in 2011 base year for enrollees and matched comparisons using weights produced by the matching procedure. Probability of service use outcomes were estimated using logit regression, and continuous outcomes were estimated using Generalized Linear Modeling with a gamma distribution and log link. **(*) P = 0.01(0.05)
| ||||||||||||||||
Dually Eligible Beneficiaries
Primary care enrollees. The overall finding over two years for dually eligible enrollees was that Medicaid spending fell significantly, and Medicare spending increased significantly, but by less than the reductions in Medicaid spending (Table 6). As a result, no significant change occurred in combined spending for all services, targeted facility-based services, or other services. This was true for all enrollees and for those with greater program exposure, although magnitudes of changes generally were larger for the latter group. Use of community-based LTSS, covered only by the Medicaid program, increased over the two years, but with no significant increase in spending, and spending for targeted facility-based services fell despite Medicaid's full liability for the costs associated with the small proportion of enrollees (about 1%) who entered long-term facility care over the evaluation period. Net spending estimates indicate that the reductions in spending more than covered the cost of the health home PMPM.
| TABLE 6. Difference-in-Differences Estimates for Duals Enrolled in Primary Care and CMHC Health Homes | ||||||||||||||||
|---|---|---|---|---|---|---|---|---|---|---|---|---|---|---|---|---|
| Primary Care Health Home Enrollees | CMHC Health Home Enrollees | |||||||||||||||
| All | Enrolled >=9 Months | All | Enrolled >=9 Months | |||||||||||||
| 2011-2012 | 2011-2013 | 2011-2012 | 2011-2013 | 2011-2012 | 2011-2013 | 2011-2012 | 2011-2013 | |||||||||
| Medicaid Utilization Outcomes | ||||||||||||||||
| Community LTSSa | ||||||||||||||||
| Any community LTSS use | 0.001 | 0.010 | ** | 0.004 | 0.019 | ** | -0.016 | ** | -0.012 | ** | -0.015 | ** | -0.014 | ** | ||
| Average monthly spending | -$1 | $8 | $2 | $8 | -$21 | ** | -$34 | ** | -$23 | ** | -$43 | ** | ||||
| Spending Outcomes | ||||||||||||||||
| Medicaid Total Spending | -$81 | ** | -$106 | ** | -$82 | ** | -$120 | ** | -$89 | ** | -$265 | ** | -$125 | ** | -$388 | ** |
| Total ER, inpatient, other facility | -$28 | ** | -$74 | ** | -$32 | ** | -$77 | ** | -$37 | ** | -$81 | ** | -$49 | ** | -$102 | ** |
| Total spending all other services | -$59 | ** | -$69 | ** | -$52 | ** | -$72 | ** | -$36 | * | -$135 | ** | -$52 | * | -$214 | ** |
| Medicare Total Spending | $55 | ** | $67 | ** | $62 | ** | $76 | ** | $62 | ** | $109 | ** | $57 | * | $98 | ** |
| Total ER, inpatient, other facility | $33 | $46 | * | $32 | $51 | * | $48 | ** | $104 | ** | $56 | ** | $126 | ** | ||
| Total spending all other services | $24 | * | $30 | ** | $29 | ** | $35 | ** | $36 | ** | $31 | * | $30 | * | $7 | |
| Total Spending Medicaid and Medicare | -$3 | -$1 | $4 | -$7 | -$20 | -$48 | ** | -$62 | -$155 | ** | ||||||
| Total ER, inpatient, other facility | $7 | $6 | $0 | -$3 | $25 | $88 | ** | $21 | $91 | ** | ||||||
| Total spending all other services | -$18 | -$15 | -$6 | -$9 | -$1 | -$80 | ** | -$26 | -$172 | ** | ||||||
| Medicaid Spending Net of Health Home PMPMb | -$130 | ** | -$159 | ** | -$145 | ** | -$187 | ** | -$163 | ** | -$354 | ** | -$225 | ** | -$491 | ** |
| Net spending all other services | -$108 | ** | -$123 | ** | -$116 | ** | -$140 | ** | -$111 | ** | -$226 | ** | -$152 | ** | -$317 | ** |
| Total Spending Net of Health Home PMPMb | -$44 | -$46 | -$50 | -$46 | -$77 | * | -$118 | ** | -$141 | ** | -$236 | ** | ||||
| Net spending all other services | -$59 | ** | -$60 | ** | -$60 | ** | -$66 | ** | -$58 | ** | -$149 | ** | -$104 | ** | -$252 | ** |
| SOURCE: Weighted analyses of Medicaid and Medicare claims in 2011 base year for enrollees and matched comparisons using weights produced by the matching procedure. Probability of service use outcomes were estimated using logit regression, and continuous outcomes were estimated using Generalized Linear Modeling with a gamma distribution and log link. **(*) P = 0.01(0.05)
| ||||||||||||||||
CMHC enrollees. The spending patterns are similar for CMHC enrollees, but the bottom line is somewhat different. Considering all enrollees, Medicaid spending overall and for facility-based and other services fell, with far greater reductions over the two-year period than those for primary care enrollees, but Medicare spending also rose more, particularly for facility-based care. Again, the result was no change in overall spending for both programs combined, an increase for combined targeted facility-based services, and a reduction in combined spending for all other services. For enrollees with greater exposure, reductions in Medicaid spending were amplified, but Medicare spending increases were not, except for facility-based care. As a result, overall spending for Medicare and Medicaid combined and for services other than facility-based care fell significantly, while spending for facility-based care rose. Contrary to the findings for primary care health homes, use and spending for community-based LTSS fell significantly for all enrollees and for those with greater program exposure. As with the primary care program for duals, net spending results indicate that savings were sufficient to more than cover the cost of the PMPM.
Summary and Discussion of Model Results and Limitations
Figures 3 through 6 graphically summarize our findings with respect to per person per month Medicaid service use and spending over the full two-year evaluation period. Our analyses indicate Medicaid spending effects were stronger for CMHC enrollees, for dually eligible enrollees in each program, and for those with longer and more stable program exposure.
-
No significant savings were indicated for Medicaid-only enrollees in the primary care health home, but overall program spending did not increase significantly, suggesting at least partial offset of the program's PMPM cost.
-
Medicaid program spending increased significantly for Medicaid-only CMHC enrollees as a group, but for the subset of enrollees with greater program exposure, both total spending and spending on services other than facility-based care was dramatically lower. Whereas Medicaid spending for all enrollees was about $150 higher than if they were not enrolled, spending for enrollees with greater exposure was nearly $200 less.
-
Medicaid spending for targeted facility-based services was unchanged for Medicaid-only primary care enrollees and increased significantly for Medicaid-only CMHC enrollees, but fell significantly for dually eligible enrollees in both programs.
-
For dually eligible enrollees in each program, total Medicaid spending was significantly lower, again with the greatest effects for CMHC enrollees. In fact, declines were fairly similar in magnitude for all for primary care enrollees and for those with greater exposure, but far larger for CMHC enrollees, with a substantially larger reduction for those with greater exposure. The decline for primary care enrollees was about $100, compared with more than $250 for all CMHC enrollees and nearly $400 for enrollees with greater exposure.
A notable finding was that although Medicare spending increased for duals in both programs, the reductions in Medicaid spending were sufficient to offset the higher Medicare spending for primary care enrollees and more than offset Medicare increases for CMHC enrollees. As a result, there was no significant change in total combined Medicare and Medicaid spending for primary care enrollees and all CMHC enrollees, but combined spending was about $150 lower for CMHC enrollees with greater health home exposure.
| Summary of Missouri Health Home Medicaid Spending Outcomes Over the Initial 2 Years (2012-2013) | |
|---|---|
| FIGURE 3. Medicaid Only Primary Care Enrollees | FIGURE 4. Medicaid Only CMHC Enrollees |
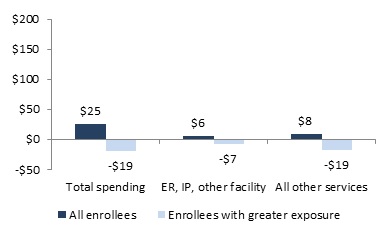 | 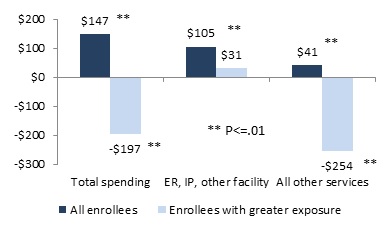 |
| FIGURE 5. Dual Primary Care Enrollees | FIGURE 6. Dual CMHC Enrollees |
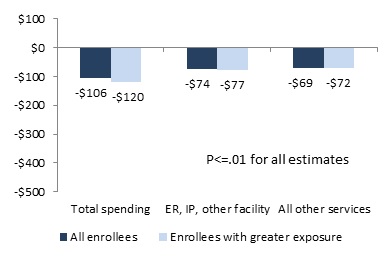 | 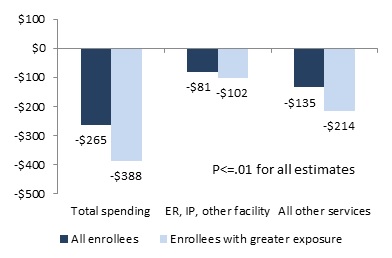 |
Medicare spending for targeted facility-based services increased over the two-year evaluation period for all dual enrollees and those with greater exposure in both the primary care and CMHC health home programs, but for these services, differentials associated with greater exposure were small. For CMHC enrollees, the result was higher combined Medicare and Medicaid spending for targeted services, but reductions in other spending more than offset the increase.
Our analysis focused primarily on health home effects on use of facility-based care, as specified in the legislation, and on costs. We found only small reductions among Medicaid-only primary care enrollees in emergency department use and spending, a small increase in hospital admissions and spending among all primary care enrollees and no significant change for those with greater program exposure. For Medicaid-only CMHC enrollees we found significant increases in use and spending for emergency department and hospital services for all enrollees but no change in emergency department use or spending and a smaller increase in hospital use and spending for those with greater exposure. Among duals, as noted, we found reductions in Medicaid facility-based spending and offsetting increases in Medicare spending for these services. For dual primary care enrollees, Medicaid reductions were sufficient to leave combined Medicaid and Medicare spending for these services unchanged, but for CMHC enrollees combined facility-based spending rose significantly.
This finding may be consistent with what we learned in our qualitative work in Missouri and other states regarding the importance of timely notifications of emergency department use and hospital admissions to enable health homes to deliver effective interventions to reduce the need for emergency care and provide transitional care to reduce hospital readmissions. Although Missouri has a fairly advanced notification system for services for which Medicaid was the primary payer, timely notifications were more problematic when Medicare was the primary payer. An additional factor we heard about in our qualitative work that could contribute to increased facility-based care for Medicaid-only beneficiaries was lack of access to primary care and other nonfacility services during gaps in Medicaid eligibility.
Within the very broad category of all services other than facility-based care, we examined separately only prescription drugs for Medicaid-only health home enrollees and community-based LTSS, which is covered only by Medicaid, for all enrollees. There was no prior expectation for the direction of changes health home enrollment might bring about for either service.
For Medicaid prescription drug use and spending, increases may indicate improved access to needed drugs, and decreases may result from improved management and reconciliation of prescribing. For Medicaid-only beneficiaries, our findings for primary care enrollees indicated initial increases in drug spending that may have been leveling off over the two-year period. For CMHC enrollees, we found an increase in prescription drug spending over two years for the full enrollee sample, but a decrease among those with greater exposure to the program.
For community-based LTSS, patterns were similarly mixed, with no firm expectation for the direction of effects except that health home care management may have been able to improve access for enrollees with unmet need for these services. For Medicaid-only primary care enrollees, both community-based LTSS utilization and spending increased significantly over the two-year period. For CMHC Medicaid-only enrollees, utilization increased, but spending was unchanged. For duals, utilization increased with no significant effect on spending for primary care enrollees, but both utilization and spending fell for CMHC enrollees. Our measure of community-based LTSS includes personal care, adult day health, home health, and rehabilitation services provided under either the state plan or waivers. We did not include other services sometimes considered to be community-based LTSS, such as transportation for those with disabilities, durable medical equipment, or services in supportive settings (e.g., assisted living or group homes).
We note, however, that our narrower definition of community-based LTSS services is unlikely to be important in understanding the decreased spending for the broad category of all other services. The services we included in our measure and those we did not, as well as prescription drugs, physician visits, laboratory and other diagnostic and evaluation services, and all other services not explicitly among the targeted facility-based services were included in spending in the broad "all other services" category. Spending for some of these services might be expected to increase if improved care management identified and addressed unmet needs. As seen in Table 5, however, health home enrollment was associated with either no change or reductions in this broad category of spending over the analysis period. Although it is beyond the scope of the evaluation to delve further into changes in utilization and spending in this broad category, exploratory analyses excluding community-based LTSS and prescription drug spending confirmed significant reductions in spending for the remaining services as a group. Further investigation would be needed to understand how health home enrollment is related to these patterns and what they may indicate about the quality of care health home enrollees were receiving.
Given the scope of our project, we have not examined quantitatively other important outcomes that affect population health. These include central health home aims such as improvements in chronic disease management (e.g., hypertension and diabetes treatment and control), disease self-management, and health promotion, the benefits of which may play out over multiple years. CMS has established a set of core health home quality measures that states are to report through a newly established electronic portal.11 These reports will be useful to inform future analyses of health home performance.
VII. CONCLUSION
Over the last five years, we have documented the initiation and progress of 13 health home programs in the first 11 states with approved programs. The previous four qualitative evaluation reports focused on health home structure, processes, implementation progress and provider experience in the 11 states. In this final report, we have presented results from quantitative analysis of Missouri's two programs: primary care health homes whose enrollees' dominant health issues are chronic physical conditions and CMHC health homes whose enrollees have mental or behavioral conditions, often in combination with chronic physical illnesses.
The two Missouri programs have provided a particularly good basis for the quantitative analyses because they operate within the same health system and Medicaid program context and represent two of the three health home types we have profiled in our qualitative work.
The primary care health homes are an example of the medical home-like models implemented in four of the 11 evaluation states. These health homes are variations on or extensions of the PCMH. In addition to the difficult task all health homes have faced in building the team-based approach, infrastructure, culture change, and processes necessary to address the required health home services, the particular challenge for these health homes was broadening care management to encompass mental/behavioral health care and increasing connections to nonclinical supports and services their enrollees may need.
The CMHC health homes are an example of the specialty provider-based programs implemented in four of the 11 evaluation states. These programs serve specific populations and generally had more prior experience with linking patients to community support services. The central challenge for CMHC health homes, as for most other specialty provider health homes, has been incorporating primary care into their practice and increasing attention to the physical co-morbidities that can complicate treatment of mental and behavioral conditions.
Our analysis used a difference-in-differences approach and provided estimates of the marginal changes in per person per month use and spending for health home enrollees over the first two years of each program, relative to outcomes if they not been enrolled in the program. Our results show some successes and additional indications of movement toward meeting health home expectations in Missouri.
Although our quantitative analysis did not generally find that health home enrollment was associated with reductions in facility-based spending, we also generally found no significant increases in overall Medicaid spending. The exception was higher overall Medicaid spending for all Medicaid-only enrollees in the CMHC health home. But when we limited the analysis to the subset of these CHMC enrollees who had longer and more stable health home exposure, we found large significant reductions in overall Medicaid spending, suggesting that the ability of health homes to gain and maintain enrollee engagement is a key factor in health home performance. By examining spending net of the PMPM cost of the program, we also found evidence that changes in utilization and spending at least partially offset this cost, and in some cases, such as CMHC enrollees with greater program exposure, more than offset the program cost.
Among duals, Medicaid spending overall, for facility-based care and for other services was significantly lower for health home enrollees than predicted spending had they not been enrolled, with the largest reductions for duals in the CMHC health homes. Medicare spending increased significantly, but the reductions in Medicaid spending were sufficient to offset the increase and leave total combined Medicaid and Medicare spending for this particularly vulnerable population of older people and people with disabilities unchanged. As was the case for Medicaid-only beneficiaries, among duals in CMHC health homes who had greater program exposure, total combined spending fell significantly as the result of a large reduction in Medicaid spending and a smaller, though significant, increase in Medicare spending.
Nevertheless, the spending patterns and how health home enrollment would affect them remains puzzling. Some "Medicare maximization" may occur as the result of improvements in the management of care for duals. For example, if hospitalized enrollees were more likely to be channeled to appropriate Medicare-covered post-acute care rather than Medicaid nursing facilities the result could be lower Medicaid spending both for services and for cost sharing. As noted, further analysis would be required to better understand these patterns and how they relate to health home enrollment.
Since the evaluation project began, an additional 12 states have implemented one or more health home programs, several with effective dates as late as January 2016, and some of the 11 states we studied also have added new programs or expanded existing ones. Many of the newer programs, like Missouri's CMHC health homes, focus on the population with SMI or SED, while others focus on a broad population or specifically on persons whose primary need is comprehensive management of their chronic physical conditions, as in the Missouri primary care health homes.
Given the scope of the evaluation, we were not able to look beneath broad utilization and spending patterns to better understand how the health home model changed the mix of services delivered to health home enrollees. Quantitative research in this area and, more importantly, examination of programs in additional states as data issues are resolved would strengthen the evidence base for states and policymakers with respect to performance of the model for different populations, provider types, and program designs.
VIII. ENDNOTES
-
Social Security Act Sec. 1945 State Option to Provide Care through a Health Home for Individuals with Chronic Conditions. http://www.ssa.gov/OP_Home/ssact/title19/1945.htm.
-
Centers for Medicare & Medicaid Services. Health Home Information Resource Center. Medicaid Health Homes: SPA Overview, November 2016. https://www.medicaid.gov/state-resource-center/medicaid-state-technical-assistance/health-homes-technical-assistance/downloads/hh-spa-overview.pdf.
-
Spillman, BC, B Ormond, E Richardson. 2012. Evaluation of the Medicaid Health Home Option for Beneficiaries with Chronic Conditions: Final Annual Report - Base Year. Department of Health and Human Services, Office of the Assistant Secretary for Planning and Evaluation. https://aspe.hhs.gov/basic-report/evaluation-medicaid-health-home-option-beneficiaries-chronic-conditions-final-annual-report-base-year.
Spillman, BC, E Richardson, A Spencer, E Allen. 2014. Evaluation of the Medicaid Health Home Option for Beneficiaries with Chronic Conditions: Annual Report - Year Two. Department of Health and Human Services, Office of the Assistant Secretary for Planning and Evaluation. https://aspe.hhs.gov/basic-report/evaluation-medicaid-health-home-option-beneficiaries-chronic-conditions-annual-report-year-two.
Spillman, BC, EH Allen, AC Spencer. 2015. Evaluation of the Medicaid Health Home Option for Beneficiaries with Chronic Conditions: Annual Report - Year Three. Department of Health and Human Services, Office of the Assistant Secretary for Planning and Evaluation. https://aspe.hhs.gov/basic-report/evaluation-medicaid-health-home-option-beneficiaries-chronic-conditions-annual-report-year-three.
Spillman, BC, EH Allen, N Lallemand, E Hayes. 2016. Evaluation of the Medicaid Health Home Option for Beneficiaries with Chronic Conditions: Progress and Lessons from the First States Implementing Health Home Programs, Annual Report - Year Four. Department of Health and Human Services, Office of the Assistant Secretary for Planning and Evaluation. https://aspe.hhs.gov/basic-report/evaluation-medicaid-health-home-option-beneficiaries-chronic-conditions-progress-and-lessons-first-states-implementing-health-home-programs-annual-report-year-four.
-
Mann, Cindy. 2010. "Health Homes for Enrollees with Chronic Conditions." CMS: State Medicaid Director Letter #10-024, ACA #12.
-
Social Security Act Sec. 1945 State Option to Provide Care through a Health Home for Individuals with Chronic Conditions. http://www.ssa.gov/OP_Home/ssact/title19/1945.htm.
-
Spillman, BC, E Richardson, A Spencer, E Allen. 2014. Evaluation of the Medicaid Health Home Option for Beneficiaries with Chronic Conditions: Annual Report - Year Two. Department of Health and Human Services, Office of the Assistant Secretary for Planning and Evaluation. https://aspe.hhs.gov/basic-report/evaluation-medicaid-health-home-option-beneficiaries-chronic-conditions-annual-report-year-two.
-
Iacus, SM, G King, and G Porro. 2012. "Causal Inference without Balance Checking: Coarsened Exact Matching." Political Analysis 20(1):1-24. doi:10.1093/pan/mpr013.
Blackwell, M, S Iacus, and G King. 2009. "cem: Coarsened exact matching in Stata." Stata Journal 9(4):524-546.
Wells, AR, B Hamar, C Bradley, et al. 2013. "Exploring Robust Methods for Evaluating Treatment and Comparison Groups in Chronic Care Management Programs." Population Health Management 16(1):35-45.
-
Social Security Administration. Program Operations Manual System (POMS), SI 01715.010 Medicaid and the Supplemental Security Income (SSI) Program, TN (05-14). https://secure.ssa.gov/poms.nsf/lnx/0501715010.
-
Spillman, BC, B Ormond, E Richardson. 2012. Medicaid Health Homes in Missouri: Review of Pre-Existing Initiatives and State Plan Amendment(s) for the State's First Health Homes under Section 2703 of the Affordable Care Act. https://aspe.hhs.gov/sites/default/files/private/pdf/137856/HHOption2-MO.pdf.
-
Spillman, BC, B Ormond, E Richardson. 2012. Evaluation of the Medicaid Health Home Option for Beneficiaries with Chronic Conditions: Final Annual Report - Base Year. Department of Health and Human Services, Office of the Assistant Secretary for Planning and Evaluation. https://aspe.hhs.gov/basic-report/evaluation-medicaid-health-home-option-beneficiaries-chronic-conditions-final-annual-report-base-year.
Spillman, BC, E Richardson, A Spencer, E Allen. 2014. Evaluation of the Medicaid Health Home Option for Beneficiaries with Chronic Conditions: Annual Report - Year Two. Department of Health and Human Services, Office of the Assistant Secretary for Planning and Evaluation. https://aspe.hhs.gov/basic-report/evaluation-medicaid-health-home-option-beneficiaries-chronic-conditions-annual-report-year-two.
Spillman, BC, EH Allen, AC Spencer. 2015. Evaluation of the Medicaid Health Home Option for Beneficiaries with Chronic Conditions: Annual Report - Year Three. Department of Health and Human Services, Office of the Assistant Secretary for Planning and Evaluation. https://aspe.hhs.gov/basic-report/evaluation-medicaid-health-home-option-beneficiaries-chronic-conditions-annual-report-year-three.
Spillman, BC, EH Allen, N Lallemand, E Hayes. 2016. Evaluation of the Medicaid Health Home Option for Beneficiaries with Chronic Conditions: Progress and Lessons from the First States Implementing Health Home Programs, Annual Report - Year Four. Department of Health and Human Services, Office of the Assistant Secretary for Planning and Evaluation. https://aspe.hhs.gov/basic-report/evaluation-medicaid-health-home-option-beneficiaries-chronic-conditions-progress-and-lessons-first-states-implementing-health-home-programs-annual-report-year-four.
-
See https://www.medicaid.gov/state-resource-center/medicaid-state-technical-assistance/health-homes-technical-assistance/health-home-quality-reporting.html.
APPENDIX A. PROFILE OF HEALTH HOME PROGRAMS IN THE EVALUATION
| North Carolina's Health Home Program at a Glance | |
|---|---|
| Program Description | North Carolina built its health home program using a well-established primary care case management organization--Community Care of North Carolina (CCNC)--to serve as its health home provider and designated Medicaid beneficiaries served by CCNC who met the eligibility criteria as health home enrollees. The program targets beneficiaries with chronic health conditions; mental illness and developmental disabilities are excluded as qualifying conditions. The state implemented the program administratively, using the enhanced federal match funding to defray Medicaid costs with no health home-related change in practice or payments to CCNCs or primary care providers (PCPs). No significant changes have been made to CCNC's underlying structures, processes, enrollee assignment, provider requirements or payment rates as a result of the state's adoption of the health home program. |
| SPA Effective | October 1, 2011 |
| Eligibility | 2 chronic conditions, 1 chronic condition and at risk of another. Conditions include:
|
| Enrollment | 540,841 enrollees as of May 2016 |
| Delivery Model | Care management network: Health home services are coordinated through a statewide care management program, CCNC, in collaboration with Medicaid-enrolled PCPs. |
| Providers | 14 regional CCNC networks and 1,888 PCPs statewide as of May 2016 |
| Payment System & Reimbursement Level | PMPM care management fee, paid to network and PCPs. PMPM fee based on beneficiary classification:
|
| NOTE: Enrollment estimate and provider participation provided by CMS. ABD = Aged, Blind and Disabled | |
| Oregon's Health Home Program at a Glance | |
|---|---|
| Program Description | Oregon essentially used the health home program to kick-start its own primary care medical home initiative--patient-centered primary care homes (PCPCHs)--as part of the state's health care delivery system transformation efforts. Providers interested in becoming health homes had to obtain state-designed PCPCH certification. As an incentive, the state provided enhanced three-tiered PMPM payments for health home enrollees, with higher tiers for providers who had achieved a higher level of state-determined standards. The state withdrew its State Plan Amendment (SPA) in July 2014. Certified PCPCHs continue to provide health home-like services to all Medicaid beneficiaries, and to state employees who choose a PCPCH provider. |
| SPA Effective | October 1, 2011 - July 1, 2014 (SPA withdrawn date) |
| Eligibility | 2 chronic conditions, 1 chronic condition and at risk of another, SMI. Chronic Health conditions include:
SMI conditions include:
|
| Enrollment | 63,402 as of September 2013 |
| Delivery Model | Medical home-like: Health home services were coordinated through PCPCHs. |
| Providers | 236 providers statewide in September 2013 |
| Payment System & Reimbursement Level | PMPM care management fee based on provider qualification level:
|
| NOTE: Enrollment estimate and provider participation provided by CMS. AIDS = Acquired Immune Deficiency Syndrome | |
| Rhode Island's Mental Health Home Program at a Glance | |
|---|---|
| Program Description | Rhode Island built its health home program for beneficiaries with mental health conditions on long-established specialty provider system that had experience in care coordination and integration of health services with community supports, with the intent of improving and enhancing services already in place. Community Mental Health Organizations (CMHOs) have managed the care of adult Medicaid and Medicare enrollees and the uninsured with mental illness for more than 50 years and are viewed as integral parts of Rhode Island's health care system. |
| SPA Effective | October 1, 2011 |
| Eligibility | SMI, with a history of intensive psychiatric treatment and evidence of need for supports to remain in the community, including no or limited employment and poor social functioning. |
| Enrollment | 8,007 as of May 2016 |
| Delivery Model | Specialty provider-based: Health home services are delivered through CMHOs. |
| Providers | 8 provider agencies (6 CMHOs & 2 other mental health clinics) statewide as of May 2016 |
| NOTE: Enrollment estimate and provider participation provided by CMS. CMHO = Community Mental Health Organization | |
| Rhode Island's Health Home for CYSHCN at a Glance | |
|---|---|
| Program Description | Rhode Island operates a health home program for children and youth with special health care needs (CYSHCN), using well-established network of Comprehensive Evaluation, Diagnosis, Assessment, Referral, Re-evaluation (CEDARR) Family Centers with history of serving this population. |
| SPA Effective | October 1, 2011 |
| Eligibility | 2 chronic conditions, 1 chronic condition and at risk of another, SMI. Qualifying conditions include:
|
| Enrollment | 1,530 as of April 2016 |
| Delivery Model | Specialty provider-based: Services are coordinated through CEDARR Family Centers |
| Providers | 5 CEDARR Family Centers operating statewide as of April 2016 |
| Payment System & Reimbursement Level | FFS Fixed rates of $347, $366, or $397, depending on the service. Additional payments of either $9.50 or $16.63 made per quarter hour for 2 other services. |
| NOTE: Enrollment estimate and provider participation provided by CMS. CEDARR = Comprehensive Evaluation, Diagnosis, Assessment, Referral, Re-evaluation | |
| Missouri's Mental Health Home Program at a Glance | |
|---|---|
| Program Description | Missouri's mental health home program targets Medicaid beneficiaries with serious mental illness (SMI) or behavioral health conditions. Community mental health centers (CMHCs) located throughout the state serve all age ranges and provide psychiatric services, counseling, case management, crisis intervention, and housing support, among other services, integrated with primary care. Preliminary evaluation of data for one year before and after implementation of the Missouri mental health program indicated a 12.8% reduction in hospital admissions per 1,000 enrollees and an 8.2% reduction in emergency department use per 1,000 enrollees over a one-year period for health home enrollees, relative to the year prior to enrollment, amounting to an estimated $2.9 million in hospital cost savings. Across all services, the program generated total Medicaid savings of about $2.4 million relative to the year prior to enrollment for Medicaid-only enrollees and $9.8 million for dually eligible enrollees.* |
| SPA Effective | January 1, 2012 |
| Eligibility | SMI, SMI or substance use disorder and one other chronic condition, SMI or a substance use disorder and tobacco use. Qualifying conditions include:
|
| Enrollment | 25,036 enrollees as of May 2016 |
| Delivery Model | Specialty provider-based: Health home services are delivered through CMHCs |
| Providers | 26 CMHCs, with a total of 120 Clinics/Outreach Offices statewide as of May 2016 |
| Payment System & Reimbursement Level | PMPM care management fee set initially at $78.74. Rates are adjusted annually for cost of living increases. |
| NOTE: Enrollment estimate and provider participation provided by CMS. * Department of Mental Health and MO HealthNet. Progress Report: Missouri CMHC Healthcare Homes. November 1, 2013. http://dmh.mo.gov/docs/mentalillness/prnov13.pdf. BMI = Body Mass Index | |
| Missouri's Primary Care Health Home Program at a Glance | |
|---|---|
| Program Description | Missouri's primary care health home program targets beneficiaries with multiple chronic conditions. A preliminary evaluation of the program examining 1 year of data before and after implementation showed a 5.9% reduction in hospital admissions per 1,000 enrollees and a 9.7% reduction in emergency department use per 1,000 enrollees, relative to the year prior to enrollment. Estimated hospital cost savings for the state Medicaid program were more than $5.7 million. Across all services, the program generated total Medicaid savings of about $2 million relative to the year prior to enrollment.* |
| SPA Effective | January 1, 2012 |
| Eligibility | 2 chronic conditions, 1 chronic condition and at risk of another. Qualifying conditions include:
|
| Enrollment | 19,507 enrollees as of April 2016 |
| Delivery Model | Medical home-like: Participating providers include primary care practices, FQHCs, RHCs, hospital-operated primary care practices |
| Providers | 32 health home organizations statewide as of April 2016:
|
| Payment System & Reimbursement Level | PMPM care management fee set at $58.87. Rates are adjusted annually for cost of living increases. |
| NOTE: Enrollment estimate and provider participation provided by CMS. * MO HealthNet. Missouri Primary Care Health Homes: Interim Evaluation Review Summary. May 2014. https://www.health.ny.gov/health_care/medicaid/program/medicaid_health_homes/assessment_quality_measures/docs/mo_healthnet_primary_care_hh_interim_evaluation_report_summary.pdf BMI = Body Mass Index | |
| New York's Health Home Program at a Glance | |
|---|---|
| Program Description | New York's health home was rolled out in three geographically-based phases and ultimately covered Medicaid enrollees with chronic physical or behavioral conditions statewide. Health homes include a broad array of providers, termed by the state as "Virtual Health Homes." Each health home consists of a lead agency, responsible for administration and oversight, and downstream providers who provide care management and coordination to assigned beneficiaries. Lead agencies may be hospitals, health and human services agencies, home health agencies, and other entities. |
| SPA Effective | Phase One: January 1, 2012 Phase Two: April 1, 2012 Phase Three: July 1, 2012 |
| Eligibility | 2 chronic conditions, HIV/AIDS, or a SMI. Qualifying conditions include:
|
| Enrollment | 231, 543 enrollees as of March 2016 |
| Delivery Model | Care management network: Lead entity that assembles a network of provider partners who collectively have the expertise and capacity to coordinate and deliver all health home services. |
| Providers | 31 health homes statewide as of March 2016 |
| Payment System & Reimbursement Level | Initially, PMPM care management fee paid at 2 levels depending on enrollee status, and adjusted for case-mix and geography. The program later restructured its payment methodology to take into account a beneficiary functional status to better inform the acuity score and subsequently the payment rate. Three acuity risk bands--high, medium, and low--are based on an enrollee's medical and functional needs, with different payment rates for each band in proportion to the intensity of care health homes provide. |
| NOTE: Enrollment estimate and provider participation provided by CMS. AIDS = Acquired Immune Deficiency Syndrome | |
| Alabama's Health Home Program at a Glance | |
|---|---|
| Program Description | Alabama implemented its health home program in four geographic regions, comprising 21 counties, but expanded the program statewide through a State Plan Amendment (SPA) effective in April 2015.The state targets beneficiaries with physical and mental health chronic conditions and any beneficiary with one of the eligible conditions is automatically considered to be at risk for developing another chronic condition. A pre-existing care management program, known as the Patient Care Networks of Alabama (PCNA), delivers health home services. |
| SPA Effective | July 1, 2012 |
| Eligibility | 2 chronic conditions, 1 chronic condition and at risk of another, SMI. Qualifying conditions include:
|
| Enrollment | 220,253 enrollees as of May 2016 |
| Delivery Model | Care management network: Health home services are provided by PCNAs in collaboration with Medicaid-enrolled PMPs. PCNAs operate as independent, nonprofit entities that contract with the state and participating Medicaid providers to offer wraparound care management services for eligible beneficiaries. |
| Providers | 1 health home with 1,191 providers statewide as of May 2016 |
| Payment System & Reimbursement Level | PMPM care management fee. Rate for PCNAs is $9.50 and for rate for PMPs is $8.50. |
| NOTE: Enrollment estimate and provider participation provided by CMS. * Condition added through a SPA amendment in 2015. AIDS = Acquired Immune Deficiency Syndrome | |
| Iowa's Health Home Program at a Glance | |
|---|---|
| Program Description | Iowa's health home program targets Medicaid beneficiaries with chronic physical conditions and offers health home services to eligible members statewide. The state-developed tiered per member per month (PMPM) payment rates based on a patient's acuity, with patients in each subsequent tier having a higher number of chronic conditions, and requiring increased time to coordinate their care. Early results from the health home evaluation found that over the first 18 months of the health home program, the Medicaid program saved about $9 million.* |
| SPA Effective | July 1, 2012 |
| Eligibility | 2 chronic conditions, 1 chronic condition and at risk of another. Qualifying conditions include:
|
| Enrollment | 12,942 enrollees as of March 2016 |
| Delivery Model | Medical home-like: Any Medicaid-enrolled provider that meets health home standards can become a health home. Providers include primary care practices, CMHCs, FQHCs, and rural health centers. |
| Providers | 87 health homes statewide as of March 2016 |
| Payment System & Reimbursement Level | PMPM care management fee. PMPM fee varies by patient acuity tiers:
The state intended to implement an incentive pay based on achievement against 16 measures but the plans were delayed indefinitely due to technical difficulties with data collection. |
| NOTE: Enrollment estimate and provider participation provided by CMS. * Momany, E.T.; Nguyen-Hoang, P.; Damiano, P.C.; Bentler, S.E.; Shane, D.M. The University of Iowa Public Policy Center. Cost Analyses of the Iowa Medicaid Health Home Program. October 2014. http://ppc.uiowa.edu/sites/default/files/hh_cost_report.pdf. BMI = Body Mass Index | |
| Ohio's Health Home Program at a Glance | |
|---|---|
| Program Description | The health home program is a joint effort between Ohio Medicaid and the Ohio Department of Mental Health and Addiction Services. The state offers health home services to beneficiaries with serious and persistent mental illness (SPMI) and to children with serious emotional disturbance (SED) who receive care through qualifying Community Behavioral Health Centers (CBHCs). The program was initially implemented in 5 counties and expanded to additional 6 counties in 2014. Plans to expand statewide were postponed indefinitely. |
| SPA Effective | October 1, 2012 |
| Eligibility | SPMI, SMI, or SED |
| Enrollment | 12,341 enrollees as of April 2016 |
| Delivery Model | Specialty provider-based: Designated health home providers are CBHCs. |
| Providers | 7 health home providers in 11 counties as of April 2016 |
| Payment System & Reimbursement Level | PMPM care management fee. Site-specific and based on costs, ranging from $270.00-$400.00 PMPM. |
| NOTE: Enrollment estimate and provider participation provided by CMS. CBHC = Community Behavioral Health Center | |
| Wisconsin's Health Home Program at a Glance | |
|---|---|
| Program Description | Wisconsin's health home program targets individuals with a single chronic condition--HIV/AIDS--who have at least one other diagnosed chronic condition or are at risk of developing one. The state selected a single health home provider--AIDS Resource Center of Wisconsin (ARCW)--because of its extensive experience and capabilities to deliver comprehensive medical, behavioral, dental, and social services. Health home eligibility is limited to the categorically and medically needy in four noncontiguous counties in which ARCW operates. |
| SPA Effective | October 1, 2012 |
| Eligibility | HIV/AIDS and 1 other chronic condition or at risk of another chronic condition. |
| Enrollment | 283 enrollees as of December 2015 |
| Delivery Model | Specialty provider-based: AIDS service organizations, which are specialized HIV/AIDS service providers identified under Wisconsin statute, are the sole health home provider. |
| Providers | 1 AIDS service organization: ARCW, which has 3 locations and serves 4 counties in the state |
| Payment System & Reimbursement Level | PMPM care management fee of $102.95, plus annual flat fee $359.00 for beneficiary assessment, which may be billed annually if reassessment is required. |
| NOTE: Enrollment estimate and provider participation provided by CMS. AIDS = Acquired Immune Deficiency Syndrome | |
| Idaho's Health Home Program at a Glance | |
|---|---|
| Program Description | Idaho's health home program served Medicaid beneficiaries who had a serious and persistent mental illness (SPMI) or serious emotional disturbance (SED) and those had diabetes and asthma or were at risk for another chronic condition. The program used the state's existing Medicaid primary care case management program, Healthy Connections; any Healthy Connections provider who met state qualifications could become a health home. The state terminated the program in February 2016 and integrated health homes into a larger patient-centered medical home initiative focusing on broader populations and conditions, operating under a different Medicaid authority. |
| SPA Effective | January 1, 2013 - February 1, 2016 (SPA withdrawn date) |
| Eligibility | 2 chronic conditions, or 1 chronic condition and at risk of another, SMI, SED. Qualifying conditions include:
|
| Enrollment | 8,215 enrollees as of January 2016 |
| Delivery Model | Medical home-like: Health home services are delivered through Medicaid-enrolled PCPs who meets state criteria. |
| Providers | 400 PCPs at 48 service locations statewide |
| Payment System & Reimbursement Level | PMPM care management fee of $15.50. |
| NOTE: Enrollment estimate and provider participation provided by CMS. CMS = Centers for Medicare & Medicaid Services | |
| Maine's Health Home Program at a Glance | |
|---|---|
| Program Description | Maine's health home program for Medicaid beneficiaries with chronic physical conditions was implemented statewide, as part of an expansion of the state's pre-existing patient-centered medical home pilot. Health home providers are primary care practices that meet the state's established medical home criteria. They are required to contract with a Community Care Team (CCT) that provides wraparound clinical care management services for top 5% of high-risk, high-cost patients of a practice's patient panel. |
| SPA Effective | January 1, 2013 |
| Eligibility | 2 chronic conditions, 1 chronic condition and at risk of another. Qualifying conditions include:
|
| Enrollment | 51,794 enrollees as of May 2016 |
| Delivery Model | Care management network: Health home providers consist of Medicaid-enrolled PCPs who work with regional CCTs, which contract with multiple practices to provide wraparound care management to high-cost, high-risk patients. Entities that provide CCT services include hospitals, health systems, home health agencies, FQHCs, RHCs, primary care practices or groups of primary care practices, behavioral health organization, social service agencies, and/or other community-based entities. |
| Providers | 177 health home practices and 10 CCTs statewide as of May 2016 |
| Payment System & Reimbursement Level | PMPM care management fee. CCT receive $129.50 PMPM and PCPs receive $12.00 PMPM |
| NOTE: Enrollment estimate and provider participation provided by CMS. BMI = Body Mass Index | |
APPENDIX B. TECHNICAL APPENDIX
Matching Procedure and Outcomes
This section provides additional detail on the matching procedure used to create the analysis files and outcomes of the matching process. CEM reduces imbalance between treatment group members (health home enrollees) and comparisons to more accurately measure treatment effects. The software accomplishes reduced imbalance by sorting them into strata defined by the values of covariates the researcher selects. Strata may be automatically generated from the covariates by the program or defined by the researcher. Because we had large samples to work with and our initial provisional comparison group is the relatively diverse pool of all Medicaid enrollees meeting the basic criteria discussed in the text, we used fine categories (shown in Box B1) to assure that individuals within strata were as similar as possible. Broader strata produce more matches, but leave more within-cell variation.
| BOX B1: Matching Covariates |
|---|
|
Both health home enrollees and comparisons were discarded from the analysis sample if they did not fall into a stratum containing at least one treated case and comparison. As a result, the analysis sample excluded some enrollees. For our aim of measuring health home effects on the various outcomes, we felt a greater focus on balance between enrollees and comparisons was more important than preserving all enrollees. The software produces a statistic that indicates the overall imbalance remaining after matching that ranges from 0 (perfect balance) to 1 (complete separation).
| TABLE B1. Summary of CEM Matching Results for Reported Analyses | ||||||||
|---|---|---|---|---|---|---|---|---|
| Medicaid Only | Dually Eligible | |||||||
| Primary Care | CMHC | Primary Care | CMHC | |||||
| All | Enrolled >=9 Months | All | Enrolled >=9 Months | All | Enrolled >=9 Months | All | Enrolled >=9 Months | |
| Total strata generated | 5,386 | 5,111 | 6,714 | 6,200 | 7,160 | 6,950 | 8,163 | 7,796 |
| Matched strata | 1,624 | 1,300 | 1,702 | 1,409 | 1,686 | 1,266 | 1,686 | 1,396 |
| Number of comparisons | ||||||||
| Total | 158,136 | 158,136 | 158,136 | 158,136 | 64,546 | 64,546 | 64,546 | 64,546 |
| Matched | 145,392 | 136,399 | 138,119 | 119,979 | 52,115 | 47,672 | 28,396 | 18,861 |
| Unmatched | 12,744 | 21,737 | 20,017 | 38,157 | 12,431 | 16,874 | 36,150 | 45,685 |
| Percent unmatched | 8.1 | 13.7 | 12.7 | 24.1 | 19.3 | 26.1 | 56.0 | 70.8 |
| Number of enrollees | ||||||||
| Total | 10,818 | 7,093 | 12,320 | 8,182 | 7,083 | 4,793 | 7,757 | 5,517 |
| Matched | 9,792 | 6,403 | 9,324 | 5,900 | 6,438 | 4,372 | 5,742 | 4,016 |
| Unmatched | 1,026 | 690 | 2,996 | 2,282 | 645 | 421 | 2,015 | 1,501 |
| Percent unmatched | 9.5 | 9.7 | 24.3 | 27.9 | 9.1 | 8.8 | 26.0 | 27.2 |
| Global imbalance statistic | 0.005 | 0.005 | 0.003 | 0.003 | 0.014 | 0.012 | 0.005 | 0.003 |
Table B1 summarizes the outcome of the matching, including the total number of strata, the number of strata matched, and the number of comparisons and enrollees not matched and therefore excluded from the sample for each analysis we report. The total number of strata generated by the covariates ranged from 5,111 to 8,163, and the number of matched strata containing both comparisons and enrollees ranged from 1,266 to 1,702. The total number of potential comparisons was the same within the two eligibility types (Medicaid-only and dual) because all beneficiaries with the same eligibility type were potential matches. All potential comparisons and health home enrollees met the same Medicaid eligibility criteria discussed in the text. The CEM software selects only cases who are good matches for the joint distribution of characteristics of health home enrollees, so the percentage of comparison members who were unmatched was not a concern with such a broad initial pool of comparisons. In fact, for our aim of isolating and measuring effects on outcomes associated with health home enrollment, the number of unmatched health home members was not a concern, so long as the characteristics of the all health home enrollees were reasonably well represented by matched cases. For the enrollee samples, the unmatched percentages are roughly 9% for primary care health homes and 25% for CMHC health homes.
To explore the comparability of the health home enrollees retained after matching, we compared the characteristics of unmatched and matched enrollees to those of the full enrollee samples before matching and found that the profile of matched enrollees was far more similar to the full pool of enrollees in each health home and eligibility group. The notable differences were the proportion age 65 or older, the proportion not nonHispanic Black or White, and the proportion who were treated for SMI or SED in the base year.
A larger proportion of unmatched enrollees were age 65 or older except among dual primary care enrollees, who were more likely than unmatched cases to be in that age group (Figure B1). Unmatched cases were uniformly more likely than enrollees to be Hispanic or have other or unknown race/ethnicity (Figure B2). More pertinent to health care needs, unmatched cases were dramatically more likely than primary care health home enrollees to have had treatment for SMI or SED in the base year (Figure B3). They also were more likely to have one of these diagnoses than the full pool of CMHC enrollees, although differences were not as large. Given that Missouri generally assigns persons with SMI or SED to CHMC health homes, this result may seem to be an anomaly, but two explanatory factors may be relevant. First, some primary care health homes, particularly FQHCs, have co-located psychiatric and primary care services. Second, in auto-enrolling health home enrollees, the state attempted to assign enrollees to the providers who had been previously treating them.
| FIGURE B1. Percent of Health Home Enrollees Age 65+ |
|---|
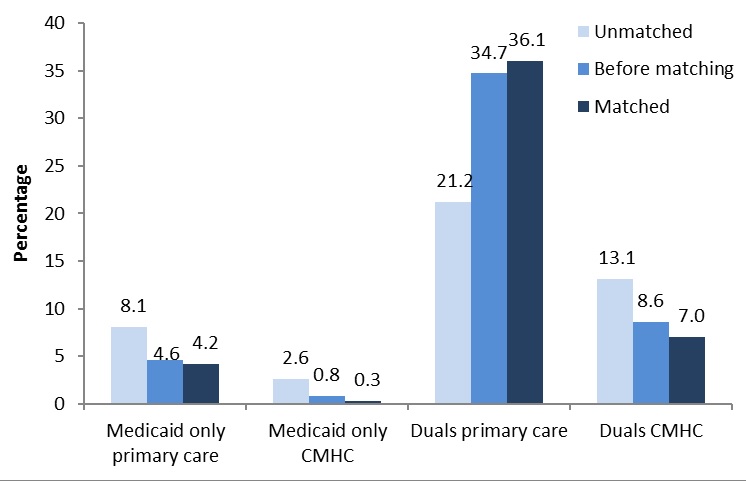 |
| FIGURE B2. Percent of Health Home Enrollees with Hispanic, Other, Unknown Race Ethnicity |
|---|
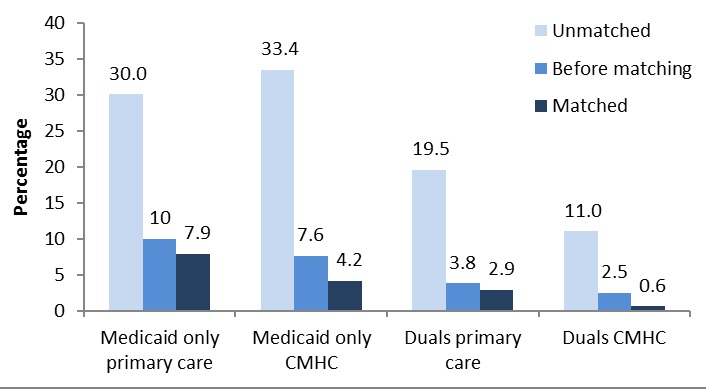 |
| FIGURE B3. Percent of Health Home Enrollees With a SMI/SED Diagnosis in Base Year |
|---|
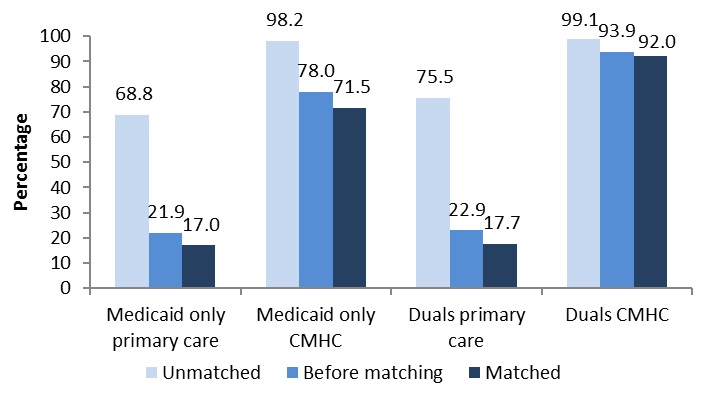 |
| TABLE B2. Means of Per Person Per Month Baseline Utilization and Spending Dually Eligible Comparisons and Health Home Enrollees | ||||||
|---|---|---|---|---|---|---|
| Primary Care Health Homes | CMHC Health Homes | |||||
| Unmatched | All | Matched | Unmatched | All | Matched | |
| Medicaid Only | ||||||
| Number of persons | 1,026 | 10,818 | 9,792 | 2,996 | 12,320 | 9,324 |
| Number of person months | 12,312 | 129,816 | 117,504 | 35,952 | 147,840 | 111,888 |
| Medicaid Total Spending | $2,092 | $1,270 | $1,184 | $2,790 | $2,049 | $1,811 |
| Total ER, inpatient, other facility | $475 | $240 | $215 | $595 | $333 | $250 |
| Total spending all other services | $1,617 | $1,030 | $969 | $2,196 | $1,716 | $1,561 |
| Dually Eligible | ||||||
| Number of persons | 645 | 7,083 | 6,438 | 2,015 | 7,757 | 5,742 |
| Number of person months | 7,740 | 84,996 | 77,256 | 24,180 | 93,084 | 68,904 |
| Medicaid Total Spending | $1,511 | $758 | $683 | $1,428 | $1,258 | $1,198 |
| Total ER, inpatient, other facility | $46 | $27 | $25 | $54 | $33 | $25 |
| Total spending all other services | $1,465 | $732 | $658 | $1,374 | $1,225 | $1,173 |
| Medicare Total Spending | $2,044 | $1,288 | $1,212 | $2,020 | $1,564 | $1,403 |
| Total ER, inpatient, other facility | $831 | $394 | $350 | $554 | $332 | $254 |
| Total spending all other services | $1,214 | $894 | $862 | $1,467 | $1,232 | $1,149 |
| SOURCE: Unweighted tabulations of Medicaid and Medicare claims in 2011 base year for matched, unmatched, and full samples of enrollees. | ||||||
As a final check, we also looked at unweighted tabulations of spending outcomes for all enrollees and for the samples of unmatched and matched enrollees (Table B2). As seen in Box B1, no baseline utilization or spending information beyond whether treatment had been received for the various conditions was used in the matching. We found that for all measures and all eligibility groups, spending aggregates for matched cases were considerably more similar to those for all enrollees, and that spending for unmatched cases was uniformly higher on all measures, further indicating that the unmatched cases differed in important ways from health home enrollees for which matched comparisons were found.
Detailed Tables
The following tables provide detailed results from the difference-in-differences models underlying the estimates in Table 5 and Table 6, including predicted per person per month utilization and spending in the base year (2011) and the two evaluation years for all outcome measures (2012-2013). Differences associated with health home enrollment are estimated effects from models including the full samples of health home enrollees and matched comparisons. Predictions are computed over only health home enrollees by turning off and on the parameters for health home enrollment, the two-time periods, and the interaction between time and health home enrollment to estimate differences associated with health home enrollment at baseline and in each of the two evaluation years relative to the base year.
| TABLE B3. Estimated Utilization and Spending for Medicaid Only Primary Care Health Home Enrollees and Health Home Effects Over the Evaluation Period | ||||||||||||||||
|---|---|---|---|---|---|---|---|---|---|---|---|---|---|---|---|---|
| Baseline Average Utilization and Spending (PMPM) | 2011 (base year) | 2012 | 2013 | Difference-in-Differences | ||||||||||||
| Not Health Home | Health Home | Not Health Home | Health Home | Not Health Home | Health Home | 2011-2012 | 2011-2013 | |||||||||
| Medicaid Utilization Outcomes | ||||||||||||||||
| Emergency Room Use | ||||||||||||||||
| Any ER use | 0.11 | 0.13 | 0.11 | 0.14 | 0.10 | 0.13 | 0.002 | 0.001 | ||||||||
| Average visits per month | 0.14 | 0.18 | 0.15 | 0.21 | 0.15 | 0.20 | 0.002 | 0.002 | ||||||||
| Average spending per month | $38 | $62 | $51 | $82 | $58 | $89 | -$1 | -$6 | ** | |||||||
| Inpatient Hospital Use | ||||||||||||||||
| Any inpatient hospital use | 0.03 | 0.03 | 0.03 | 0.03 | 0.03 | 0.03 | 0.000 | 0.002 | ||||||||
| Average admissions per month | 0.03 | 0.03 | 0.03 | 0.04 | 0.03 | 0.04 | 0.001 | 0.003 | * | |||||||
| Average days per month | 0.16 | 0.19 | 0.17 | 0.21 | 0.18 | 0.22 | 0.011 | 0.016 | ||||||||
| Average monthly spending | $140 | $165 | $149 | $186 | $159 | $205 | $10 | $18 | ||||||||
| Community LTSSa | ||||||||||||||||
| Any community LTSS use | 0.15 | 0.11 | 0.18 | 0.14 | 0.21 | 0.18 | 0.013 | ** | 0.027 | ** | ||||||
| Average monthly spending | $169 | $121 | $209 | $179 | $243 | $223 | $29 | ** | $49 | ** | ||||||
| Prescription Drugs | ||||||||||||||||
| Any Rx drug use | 0.71 | 0.75 | 0.77 | 0.81 | 0.75 | 0.80 | 0.015 | ** | 0.015 | ** | ||||||
| Average monthly spending | $415 | $438 | $481 | $531 | $515 | $560 | $23 | ** | $17 | * | ||||||
| Spending Outcomes | ||||||||||||||||
| Medicaid Total Spending | $1,097 | $1,259 | $1,257 | $1,464 | $1,374 | $1,601 | $23 | $25 | ||||||||
| Total ER, inpatient, other facility | $178 | $228 | $210 | $277 | $244 | $319 | $7 | $6 | ||||||||
| Total spending all other services | $914 | $1,029 | $1,047 | $1,184 | $1,134 | $1,285 | $6 | $8 | ||||||||
| Medicaid Spending Net of Health Home PMPMb | $1,097 | $1,259 | $1,257 | $1,422 | $1,375 | $1,555 | -$20 | -$22 | ||||||||
| Net spending all other services | $914 | $1,029 | $1,047 | $1,141 | $1,135 | $1,238 | -$38 | ** | -$39 | ** | ||||||
| SOURCE: Weighted analyses of Medicaid claims in 2011 base year for enrollees and matched comparisons using weights produced by the matching procedure. Probability of service use outcomes were estimated using logit regression, and continuous outcomes were estimated using Generalized Linear Modeling with a gamma distribution and log link. **(*) P = 0.01(0.05)
| ||||||||||||||||
| TABLE B4. Estimated Utilization and Spending for Medicaid Only Primary Care Health Home Enrollees with At Least 9 Months of Exposure and Health Home Effects Over the Evaluation Period | ||||||||||||||||
|---|---|---|---|---|---|---|---|---|---|---|---|---|---|---|---|---|
| Baseline Average Utilization and Spending (PMPM) | 2011 (base year) | 2012 | 2013 | Difference-in-Differences | ||||||||||||
| Not Health Home | Health Home | Not Health Home | Health Home | Not Health Home | Health Home | 2011-2012 | 2011-2013 | |||||||||
| Medicaid Utilization Outcomes | ||||||||||||||||
| Emergency Room Use | ||||||||||||||||
| Any ER use | 0.11 | 0.13 | 0.11 | 0.13 | 0.11 | 0.13 | 0.002 | -0.0003 | ||||||||
| Average visits per month | 0.14 | 0.17 | 0.15 | 0.19 | 0.15 | 0.19 | -0.001 | -0.003 | ||||||||
| Average spending per month | $38 | $60 | $51 | $79 | $60 | $85 | -$1 | -$9 | ** | |||||||
| Inpatient Hospital Use | ||||||||||||||||
| Any inpatient hospital use | 0.03 | 0.03 | 0.03 | 0.03 | 0.03 | 0.03 | 0.000 | 0.001 | ||||||||
| Average admissions per month | 0.03 | 0.03 | 0.03 | 0.04 | 0.03 | 0.04 | 0.001 | 0.002 | ||||||||
| Average days per month | 0.16 | 0.18 | 0.18 | 0.21 | 0.19 | 0.22 | 0.008 | 0.010 | ||||||||
| Average monthly spending | $145 | $156 | $161 | $183 | $172 | $202 | $10 | $17 | ||||||||
| Community LTSSa | ||||||||||||||||
| Any community LTSS use | 0.17 | 0.12 | 0.20 | 0.16 | 0.23 | 0.20 | 0.015 | ** | 0.031 | ** | ||||||
| Average monthly spending | $192 | $154 | $235 | $210 | $273 | $262 | $21 | ** | $43 | ** | ||||||
| Prescription Drugs | ||||||||||||||||
| Any Rx drug use | 0.74 | 0.78 | 0.79 | 0.85 | 0.78 | 0.82 | 0.018 | ** | 0.005 | * | ||||||
| Average monthly spending | $435 | $474 | $501 | $579 | $540 | $594 | $33 | ** | $6 | |||||||
| Spending Outcomes | ||||||||||||||||
| Medicaid Total Spending | $1,153 | $1,325 | $1,324 | $1,552 | $1,466 | $1,665 | $31 | -$19 | ||||||||
| Total ER, inpatient, other facility | $183 | $219 | $223 | $268 | $262 | $306 | $1 | -$7 | ||||||||
| Total spending all other services | $965 | $1,109 | $1,101 | $1,290 | $1,209 | $1,370 | $26 | -$19 | ||||||||
| Medicaid Spending Net of Health Home PMPMb | $1,154 | $1,325 | $1,324 | $1,493 | $1,466 | $1,603 | -$28 | -$82 | ** | |||||||
| Net spending all other services | $966 | $1,109 | $1,101 | $1,230 | $1,209 | $1,307 | -$35 | * | -$82 | ** | ||||||
| SOURCE: Weighted analyses of Medicaid claims in 2011 base year for enrollees and matched comparisons using weights produced by the matching procedure. Probability of service use outcomes were estimated using logit regression, and continuous outcomes were estimated using Generalized Linear Modeling with a gamma distribution and log link. **(*) P = 0.01(0.05)
| ||||||||||||||||
| TABLE B5. Estimated Utilization and Spending for Medicaid Only CMHC Health Home Enrollees and Health Home Effects Over the Evaluation Period | ||||||||||||||||
|---|---|---|---|---|---|---|---|---|---|---|---|---|---|---|---|---|
| Baseline Average Utilization and Spending (PMPM) | 2011 (base year) | 2012 | 2013 | Difference-in-Differences | ||||||||||||
| Not Health Home | Health Home | Not Health Home | Health Home | Not Health Home | Health Home | 2011-2012 | 2011-2013 | |||||||||
| Medicaid Utilization Outcomes | ||||||||||||||||
| Emergency Room Use | ||||||||||||||||
| Any ER use | 0.11 | 0.14 | 0.11 | 0.15 | 0.10 | 0.14 | 0.009 | ** | 0.007 | ** | ||||||
| Average visits per month | 0.15 | 0.19 | 0.16 | 0.23 | 0.16 | 0.23 | 0.025 | ** | 0.021 | ** | ||||||
| Average spending per month | $39 | $58 | $50 | $87 | $56 | $93 | $14 | ** | $10 | ** | ||||||
| Inpatient Hospital Use | ||||||||||||||||
| Any inpatient hospital use | 0.03 | 0.04 | 0.03 | 0.04 | 0.02 | 0.04 | 0.008 | ** | 0.007 | ** | ||||||
| Average admissions per month | 0.02 | 0.04 | 0.02 | 0.05 | 0.02 | 0.05 | 0.013 | ** | 0.014 | ** | ||||||
| Average days per month | 0.15 | 0.25 | 0.16 | 0.37 | 0.15 | 0.40 | 0.113 | ** | 0.151 | ** | ||||||
| Average monthly spending | $117 | $195 | $124 | $284 | $121 | $313 | $79 | ** | $111 | ** | ||||||
| Community LTSSa | ||||||||||||||||
| Any community LTSS use | 0.12 | 0.16 | 0.14 | 0.19 | 0.16 | 0.26 | -0.004 | 0.038 | ** | |||||||
| Average monthly spending | $100 | $134 | $128 | $179 | $145 | $199 | $8 | $5 | ||||||||
| Prescription Drugs | ||||||||||||||||
| Any Rx drug use | 0.72 | 0.81 | 0.76 | 0.85 | 0.73 | 0.84 | 0.020 | ** | 0.026 | ** | ||||||
| Average monthly spending | $441 | $744 | $487 | $824 | $503 | $877 | $4 | $30 | * | |||||||
| Spending Outcomes | ||||||||||||||||
| Medicaid Total Spending | $1,035 | $1,999 | $1,160 | $2,329 | $1,212 | $2,490 | $89 | ** | $147 | ** | ||||||
| Total ER, inpatient, other facility | $157 | $261 | $185 | $391 | $204 | $444 | $85 | ** | $105 | ** | ||||||
| Total spending all other services | $869 | $1,748 | $975 | $1,969 | $1,012 | $2,075 | $8 | $41 | * | |||||||
| Medicaid Spending Net of Health Home PMPMb | $1,035 | $2,000 | $1,160 | $2,273 | $1,213 | $2,420 | $31 | $77 | ** | |||||||
| Net spending all other services | $870 | $1,748 | $975 | $1,911 | $1,012 | $2,004 | -$50 | * | -$30 | |||||||
| SOURCE: Weighted analyses of Medicaid claims in 2011 base year for enrollees and matched comparisons using weights produced by the matching procedure. Probability of service use outcomes were estimated using logit regression, and continuous outcomes were estimated using Generalized Linear Modeling with a gamma distribution and log link. **(*) P = 0.01(0.05)
| ||||||||||||||||
| TABLE B6. Estimated Utilization and Spending for Medicaid Only CMHC Health Home Enrollees with At Least 9 Months of Exposure and Health Home Effects Over the Evaluation Period | ||||||||||||||||
|---|---|---|---|---|---|---|---|---|---|---|---|---|---|---|---|---|
| Baseline Average Utilization and Spending (PMPM) | 2011 (base year) | 2012 | 2013 | Difference-in-Differences | ||||||||||||
| Not Health Home | Health Home | Not Health Home | Health Home | Not Health Home | Health Home | 2011-2012 | 2011-2013 | |||||||||
| Medicaid Utilization Outcomes | ||||||||||||||||
| Emergency Room Use | ||||||||||||||||
| Any ER use | 0.11 | 0.14 | 0.11 | 0.14 | 0.11 | 0.14 | 0.004 | 0.002 | ||||||||
| Average visits per month | 0.15 | 0.20 | 0.17 | 0.23 | 0.17 | 0.22 | 0.011 | 0.007 | ||||||||
| Average spending per month | $41 | $62 | $53 | $87 | $60 | $94 | $7 | * | $2 | |||||||
| Inpatient Hospital Use | ||||||||||||||||
| Any inpatient hospital use | 0.03 | 0.04 | 0.03 | 0.04 | 0.03 | 0.04 | 0.006 | 0.005 | ||||||||
| Average admissions per month | 0.03 | 0.04 | 0.03 | 0.05 | 0.03 | 0.05 | 0.006 | ** | 0.006 | * | ||||||
| Average days per month | 0.16 | 0.29 | 0.17 | 0.35 | 0.17 | 0.37 | 0.049 | * | 0.072 | ** | ||||||
| Average monthly spending | $120 | $228 | $134 | $275 | $131 | $307 | $21 | $58 | ** | |||||||
| Community LTSSa | ||||||||||||||||
| Any community LTSS use | 0.14 | 0.21 | 0.16 | 0.24 | 0.19 | 0.31 | -0.005 | 0.040 | ||||||||
| Average monthly spending | $110 | $179 | $142 | $237 | $165 | $270 | $6 | $3 | ||||||||
| Prescription Drugs | ||||||||||||||||
| Any Rx drug use | 0.76 | 0.87 | 0.79 | 0.90 | 0.77 | 0.87 | 0.010 | -0.004 | ||||||||
| Average monthly spending | $498 | $924 | $541 | $971 | $557 | $962 | -$33 | -$71 | ** | |||||||
| Spending Outcomes | ||||||||||||||||
| Medicaid Total Spending | $1,125 | $2,472 | $1,260 | $2,689 | $1,319 | $2,700 | -$78 | -$197 | ||||||||
| Total ER, inpatient, other facility | $161 | $300 | $197 | $382 | $221 | $442 | $15 | $31 | ||||||||
| Total spending all other services | $954 | $2,191 | $1,067 | $2,346 | $1,104 | $2,282 | -$104 | ** | -$254 | ** | ||||||
| Medicaid Spending Net of Health Home PMPMb | $1,125 | $2,472 | $1,260 | $2,602 | $1,319 | $2,618 | -$166 | -$279 | ||||||||
| Net spending all other services | $954 | $2,191 | $1,067 | $2,257 | $1,105 | $2,199 | -$193 | ** | -$338 | ** | ||||||
| SOURCE: Weighted analyses of Medicaid claims in 2011 base year for enrollees and matched comparisons using weights produced by the matching procedure. Probability of service use outcomes were estimated using logit regression, and continuous outcomes were estimated using Generalized Linear Modeling with a gamma distribution and log link. **(*) P = 0.01(0.05)
| ||||||||||||||||
| TABLE B7. Estimated Utilization and Spending for Dually Eligible Primary Care Health Home Enrollees and Health Home Effects Over the Evaluation Period | ||||||||||||||||
|---|---|---|---|---|---|---|---|---|---|---|---|---|---|---|---|---|
| Baseline Average Utilization and Spending (PMPM) | 2011 (base year) | 2012 | 2013 | Difference-in-Differences | ||||||||||||
| Not Health Home | Health Home | Not Health Home | Health Home | Not Health Home | Health Home | 2011-2012 | 2011-2013 | |||||||||
| Medicaid Utilization Outcomes | ||||||||||||||||
| Community LTSSa | ||||||||||||||||
| Any community LTSS use | 0.34 | 0.29 | 0.38 | 0.33 | 0.40 | 0.36 | 0.001 | 0.010 | ** | |||||||
| Average monthly spending | $296 | $253 | $356 | $303 | $385 | $338 | -$1 | $8 | ||||||||
| Spending Outcomes | ||||||||||||||||
| Medicaid Total Spending | $721 | $728 | $773 | $699 | $870 | $773 | -$81 | ** | -$106 | ** | ||||||
| Total ER, inpatient, other facility | $17 | $33 | $27 | $24 | $64 | $52 | -$28 | ** | -$74 | ** | ||||||
| Total spending all other services | $711 | $703 | $748 | $681 | $799 | $721 | -$59 | ** | -$69 | ** | ||||||
| Medicare Total Spending | $1,395 | $1,191 | $1,565 | $1,390 | $1,646 | $1,471 | $55 | ** | $67 | ** | ||||||
| Total ER, inpatient, other facility | $360 | $320 | $439 | $421 | $481 | $471 | $33 | $46 | * | |||||||
| Total spending all other services | $1,028 | $865 | $1,130 | $975 | $1,172 | $1,016 | $24 | * | $30 | ** | ||||||
| Total Spending Medicaid and Medicare | $2,112 | $1,894 | $2,335 | $2,091 | $2,498 | $2,239 | -$3 | -$1 | ||||||||
| Total ER, inpatient, other facility | $374 | $349 | $467 | $443 | $554 | $523 | $7 | $6 | ||||||||
| Total spending all other services | $1,726 | $1,537 | $1,872 | $1,649 | $1,958 | $1,728 | -$18 | -$15 | ||||||||
| Medicaid Spending Net of Health Home PMPMb | $722 | $730 | $774 | $651 | $871 | $721 | -$130 | ** | -$159 | ** | ||||||
| Net spending all other services | $712 | $705 | $749 | $632 | $801 | $669 | -$108 | ** | -$123 | ** | ||||||
| Total Spending Net of Health Home PMPMb | $2,112 | $1,894 | $2,336 | $2,050 | $2,499 | $2,195 | -$44 | -$46 | ||||||||
| Net spending all other services | $1,727 | $1,537 | $1,873 | $1,609 | $1,959 | $1,684 | -$59 | ** | -$60 | ** | ||||||
| SOURCE: Weighted analyses of Medicaid and Medicare claims in 2011 base year for enrollees and matched comparisons using weights produced by the matching procedure. Probability of service use outcomes were estimated using logit regression, and continuous outcomes were estimated using Generalized Linear Modeling with a gamma distribution and log link. **(*) P = 0.01(0.05)
| ||||||||||||||||
| TABLE B8. Estimated Utilization and Spending for Dually Eligible Primary Care Health Home Enrollees with At Least 9 Months of Exposure and Health Home Effects Over the Evaluation Period | ||||||||||||||||
|---|---|---|---|---|---|---|---|---|---|---|---|---|---|---|---|---|
| Baseline Average Utilization and Spending (PMPM) | 2011 (base year) | 2012 | 2013 | Difference-in-Differences | ||||||||||||
| Not Health Home | Health Home | Not Health Home | Health Home | Not Health Home | Health Home | 2011-2012 | 2011-2013 | |||||||||
| Medicaid Utilization Outcomes | ||||||||||||||||
| Community LTSSa | ||||||||||||||||
| Any community LTSS use | 0.35 | 0.31 | 0.40 | 0.35 | 0.42 | 0.39 | 0.004 | 0.019 | ** | |||||||
| Average monthly spending | $313 | $277 | $374 | $333 | $406 | $374 | $2 | $8 | ||||||||
| Spending Outcomes | ||||||||||||||||
| Medicaid Total Spending | $713 | $729 | $769 | $704 | $871 | $771 | -$82 | ** | -$120 | ** | ||||||
| Total ER, inpatient, other facility | $15 | $29 | $26 | $17 | $63 | $42 | -$32 | ** | -$77 | ** | ||||||
| Total spending all other services | $704 | $706 | $744 | $695 | $801 | $732 | -$52 | ** | -$72 | ** | ||||||
| Medicare Total Spending | $1,431 | $1,160 | $1,598 | $1,357 | $1,683 | $1,438 | $62 | ** | $76 | ** | ||||||
| Total ER, inpatient, other facility | $372 | $305 | $449 | $398 | $495 | $453 | $32 | $51 | * | |||||||
| Total spending all other services | $1,051 | $849 | $1,154 | $961 | $1,195 | $1,000 | $29 | ** | $35 | ** | ||||||
| Total Spending Medicaid and Medicare | $2,138 | $1,866 | $2,365 | $2,068 | $2,536 | $2,207 | $4 | -$7 | ||||||||
| Total ER, inpatient, other facility | $385 | $333 | $476 | $411 | $567 | $486 | $0 | -$3 | ||||||||
| Total spending all other services | $1,743 | $1,527 | $1,892 | $1,652 | $1,982 | $1,728 | -$6 | -$9 | ||||||||
| Medicaid Spending Net of Health Home PMPMb | $714 | $730 | $770 | $643 | $2 | $706 | -$145 | ** | -$187 | ** | ||||||
| Net spending all other services | $705 | $707 | $745 | $633 | $803 | $666 | -$116 | ** | -$140 | ** | ||||||
| Total Spending Net of Health Home PMPMb | $2,138 | $1,866 | $2,365 | $2,015 | $2,536 | $2,150 | -$50 | -$46 | ||||||||
| Net spending all other services | $1,743 | $1,528 | $1,893 | $1,599 | $1,982 | $1,671 | -$60 | ** | -$66 | ** | ||||||
| SOURCE: Weighted analyses of Medicaid and Medicare claims in 2011 base year for enrollees and matched comparisons using weights produced by the matching procedure. Probability of service use outcomes were estimated using logit regression, and continuous outcomes were estimated using Generalized Linear Modeling with a gamma distribution and log link. **(*) P = 0.01(0.05)
| ||||||||||||||||
| TABLE B9. Estimated Utilization and Spending for Dually Eligible CMHC Health Home Enrollees and Health Home Effects Over the Evaluation Period | ||||||||||||||||
|---|---|---|---|---|---|---|---|---|---|---|---|---|---|---|---|---|
| Baseline Average Utilization and Spending (PMPM) | 2011 (base year) | 2012 | 2013 | Difference-in-Differences | ||||||||||||
| Not Health Home | Health Home | Not Health Home | Health Home | Not Health Home | Health Home | 2011-2012 | 2011-2013 | |||||||||
| Medicaid Utilization Outcomes | ||||||||||||||||
| Community LTSSa | ||||||||||||||||
| Any community LTSS use | 0.27 | 0.36 | 0.31 | 0.39 | 0.33 | 0.41 | -0.016 | ** | -0.012 | ** | ||||||
| Average monthly spending | $186 | $231 | $227 | $261 | $250 | $277 | -$21 | ** | -$34 | ** | ||||||
| Spending Outcomes | ||||||||||||||||
| Medicaid Total Spending | $679 | $1,567 | $716 | $1,563 | $799 | $1,579 | -$89 | ** | -$265 | ** | ||||||
| Total ER, inpatient, other facility | $17 | $34 | $35 | $32 | $79 | $75 | -$37 | ** | -$81 | ** | ||||||
| Total spending all other services | $665 | $1,553 | $681 | $1,554 | $706 | $1,515 | -$36 | * | -$135 | ** | ||||||
| Medicare Total Spending | $1,409 | $1,397 | $1,534 | $1,582 | $1,559 | $1,654 | $62 | ** | $109 | ** | ||||||
| Total ER, inpatient, other facility | $293 | $228 | $376 | $340 | $366 | $387 | $48 | ** | $104 | ** | ||||||
| Total spending all other services | $1,107 | $1,152 | $1,167 | $1,251 | $1,208 | $1,288 | $36 | ** | $31 | * | ||||||
| Total Spending Medicaid and Medicare | $2,094 | $2,735 | $2,267 | $2,941 | $2,360 | $3,034 | -$20 | -$48 | ||||||||
| Total ER, inpatient, other facility | $310 | $259 | $414 | $371 | $453 | $466 | $25 | $88 | ** | |||||||
| Total spending all other services | $1,771 | $2,466 | $1,858 | $2,585 | $1,923 | $2,597 | -$1 | -$80 | ** | |||||||
| Medicaid Spending Net of Health Home PMPMb | $679 | $1,568 | $716 | $1,491 | $799 | $1,492 | -$163 | ** | -$354 | ** | ||||||
| Net spending all other services | $665 | $1,554 | $681 | $1,481 | $707 | $1,426 | -$111 | ** | -$226 | ** | ||||||
| Total Spending Net of Health Home PMPMb | $2,095 | $2,736 | $2,267 | $2,884 | $2,360 | $2,965 | -$77 | * | -$118 | ** | ||||||
| Net spending all other services | $1,772 | $2,466 | $1,858 | $2,529 | $1,924 | $2,528 | -$58 | ** | -$149 | ** | ||||||
| SOURCE: Weighted analyses of Medicaid and Medicare claims in 2011 base year for enrollees and matched comparisons using weights produced by the matching procedure. Probability of service use outcomes were estimated using logit regression, and continuous outcomes were estimated using Generalized Linear Modeling with a gamma distribution and log link. **(*) P = 0.01(0.05)
| ||||||||||||||||
| TABLE B10. Estimated Utilization and Spending for Dually Eligible CMHC Health Home Enrollees with At Least 9 Months of Exposure and Health Home Effects Over the Evaluation Period | ||||||||||||||||
|---|---|---|---|---|---|---|---|---|---|---|---|---|---|---|---|---|
| Baseline Average Utilization and Spending (PMPM) | 2011 (base year) | 2012 | 2013 | Difference-in-Differences | ||||||||||||
| Not Health Home | Health Home | Not Health Home | Health Home | Not Health Home | Health Home | 2011-2012 | 2011-2013 | |||||||||
| Medicaid Utilization Outcomes | ||||||||||||||||
| Community LTSSa | ||||||||||||||||
| Any community LTSS use | 0.28 | 0.41 | 0.32 | 0.43 | 0.34 | 0.45 | -0.015 | ** | -0.014 | ** | ||||||
| Average monthly spending | $188 | $261 | $228 | $294 | $254 | $308 | -$23 | ** | -$43 | ** | ||||||
| Spending Outcomes | ||||||||||||||||
| Medicaid Total Spending | $676 | $1,781 | $711 | $1,746 | $791 | $1,695 | -$125 | ** | -$388 | ** | ||||||
| Total ER, inpatient, other facility | $18 | $35 | $36 | $20 | $85 | $59 | -$49 | ** | -$102 | ** | ||||||
| Total spending all other services | $659 | $1,761 | $673 | $1,748 | $697 | $1,648 | -$52 | * | -$214 | ** | ||||||
| Medicare Total Spending | $1,448 | $1,477 | $1,573 | $1,662 | $1,592 | $1,722 | $57 | * | $98 | |||||||
| Total ER, inpatient, other facility | $307 | $229 | $394 | $349 | $374 | $403 | $56 | ** | $126 | ** | ||||||
| Total spending all other services | $1,133 | $1,227 | $1,192 | $1,322 | $1,235 | $1,345 | $30 | * | $7 | |||||||
| Total Spending Medicaid and Medicare | $2,130 | $2,997 | $2,303 | $3,179 | $2,387 | $3,205 | -$62 | -$155 | ** | |||||||
| Total ER, inpatient, other facility | $325 | $261 | $434 | $369 | $466 | $465 | $21 | $91 | ** | |||||||
| Total spending all other services | $1,793 | $2,717 | $1,879 | $2,821 | $1,942 | $2,771 | -$26 | -$172 | ** | |||||||
| Medicaid Spending Net of Health Home PMPMb | $677 | $1,783 | $711 | $1,649 | $792 | $1,595 | -$225 | ** | -$491 | ** | ||||||
| Net spending all other services | $659 | $1,763 | $674 | $1,650 | $697 | $1,547 | -$152 | ** | -$317 | ** | ||||||
| Total Spending Net of Health Home PMPMb | $2,130 | $2,998 | $2,304 | $3,101 | $2,388 | $3,125 | -$141 | ** | -$236 | ** | ||||||
| Net spending all other services | $1,794 | $2,718 | $1,879 | $2,743 | $1,942 | $2,692 | -$104 | ** | -$252 | ** | ||||||
| SOURCE: Weighted analyses of Medicaid and Medicare claims in 2011 base year for enrollees and matched comparisons using weights produced by the matching procedure. Probability of service use outcomes were estimated using logit regression, and continuous outcomes were estimated using Generalized Linear Modeling with a gamma distribution and log link. **(*) P = 0.01(0.05)
| ||||||||||||||||
Evaluation of the Medicaid Health Home Option for Beneficiaries with Chronic Conditions
This report was prepared under contracts #HHSP23320100025WI and #HHSP23337001T between the U.S. Department of Health and Human Services (HHS), Office of Disability, Aging and Long-Term Care Policy (DALTCP) and the Urban Institute. For additional information about this subject, you can visit the DALTCP home page at http://aspe.hhs.gov/office-disability-aging-and-long-term-care-policy-daltcp or contact the ASPE Project Officer, Emily Rosenoff, at HHS/ASPE/DALTCP, Room 424E, H.H. Humphrey Building, 200 Independence Avenue, S.W., Washington, D.C. 20201. Her e-mail addresses is: Emily.Rosenoff@hhs.gov.
Reports Available
Evaluation of the Medicaid Health Home Option for Beneficiaries with Chronic Conditions: Final Annual Report - Base Year (December 2012)
- Full HTML Version https://aspe.hhs.gov/basic-report/evaluation-medicaid-health-home-option-beneficiaries-chronic-conditions-final-annual-report-base-year
- Full PDF Version https://aspe.hhs.gov/pdf-report/evaluation-medicaid-health-home-option-beneficiaries-chronic-conditions-final-annual-report-base-year
Evaluation of the Medicaid Health Home Option for Beneficiaries with Chronic Conditions: Annual Report - Year Two (June 2014)
- Full HTML Version https://aspe.hhs.gov/basic-report/evaluation-medicaid-health-home-option-beneficiaries-chronic-conditions-annualreport-year-two
- Full PDF Version https://aspe.hhs.gov/pdf-report/evaluation-medicaid-health-home-option-beneficiaries-chronic-conditions-annual-report-year-two
Evaluation of the Medicaid Health Home Option for Beneficiaries with Chronic Conditions: Annual Report - Year Three (July 2015)
- Full HTML Version https://aspe.hhs.gov/basic-report/evaluation-medicaid-health-home-option-beneficiaries-chronic-conditions-annual-report-year-three
- Full PDF Version https://aspe.hhs.gov/pdf-report/evaluation-medicaid-health-home-option-beneficiaries-chronic-conditions-annual-report-year-three
Evaluation of the Medicaid Health Home Option for Beneficiaries with Chronic Conditions: Progress and Lessons from the First States Implementing Health Home Programs, Annual Report - Year Four (April 2016)
- Full HTML Version https://aspe.hhs.gov/basic-report/evaluation-medicaid-health-home-option-beneficiaries-chronic-conditions-progress-and-lessons-first-states-implementing-health-home-programs-annual-report-year-four
- Full PDF Version https://aspe.hhs.gov/pdf-report/evaluation-medicaid-health-home-option-beneficiaries-chronic-conditions-progress-and-lessons-first-states-implementing-health-home-programs-annual-report-year-four
Evaluation of the Medicaid Health Home Option for Beneficiaries with Chronic Conditions: Evaluation of Outcomes of Selected Health Home Programs, Annual Report - Year Five (May 2017)
- Full HTML Version https://aspe.hhs.gov/basic-report/evaluation-medicaid-health-home-option-beneficiaries-chronic-conditions-evaluation-outcomes-selected-health-home-programs-annual-report-year-five
- Full PDF Version https://aspe.hhs.gov/pdf-report/evaluation-medicaid-health-home-option-beneficiaries-chronic-conditions-evaluation-outcomes-selected-health-home-programs-annual-report-year-five