
U.S. Department of Health and Human Services
Estimates of the Risk of Long-Term Care: Assisted Living and Nursing Home Facilities
Timothy A. Waidmann, Senior Research AssociateSeema Thomas, Research Assistant
Urban Institute
July 8, 2003
PDF Version: http://aspe.hhs.gov/daltcp/reports/2003/riskest.pdf (28 PDF pages)
This report was prepared under contract #HHS-100-97-0010 between the U.S. Department of Health and Human Services, Office of the Assistant Secretary for Planning and Evaluation, Office of Disability, Aging and Long-Term Care Policy and the Urban Institute. For additional information about the study, you may visit the DALTCP home page at http://aspe.hhs.gov/daltcp/home.htm or contact the ASPE Project Officer, William Marton, at HHS/ASPE/DALTCP, Room 424E, H.H. Humphrey Building, 200 Independence Avenue, SW, Washington, DC 20201. His e-mail address is: William.Marton@hhs.gov.
The authors acknowledge programming support from Carey McGilliard, and helpful comments from Korbin Liu and Hakan Aykan. The views expressed are those of the authors and should not be attributed to DALTCP or to the Urban Institute or its funders.
TABLE OF CONTENTS
General Analytic Framework
Data
Empirical Specification
Sample Description
Bivariate Comparison
Multivariate Models
Alternate Specifications
Summary
Limitations
LIST OF TABLES
TABLE 1. Baseline Summary Statistics for Community Dwellers, and Persons with Residential Transitions
TABLE 2. Bivariate Comparison of Residential Transition
TABLE 3. Multivariate Models of Residential Transition
TABLE A1. Alternative Specification for Disability Variables in Models of Residential Transition
INTRODUCTION
The importance of assisted living facilities (ALF) in meeting the long-term care needs of the older population has grown significantly in recent years. The companion report in this project describes the changes in the size and characteristics of the population using these facilities over the 1990s (Spillman, Liu & McGilliard 2002). That report finds a shift among ALF residents towards a population with greater care needs, suggesting a substitution of settings between ALFs--facilities that provide mainly supportive services--and nursing homes--facilities that specialize in more professional long-term care services. This substitution appears to be most active for persons with greater access to health and long-term care services, and less active for African Americans and lower income Americans. Differences in the way traditional nursing facilities and ALFs are treated by public programs like Medicaid may well explain these findings.
This report will examine the characteristics of persons entering assisted living and nursing facilities in a multivariate context to determine what factors are independently associated with the risk of moving from community dwelling to these settings, and whether the factors associated with ALF transitions are different from those associated with traditional nursing home admission. Broadly speaking, we seek to determine whether assisted living facilities can be considered an alternative type of institution to traditional nursing facilities, serving individuals with similar profiles, or whether an entirely different set of factors leads individuals to move to these settings. The findings of Spillman et al. suggest several characteristics on which the residents of the two types of settings differ, but because several of those characteristics are correlated with each other (e.g., race and income), a multivariate analysis is necessary to determine whether each of these factors have independent effects on admission to ALFs, or if one factor is responsible for other observed differences between the populations. In a second difference from the companion report, this report focuses on factors related specifically to entry in to facilities. Spillman et al. examine differences in the resident populations, a comparison that is affected by differential survival rates. Thus, observing that non-Hispanic Blacks are under-represented in one type of setting relative to another type could indicate differences in admissions rates, differences in survival once admitted, or a combination of the two. The hazard analysis we present in this report measures only admissions differences.
Numerous analyses show that large populations in nursing homes could potentially live in a lower level of care facility, primarily patients with fewer functional and medical needs (Spector 1996; Newcomer 2001). However, only a modicum of research exists on the utilization and characteristics of ALF entry, which lack a benchmark or control group (Fonda et al. 2002; Miller et al. 1999). Further, there is no consistent definition of what constitutes assisted living. Nonetheless, many consequential studies have analyzed risk factors associated with nursing home admission (Wolinsky et al. 1992, 1993; Tomiak et al 2000; Liu et al 1994). The goal of this paper is to determine factors associated with ALF use relative to those related to nursing home use. Because of the increasing use of ALFs, we need to understand the characteristics of users that increase their risk to admission, and possible policy implications.
METHODS
General Analytic Framework
The goal of this report is to identify the individual-level factors associated with nursing home and assisted living entry and determine whether and how they differ. While it is possible to estimate a simple model of entry into these facilities at some point in the observation period, a more useful model would make use of data on elapsed time until such a transition. Such a model makes better use of the data and differentiates delayed entry from early entry into a facility. Survival analysis is a natural candidate that allows us to build into our models several key features including right censoring and competing risks.
Using this model we estimate the time until an elderly person residing in the community enters a nursing home or an assisted living facility. It is assumed that the community-dwelling individual is at risk of entering one of these facilities until she dies. Individuals who die or leave the survey while still living in the community are considered "right censored," that is, their failure time does not fall in the observation period. In this framework, each type of residential transition is a competing risk with the other type, but the risks are assumed to be independent, in that the unobserved latent failure times for the two types of facilities are uncorrelated. Right censoring can be considered another category of competing risk.
We model the risk of residential transitions with a "hazard function," which gives the probability at any point in time that the individual will experience a transition of a particular type. The hazard functions, as described more completely below, incorporate a variety of individual level factors that either increase or decrease the risk of each type.
Following Andersen et al. (1983), the factors that influence transition risk (or the risk of any health care utilization) can be grouped into three categories: predisposing factors, enabling factors, and need factors. The goal of this analysis is to determine the relative importance of these types of factors for residential transitions, and whether the influence of these factors on nursing home risk differs from their influence on the risk of assisted living admission.
Data
The Medicare Current Beneficiary Survey. The MCBS is a continuous, multi-purpose survey of a representative sample of the Medicare population, including elderly and disabled persons living in the community and in institutions. In our analyses, we use the "Cost and Use" files from the 1992-1998 waves of the Medicare Current Beneficiary Survey (MCBS) supplemented with the baseline interviews conducted in the last 4 months of 1991. The MCBS is a multi-stage probability sample drawn from 107 primary sampling units representing the 50 states, the District of Columbia and Puerto Rico. Respondents are sampled from the Medicare enrollment file to be representative of the entire beneficiary population and the populations in each of seven age groups. Those under 65 (disabled workers) and over 85 were oversampled because of interest in the special health care needs of those beneficiaries. Each annual sample contains approximately 12,000 beneficiaries, of whom 10,000 are elderly (65+). The first round of MCBS interviews was conducted in 1991 to obtain baseline information on the initial sample. It is a rotating longitudinal panel survey that is replenished annually to account for attrition (deaths, disenrollment, refusal, etc.) so that each year's data file, when weighted, contains a representative cross-section of Medicare beneficiaries. By design, respondents who entered the sample in 1991, 1992 and 1993 were phased out of the sample after no more than 6 years, and those who entered the sample in 1994 and beyond were followed for 4 years only. Respondents are interviewed 3 times per year whether they reside in the community or a long-term care facility, using a questionnaire appropriate for the setting. More detailed information on the MCBS can be found elsewhere (Adler, 1994).
Dependent Variables. The outcomes on which we focus are the transitions of respondents between community and nursing home or assisted living residence. In particular we wish to model the time until such transitions take place. The MCBS follows respondents in and out of residential facilities, and at each interview obtains the exact dates at which living situations changed between interviews. This cleaned variable from the survey allows us to treat "survival time" as a continuous variable, measured to the day.
Independent Variables. In these analyses, we estimate the factors that predict transition from community residence to a nursing home and from community residence to assisted living facility. While we do not use it explicitly here, Andersen et al.'s (1983) model of health service use provides a useful framework for selecting individual risk factors. Predisposing factors in this framework include any possible propensities to the usage of nursing homes and assisted living facilities. These socio-demographic variables include gender, age, family structure type (indicating availability of caregivers), and race. The enabling factors are characteristics that determine whether an individual has the wherewithal to obtain health services. Under this heading we include education and income as two measures of affordability, and region as a measure of local area service availability. Finally, the need factors are the functional and health conditions that cause the individual to seek long-term care. We include selected functional characteristics by frequency and type. These included activities of daily living (ADLs and IADLs) and inabilities in basic functions, such as stooping and lifting objects. The six ADLs analyzed were bathing, dressing, toileting, eating, transferring (getting in and out of bed or chairs) and walking. The measures used in our analysis were created from MCBS questions and were defined as a person's inability to perform a specific activity independently or the use of assistance to perform an activity. The five IADL variables (telephoning, light housework, heavy housework, meal preparation and shopping) were defined as having any level of difficulty with the specified activity. The physical function limits (stooping/kneeling, lifting 10 lbs, reaching overhead, writing/picking up small objects, walking several blocks) were defined as having at least "some" difficulty (excluding "little" or "no" difficulty) with the task. Some of the fifteen chronic health conditions included were high blood pressure, heart disease, stroke, cancer, diabetes, arthritis, and mental disorders. Except for heart disease, which combines the responses to three questions (myocardial infarction, angina pectoris, or any other heart conditions) these variables indicate that a doctor has ever told the individual that they suffer from the condition named.
Empirical Specification
We estimate the parameters of two continuous time hazard functions of the form:
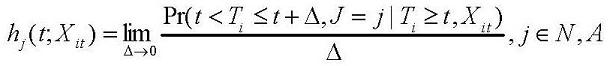 |
where hj(t;Xit) represents the instantaneous probability that person i will have a failure of type j (Nursing home or Assisted living facility admission) at time t given that she has survived without a failure of any type until time t, and given individual characteristics at time t, Xit. Maximum likelihood estimation techniques are used to estimate the parameters of this function. Estimation of the hazard function requires the specification of a functional form to explain how the hazard varies with time and explanatory variables. We specify the hazard as proportional to a baseline hazard. Thus, hj(t;Xi) = hj0(t)gj(Xit).
We use a Cox (1972) proportional hazards model in which the covariates (X) are allowed to vary over time through the relative hazard functions gj(Xit)=eX'itßj advantage of the Cox specification is that we do not have to make an assumption about the shape of the baseline hazard function, hj0(t), that, if wrong, can produce misleading results. The only assumption of the Cox model is that the shape of the baseline hazard is the same for all individuals in the sample.
The enabling and predisposing factors we include in the models are largely fixed (gender, race, education, and geography). Income, family structure and age are allowed to change, but these tend to show less intertemporal variability than do health and functional status variables. Coefficients on time-invariant variables represent average group differences in transition hazards, while coefficients on time-varying factors like disability can be interpreted as change in transition hazard faced by an individual who experiences an increased level of disability.
RESULTS
Sample Description
The pooled sample from the 1992-1998 files includes 19,670 unique Medicare beneficiaries over age 65. Table 1 describes the characteristics of the full sample at baseline, and characteristics of the portions of the sample that move to an ALF or a nursing home. Not surprisingly, persons making residential transitions were much more likely than the average study subject to be over age 75. As expected a substantial majority of the sample is female, a characteristic amplified in the subsample who have residential transitions. Approximately 12% of the sample is Hispanic or non-White, with African Americans making up the largest portion of this group. Approximately 71% of individuals in this study report incomes less than $25,000, and even larger fractions of those making transitions have incomes below this level, with nearly half of all persons entering nursing homes having incomes below $10,000 per year.1 About one sixth of the sample has an education less than 8th grade, and slightly more than half finished high school. Those making transitions had less education, on average. Family structure variables were created from marital status and the number of children variables for each sampled person. The term "not married" includes both widowed and divorced persons. The sampled population fell predominantly in married with children and not married with children, but persons making residential transitions were much less likely to be currently married than the sample as a whole. The sampled population resided primarily in a metropolitan area, though persons entering nursing homes were somewhat more likely than the average study subject to live in rural areas.
Numerous health and functional status variables were included as well. Most of the population who are first observed in the community had no ADL disabilities at their first observation, but persons making residential transitions had more ADL disabilities than average, and the most common ADL disability in each sample was walking across a room. This is true for both ALF entrants and NH entrants as well, although for NH entrants prevalence levels of each limitation are substantially higher than those for ALF entrants. IADL difficulties were somewhat more prevalent than ADL disabilities, with "heavy housework" being the most prevalent. As with ADL prevalence, IADL prevalence is higher in both individual items and average number of items among NH entrants ant among ALF entrants. Functional limitations had generally higher prevalence than either ADL or IADL difficulties, and NH and ALF entrants were more likely to be functionally limited than the average community dweller. As expected in older populations, about half the population has high blood pressure and half has osteoarthritis. Patterns of chronic disease among persons making residential transitions show higher prevalences of most conditions with stroke, Alzheimer's disease, psychiatric conditions, and hip fracture showing large relative differences from the average subject. Finally, about a quarter of the total sample--and more than a third of those with transitions--rated their overall health as fair or poor while.
Bivariate Comparisons
Table 2 presents the coefficients and corresponding relative risk ratios from hazard models in which individual variables (or groups of dummies for categorical variables) are entered in the model as the only independent variables. These coefficients represent unadjusted risk differentials between groups of Medicare beneficiaries. Comparing these differentials with those that remain after controlling for other variables illustrates how patterns of risk factors coincide and shows which simple differences are likely to be over or understated when estimated from these simple comparisons.
Age and Sex. As expected, the risk of transition is higher for older Medicare beneficiaries. The magnitude of elevated risk is much higher for nursing homes, where the risk among persons over 95 is 46 times the risk for persons under 75. The relative risk for ALF admission among persons over 95 is 16 times that for persons under 75. Before controlling for age, men face a lower risk of transition than women (81% for ALF and 73% for NH).
Race/Ethnicity. Our analysis indicates that members of the "Other" race category (Hispanics, Asians and others) have significantly lower risks of entering an assisted living facility than non-Hispanic Whites. For nursing home risk, there are no significant differences between race groups, though the "Other" category appears to have a lower risk of NH entry. Black beneficiaries face risk almost identical to that of Whites.
Income. Our analysis indicates that persons with lower current income have significantly higher risk of transition than persons with higher incomes, and this income gradient is more pronounced for nursing homes than for assisted living facilities. Compared to persons with incomes less than $10,000 per year, those with more than $50,000 per year face 21% of the risk of nursing home admission and 39% of the assisted living risk.
Education. While current income may not fully capture the availability of financial resources, especially in the form of assets, education provides a proxy for permanent income. Perhaps not surprisingly then, those with higher levels of education also face lower risk of transition. Those with at least a college degree face lower risks of ALF admission (65%) and NH admission (37%) compared to persons who did not complete 8th grade. However, without controlling for the effects of health, it is difficult to understand the effect of economic resources on the risk of residential transitions.
Family Structure. The presence of potential caregivers has a strong and statistically significant effect on the risk of transition. While the effects appear to be somewhat larger for nursing home risk than assisted living risk, these differences are not overwhelming. Persons who are not married and have no living children have 2.7 times the risk of ALF admission and 3.4 times the risk of NH admission than do married elders with children. The corresponding relative risks for unmarried elders with children are 1.9 and 2.7, and for married elders without children the relative risks are 1.8 (ALF) and 1.6 (NH).
Geography. Living in the Midwest census region is associated with elevated relative risk (RR) of both assisted living (RR=1.2) and nursing home admission (RR=1.5) relative to living in the northeast. There are no significant differences between the other three regions (northeast, south, and west). Finally, living in a rural area is associated with a slightly elevated risk of nursing home admission (RR=1.2), but no significant difference in ALF admission.
Multivariate Models
Table 3 presents coefficients and relative risks from a model in which all independent variables are entered simultaneously. Risk ratios reported here represent the differential that is attributable to each variable holding constant the other individual factors that influence transition risk.
Age and Sex. Age is still a strong and significant factor affecting risk even after controlling for other demographic factors, health and functional status. The relative risk associated with older age is larger in nursing home risk than in assisted living risk, with levels of risk elevation being at least twice as high for nursing homes than for assisted living facilities. Sex differentials observed in simple comparisons, however, are reversed when we control for other factors. Other factors being equal, men have a 23 percent higher risk of nursing home admission than women and a 47 percent higher risk of assisted living admission. Both of these estimated hazard ratios are statistically significant.
Race/Ethnicity. While African Americans do not show different raw risks of residential transition that are different from non-Hispanic Whites, after controlling for age, socioeconomic status and health, they have significantly lower risks. African Americans face 75 percent of the White risk of ALF admission and 69 percent of the risk of NH admission. The "Other" category includes Asian and Hispanic groups in addition to any others. We also estimated models where these categories were treated separately, but no significant effects were found since small numbers of persons in the categories make standard errors very large.
Income. We find that after controlling for health and demographic factors, the effect of income on ALF risk becomes small and statistically insignificant. For nursing home risk, however, the magnitude of the gradient is somewhat smaller, but it is still present and very significant. In the discussion below, we discuss possible implications of these findings.
Education. Controlling for health and demographic factors also changes the relationship between education and transition risk. While simple correlations of education and transitions show strong and statistically significant gradients similar to those observed for income, after controlling for health, these become small and insignificant.
Family Structure. The elevated risk faced by persons with fewer potential caregivers is still present and still significant after controlling for other factors. In magnitude, the relative risk of ALF admission is comparable to size of the raw differentials while the relative risks of nursing home admission for these individuals is noticeably smaller than in the raw comparisons. They are now more comparable to the ALF results.
Geography. The magnitudes of the relative risks estimated in the multivariate models are quite similar to those estimated in bivariate models. As in the bivariate comparisons, persons residing in rural areas face significantly higher NH risk than persons living in metropolitan areas but no significant difference in risk for entering an ALF.
Health and Disability Status. When we characterize the individual's disability profile by the number of ADLs, IADLs and functional limitations she has, a sensible pattern emerges. In particular, the probability of making a residential transition to either an ALF or a NH increases both with the number of ADL and the number of IADL difficulties experienced. In most cases the disability gradient is stronger for the risk of entering a nursing home than it is for entering assisted living. After controlling for ADL and IADL disability, however, the limitation of physical functioning has little predictive role in the risk of residential transitions.
Controlling for the functional aspects of health (disability), some differences emerge in the diseases that increase risks of ALF and NH entry, respectively. For assisted living facilities, the diseases with significant positive effects on risk are heart disease (p0.1), diabetes (p0.1), Alzheimer's disease, psychiatric/mental disorders, broken hip, Parkinson's disease (p0.1), and emphysema. The conditions that significantly increase the risk of nursing home entry also include diabetes, Alzheimer's, psychiatric disorders and Parkinson's (p0.1), but in addition, stroke also increase the risk of nursing home entry. Somewhat counterintuitively, however, high blood pressure, heart disease and osteoarthritis are associated with lower risk of nursing home entry. Finally, the respondents' assessment of their own health is significantly associated with the risk of a residential transition. Those in fair or poor health are 30 to 40 percent more likely to enter a facility than those in better health.
An important question is whether the two types of competing risks we have analyzed (NH and ALF) are behaviorally distinct, or are they interchangeable as a function of the covariates. Narendranathan and Stewart (1991) proposed a formal test of the hypothesis of behavioral equivalence, that amounts to a test of equality of the two vectors of coefficients. For the model presented , this test easily rejects the hypothesis of equivalence.2
Alternate Specifications
We also examined alternate specifications for functional health variables. In particular, we are interested in whether particular types of limitations are more likely to lead to residential transitions than others. In Table A1, we report only the coefficients on the functional health variables, though the models also included the full set of other covariates from Table 3. The first column in each panel replicates the numbers in Table 3. In the second specification we include specific items in place of item counts, and in the third specification, we include both counts and specific limitation items. When we do not include count variables, coefficients on individual items are occasionally surprising. For example, in the ALF model, the toileting and telephone items are associated with reduced risk of transitions, and the only ADL variable associated with elevated risk is the walking item. The remaining IADL items perform in expected ways. For the NH model, IADL items are as expected, but only bathing and dressing items show significant elevation in NH risk. The third specification gives somewhat more understandable results. In these models, the effects of individual items are estimated controlling for an overall level of disability burden. In this model, however, the importance of ADL disability is diminished relative to the model that only includes counts. There is no significant effect of any ADL measure on ALF risk, and in the NH model, the 3-6 ADL category is no longer a significant predictor of entering a nursing home. IADL measures seem to perform a little better, but the reduced risk estimate in the ALF model (relative to the count only model) for 3-5 IADL difficulties is still puzzling. One possible explanation is that the disability measures are highly collinear and in a sample with relatively few transitions, it is difficult to obtain precise estimates for a fully specified set of disability variables. This argues for the more parsimonious set of indicators presented in Table 3.
DISCUSSION
Summary
An important question posed at the beginning of the report was whether persons entering assisted living facilities were similar enough to those entering nursing homes to consider the two types of facilities substitutable in function, or are the populations entering these facilities substantially different, indicating that ALFs serve a different purpose. While we can reject the hypothesis that the determinants of the two types of transition are equivalent, the results of the foregoing analyses lend some support the notion that assisted living may substitute for nursing homes for some segment of the elderly population. There is some evidence that nursing homes are more likely to serve lower income and older populations and those experiencing the most severe disabilities. However, the health-related factors associated with the two types of transitions show as many similarities as differences.
The effects of controlling for demographic and health factors on the observed risk differentials for groups of elderly persons can be seen by comparing results in Table 2 and Table 3. Such a comparison demonstrates that a large portion of the age differentials are explained by differences in other covariates but that age is still an important independent risk factor for both types of transitions. We also find that the apparent tendency of men to remain in the community is reversed when we control for other demographic and health differences. Comparing tables further reveals that differences in other covariates masks the differential between African Americans (but not Hispanics) and non-Hispanic Whites. Income gradients for ALF admissions are eliminated when other factors are controlled for, but that they remain (albeit more weakly) for NH risks, and. education gradients for both types of residential settings are eliminated when we control for other factors. These comparisons show the persistent importance of the presence of potential caregivers, though for NH risk, the raw differentials appear to overstate the magnitude of these effects. Finally, the very small effect of geography on ALF risk and the somewhat larger effect on the risk of NH entry are unchanged when we control for other factors.
From the perspective of functional health, there is a great deal of similarity in the factors that predict entry into nursing homes and assisted living facilities, indicating that functional decline underlies both types of residential transition. Consistent with the findings of Spillman et al. (2003), there is evidence that persons experiencing more severe limitation (ADLs) are more likely to move to nursing facilities, but IADL decline predicted both types of transition in a similar fashion.
The types of chronic conditions that predict entry into nursing and assisted living facilities are similar, but they differ in perhaps understandable ways. For example, the effect of Alzheimer's disease (a complex and very disabling condition) is stronger for nursing home entry than for assisted living entry. On the other hand, effects for a condition with well-defined and perhaps temporary disability (broken hip) have a larger effect on assisted living entry than nursing home entry.
The most striking difference in the factors associated with the two settings is the difference in the effects of income. While simple bivariate comparisons indicate that low income is associated with higher risk of entering both types of facilities, the multivariate analyses indicate that the income gradient for assisted living facilities appears to be largely a function of other, mostly health-related factors, while income has an independent effect on nursing home entry. Two explanations for this difference seem plausible. First is the differential treatment of these care settings by Medicaid and other state long-term care programs. After controlling for health-related factors, finding that high income persons are significantly less likely to enter nursing homes suggests that high-need individuals who do not rely on Medicaid can make other choices, either assisted living or formal or informal home care. If this were the only factor, however, it is somewhat surprising that there is not an opposite gradient on assisted living transitions. Thus, another, and perhaps complementary explanation is that income differences also serve as a proxy for unobserved differences in need (e.g., health and functional status). So while higher income makes assisted living settings more affordable, it also may indicate a reduced need for them. At the same time, because of the definitional relationship between income and Medicaid eligibility, the direct impact of financial factors on nursing home entry overwhelm the indirect effects that work through unobserved health factors.
Limitations
Disentangling the effects of financial variables on nursing home and assisted living risks requires better data on income, assets, private long-term care insurance, and health care needs. Unfortunately, no single source of data provides these along with longitudinal data on residential transitions. One potential future source for such data is an effort currently underway at the Urban Institute to link data from Medicare and Medicaid claims with detailed assessment data. Until that effort is complete, however, other extensions of these analyses are possible.
Because the data available from CMS are not linked to geographic identifiers (state or county) our ability to control for the effects of local market area conditions is limited. Future studies could utilize these identifiers (available only on a restricted basis) to link to market indicators in the Area Resource File. In particular, being able to control for availability of and policies related to home and community based care would provide a test of the hypothesized substitutability of assisted living and home-based care.
The definition of assisted living facilities from the MCBS is problematic (see Spillman et al. 2003). For example, in Continuing Care Retirement Communities (CCRCs) we are unable to identify the level of care received by the respondent. Some sensitivity testing of our results to the definitions of facility types is possible with the current data, but it seems unlikely that measurement error problems can be entirely eliminated.
The size of the sample, the length of the sample period imposed by MCBS rotation rules, and the relative youth of assisted living both limit our ability to delve deeply into assisted living transitions. In particular, given the apparent age and disability severity differences between the two populations, it would be interesting to estimate the factors that spur moves from assisted living to nursing homes. Unfortunately, the MCBS samples we have used do not include enough of these transitions to support estimation of these types of models. Additionally, given the development of the market for assisted living, it would be interesting to estimate changes over time in the factors influencing transition rates. These analyses might answer questions of whether the need factors (disability and health profiles) that lead to ALF and NH transitions are becoming more or less similar over time. If they grow less similar, it may indicate a move from general substitutability of the two settings to a market where these facilities serve a more specialized niche of long-term care consumers. To these ends, adding more years of data may help, especially as the numbers of individuals in assisted living grows.
REFERENCES
Adler G.S. 1994. A profile of the Medicare Current Beneficiary Survey. Health Care Financing Review 15(4): 153-163, Summer.
Andersen R.M., McCutcheon A., Aday L., Chiu G.Y., Bell R. 1983. Exploring Dimensions of Access to Medical Care. Health Services Research 18: 49-73.
Cox, D.R. 1972. Regression Models and Life-tables (with discussion). Journal of the Royal Statistical Society, Series B 30: 248-275.
Fonda S., Clipp E., and Maddox G. 2002. Patterns in Functioning among Residents of an Affordable Assisted Living Housing Facility. The Gerontologist 42(2):178-187.
Liu K., McBride T., and Coughlin T. 1994. Risk of Entering Nursing Homes for Long Versus Short Stays. Medical Care 32(4): 315-327.
Miller M., Longino C., Anderson R., James M., and Worley A. 1999. Functional Status, Assistance, and the Risk of a Community-Based Move. The Gerontologist 39(2): 187-200.
Narendranathan W., and Stewart, M.B. 1991. Testing the Proportionality of Cause-Specific Hazards in Competing Risk Models. Oxford Bulletin of Economics and Statistics 53, 331-340.
Newcomer R., Swan J., Karon S., Bigelow W., Harrington C., and Zimmerman D. 2001. Residential Care Supply and Cognitive and Physical Problem Case Mix in Nursing Homes. Journal of Aging and Health 13(2): 217-247.
Spector W., Reschovsky J., and Cohen J. 1996. Appropriate Placement of Nursing-Home Residents in Lower Levels of Care. The Milbank Quarterly 74(1): 139-160.
Spillman, B., K. Liu, and C. McGilliard. 2003. Trends in Residential Long-Term Care: Use of Nursing Homes and Assisted Living And Characteristics of Facilities and Residents. Final Report prepared for the Office of Disability, Aging and Long-Term Care Policy, OASPE, U.S. HHS. [http://aspe.hhs.gov/daltcp/reports/2002/rltct.htm]
Tomiak M., Berthelot J., Guimond E., and Mustard C. 2000. Factors Associated with Nursing-Home Entry for Elders in Manitoba, Canada. Journal of Gerontology 55A(5): 279-287.
Wolinsky F., Callahan C., Fitzgerald J., and Johnson R. 1992. The Risk of Nursing Home Placement and Subsequent Death Among Older Adults. The Gerontologist 47(4): 173-182.
Wolinsky F., Callahan C., Fitzgerald J., and Johnson R. 1993. Changes in Functional Status and the Risks of Subsequent Nursing Home Placements and Death. The Gerontologist 48(3): 93-101.
NOTES
-
Income was imputed by MCBS using bracketed responses when the exact amount was not given by respondent.
-
The test statistic proposed is
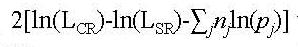
where ln(LCR) is the sum of the log likelihood values from the two competing risk models and ln(LSR) is the log likelihood from the shared risk model which assumes the two risks are behaviorally equivalent. The statistic is distributed Chi-squared with degrees of freedom equal to the number of coefficients in the model.
| TABLE 1. Baseline Summary Statistics for Community Dwellers, and Persons with Residential Transitions | |||
| Factors | All Baseline CommunityResidents | Persons Entering ALF | Persons Entering NH |
| N | 19,670 | 709 | 907 |
| AGE | |||
| 65-74 | 44.9% | 14.7% | 10.0% |
| 75-84 | 40.1% | 46.1% | 48.6% |
| 85-94 | 14.2% | 36.4% | 36.5% |
| 95 & greater | 0.9% | 2.8% | 4.9% |
| GENDER | |||
| Male | 40.5% | 35.5% | 32.6% |
| Female | 59.5% | 64.5% | 67.4% |
| RACE | |||
| White | 87.7% | 89.1% | 88.6% |
| Black | 8.6% | 8.5% | 8.8% |
| Hispanic | 1.0% | 0.8% | 0.2% |
| Asian | 0.4% | 0.3% | 0.0% |
| Other | 2.3% | 1.3% | 2.3% |
| INCOME | |||
| Less than $10,000 | 29.3% | 36.4% | 49.7% |
| $10,000-$25,000 | 41.8% | 42.3% | 35.5% |
| $25,000-$50,000 | 20.3% | 15.5% | 7.4% |
| Greater than $50,000 | 6.9% | 3.9% | 2.9% |
| EDUCATION | |||
| Less than 8th grade | 16.4% | 20.5% | 23.4% |
| 8th grade | 11.5% | 16.4% | 19.2% |
| 9th to 11th grade | 15.6% | 14.2% | 16.1% |
| 12th grade | 30.0% | 26.9% | 24.5% |
| Some college | 13.6% | 12.0% | 10.5% |
| More than college | 13.0% | 10.0% | 6.4% |
| FAMILY STRUCTURE | |||
| Married with kids | 48.0% | 27.5% | 24.8% |
| Married without kids | 3.5% | 3.8% | 3.1% |
| Not married with kids | 39.8% | 54.9% | 55.8% |
| Not married without kids | 8.7% | 13.8% | 16.2% |
| REGION | |||
| Northeast | 20.7% | 20.7% | 18.3% |
| Midwest | 23.9% | 26.8% | 31.3% |
| South | 35.8% | 33.4% | 35.0% |
| West | 19.3% | 20.6% | 16.8% |
| METROPOLITAN | |||
| City | 71.7% | 73.8% | 64.5% |
| Rural | 26.6% | 26.0% | 32.0% |
| NUMBER OF ADLS | |||
| 0 ADLs | 68.2% | 43.2% | 30.2% |
| 1-2 ADLs | 20.8% | 32.6% | 31.8% |
| 3-6 ADLs | 11.0% | 24.3% | 38.0% |
| ADL DISABILITY | |||
| Bathe | 13.8% | 31.9% | 47.6% |
| Walk | 26.8% | 47.2% | 59.3% |
| Chair | 14.6% | 27.1% | 38.4% |
| Dress | 8.1% | 19.6% | 29.8% |
| Toilet | 6.4% | 13.7% | 25.9% |
| Eat | 3.4% | 6.2% | 10.8% |
| NUMBER OF IADLS | |||
| 0 IADLs | 63.9% | 35.7% | 28.6% |
| 1-2 IADLs | 24.2% | 33.9% | 38.1% |
| 3-5 IADLs | 11.9% | 30.5% | 33.3% |
| IADL DIFFICULTY | |||
| Telephone | 8.4% | 16.4% | 32.6% |
| Light Housework | 12.1% | 27.5% | 30.7% |
| Heavy Housework | 31.4% | 56.0% | 49.3% |
| Preparing Meals | 10.0% | 26.4% | 28.6% |
| Shopping | 16.2% | 39.6% | 56.1% |
| NUMBER OF FUNCTIONAL LIMITATIONS | |||
| 0 FLs | 49.2% | 28.9% | 27.8% |
| 1-2 FLs | 22.2% | 26.1% | 19.5% |
| 3-5 FLs | 28.6% | 45.0% | 52.7% |
| FUNCTIONAL LIMITATIONS | |||
| Difficult to stoop | 43.5% | 60.9% | 65.3% |
| Difficult to lift | 31.1% | 48.4% | 54.1% |
| Difficult to reach | 30.1% | 46.5% | 54.6% |
| Difficult to write | 30.0% | 47.8% | 55.0% |
| Difficult to walk | 32.4% | 51.5% | 55.2% |
| CHRONIC CONDITIONS | |||
| High blood pressure | 49.6% | 55.0% | 49.4% |
| Heart disease | 34.3% | 45.6% | 39.0% |
| Stroke | 9.7% | 15.9% | 22.6% |
| Cancer | 16.7% | 17.5% | 18.4% |
| Diabetes | 14.1% | 18.1% | 19.3% |
| Rheumatoid arthritis | 10.3% | 13.3% | 12.8% |
| Osteoarthritis | 50.0% | 61.5% | 49.3% |
| Mental retardation | 0.3% | 0.4% | 0.6% |
| Alzheimer's | 2.1% | 7.2% | 11.2% |
| Psychiatric | 2.3% | 4.8% | 5.3% |
| Osteoporosis | 9.2% | 15.7% | 11.6% |
| Broken hip | 4.2% | 11.0% | 10.7% |
| Parkinson's | 1.4% | 3.2% | 4.4% |
| Emphysema | 11.7% | 15.9% | 10.3% |
| Paralysis | 4.2% | 4.4% | 10.0% |
| SELF-RATED HEALTH | |||
| Good | 76.2% | 66.6% | 60.9% |
| Fair/Poor | 23.8% | 33.4% | 39.1% |
| TABLE 2. Bivariate Comparison of Residential Transition | ||||
| Factors | ALF | NH | ||
| Hazard Ratio | z | Hazard Ratio | z | |
| AGE relative to 65-74 | ||||
| 75-84 | 3.24 *** | 11.45 | 6.51 *** | 14.53 |
| 85-94 | 8.00 *** | 19.88 | 18.56 *** | 22.68 |
| 95 & greater | 16.45 *** | 15.57 | 46.07 *** | 22.32 |
| GENDER relative to female | ||||
| Male | 0.81 *** | -2.99 | 0.73 *** | -4.60 |
| RACE/ETHNICITY relative to White | ||||
| Black | 0.98 | -0.21 | 1.00 | -0.02 |
| Other | 0.55 *** | -2.66 | 0.76 | -1.35 |
| INCOME relative to $0-$10,000 | ||||
| $10,000-$25,000 | 0.73 *** | -4.11 | 0.49 *** | -10.50 |
| $25,000-$50,000 | 0.51 *** | -6.37 | 0.26 *** | -11.64 |
| Greater than $50,000 | 0.39 *** | -5.05 | 0.21 *** | -6.98 |
| EDUCATION less than 8th grade | ||||
| 8th grade | 1.30 ** | 2.34 | 1.16 | 1.52 |
| 9th to 11th grade | 0.80 * | -1.88 | 0.74 *** | -2.96 |
| 12th grade | 0.71 *** | -3.48 | 0.56 *** | -6.35 |
| Some college | 0.71 *** | -2.74 | 0.52 *** | -5.47 |
| More than college | 0.65 *** | -3.38 | 0.37 *** | -7.27 |
| FAMILY STRUCTURE relative to Married with kids | ||||
| Married without kids | 1.78 *** | 2.91 | 1.59 ** | 2.37 |
| Not married with kids | 1.90 *** | 8.37 | 2.70 *** | 13.19 |
| Not married without kids | 2.73 *** | 8.85 | 3.37 *** | 11.87 |
| REGION relative to Northeast | ||||
| Midwest | 1.20 * | 1.82 | 1.55 *** | 4.70 |
| South | 1.05 | 0.48 | 1.04 | 0.45 |
| West | 1.16 | 1.44 | 1.01 | 0.12 |
| METROPOLITAN relative to city | ||||
| Rural | 0.95 | -0.63 | 1.16 ** | 2.10 |
| * p 0.1 ** p 0.05 *** p 0.01 | ||||
| TABLE 3. Multivariate Models of Residential Transition | ||||
| Factors | ALF | NH | ||
| Hazard Ratio | z | Hazard Ratio | z | |
| AGE relative to 65-74 | ||||
| 75-84 | 2.34 *** | 6.92 | 4.65 *** | 10.01 |
| 85-94 | 3.60 *** | 9.52 | 8.30 *** | 13.29 |
| 95 & greater | 5.77 *** | 7.74 | 13.63 *** | 12.39 |
| GENDER relative to female | ||||
| Male | 1.46 *** | 4.00 | 1.24 ** | 2.41 |
| RACE/ETHNICITY relative to White | ||||
| Black | 0.75 ** | -1.98 | 0.69 *** | -2.83 |
| Other | 0.55 ** | -2.23 | 0.78 | -1.16 |
| INCOME relative to $0-$10,000 | ||||
| $10,000-$25,000 | 0.90 | -1.09 | 0.75 *** | -3.29 |
| $25,000-$50,000 | 0.96 | -0.33 | 0.62 *** | -3.21 |
| Greater than $50,000 | 0.84 | -0.73 | 0.47 *** | -2.68 |
| EDUCATION less than 8th grade | ||||
| 8th grade | 0.99 | -0.08 | 1.11 | 0.93 |
| 9th to 11th grade | 0.76 ** | -1.97 | 1.16 | 1.28 |
| 12th grade | 0.90 | -0.86 | 1.17 | 1.40 |
| Some college | 0.78 * | -1.65 | 1.12 | 0.82 |
| More than college | 0.76 * | -1.67 | 0.74 * | -1.70 |
| FAMILY STRUCTURE relative to Married with kids | ||||
| Married without kids | 1.49 * | 1.76 | 1.10 | 0.39 |
| Not married with kids | 1.93 *** | 5.99 | 1.42 *** | 3.45 |
| Not married without kids | 2.22 *** | 5.64 | 1.96 *** | 5.39 |
| REGION relative to Northeast | ||||
| Midwest | 1.17 | 1.34 | 1.57 *** | 4.27 |
| South | 0.96 | -0.37 | 1.13 | 1.16 |
| West | 1.16 | 1.25 | 1.25 * | 1.91 |
| METROPOLITAN relative to city | ||||
| Rural | 0.89 | -1.25 | 1.19 ** | 2.21 |
| NUMBER OF ADLS relative to 0 ADLs | ||||
| 1-2 ADLs | 1.32 *** | 2.58 | 1.76 *** | 5.15 |
| 3-6 ADLs | 1.45 *** | 2.66 | 2.46 *** | 7.03 |
| NUMBER OF IADLS relative to 0 IADLs | ||||
| 1-2 IADLs | 1.71 *** | 4.80 | 1.63 *** | 3.91 |
| 3-5 IADLs | 2.06 *** | 5.07 | 2.73 *** | 7.41 |
| NUMBER OF FUNCTIONAL LIMITS relative to 0 FLs | ||||
| 1-2 Limitations | 1.23 * | 1.73 | 1.01 | 0.11 |
| 3-5 Limitations | 1.16 | 1.22 | 1.16 | 1.24 |
| CHRONIC CONDITIONS | ||||
| High blood pressure | 0.95 | -0.64 | 0.83 ** | -2.47 |
| Heart disease | 1.15 * | 1.69 | 0.86 ** | -1.99 |
| Stroke | 1.17 | 1.44 | 1.37 *** | 3.34 |
| Cancer | 0.92 | -0.80 | 1.04 | 0.49 |
| Diabetes | 1.18 * | 1.65 | 1.25 ** | 2.40 |
| Rheumatoid arthritis | 0.89 | -1.10 | 1.05 | 0.49 |
| Osteoarthritis | 1.01 | 0.10 | 0.73 *** | -4.06 |
| Mental retardation | 0.62 | -0.79 | 0.76 | -0.60 |
| Alzheimer's | 1.57 *** | 3.03 | 2.72 *** | 8.91 |
| Psychiatric | 1.53 ** | 2.52 | 1.54 *** | 3.03 |
| Osteoporosis | 0.98 | -0.16 | 0.86 | -1.46 |
| Broken hip | 1.48 *** | 3.10 | 1.08 | 0.68 |
| Parkinson's | 1.43 * | 1.75 | 1.38 * | 1.88 |
| Emphysema | 1.25 ** | 2.19 | 0.85 | -1.48 |
| Paralysis | 0.78 | -1.40 | 1.05 | 0.39 |
| HEALTH CONDITION relative to Good Health | ||||
| Fair/Poor | 1.40 *** | 3.76 | 1.29 *** | 3.17 |
| * p 0.1 ** p 0.05 *** p 0.01 | ||||
| TABLE A1. Alternative Specification for Disability Variables in Models of Residential Transition | ||||||
| Assisted Living | Transition Risk | Hazard Ratio | Nursing Home | Transition Risk | Hazard Ratio | |
| ADL (1-2) | 1.32 *** | 1.02 | 1.76 *** | 1.60 ** | ||
| ADL (3-6) | 1.45 *** | 0.97 | 2.46 *** | 1.43 | ||
| Bathing | 1.15 | 1.17 | 1.25 * | 1.13 | ||
| Walking (room) | 1.28 ** | 1.24 | 1.05 | 0.81 | ||
| Transfer | 1.16 | 1.18 | 1.02 | 1.05 | ||
| Dressing | 0.93 | 0.96 | 1.29 ** | 1.35 ** | ||
| Toileting | 0.79 * | 0.81 | 1.09 | 1.20 | ||
| Eating | 0.94 | 0.96 | 0.82 | 0.84 | ||
| IADL (1-2) | 1.71 *** | 1.78 *** | 1.63 *** | 2.00 *** | ||
| IADL (3-5) | 2.06 *** | 1.35 | 2.73 *** | 2.39 *** | ||
| Telephone | 0.79 * | 0.73 ** | 1.31 *** | 1.18 | ||
| Lt. Housework | 0.92 | 1.06 | 0.94 | 0.96 | ||
| Hvy. Housework | 1.42 *** | 0.92 | 1.48 *** | 0.90 | ||
| Prepare Meals | 1.39 ** | 1.58 *** | 1.41 *** | 1.35 ** | ||
| Shopping | 1.35 ** | 1.33 ** | 1.88 *** | 1.52 *** | ||
| Function (1-2) | 1.23 * | 0.88 | 1.01 | 0.85 | ||
| Function (3-5) | 1.16 | 0.32 * | 1.16 | 0.65 | ||
| Stooping | 1.07 | 1.21 | 1.03 | 1.10 | ||
| Lifting | 0.94 | 1.24 | 1.34 | 1.46 * | ||
| Reaching | 1.03 | 1.43 | 0.87 | 0.93 | ||
| Writing | 0.87 | 1.12 | 0.86 | 0.90 | ||
| Walking (blocks) | 1.27 | 1.52 ** | 1.15 | 1.25 | ||
| NOTE: All models also control for other covariates listed in Table 3.* p 0.1 ** p 0.05 *** p 0.01 | ||||||
REPORTS AVAILABLE
Estimates of the Risk of Long-Term Care: Assisted Living and Nursing Home Facilities
Full HTML Version http://aspe.hhs.gov/daltcp/reports/2003/riskest.htm
Full PDF Version http://aspe.hhs.gov/daltcp/reports/2003/riskest.pdf
Trends in Residential Long-Term Care: Use of Nursing Homes and Assisted Living and Characteristics of Facilities and Residents
Full HTML Version http://aspe.hhs.gov/daltcp/reports/2002/rltct.htm
Full PDF Version http://aspe.hhs.gov/daltcp/reports/2002/rltct.pdf
To obtain a printed copy of this report, send the full report title and your mailing information to:
U.S. Department of Health and Human ServicesOffice of Disability, Aging and Long-Term Care PolicyRoom 424E, H.H. Humphrey Building200 Independence Avenue, S.W.Washington, D.C. 20201FAX: 202-401-7733Email: webmaster.DALTCP@hhs.gov
RETURN TO:
Office of Disability, Aging and Long-Term Care Policy (DALTCP) Home [http://aspe.hhs.gov/_/office_specific/daltcp.cfm]Assistant Secretary for Planning and Evaluation (ASPE) Home [http://aspe.hhs.gov]U.S. Department of Health and Human Services Home [http://www.hhs.gov]