
Stacy Dale and Randall Brown
Mathematica Policy Research, Inc.
May 2005
This report was prepared under contract HHS-100-95-0046 between the U.S. Department of Health and Human Services (HHS), Office of Disability, Aging and Long-Term Care Policy (DALTCP) and the University of Maryland. For additional information about the study, you may visit the DALTCP home page at http://aspe.hhs.gov/_/office_specific/daltcp.cfm or contact the ASPE Project Officer, Pamela Doty, at HHS/ASPE/DALTCP, Room 424E, H.H. Humphrey Building, 200 Independence Avenue, SW, Washington, DC 20201. Her e-mail address is: Pamela.Doty@hhs.gov.
TABLE OF CONTENTS
A NEW MODEL OF MEDICAID PERSONAL ASSISTANCE
KEY FEATURES OF THE THREE DEMONSTRATION PROGRAMS
Eligible Population, Enrollment, and Allowance
Counseling and Fiscal Services
EXPECTED EFFECTS OF CASH AND COUNSELING ON MEDICAID AND MEDICARE SERVICE USE AND COSTS
Outcome Measures
Estimation of Program Effects
Allowance and Service Receipt in the Treatment Group
Program Effects on the Receipt of Any Paid Service
Program Effects on Expenditures for the Costed-Out Service, Year 1
Program Impacts per Recipient
Comparisons of Actual Costs with Expected Costs
Program Effects on Other Medicaid and Medicare Costs
Program Effects on Service Use
The Effect of Higher-than-Expected Costs on Care Quality
State-by-State Summary
Lessons Learned
Policy Implications
Assessing the Trade-Offs
Limitations
Related Research
Impacts on Quality of Care and Use of Personal Care
Impacts on the Cost of Medicaid and Medicare Services
Impacts on Informal Caregiving
Experiences of Paid Workers
Program Implementation
Program Demand and Participation
APPENDIX A: Additional Tables
APPENDIX B: Administrative Costs
APPENDIX C: Program Features
LIST OF FIGURES AND TABLES
FIGURE 1a: Arkansas's Ratios of Mean Actual to Mean Expected Costs for the Nonelderly
FIGURE 1b: Arkansas's Ratios of Mean Actual to Mean Expected Costs for the Elderly
FIGURE 2a: New Jersey's Ratios of Mean Actual to Mean Expected Costs for the Nonelderly
FIGURE 2b: New Jersey's Ratios of Mean Actual to Mean Expected Costs for the Elderly
FIGURE 3a: Florida's Ratios of Mean Actual to Mean Expected Costs for the Nonelderly
FIGURE 3b: Florida's Ratios of Mean Actual to Mean Expected Costs for the Elderly
TABLE ES.1: Effect of Arkansas's Cash and Counseling on Personal Care and Medicaid Expenditures
TABLE ES.2: Effect of New Jersey's Cash and Counseling on Personal Care and Medicaid Expenditures
TABLE ES.3: Effect of Florida's Cash and Counseling on Waiver and Medicaid Expenditures
TABLE 1a: Baseline Characteristics of Arkansas Sample Members
TABLE 1b: Baseline Characteristics of New Jersey Sample Members
TABLE 1c: Baseline Characteristics of Florida Sample Members
TABLE 2a: Estimated Effect of Cash and Counseling on Receipt and Cost of Paid Services in Arkansas
TABLE 2b: Estimated Effect of Cash and Counseling on Receipt and Cost of Paid Services in New Jersey
TABLE 2c: Estimated Effect of Cash and Counseling on Receipt and Cost of Paid Services in Florida
TABLE 3a: Effect of Cash and Counseling in Personal Care Expenditures Per Recipient Month in Arkansas
TABLE 3b: Effect of Cash and Counseling in Personal Care Expenditures Per Recipient Month in New Jersey
TABLE 3c: Effect of Cash and Counseling in Personal Care Expenditures Per Recipient Month in Florida
TABLE 4a: Effect of Cash and Counseling on Annual Expenditures for Medicaid and Medicare Services During the First Postenrollment Year in Arkansas
TABLE 4b: Effect of Cash and Counseling on Early Enrollees' Annual Expenditures for Medicaid and Medicare Services in Arkansas, By Year
TABLE 5a: Effect of Cash and Counseling on Annual Expenditures for Medicaid and Medicare Services During the First Postenrollment Year in New Jersey
TABLE 5b: Effect of Cash and Counseling on Early Enrollees' Annual Expenditures for Medicaid and Medicare Services in New Jersey, By Year
TABLE 6a: Effect of Cash and Counseling on Annual Expenditures for Medicaid and Medicare Services During the First Postenrollment Year in Florida
TABLE 6b: Effects of Cash and Counseling on Early Enrollees' Annual Expenditures for Medicaid and Medicare Services in Florida, By Year
TABLE 7a: Effect of Cash and Counseling on Selected Measures of Service Use in Arkansas
TABLE 7b: Effect of Cash and Counseling on Selected Measures of Service Use in New Jersey
TABLE 7c: Effect of Cash and Counseling on Selected Measures of Service Use in Florida
TABLE A.1a: Arkansas Baseline Means for Regression Control Variables
TABLE A.1b: New Jersey Baseline Means for Regression Control Variables
TABLE A.1c: Florida Baseline Means for Regression Control Variables
TABLE A.2a: Effect of Cash and Counseling on Early Enrollees' Annual Expenditures for Medicaid and Medicare Services in Arkansas, By Year
TABLE A.2b: Effect of Cash and Counseling on Early Enrollees' Annual Expenditures for Medicaid and Medicare Services in New Jersey, By Year
TABLE A.2c: Effect of Cash and Counseling on Early Enrollees' Annual Expenditures for Medicaid Services in Florida, By Year
TABLE A.3: Statistical Power
TABLE A.4: Effect of Cash and Counseling on Key Quality Outcomes, by Whether Controlling for Ratio of Actual to Expected Costs
TABLE C.1: Key Features of Cash and Counseling Programs, By State
TABLE C.2: Allowance Receipt Among Treatment Group Members in Arkansas, Florida, and New Jersey
ACKNOWLEDGMENTS
Many people at Mathematica Policy Research, Inc. (MPR) made this report possible. Licia Gaber, Kate Scheppke, and Amy Zambrowski programmed the analysis, and Valerie Cheh provided thoughtful comments on an earlier draft. Patricia Ciaccio carefully edited the report, and Jane Nelson skillfully produced it.
This report has also benefited greatly from the thoughtful comments and suggestions of individuals outside MPR. In particular, we appreciate the input of Pamela Doty, Sue Flanagan, Kevin Mahoney, Tonya Moore, Marie Squillace, and Lori Simon-Rusinowitz of the Cash and Counseling Demonstration and Evaluation management team; Debby Ellis of the IndependentChoices program (Arkansas); Tom Reimers, Susan Kaempfer and Carol Schulz of the Consumer-Directed Care program (Florida); Marguerite Schervish of the Centers for Medicare & Medicaid Services (CMS); and external reviewers Peter Kemper, Josh Wiener, and Nancy Miller.
Special thanks are also due to members of the Cash and Counseling staff program staff who cheerfully answered our questions and assisted us in obtaining administrative cost data. Sandra Barrett and Debby Ellis of Arkansas, Lou Comer and Juanita Webb of Florida, and Renee Davidson and Carolyn Selick of New Jersey particularly deserve mention.
The opinions presented here are those of the authors and do not necessarily reflect those of the funders (the Robert Wood Johnson Foundation and the U.S. Department of Health and Human Services, Office of the Assistant Secretary for Planning and Evaluation), the Cash and Counseling National Program Office, the demonstration states, or CMS.
EXECUTIVE SUMMARY
This study of the Cash and Counseling Demonstration program for adults in the three participating states--Arkansas, New Jersey, and Florida--examines how a new service delivery model of consumer direction affected Medicaid and Medicare service use and costs. The traditional system of providing Medicaid personal care services (PCS) through home care agencies gives consumers few choices about how and when their care is provided. Therefore, some consumers may not receive the type of care they feel they need, when and how they want it. As a result, some are dissatisfied with their care, have unmet needs, and are unhappy with the quality of their lives. The premise of the Cash and Counseling Demonstration was that, if consumers were given control over a cash allowance, they would select the types and amounts of care and services to best meet their needs and enhance their lives. When designed, the program was expected to cost no more per recipient per month of service than the traditional program.1 Furthermore, if there were sizable improvements in quality of life and reduction in unmet needs, other Medicaid costs might be reduced. On the other hand, if the care provided were inadequate, such costs might increase.
Demonstration enrollment, which occurred between December 1998 and July 2002, was open to interested beneficiaries eligible for PCS under their state Medicaid plan (in Arkansas and New Jersey) or under a waiver (in Florida). After a baseline survey, enrollees were randomly assigned to direct their own personal assistance as Cash and Counseling consumers (the treatment group) or to receive services as usual from agencies (the control group). Cash and Counseling consumers had the opportunity to receive a monthly allowance, which they could use to hire their choice of caregivers or to buy other services or goods needed for daily living. To receive the allowance, consumers had to prepare a spending plan describing how they would use the allowance and have their counselor approve it. They also could call on counselors for support and advice on managing the allowance. Each state's program differed somewhat from the others in how it was implemented, the size of the allowance, and how the allowance could be used, but all three states kept the basic principle of providing an allowance with limited constraints and helping the consumer manage it.
We drew outcome measures from Medicaid and Medicare claims data for the first postenrollment year for the full sample (2,008 people in Arkansas, 1,730 in New Jersey, and 1,817 in Florida), and for the first two years postenrollment for a cohort of early enrollees. Of particular interest were the program's effects on expenditures for the services that the program "costed-out" (that is, those services for which an allowance was provided instead) and on total expenditures for all Medicaid services. We used regression models to estimate program effects, while controlling for a comprehensive set of baseline characteristics. We constructed separate estimates for the elderly and nonelderly because of their potentially different needs, living situations, support networks, and types of disabilities, as well as for the first and second years postenrollment.
Results
By the third month after enrolling in the demonstration, more than 80 percent of treatment group members in Arkansas had received allowances. In Florida and New Jersey, the processes for setting up spending plans and allowances were time-consuming, so most treatment group members did not start receiving their allowances until at least six months after enrollment. About a third of treatment group members in New Jersey and almost half of those in Florida (62 percent of the elderly and 42 percent of the nonelderly) never received an allowance, mainly because they decided they were satisfied with the traditional program.
In Arkansas, PCS expenditures were about twice as high for the treatment group as for the control group during the first year postenrollment, primarily because the control group received less care than it was authorized to receive. Nearly one-fourth of control group members did not receive any paid PCS. Those who did, as a group, received only 68 percent of the hours of care to which they were entitled, rather than the 86 percent they had historically received. The average total PCS expenditures among allowance recipients per month were slightly less than the costs that agencies would have incurred, on average, if they had been responsible for providing services to these consumers and supplied the historic proportion of baseline care plan hours.
Savings in Medicaid expenditures on nursing facility, home health, and other Medicaid services partly offset the larger PCS costs of the treatment group. Thus, during the first postenrollment year, the treatment group's total Medicaid costs were only about 15 percent (or $1,531) higher than those of the control group (Table ES.1). Because the savings in other Medicaid services (particularly nursing facility, home health, and other home care waiver services) grew between the first and second year, and the gap in PCS costs shrank somewhat, the difference in total Medicaid costs during the second year fell to $500 (5 percent of the control group mean), but this was a statistically insignificant amount. The fact that treatment group members had 40 percent fewer nursing facility stays than control group members was especially noteworthy. Results were similar for the elderly and nonelderly, although both the treatment-control difference in PCS expenditures and the savings in nonPCS expenditures were larger for the nonelderly.
| TABLE ES.1. Effect of Arkansas's Cash and Counseling on Personal Care and Medicaid Expenditures | ||||||
| Personal Care Expenditures(Dollars) | All Medicaid Expenditures(Dollars) | |||||
| Treatment | Control | Difference | Treatment | Control | Difference | |
| YEAR 1 | ||||||
| - Nonelderly | 5,435 | 2,430 | 3,005*** | 14,125 | 12,862 | 1,263 |
| - Elderly | 4,313 | 2,292 | 2,021*** | 11,523 | 9,822 | 1,701*** |
| - All Ages | 4,605 | 2,349 | 2,256*** | 12,219 | 10,688 | 1,531*** |
| YEAR 2 | ||||||
| - All Ages | 3,852 | 1,839 | 2,014*** | 11,082 | 10,582 | 500 |
| NOTE: Year 2 includes only those who enrolled in the demonstration before May 1, 2000.*** Treatment group mean diferent from control group mean at .01 level. | ||||||
In New Jersey, PCS costs for the treatment group were 16 percent higher than for the control group during the first year, and this difference grew over time. The treatment-control difference in PCS costs was due largely to the fact that the treatment group was more likely to receive at least some PCS. For the nonelderly, however, costs per month for recipients also were higher for the treatment group. This appeared to be because nonelderly control group recipients received only about 90 percent of their baseline care plan amount, and no discount factor was applied to the baseline care plan in setting the allowance amount for treatment group members. Thus, the gap in personal care costs is larger for the nonelderly.
Savings in other Medicaid services (transportation, home health, and nursing facility) offset about half the treatment group's higher PCS costs in the first year, yielding a small (statistically insignificant) treatment-control difference in total Medicaid costs (about $861, or four percent of total Medicaid costs for the full sample) (Table ES.2). These expenditure results were similar for the elderly and nonelderly. The difference in total Medicaid costs grew to $2,379 in year 2, because the treatment-control difference in PCS expenditures grew by more than 60 percent, and the estimated savings in other Medicaid services essentially disappeared.
| TABLE ES.2. Effect of New Jersey's Cash and Counseling on Personal Care and Medicaid Expenditures | ||||||
| Personal Care Expenditures(Dollars) | All Medicaid Expenditures(Dollars) | |||||
| Treatment | Control | Difference | Treatment | Control | Difference | |
| YEAR 1 | ||||||
| - Nonelderly | 11,166 | 9,220 | 1,946*** | 26,863 | 26,049 | 814 |
| - Elderly | 11,891 | 10,650 | 1,241*** | 20,236 | 19,407 | 828 |
| - All Ages | 11,557 | 9,970 | 1,587*** | 23,370 | 22,509 | 861 |
| YEAR 2 | ||||||
| - All Ages | 11,337 | 8,792 | 2,545*** | 22,033 | 19,653 | 2,379*** |
| NOTE: Year 2 includes only those who enrolled in the demonstration before January 1, 2002.*** Treatment group mean diferent from control group mean at .01 level. | ||||||
In Florida, waiver costs were $2,108 (or 15 percent) higher for the treatment group than for the control group (Table ES.3). This difference was driven by the nonelderly, where the treatment-control difference in costs for waiver services was $3,696. In contrast, the treatment-control difference for these costs was only $433 (and statistically insignificant) for the elderly. Nonelderly allowance recipients incurred costs that were substantially higher-than-expected according to their baseline care plans. These high allowance costs appear to stem from the fact that many recipients, when they developed their spending plans, were assessed to need more care. Because there were no offsetting savings in other Medicaid costs, there was a sizable treatment-control difference in total Medicaid costs for the nonelderly and for the full sample. In year 2, the program's effects on Medicaid expenditures were similar to those in year 1. Finally, while the program had no effect on service receipt of waiver services in year 1, it did significantly affect it in year 2 for the elderly, as somewhat more treatment group members (81 percent) than control group members (76 percent) received waiver services.
| TABLE ES.3. Effect of Florida's Cash and Counseling on Waiver and Medicaid Expenditures | ||||||
| Waiver Expenditures(Dollars) | All Medicaid Expenditures(Dollars) | |||||
| Treatment | Control | Difference | Treatment | Control | Difference | |
| YEAR 1 | ||||||
| - Nonelderly | 22,017 | 18,321 | 3,696*** | 27,433 | 24,106 | 3,327*** |
| - Elderly | 10,496 | 10,063 | 433 | 15,971 | 15,833 | 137 |
| - All Ages | 16,301 | 14,193 | 2,108*** | 23,745 | 19,973 | 1,772*** |
| YEAR 2 | ||||||
| - All Ages | 18,354 | 15,978 | 2,375*** | 24,394 | 21,676 | 2,718*** |
| NOTE: Year 2 includes only those who enrolled in the demonstration before October 1, 2001.*** Treatment group mean diferent from control group mean at .01 level. | ||||||
In all three states, the treatment group's use and cost of Medicare services was similar to that of the control group. Therefore, the program's effects on combined Medicare and Medicaid service use and costs are similar to the effects on Medicaid use and costs.
Lessons
A key benefit of the program--increasing access to paid care--may lead to increased costs. Arkansas wanted its program to increase access to paid care. Florida and New Jersey, however, restricted their programs to consumers who already were receiving services (Florida) or who had been assessed and authorized to receive personal care by an agency (New Jersey). As a result, the program's impact on whether beneficiaries received paid care was limited to the second year in Florida, but it was sizable in New Jersey and particularly striking in Arkansas. Apparently, Cash and Counseling increased beneficiaries' access to paid care because, even though there was a labor shortage, they could hire family and friends. This, in turn, resulted in higher personal care costs for the treatment group.
If agencies cannot provide the hours authorized in the care plan, costs per month of services/benefits received may be higher than they would be otherwise. In Arkansas and New Jersey, costs per month of benefits were higher for treatment group recipients than for control group recipients, mainly because the control group received less care than they were expected to, at least partly due to severe labor shortages during the study period. The treatment group in these states received allowances approximately equal to the expected cost of obtaining authorized services in the care plan. In Florida, the primary reason for the treatment group's higher costs per recipient month among the nonelderly was that allowance recipients were more likely than those in the traditional program to be reassessed as needing more care than was in their original care plan.
Cash and Counseling can reduce the need for other Medicaid services, but it did not do so consistently across states and time periods. In Arkansas, savings in nursing facility and other long-term care services were enough to offset about 20 percent of the treatment group's higher personal care costs during the first postenrollment year and 75 percent of these costs during the second postenrollment year. Likewise, in New Jersey, savings in nursing facility and home health services were enough to offset about half the treatment-control difference in personal care costs in the first postenrollment year; however, these savings did not persist in the second postenrollment year.
Policy Implications
In all three states, the program had large, overwhelmingly positive effects on the well-being of consumers and caregivers. In addition, in two of the states, costs for the treatment group did not exceed the costs the state would have incurred for delivering the approved baseline care plan services. In all three states, Cash and Counseling increased the likelihood that beneficiaries would receive paid services, greatly increased consumers' satisfaction with their care and their quality of life, and reduced their unmet needs (Carlson et al. 2005). It also reduced caregiver stress in all three states (Foster et al. 2005c). However, the higher initial costs of consumer direction under Cash and Counseling might discourage some states from adopting a similar program. Most states are having difficulty controlling their Medicaid budgets, so the effects of any new program on states' costs is likely to be an important factor in whether states adopt such programs. An important fact for states to consider is that this evaluation was conducted over a two-year follow-up period that started immediately after enrollment began. Since the evaluation, states have identified the sources of the higher costs for this innovative program and have implemented procedures to reduce these costs.
One approach to limiting cost increases might be to try to minimize enrollment in the program, but this could be counterproductive. The major source of higher costs in two of the states was attributable to the increased proportion of consumers receiving any services. If this increase is due in part to some consumers enrolling in the demonstration who otherwise would never have sought care under the traditional program, states might try to control these costs by limiting enrollment in consumer-directed care to consumers who were already receiving services under the traditional program. However, this would defeat the purpose of expanding access to paid care in rural areas or other areas where agencies cannot find enough workers. Even in cities, a tight labor market may make it difficult for agencies to hire enough workers at wage rates compatible with the Medicaid payment for such services. Furthermore, some consumers may not be willing to accept agency services because of problems encountered in the past with agency workers (such as unreliability, theft, or abuse). Thus, limiting enrollment to those who had already been receiving agency services would unfairly penalize some eligible consumers and undermine a primary objective some states have for introducing consumer direction: improving access to care. The finding that the largest reductions in Medicaid nursing home and other long-term care costs were in states and age groups that had the largest increases in access to care validates the wisdom of this objective.
Based on the experience of the three demonstration states, other states interested in reaping the benefits of Cash and Counseling but concerned about program costs should consider the following issues:
Recoupment. States considering consumer-directed care may wish to adopt procedures to recover funds the consumer does not need. (This might happen, for example, if a consumer were hospitalized, had disenrolled, or had saved money not designated for a particular purchase). Each of the demonstration states eventually adopted such procedures, which can be implemented fairly if counselors give consumers adequate warning to help them avoid losing funds they may be saving for a legitimate purpose.
Reassessments. Cash and Counseling programs need to ensure that care plan amounts are no more likely to be increased if consumers receive an allowance than if they participate in the traditional program. Independent parties, rather than counselors or other people who might be inclined to advocate for consumers, might be used to conduct reassessments. Ideally, states would adopt standardized assessment procedures that are blind to whether consumers direct their own care and would develop comprehensive training for those conducting assessments and reassessments. Florida is implementing such changes.
Savings on Counseling and Fiscal Services. Arkansas learned a valuable lesson in how to provide counseling and fiscal services in a more cost-effective manner to more accurately reflect the level of effort that providing these services required. When the demonstration began, Arkansas paid the counseling/fiscal agencies a high monthly payment ($115 per month) starting when a consumer enrolled in the program, even though the consumer was not yet receiving an allowance or using bookkeeping or counseling services regularly. The state changed its procedure, making a one-time payment after the spending plan was developed, then paying a monthly fee of $75 after the consumer started the allowance. Arkansas found that this gave the counseling/fiscal agent an incentive to help the consumer complete the spending plan and reduced the state's costs for fiscal agent and counseling services.
Allowance Discount Factor. States should consider adjusting the allowance (reducing it by multiplying the care plan value by a "discount" factor) to ensure that it is on par with the costs of services that consumers would be likely to receive, on average, from an agency (since agency care recipients do not always receive the full value of services in their care plans). States also should monitor the discount factor closely and possibly change it. In retrospect, treatment group costs for the nonelderly in New Jersey would have been much closer to control group costs if the state had discounted the allowance as Arkansas and Florida did, because control group members in New Jersey received only about 90 percent of the care they were authorized to receive. Even Arkansas's discount factor of 86 percent was not as low as the 68 percent ratio that control group members actually experienced during the study period.
Before setting or changing the discount factor, however, states should investigate why beneficiaries in the traditional program do not receive the services they need. Few policymakers would want to hold costs down by depriving beneficiaries of services that assessment staff authorize as necessary. On the other hand, if care plans are routinely set at overly generous amounts, or if there are other reasons that consumers do not get all the services authorized, discounting the allowance based on historical data is appropriate.
Even here, however, discounting allowances downward for all consumers to reflect the average penalizes those who truly need all services authorized in their care plan. Nonetheless, Arkansas and Florida consumers were much more satisfied under Cash and Counseling, despite the discounting of their allowance. Whatever cost-cutting measures are introduced, policymakers need to monitor whether such measures reduce the quality of care received. Furthermore, states should weigh the potential for reducing nursing facility costs against the higher costs they may incur for personal care. If the effects on nursing home and long-term care costs, such as those observed in Arkansas and New Jersey, can be replicated elsewhere (and perhaps increased), while keeping cost per month of service close to the levels of the traditional program, consumers, their families, and the state will all benefit.
Assessing the Trade-Offs
Only states can decide whether they are willing to risk incurring slightly higher total Medicaid costs to reap Cash and Counseling's sizable gains in consumer and caregiver well-being. If states draw on the experiences of the three demonstration states, they should be able to find ways to keep total Medicaid costs at the level incurred under the traditional system. Modest percentages (about 8-20 percent) of eligible consumers participated in Cash and Counseling (even though the states undertook considerable outreach efforts to increase enrollment). Therefore, the total impact on Medicaid costs is likely to be modest, even if no changes were implemented to control personal care costs under Cash and Counseling.
Notes
-
Cash and Counseling had to meet the CMS's budget neutrality test for Medicaid Section 1115 demonstrations. This meant that costs per recipient per month for personal care and other core services should not exceed the per person, per month cost for those receiving agency services. The federal budget neutrality test examines program costs over an entire demonstration rather than for the early postenrollment years only. Therefore, the outcomes in this report do not indicate whether the consumer-directed programs in Arkansas, Florida, or New Jersey met this budget neutrality test.
INTRODUCTION
Home care agencies traditionally have provided Medicaid personal care services (PCS). These services typically include help with activities of daily living, such as bathing and dressing, and instrumental activities of daily living, such as doing housework and laundry and preparing meals. Agency care provides consumers with important benefits (such as formally trained and supervised workers), but it sometimes limits consumers' choices about how and when their care is provided. As a result, many states are addressing the shortcomings of agency services by offering interested Medicaid beneficiaries and their families an alternative--consumer-directed care--which allows consumers to control the funds for their care and to obtain services directly from individual providers (Velgouse and Dize 2000). The Cash and Counseling model of consumer-directed home care is designed to improve the well-being of these families without increasing public costs per month of service.1
Under the aegis of federal Systems Change grants and other initiatives spurred by the Supreme Court's 1999 Olmstead decision and the Bush administration's subsequent New Freedom Initiative, many states are considering consumer-directed options. States seeking to improve home- and community-based services (HCBS) for Medicaid beneficiaries need to know the costs of such programs to determine whether they are feasible. The national Cash and Counseling Demonstration, conducted in Arkansas, Florida, and New Jersey, was designed to provide the information states need to make informed choices. It used a randomized design to perform the first rigorous comparison of Medicaid and Medicare costs (under agency- and consumer-directed approaches).
Cash and Counseling could affect public costs in several ways. Costs could increase if, under consumer direction, Medicaid beneficiaries are more likely to actually receive the authorized paid care for which they are eligible. Cash and Counseling's costs could be higher (or lower) than those of the traditional program if the monthly allowance a state sets for self-directing consumers is higher (or lower) than the amount it would traditionally pay for authorized services. Finally, reimbursements for other services could increase (or decrease) if changes in how consumers manage their allowance under consumer direction lead to changes in their need for hospital, home health care, nursing, and other Medicaid and Medicare services.
Recent research suggests that Florida's Cash and Counseling model--Consumer Directed Care (CDC)--increased the well-being of children with disabilities and their parents in Florida and that the Cash and Counseling programs in Arkansas, Florida, and New Jersey similarly increased the well-being of adults (Foster et al. 2004, Carlson et al. 2005). The program also increased the likelihood that consumers in all three states would receive paid PCS (Carlson et al. 2005; Foster et al. 2004). However, the results to date on costs are less clear-cut. Arkansas's Cash and Counseling program increased personal care costs for adults, but, because of savings on other Medicaid services, the higher costs were partially offset during the first postenrollment year and almost fully offset during the second (Dale et al. 2004a). Florida's program for children increased Section 1915(c) waiver costs, although savings on home health services partly offset the higher costs (Dale et al. 2004b). This report compares results from all three demonstration programs to examine how consumer direction for adults affects Medicaid and Medicare service use and costs.2
A NEW MODEL OF MEDICAID PERSONAL ASSISTANCE
Many people receive disability-related supportive services in their homes through state Medicaid plans or HCBS waiver programs. In 2001, about 1.4 million people did so (Harrington and Kitchener 2003). Most people receive such services from government regulated agencies, whose professional staff select and schedule the services and monitor their quality.
Cash and Counseling, as one model of consumer-directed supportive services, provides a flexible monthly allowance to Medicaid beneficiaries who volunteer for the program and are randomly assigned to the evaluation's treatment group. They can use this allowance to hire their choice of workers, including family members, and to purchase other services and goods (as states permit). Cash and Counseling requires that consumers develop plans showing how they would use the allowance to meet their personal care needs, and it provides counseling and fiscal assistance to help them develop these plans and then manage their responsibilities. Consumers who cannot manage their care themselves, or who prefer not to, may designate a representative, such as a family member, to help them or do it for them. These features make Cash and Counseling adaptable to consumers of all ages and ability levels.
With funding from the Robert Wood Johnson Foundation and the U.S. Department of Health and Human Services, Office of the Assistant Secretary for Planning and Evaluation, the Cash and Counseling Demonstration and Evaluation was implemented in three states: Arkansas (IndependentChoices), Florida (CDC), and New Jersey (Personal Preference Program). The National Program Office for the demonstration, at Boston College and the University of Maryland, coordinated the overall demonstration, provided technical assistance to the states, and oversaw the evaluation. Because their Medicaid programs and political environments differ considerably, these states were not required to implement a standardized intervention, although they did have to adhere to the basic Cash and Counseling tenets of flexibility in the use of the allowance and support (as described above) to make it possible for all consumers to participate. The three states' programs operated under the Section 1115 Medicaid authority, which allowed the participants to hire legally responsible relatives such as spouses and parents, receive a cash allowance, and combine populations not allowed under the Section 1915(c) waiver authority.3 Services offered under a Section 1115 demonstration can include state plan services, services in place of state plan services, and HCBS waiver services.
KEY FEATURES OF THE THREE DEMONSTRATION PROGRAMS
As they began their demonstrations, Arkansas, Florida, and New Jersey all wanted to see whether the Cash and Counseling model was politically and economically feasible in their state environments. Arkansas stressed increasing access to care more than the other states did, because its home care workers were in unusually short supply, particularly in rural areas.
The programs of all three states shared key features, but they also differed in important ways. This section and Table C.1 summarize the main features of the three programs.
Eligible Population, Enrollment, and Allowance
The Cash and Counseling program was offered to elderly and nonelderly adults with physical disabilities who were eligible for state plan PCS (in Arkansas) or assessed to receive such services (in New Jersey). In Florida, the program was offered to people receiving services under one of three Medicaid HCBS waiver programs covering elderly adults, nonelderly adults with physical disabilities, children and adults with developmental disabilities, and adults with brain/spinal cord injuries. In Florida, the array of "costed-out" services (services that an allowance was provided instead of) was broad. They included personal care and services such as transportation, behavioral therapy, and personal care supplies. In contrast, in Arkansas and New Jersey, personal care was the only costed-out service.
Another important distinction between the three state programs involved whether beneficiaries had to be enrolled in the traditional program to participate in Cash and Counseling. In Florida, to be eligible for the demonstration, beneficiaries had to already be receiving some costed-out waiver services. In New Jersey, beneficiaries had to have applied for agency PCS and been assessed as eligible to receive them. Only these people were invited to participate in the program.4 Arkansas, however, allowed anyone eligible for Medicaid personal care to enroll and used a letter from the governor to inform all Medicaid beneficiaries in the state about this option.
None of the states screened eligible consumers for appropriateness. Rather, consumers were allowed to enroll if they (or their representatives) felt they could manage the Cash and Counseling program.5
In Arkansas and New Jersey, the monthly value of PCS in the beneficiary's care plan was used to determine the amount of the allowance. In Florida, the allowance was based on the actual Medicaid cost, according to Medicaid claims history, of all the goods and services (except for case management/support coordination) that the beneficiary was receiving under the HCBS waiver. If this history was not stable or not consistent with the current care plan, the care plan became the basis for the allowance. The allowance amounts in Arkansas and Florida were adjusted by a "discount factor" to ensure that treatment group members' allowances were in line with the expected costs of services that similar control group members were likely to actually receive. (Consumers in the traditional program often received somewhat less care than their plans recommended because of hospitalizations, workers sometimes failing to show up, and other problems.) Arkansas multiplied the number of hours in the care plan by a discount factor ranging from 70 to 91 percent to reflect the historical differences observed between the amount of services different agencies actually delivered and the amount the care plan authorized.6 In Florida, the allowances were multiplied by a discount factor equal to 89 percent for the elderly, 83 percent for adults with physical disabilities and adults with brain/spinal cord injuries, and 92 percent for children and adults with developmental disabilities. New Jersey determined that consumers typically received the full value of their care plans, so it did not discount the care plan value in setting the allowance amount. The median monthly allowance varied widely across the three states, from $313 in Arkansas to $1,097 in New Jersey, with Florida falling between these two extremes ($829).7
In all three states, programs conducted reassessments periodically or when the participants' needs changed. Consequently, sample members' care plans (and allowance amounts) could change. In Arkansas, agencies reassessed control group members, and the program's counselors reassessed treatment group members. In New Jersey, agencies reassessed those in the traditional program, and Medicaid nurses reassessed those in Cash and Counseling. To authorize more than 25 hours of care, however, agencies had to seek approval from Medicaid. In Florida, support coordinators (for the nonelderly) and case managers (for the elderly) reviewed control group members' support plans and revised them as necessary to ensure that needs were met. Consultants had comparable responsibility for those receiving the allowance. Care plan amounts also changed in New Jersey because the rate per hour paid to agencies (and, therefore, the rate at which hours were costed-out to determine the allowance) increased by about 7 percent over the study period.
In spite of the name of the program, consumers did not actually receive much of the allowance in cash. Rather, consumers (or their representatives) had to develop a spending plan specifying the goods and services to be purchased for them with the allowance. The allowance could only be used to purchase goods and services related to the consumer's disability. However, the states usually took a broad view of what purchases to allow (for example, they permitted the purchase of microwave ovens and washing machines if they increased the person's independence). In general, invoices had to be submitted for checks to be written; consumers were not given accounts that they could write checks against, as with a private bank account. Spending plans could include small amounts of cash--up to 10 percent of the allowance in Arkansas and New Jersey and up to 20 percent in Florida--to be paid to the consumer for incidental expenses (such as taxi fare) for which invoicing was impractical.8
Under some circumstances, the states in all three Cash and Counseling programs recouped funds from consumer accounts maintained by the fiscal agent. This was necessary to recover inappropriate payments (for example, payment of an allowance after the consumer had disenrolled from the program or had undergone a lengthy hospitalization) and to recover large balances that consumers had accumulated but were not saving for a particular purpose. All three states permitted recoupment when the advancement of funds had been inappropriate, but the recoupment procedure differed in the three programs. Partway through the demonstration, Arkansas began recouping funds from consumers who had balances of more than 150 percent of their monthly allowance and who had not specified a purchase for which they were saving. New Jersey recouped funds that remained unused after a 12-month period when a consumer's spending plan did not designate a purpose for those funds. After the demonstration ended, Florida began retroactively recouping funds from consumers who had disenrolled and began enacting policies that would allow it to recoup undesignated funds that exceeded 1.5 times the monthly allowance.
Consumers were allowed to hire relatives. A waiver of federal regulations permitted the hiring of "legally responsible" relatives (those who were responsible for the consumer's well-being, including spouses, parents of minors, and legal guardians). Florida and New Jersey exercised this waiver; Arkansas did not. (Arkansas did allow consumers to hire relatives, such as the parents of adults, who were not legally responsible for those consumers. Consumers who hired workers became the employer of record for those workers. To avoid a conflict of interest, Arkansas and New Jersey did not allow the same person to serve as both representative and worker.
Counseling and Fiscal Services
In all three Cash and Counseling programs, consumers were offered the assistance of counselors (called "consultants" in Florida and New Jersey) and of a fiscal agent. Counselors interacted with consumers to (1) review initial and revised spending plans and ensure that they included only permissible goods and services, (2) help with employer functions, (3) monitor consumers' health, and (4) monitor the uses of the allowance (in Florida and New Jersey). Florida and New Jersey required that state- or district-level staff review all spending plans. Arkansas required state-level review only if a plan contained an item not on a preapproved list. Counselors in all three programs advised consumers about recruiting, hiring, training, supervising, and (if necessary) firing workers. Counselors were required to telephone and visit consumers periodically to monitor their condition and their use of the allowance. The frequency of required calls and visits varied across programs, but counselors provided additional monitoring and problem-solving calls and visits as needed.
Consumers in all three programs were offered help with fiscal tasks, including the payroll functions of an employer (such as preparing and submitting payroll tax returns) and writing checks. A consumer who demonstrated the ability to assume responsibility for these fiscal tasks was allowed to do so. In both Arkansas and Florida, a few treatment group members (less than 1 percent) assumed responsibility for all fiscal tasks, and none did so in New Jersey.
To prevent abuse of the allowance, all three programs verified worker time sheets and check requests against spending plans before disbursing funds. In Florida and New Jersey, the fiscal staff was responsible for this verification; in Arkansas, a counselor was responsible for it. Counselors in Arkansas and Florida also checked receipts for expenditures under the allowance. (New Jersey did not require consumers to keep receipts.) Arkansas required receipts for everything except incidental expenses. Florida required that counselors review receipts for incidental expenses, and the fiscal agent reviewed receipts for all purchases made by the few consumers who assumed responsibility for fiscal tasks themselves.
The three states paid in different ways for consulting and fiscal agent services. In Arkansas, the state expected that the fiscal agent and counseling costs would be covered, in aggregate, by the difference between the standard rate of $12.36 per hour of personal care that the state paid agencies and the $8.00 per hour in the cash allowance. In New Jersey, 10 percent of the value of the consumer's care plan was set aside to cover counseling costs and some fiscal agent costs (such as for processing the papers in an employment packet). In addition, consumers were charged fees for services they asked the fiscal agent to perform, such as cutting or stopping payment on checks and arranging for criminal background investigations. In Florida, for those with developmental disabilities, the same monthly fee ($148 per month) that was paid to support coordinators in the traditional program was paid to counselors under CDC. For elderly consumers, Florida paid counselors a separate fixed amount to develop the spending plan (with the number of such visits capped for each consumer) and followed with hourly rates for counseling services (with quarterly payments capped for each consumer). For fiscal services, Florida developed a schedule for consumer fees (for example, $5 per check cut), with the total capped at $25 per consumer per month.
EXPECTED EFFECTS OF CASH AND COUNSELING ON MEDICAID AND MEDICARE SERVICE USE AND COSTS
According to the budget neutrality requirements for this demonstration defined by the Centers for Medicare & Medicaid Services (CMS) for Medicaid Section 1115 demonstrations, the costs per recipient per month for personal care and other core services during the demonstration period should not exceed the per person, per month cost for control group members receiving agency services during the same period.9 However, our analysis differs from CMS's budget neutrality analysis in that we examine the cost per sample member, as well as the cost per PCS recipient, over a limited time.10
We would expect that Cash and Counseling would increase Medicaid expenditures for the costed-out service to the extent that the program increased the percentage of sample members receiving any paid care. In addition, the program could affect costs in several other ways. First, the allowance could be too high (or too low) if the control group received fewer (or more) services than they had historically received. In Arkansas, for example, control group members received only 68 percent of the value of their care plan during the study period, rather than the 86 percent they had historically received (Dale et al. 2004a). Analyses reported later in this paper examine whether control group members in Florida and New Jersey experienced similar underservice.
Second, differences in reassessment procedures for the treatment and control groups could lead to differences in the amount of care beneficiaries received (and, in turn, the costs of that care). For example, because of labor shortages, agencies in Arkansas and New Jersey might have been reluctant to increase the number of hours in consumers' care plans, even if changes in consumers' conditions or circumstances justified increases. In contrast, because treatment group members could hire friends and relatives, labor shortages were not a factor in the counselors' reassessments (in Arkansas) or the Medicaid nurses' reassessments (in New Jersey). In addition, in New Jersey, agencies could authorize up to 25 hours of care without a Medicaid nurse's approval. This meant that agencies might be reluctant to reassess control group patients as needing more than 25 hours of care, but no such constraint existed for Medicaid nurses reassessing treatment group members. In Florida, the same people conducted assessments for the treatment and control groups. People acting as consultants, however, might interpret the procedures and constraints for developing care plans differently for Cash and Counseling recipients from the way they would if they were acting as support coordinators or case managers for the traditional program.
Finally, if the costs for other services associated with consumer direction (such as costs for fiscal agents) are less than agency overhead, consumer-directed services may be cheaper. While Cash and Counseling has no agency overhead costs, the program does incur costs for fiscal agents and counseling. Nonetheless, the program could save money in Arkansas and New Jersey if the aggregate costs for fiscal agent and counseling services were less than the pool of money generated to cover those costs. In Florida, for both nonelderly adults with physical disabilities and with brain/spinal cord injuries and for the elderly, savings could be generated if the costs for consulting were less than those of case management under the traditional program. (There was no opportunity for savings on consulting for the nonelderly adults in Florida's Developmental Disabilities program, because the cost for consulting under CDC was identical to that of case management under the traditional program.)
We also explore the reasons for any treatment-control difference in expenditures for the costed-out service. First, we assess whether the discount factor was consistent with actual experience during the demonstration. To do this, we compare the value of services the control group received with the value it was expected to receive (the discounted care plan value).11 Second, in Arkansas, we examine whether different reassessment procedures for the treatment and control groups might have contributed to the treatment-control difference in personal care expenditures. Unfortunately, reassessment data were available only for the treatment group in New Jersey and for neither group in Florida. Therefore, in these two states, we can only make inferences about reassessments based on changes in personal care expenditures.
Cash and Counseling could affect the use of other services in addition to expenditures for the costed-out service. First, it might substitute for other Medicaid or Medicare services, such as nursing facility and home health services. Second, it might affect the use and cost of Medicaid and Medicare services, such as inpatient hospital admissions, that may reflect the adequacy of PCS. These costs could be higher for the treatment group if workers neglected consumers, performed health care tasks improperly, or waited too long to request medical attention for their clients. In such cases, consumers might fall more frequently than control group members, or they might develop more infections, bedsores, or contractures. According to self-reported data in Carlson et al. 2005, however, treatment group members in each of the three states were no more likely than control group members to fall, develop contractures, have respiratory infections, experience shortness of breath, or have urinary infections. In fact, that research showed that consumers were actually less likely to experience many of these events. Thus, if claims data are consistent with survey reports, we would expect the treatment group's expenditures for other Medicaid and Medicare services for these problems to be similar to (or even less than) the control group's.
DATA AND METHODS
We drew data for this analysis primarily from Medicaid and Medicare claims, as well as from a computer-assisted telephone baseline survey administered to treatment and control group members or to their proxy respondents between December 1998 and April 2001. To construct outcome measures for the full sample, we used Medicaid and Medicare claims data for the first 12 months after enrollment. We also constructed outcome measures for a cohort of early enrollees for whom two full years of Medicaid and Medicare data were available. This cohort includes those who enrolled in Arkansas's IndependentChoices before May 2000, Florida's CDC before October 2001, or New Jersey's Personal Preference Program before January 2002.
We constructed control variables from claims data for the year before enrollment and from the baseline survey. Control variables from the claims data included the sample members' preenrollment Medicaid and Medicare expenditures, as well as their diagnoses (in Arkansas) or predicted expenditures based on their diagnoses (in Florida and New Jersey).12 Control variables from the baseline survey include the consumers' demographic characteristics, measures of health and functioning, and measures of unmet need for personal care.
Outcome Measures
Medicaid expenditure measures were drawn from Medicaid claims data supplied by each state, and Medicare expenditure measures were drawn from Medicare claims data. To avoid introducing selection bias, we retained the full sample, including those not enrolled in Medicare, in our analysis. (We defined those not enrolled in Medicare as having zero Medicare expenditures. More than 90 percent of the elderly and about 40 percent of the nonelderly were enrolled in Medicare in each of the three states.) Most of the measures are straightforward. Two, however--expenditures for the costed-out service and personal care expenditures per recipient month--require additional explanation.
Expenditures for the Costed-Out Service. In general, in all three states, expenditures for the costed-out service were obtained from the Medicaid claims data. For allowance recipients, these expenditures include the allowance costs, costs for counseling services, and costs for fiscal agent services incurred by Medicaid. For control group members and for treatment group members who received traditional services (because they had not yet started receiving the allowance or had disenrolled from the program), these expenditures include costs agencies incurred for delivering care and costs other vendors in the traditional program incurred. We provide state-by-state details next.
In Arkansas, personal care costs for the control group (and for treatment group members not receiving an allowance) were equal to the actual cost of the hours of care delivered according to the Medicaid claims data (which was equal to the number of hours multiplied by $12.36, the hourly rate Arkansas paid for agency services). The treatment group's personal care expenditures included costs for the allowance and the costs for counseling and fiscal agent fees, both of which were reported in the Medicaid claims data.13 As noted, the allowance was equal to the number of care plan hours (adjusted to reflect historical differences between actual hours and care plan hours) multiplied by $8 per hour.14 The program paid a fixed monthly fee for each consumer's counseling and fiscal agent services.
For allowance recipients in New Jersey, personal care costs included the costs for the allowance, as well as the 10 percent of the value of the care plan that was set aside to cover fiscal agent and counseling costs. We adjusted the personal care costs from the claims data to reflect the funds that the state was recouping from consumers (but that had not yet been reflected in the claims data).15 Personal care costs for those in the control group and for those in the treatment group not receiving an allowance were equal to the amount that agencies billed Medicaid for care provided.
In Florida, waiver costs for allowance recipients included the cost of the allowance plus the fees paid for consulting services. (Because the consumer paid most fiscal agent costs directly, these costs are not included in the claims data.) We adjusted waiver costs by the amount that Florida planned to recoup for consumers who disenrolled, by subtracting a prorated monthly recoupment amount (equal to the total recoupment amount divided by the number of months the person received an allowance) from the consumer's waiver expenditures during each month the consumer received an allowance. Waiver costs for those in the control group and for those in the treatment group not receiving an allowance were equal to waiver expenditures that agencies or other vendors incurred according to the Medicaid claims data.
Personal Care Expenditures per Recipient Month. For treatment group members, these included expenditures only for the months during which consumers received either a cash allowance or, for those not receiving the allowance, services from an agency (or other Medicaid vendor, in Florida). For control group members, it included only months during which the consumer received agency services (or, in Florida, waiver services from other Medicaid vendors).
Estimation of Program Effects
Our impact estimates measure the effects of having the opportunity to receive the monthly allowance (because of being randomly assigned to the treatment group), rather than of actually receiving it. Treatment group members typically did not receive the allowance during the full postenrollment period that we examined. They may have disenrolled from Cash and Counseling, taken several months to submit their spending plans, or never submitted spending plans. Likewise, many control group members did not receive PCS in every postenrollment month. (Some did not receive any PCS during the postenrollment period.) In addition, some sample members died during the study period. First-year mortality rates for treatment and control group members were 14 and 12 percent, respectively, in Arkansas; 7 and 8 percent, respectively, in Florida; and 7 percent for both groups in New Jersey. To avoid introducing selection bias, most of our analyses were based on the Medicaid and Medicare expenditures of all treatment group and all control group members (including in the denominator even those who had died or who were no longer enrolled in Medicaid or Medicare). The exception was our examination of expenditures per month of benefit receipt, which included only people who received PCS or waiver services.
We used ordinary least squares regression models to estimate program impacts for continuous outcome measures (including all our expenditure outcomes). For binary outcome measures (such as whether a sample member had any visits to the emergency room), we used logit models to estimate program impacts. For continuous outcome measures with a high proportion of zero values, such as the number of nursing facility days, we used tobit models. All the models controlled for the sample members' baseline measures of demographic characteristics, health and functioning, unmet needs for personal care, preenrollment Medicaid and Medicare expenditures, and preenrollment diagnoses. Table A.1a, Table A.1b and Table A.1c list the control variables used in each of the models. These models increased the precision of the impact estimates and ensured that any differences that may have arisen by chance between treatment and control groups in these preexisting characteristics did not distort our impact estimates. For many outcomes, we estimated models separately for elderly and nonelderly sample members, because impacts and the relationship between the outcomes and the control variables might differ for the two age groups.
To examine a longer follow-up period, we also estimated models on a subsample restricted to a cohort of early enrollees. To increase the cohort's sample size, it included both elderly enrollees and nonelderly enrollees. (In Appendix A, Table A.2a, Table A.2b and Table A.2c show results for several key outcomes for the early enrollee cohort separately by age group.)
For continuous outcome measures, we measured impacts by calculating the treatment-control difference in predicted means. We measured the impacts of Cash and Counseling on binary outcomes by using the estimated coefficients from the logit models to calculate the average predicted probabilities that the binary dependent variable would take a value of 1, with each sample member first assumed to be a treatment group member, then assumed to be a control group member. For each type of model, we used the p-values of the estimated coefficients on the treatment status variable to assess the statistical significance of the impacts; the p-values are reported in the tables. The impact estimates are almost always very similar to the simple treatment-control differences in means.
Table A.3 shows the statistical power to detect impacts of 10 percent of the control group mean for our key outcome measure, total Medicaid expenditures, assuming two-tailed tests at the .10 significance level. In each state, we have at least 80 percent power to detect a 10 percent change in total Medicaid expenditures for the full sample, the elderly sample, and the early enrollee sample. In Florida, we also have 80 percent power to detect a 10 percent impact for the nonelderly sample. This means that, for most of our samples, if the true effect of the program is to decrease (or increase) treatment group expenditures by 10 percent or more than they would have been without the program, the likelihood that the observed treatment-control difference in the sample will be statistically significant is at least 80 percent.
SAMPLE DESCRIPTION
As would be expected under random assignment, there were few significant differences between treatment and control group members' baseline characteristics (Table A.1a, Table A.1b and Table A.1c). In all three states, most of the sample was female and white (Table 1a, Table 1b and Table 1c). Many sample members reported that they were in poor health, and many had functional limitations. About two-thirds reported that they had to have assistance "transferring" (getting in and out of bed). While nearly 40 percent of sample members in Arkansas lived in rural areas (which could make it difficult for agencies and consumers to recruit workers), only 13 percent of Florida's sample members and 10 percent of New Jersey's did so. In keeping with New Jersey's program requirements, nearly all sample members in that state had received personal care in the year before enrollment, whereas in Arkansas only 69 percent had received it. While 100 percent of sample members in Florida had received waiver services in the year before enrollment (as Florida's program required), only 78 percent had received PCS, because some sample members had received only other (nonpersonal care) waiver services (such as therapy or supplies.) The allowance amounts consumers qualified for at enrollment differed substantially, averaging $315 per month in Arkansas, $1,079 in New Jersey, and $1,215 in Florida. Thus, the amount consumers managed varied widely across states due to differences in services costed-out in calculating the benefit, limits on these benefits, and labor rates. Amounts also varied widely across consumers within states. Finally, as would be expected under random assignment, there were few significant differences between treatment and control group members' baseline characteristics (Table A.1a, Table A.1b and Table A.1c).
The nonelderly sample in Florida was quite different from the comparable samples in Arkansas and New Jersey in many respects, because the primary feeder program (Florida's Developmental Disabilities waiver program, formerly known as the Developmental Services waiver) included people with developmental disabilities, as opposed to physical ones (although some had both). In fact, nearly 90 percent of the nonelderly were from the Developmental Disabilities waiver. The Florida nonelderly sample was more likely to be under age 40 and male, and less likely to report being in fair or poor health. In Arkansas and New Jersey, the nonelderly group includes adults who were ages 18-64 at the time of enrollment, whereas in Florida it includes those who were ages 18-59. We have set the upper age limit for "nonelderly" differently for Florida because its Department of Elder Affairs waiver program covers consumers starting at age 60, rather than 65. Thus, dividing the sample into younger and older cohorts at age 60 instead of age 65 yields greater homogeneity within age groups in Florida and clearer interpretation of the results.
| TABLE 1a. Baseline Characteristics of Arkansas Sample Members | |||
| Characteristic | Nonelderly | Elderly | All |
| AGE IN YEARS (Percent) | |||
| - 18 to 39 | 27.5 | 0.0 | 7.6 |
| - 40 to 64 | 72.5 | 0.0 | 20.1 |
| - 65 to 79 | 0.0 | 50.4 | 36.5 |
| - 80 or older | 0.0 | 50.6 | 35.9 |
| FEMALE (Percent) | 67.6 | 81.4 | 77.6 |
| WHITE (Percent) | 63.5 | 59.2 | 60.4 |
| LIVED IN RURAL AREA (Percent) | 36.5 | 39.7 | 38.8 |
| MONTHS ON MEDICAID/MEDICARE IN PREENROLLMENT YEAR | |||
| - Months on Medicaid | 11.9 | 11.2 | 11.4 |
| - Months on Medicare | 5.0 | 11.5 | 9.7 |
| MEAN MONTHLY MEDICAID REIMBURSEMENTS FOR SELECTED SERVICES IN THE 12 MONTHS PRECEDING BASELINE (Dollars) | |||
| - Medicaid PCS | 2,330 | 2,167 | 2,212 |
| - Nursing facility services | 144 | 149 | 147 |
| - Home health services | 748 | 230 | 373 |
| HEALTH STATUS, FUNCTIONAL STATUS, AND NEED FOR PERSONAL CARE AT BASELINE (Percent) | |||
| - Said health was fair | 26.7 | 32.6 | 31.0 |
| - Said health was poor | 54.2 | 47.2 | 49.1 |
| - Needed help getting in and out of bed | 62.1 | 67.4 | 65.9 |
| - Received personal care in preenrollment year | 54.2 | 74.9 | 69.2 |
| - Had unmet personal care need | 69.1 | 61.4 | 63.5 |
| MONTHLY PROSPECTIVE ALLOWANCE AMOUNT (Dollars) | 358 | 298 | 315 |
| SAMPLE SIZE | 556 | 1,452 | 2,008 |
| SOURCE: Medicare and Medicaid claims, December 1997 to April 2000; Medicare and Medicaid enrollment files; and MPR's baseline evaluation survey, conducted between December 1998 and April 2001. PCS = personal care services. | |||
| TABLE 1b. Baseline Characteristics of New Jersey Sample Members | |||
| Characteristic | Nonelderly | Elderly | All |
| AGE IN YEARS (Percent) | |||
| - 18 to 39 | 33.7 | 0.0 | 15.8 |
| - 40 to 64 | 66.3 | 0.0 | 31.2 |
| - 65 to 79 | 0.0 | 58.8 | 31.2 |
| - 80 or older | 0.0 | 41.2 | 21.8 |
| FEMALE (Percent) | 66.1 | 78.7 | 72.8 |
| RACE (Percent) | |||
| - Black | 42.9 | 32.3 | 37.2 |
| - NonBlack | 57.1 | 67.7 | 62.8 |
| - Hispanic | 29.8 | 41.2 | 35.8 |
| LIVED IN RURAL AREA (Percent) | 9.5 | 10.6 | 10.1 |
| PREENROLLMENT MEDICAID EXPENDITURES FOR SELECTED SERVICES IN YEAR BEFORE BASELINE (Dollars) | |||
| - Total Medicaid | 24,548 | 17,064 | 20,581 |
| - Inpatient expenditures | 4,071 | 1,820 | 2,878 |
| - Home health | 1,742 | 579 | 1,125 |
| - Personal care | 7,774 | 8,949 | 8,397 |
| MONTHS ON MEDICAID/MEDICARE IN PREENROLLMENT YEAR | |||
| - Months on Medicaid | 11.8 | 11.8 | 11.8 |
| - Months on Medicare | 4.9 | 10.7 | 8.0 |
| MANAGED CARE AT BASELINE (Percent) | |||
| - In Medicaid or Medicare HMO | 17.3 | 8.2 | 12.5 |
| HEALTH STATUS, FUNCTIONAL STATUS, AND NEED FOR PERSONAL CARE AT BASELINE (Percent) | |||
| - Said health was fair | 31.0 | 41.5 | 36.6 |
| - Said health was poor | 44.5 | 40.7 | 42.5 |
| - Health expected to be worse next year | 39.4 | 53.5 | 46.9 |
| - Unmet need for personal care | 74.3 | 73.8 | 74.0 |
| - Needed help getting in and out of bed | 66.5 | 66.3 | 66.4 |
| - Received personal care in preenrollment year | 96.8 | 97.8 | 97.3 |
| MONTHLY PROSPECTIVE ALLOWANCE AMOUNT (Dollars) | 1,087 | 1,072 | 1,079 |
| SAMPLE SIZE | 813 | 917 | 1,730 |
| SOURCE: Medicare and Medicaid claims data and MPR's baseline survey. HMO = health maintenance organization. | |||
| TABLE 1c. Baseline Characteristics of Florida Sample Members | |||
| Characteristic | Nonelderly | Elderly | All |
| AGE IN YEARS (Percent) | |||
| - 18 to 39 | 75.5 | 0.0 | 37.9 |
| - 40 to 59 | 24.5 | 0.0 | 12.3 |
| - 60 to 79 | 0.0 | 52.9 | 26.3 |
| - 80 or older | 0.0 | 47.1 | 23.4 |
| FEMALE (Percent) | 45.3 | 79.0 | 62.1 |
| RACE (Percent) | |||
| - Black | 18.2 | 27.3 | 22.7 |
| - NonBlack | 81.8 | 72.7 | 77.3 |
| - Hispanic | 21.1 | 34.6 | 27.8 |
| LIVED IN RURAL AREA (Percent) | 14.5 | 10.6 | 12.6 |
| MEDICAID EXPENDITURES IN YEAR BEFORE BASELINE (Dollars) | |||
| - Total Medicaid expenditures | 19,227 | 12,851 | 16,055 |
| MEDICAID ANNUAL PREENROLLMENT EXPENDITURES FOR SELECTED SERVICES (Dollars) | |||
| - Inpatient expenditures | 576 | 766 | 671 |
| - Home health | 1,104 | 159 | 634 |
| - Waiver services | 13,494 | 8,273 | 10,897 |
| MONTHS ON MEDICAID/MEDICARE IN PREENROLLMENT YEAR | |||
| - Months on Medicaid | 11.9 | 11.6 | 11.8 |
| - Months on Medicare | 4.8 | 11.1 | 7.9 |
| MANAGED CARE AT BASELINE (Percent) | |||
| - In Medicaid HMO with capitated payment | 23.5 | 6.3 | 15.0 |
| - In Medicaid primary care case management | 45.8 | 9.1 | 27.5 |
| - In any Medicare HMO | 5.0 | 24.1 | 14.5 |
| HEALTH STATUS, FUNCTIONAL STATUS, AND NEED FOR PERSONAL CARE AT BASELINE (Percent) | |||
| - Said health was fair | 23.6 | 38.7 | 31.1 |
| - Said health was poor | 15.4 | 37.3 | 26.3 |
| - Health expected to be worse next year | 18.5 | 48.1 | 33.3 |
| - Unmet need for personal care | 53.6 | 64.2 | 58.9 |
| - Needed help getting in and out of bed | 51.8 | 65.2 | 58.4 |
| - Received personal care in preenrollment year | 62.2 | 93.3 | 77.7 |
| MONTHLY PROSPECTIVE ALLOWANCE AMOUNT (Dollars) | 1,610 | 817 | 1,215 |
| SAMPLE SIZE | 913 | 904 | 1,817 |
| SOURCE: Medicare and Medicaid claims data and MPR's baseline survey. HMO = health maintenance organization. | |||
RESULTS
Allowance and Service Receipt in the Treatment Group
There were striking differences across states as to when treatment group members started receiving the cash allowance. By the third month after enrolling in the demonstration, more than 80 percent of treatment group members in Arkansas had received allowances. In contrast, there were delays in starting up the allowance in Florida and New Jersey, with only 16 percent in Florida and 32 percent in New Jersey receiving allowances by 3 months after enrollment. Even 6 months after enrollment, only 39 percent of treatment group members in Florida and 57 percent in New Jersey had started receiving an allowance. In New Jersey, about a third of treatment group members never received an allowance; in Florida, the fraction was almost half (58 percent of the elderly and 43 percent of the nonelderly; see Table C.2). In Florida, reasons for delays in starting the allowance included large staff workloads, procedural delays, and consumers having difficulty developing spending plans or finding workers (Foster et al. 2005a).16 In New Jersey, delays were primarily due to the time-consuming procedures involved in developing a spending plan and switching from agency care to consumer direction (Foster et al. 2005b). In both Florida and New Jersey, consumers who never started an allowance typically had decided they were satisfied with the traditional program, had a problem with employer responsibilities (most commonly reported in New Jersey), thought the allowance was not enough, or thought the allowance rules were too restrictive.
Nonetheless, most treatment group members in all three states received traditional services in months that they did not receive allowances. The percentage receiving either an allowance or traditional services during the first postenrollment year was 97 percent in Arkansas, 96 percent in New Jersey, and 99 percent in Florida.
Program Effects on the Receipt of Any Paid Service
In both Arkansas and New Jersey, Cash and Counseling had a significant impact on the likelihood that beneficiaries would receive any paid service (either an allowance or traditional services). In Arkansas, the treatment-control difference in the percentage receiving any paid services (25 percentage points for the full sample) is striking. Only 75 percent of elderly control group members and 63 percent of nonelderly ones received any PCS during the first postenrollment year, even though the state had authorized these services (Table 2a). In comparison, about 97 percent of elderly and nonelderly treatment group members received at least some services during this year. During year 2, the treatment-control difference in receipt of paid services was similar to that of year 1. However, during that year, a lower percentage of both treatment and control group members received PCS, mainly because some sample members died or entered nursing facilities.
In New Jersey, the impact of the program on service receipt was modest in year 1, with 96 percent of treatment group members receiving services, compared with 89 percent of control group members (Table 2b). By year 2, the program had a larger impact on receipt of services, with 84 percent of treatment group members receiving PCS, compared with only 71 percent of control group members. The program's impact on service receipt was particularly pronounced for the nonelderly during year 2, where 85 percent of the treatment group, but only 68 percent of the control group, received any PCS.17
In Florida, the program had no effect on whether beneficiaries received any waiver services in year 1, as about 99 percent of both elderly and nonelderly treatment and control group members received at least some paid services (Table 2c). Similarly, more than 97 percent of the nonelderly treatment and control groups received at least some paid services during the second postenrollment year. However, in that year, 81 percent of the elderly treatment group received services, about six points more than the percentage receiving services in the control group.
Program Effects on Expenditures for the Costed-Out Service, Year 1
Partly because the program increased access to paid care, treatment group costs for the costed-out service (personal care in Arkansas and New Jersey and waiver services in Florida) were significantly and substantially higher than those for the control group in all three states. In Arkansas, during the first year postenrollment, treatment group members had average annual personal care expenditures of $4,605, nearly twice the figure for the control group (Table 2a).18 The impacts of the program on personal care costs in the other two states were smaller. In New Jersey, personal care costs for the treatment group were $1,587 (or 16 percent) higher than those for the control group (Table 2b). Similarly, the costs for waiver services in Florida were $2,108 (or 15 percent) higher for the treatment group than for the control group (Table 2c).
In all three states, the treatment-control difference in costs for personal care/waiver services was greater for the nonelderly than for the elderly. The program's differential effects for the two age groups was most pronounced in Florida, where the treatment-control difference in costs for waiver services was $3,696 for the nonelderly but only $433 (and statistically insignificant) for the elderly. (It is not particularly surprising that there was little treatment-control difference in costs for the elderly, since only 40 percent of the elderly treatment group actually received an allowance. Most elderly treatment group members simply participated in the traditional program.)
For the cohort of early enrollees, we compared expenditures for the costed-out service during the second year postenrollment to those of the first year (Table 2a, Table 2b and Table 2c). In Arkansas, the treatment-control difference was somewhat smaller in dollars ($2,014 in year 2, compared with $2,453 in year 1) but larger as a percentage of the control group mean (110 percent in year 2, compared with 102 percent in year 1). In New Jersey, the treatment-control difference about doubled from $1,381 (14 percent) to $2,545 (29 percent). In Florida, the treatment-control difference in year 2 of $2,375 (15 percent) was similar to that of year 1 ($2,507).
Program Impacts per Recipient
Reasons for the treatment-control cost differences vary across states. At least part of the difference in Arkansas and New Jersey stems from the fact that the treatment group was more likely to receive at least some paid services during each month of the study period. Even among those who received services in a given month, however, expenditures for the costed-out service for the treatment group were higher than those for the control group for at least one of the age groups in each of the three states.
In particular, in Arkansas, the expenditures per month of personal care benefit received were, on average, $86 (24 percent) higher for the treatment group ($445) than for the control group ($359; see Table 3a). The treatment-control difference in personal care costs per recipient month was similar for elderly and nonelderly enrollees, as well as for the first and second postenrollment years.
In New Jersey, there were only modest treatment-control differences in costs per recipient month in both postenrollment years, and these differences were entirely driven by the nonelderly. In particular, expenditures per recipient for the nonelderly treatment group were $47 (4 percent) higher than those for the nonelderly control group in year 1 (Table 3b). The difference was slightly greater ($72, or 6 percent) in year 2 (not shown). In contrast, for the elderly, monthly costs per recipient for the treatment group were almost identical to those for the control group.
Finally, in Florida, monthly costs per recipient were $168 (13 percent) higher for the treatment group than for the control group during year 1, but this difference was driven entirely by the nonelderly (Table 3c). Nonelderly costs per recipient for the treatment group averaged nearly $300 (18 percent) per month higher than those for the control group during the first postenrollment year, while costs for the elderly treatment group were not significantly different from those for the control group. Again, the treatment-control difference in waiver costs per recipient was similar in both postenrollment years.
Comparisons of Actual Costs with Expected Costs
To illuminate further why expenditures for the costed-out service were higher for treatment than for control group recipients, we compare monthly ratios of average "actual full costs" (expenditures for the costed-out service plus expenditures for fiscal agent and counseling services) with average "expected full costs" (the value of the recipients' discounted care plan at baseline plus expected costs for fiscal agent and counseling services). In Arkansas, we also compare the actual allowance costs (excluding fiscal agent and counseling costs) with the "expected allowance" (the value of the recipients' discounted care plan at baseline). Because Arkansas incurred substantial savings on fiscal agent and counseling services, the ratios for allowance recipients are very different, depending on whether fiscal agent and counseling costs are included.
This analysis shows that costs per recipient were higher for the treatment group than for the control group, for two reasons: (1) control group personal care recipients incurred lower-than-expected costs each month, and (2) treatment group allowance recipients appeared to be more likely than control group members to receive sizable increases in their care plans.
Underservice in the Control Group. In each state, particularly in the first postenrollment year, control group recipients had ratios lower than 1. This means that their average actual full costs were lower than their expected full costs.19 Underservice in the control group was particularly problematic in Arkansas, where both nonelderly and elderly personal care recipients incurred only about 80 percent of their expected (already discounted) full costs during both the first and the second postenrollment year (Figure 1a and Figure 1b). During the first postenrollment year in New Jersey, actual full costs were also lower than expected full costs for control group recipients, with monthly ratios for the nonelderly ranging from .86 to .92 (Figure 2a) and monthly ratios for the elderly ranging from .93 to 1 (Figure 2b).
Control group recipients' average full costs rose over time; in New Jersey, they were on par with their expected full costs by the second year. Underservice for the control group was modest in Florida and pertained only to the nonelderly. While nonelderly waiver recipients in the control group in Florida had an average ratio of about .9 during the early months of the demonstration, their waiver expenditures increased over time. By the end of the first year, control group recipients' average actual full costs were on par with their expected full costs. By the end of the second year, average actual full costs were 20 percent greater than their expected full costs (Figure 3a).
Relatively Generous Reassessments for Allowance Recipients. In Arkansas, actual allowance costs (excluding fiscal agent and counseling costs) among recipients were similar to their expected allowance costs during the early part of year 1 (Figure 1a and Figure 1b). By month 6, the average allowance was about 20 percent higher than the average expected allowance costs; by the end of the first year and throughout the second year, it was 28-32 percent higher.20 The increase in allowances appears to stem from the fact that a small percentage of treatment group members received reassessments with sizable increases in their care plan. (Between baseline and month 12, about 9 percent of treatment group members received increases of 16-32 hours per month in their care plans, and 7 percent of treatment group members received increases of more than 32 hours per month (about 35-70 percent of the overall mean care plan hours; see Dale et al. 2004a)). Nonetheless, actual full costs (including allowance costs plus fiscal agent/counseling costs) for both elderly and nonelderly allowance recipients were similar to expected full costs throughout the first and second years (nonelderly ratios were .92 to .98; elderly ratios typically were 1 to 1.05). In spite of increased allowances, actual full costs remained similar to expected full costs, because Arkansas decreased the amount it paid for monthly fiscal agent/counseling costs over the course of the demonstration.
In New Jersey, during the early months postenrollment, both elderly and nonelderly allowance recipients received about 90 percent of their expected full costs (Figure 2a and Figure 2b).21 For allowance recipients, however, ratios increased, and actual full costs were about equal to expected full costs by month 12. By the end of the second year, actual full costs were about 13 percent higher than their expected full costs. Control group recipients' ratios also rose. By the end of the second year, the average ratios were only 1.06 for the nonelderly and 1.07 for the elderly. Thus, the treatment group may have received favorable reassessments, as its monthly ratios were several percentage points higher than those of the control group. It is unclear, however, why Medicaid nurses would have been more generous in their assessments than the agencies responsible for assessing the control group. Alternatively, it may be that the increases the control group members received in their care plans when they were reassessed were similar to those of the treatment group members but that agencies could not provide all the care authorized.22
For the nonelderly in Florida, allowance recipients' actual costs were higher than expected full costs throughout the two-year period but stayed relatively flat at about 1.2 (Figure 3a). Reassessment data were not available for Florida. However, we can infer from the ratios of actual to expected costs that a sizable minority of consumers received increases in their care plans when their spending plan was approved. For example, during the first four months postenrollment, the median actual full costs for allowance recipients were at least 50 percent higher than their expected full costs (not shown), although only a few treatment group members developed spending plans soon after enrollment. During months 5 and 6 postenrollment (when most treatment group members started receiving allowances), the median ratio was approximately 1; still, a quarter of allowance recipients incurred actual costs that were at least 55 percent more than their expected full costs.
For the elderly in Florida, at the beginning of the demonstration, cost ratios were slightly higher than 1 for both allowance recipients and control group recipients (Figure 3b). Over time, cost ratios rose for both groups. In fact, the cost ratios for the control group (around 1.3 for most of the second year) were higher than those for allowance recipients (which ranged from 1.1 to 1.2 for most of the second year). Thus, for the elderly in Florida, the pattern of allowance recipients' having higher ratios than control group recipients was reversed.
Program Effects on Other Medicaid and Medicare Costs
Cash and Counseling affected costs for other Medicaid and Medicare services besides that of the costed-out service. Most notably, in Arkansas and New Jersey, expenditures for long-term care services for the treatment group were lower than those for the control group. In all three states, however, the program had little effect on other Medicare services, such as hospital expenditures, physician services, hospice, or durable medical equipment.
Arkansas
Year 1. In Arkansas, the treatment group's higher PCS expenditures were partially offset by lower expenditures for other Medicaid services during the first year postenrollment. Annual hospital inpatient expenditures for the full sample were $205 lower for the treatment group than for the control group; this difference was driven by the program's annual reduction of $824 in hospital expenditures for the nonelderly enrollees (Table 4a).23 The overall pattern of impacts for the other types of services suggests that, particularly for the nonelderly, the program decreased expenditures for services for which PCS was a close substitute--home health and nursing facility services--as well as for the ElderChoices and Alternatives waiver programs. The expenditures for each of these services were lower for the treatment group than for the control group, although the effects generally were not statistically significant. The sole exception was that nursing facility expenditures for nonelderly treatment group members were significantly lower, on average, than those for nonelderly control group members.
Overall, the treatment group's lower expenditures for these other Medicaid services only partly offset the group's higher personal care expenditures. Therefore, for the full sample, total Medicaid expenditures in Arkansas were $1,531 (14 percent) higher for the treatment group than for the control group during the first year postenrollment, a statistically significant difference.
Cash and Counseling did not significantly affect Medicare expenditures for particular services and in total. Because of the increase in total Medicaid expenditures, for the full sample, the treatment group's combined Medicaid and Medicare expenditures ($21,653) were significantly higher than the control group's ($20,227).
Comparison of Year 2 with Year 1. For the cohort of early enrollees in Arkansas, the treatment-control difference in total Medicaid expenditures was significant during the first year ($1,420, or 13 percent); during the second year, however, it was much smaller and not statistically significant ($500, or 5 percent; Table 4b). The treatment-control difference in combined Medicaid and Medicare expenditures was smaller during the second year than during the first. Even during the first year, however, the effect of the program on combined Medicaid and Medicare expenditures was statistically insignificant for this smaller cohort.
The change in the program's impact on total Medicaid costs from the first to the second year was due to two factors. First, the treatment-control gap in personal care costs narrowed. The percentage of sample members in both groups who received any PCS fell by about 20 percent.24 However, expenditures per recipient month for the treatment group (about $466 during both years; see Table 3a) were higher than for the control group (about $365 in both years). Thus, the decrease in the proportion receiving any personal care led to a larger reduction in average expenditures per treatment group member between the first and second years than in average expenditures per control group member. Therefore, the treatment-control difference in personal care expenditures during the second year ($2,014) was smaller than the groups' first-year difference ($2,453) (Table 5a).
The second reason for the change in total expenditure impacts between the first and second years pertains to expenditures for nonpersonal care. The treatment-control savings in nonpersonal care Medicaid expenditures during the second year ($1,514) was greater than during the first ($1,033), mainly because of the program's savings on nursing facility expenditures. In particular, the treatment group's savings in Medicaid nursing facility expenditures was $600 during the second year, more than twice the $235 savings observed during the first.
New Jersey
Year 1. In New Jersey, for the full sample, savings in other (nonpersonal care) Medicaid expenditures offset about half the treatment group's higher personal care expenditures during the first postenrollment year. Notably, for the full sample, there were significant savings in nursing facility ($505) and home health services ($263) (Table 5a). The only Medicaid service category for which treatment group expenditures were higher than those for the control group was hospice services (by $136). In total, the treatment group's Medicaid expenditures ($23,370) for all services were only $861 (4 percent) higher than those of the control group--a statistically insignificant difference.
Patterns for the elderly and the nonelderly in New Jersey were similar for the first postenrollment year. The effects of the program were generally not statistically significant, however, because of the smaller samples when the effects are analyzed separately. There were two exceptions: (1) for the nonelderly, the program incurred significant savings in home health ($419); and (2) for the elderly, the program incurred significant savings in nursing facility services ($646). For both the elderly and the nonelderly, these savings partly offset the treatment group's higher personal care expenditures, which resulted in statistically insignificant treatment-control differences in total Medicaid expenditures.
The program did not significantly affect any of the spending for particular Medicare services, total Medicare services, or total combined Medicaid and Medicare services. (The treatment-control difference in combined Medicaid and Medicare spending ($2,518) was sizable, although not statistically significant.)
Comparison of Year 2 with Year 1. For New Jersey's cohort of early enrollees, the treatment-control difference in personal care expenditures increased from $1,381 to $2,545 (Table 5b). This was primarily due to the fact that the gap in personal care receipt increased; the treatment group was seven percentage points more likely than the control group to receive any personal care in year 1 and 13 percentage points more likely in year 2. A secondary reason for this increase is that care recipients' expenditures per month increased by a larger percentage for the treatment group than for the control group, possibly due to favorable reassessments or to labor shortages preventing control group members from receiving their authorized care. (As noted earlier, the care plan hours of many allowance recipients increased considerably during the demonstration; however, comparable data were not available for the control group. Members of the control group may have been authorized to receive more care, but, because of labor shortages, agencies may have been unable to provide all of that care.)
Primarily because of the large increase in the treatment-control difference in personal care expenditures, the difference in total Medicaid expenditures in New Jersey also increased (from $328 to $2,379). The increase was due, in part, to a sizable decline in savings in other Medicaid services. While there was an estimated savings of $1,053 on all other Medicaid expenditures during year 1, the savings on other Medicaid services fell to $165 in year 2 (and was statistically insignificant). As in the first postenrollment year, the increase in total Medicaid and Medicare expenditures was sizable but not statistically significant.
Florida
Year 1. The program had only one statistically significant effect on nonwaiver Medicaid costs for any of the samples in Florida in the first postenrollment year: for the elderly, the treatment group had significantly higher home health expenditures (at the .10 level) than the control group (Table 6a).25 These costs were offset by sizable, but not statistically significant, savings in inpatient and skilled nursing facility services. Because the effects on other Medicaid services offset each other, the program had no effect on total Medicaid costs or on total Medicare costs for the elderly.
For the nonelderly, there were no other significant differences in nonwaiver costs. Therefore, the treatment-control difference in total Medicaid expenditures was similar to the treatment-control difference in waiver costs.
Finally, for Florida's nonelderly, there was a statistically significant treatment-control difference (-$108) in Medicare nursing facility expenditures. The program had no other significant effects on spending on particular Medicare services or total Medicare services for the nonelderly, elderly, or full sample during the first year.
Comparison of Year 2 with Year 1. In Florida, the treatment-control difference in waiver expenditures, other (nonwaiver) expenditures, and total Medicaid expenditures was similar in both years (Table 6b). The findings for the second postenrollment year in Florida also were similar to those of the first postenrollment year in that the treatment-control difference in waiver expenditures was positive and statistically significant for the nonelderly, but not for the elderly.
Program Effects on Service Use
Cash and Counseling's effects on Medicaid and Medicare service use were similar to its effects on expenditures.26 In Arkansas, treatment group members were less likely than control group members (although not significantly so) to use any inpatient services, home health services, or nursing facility services during the first postenrollment year (Table 7a). During the second year, the treatment group was significantly less likely than the control group to use long-term care services. The most striking finding is that the treatment group was 40 percent less likely than the control group to have a nursing facility stay, with only 7.9 percent of treatment group members, compared to 13.5 percent of control group members, having any Medicaid nursing facility expenditures. Similarly, treatment group members spent an average of 19.1 days in nursing facilities, 7.3 fewer than control group members. Treatment group members also were less likely than control group members to have any (Medicaid or Medicare) nursing facility admission, and they had fewer home health therapy visits. These findings were consistent with the expenditure impacts, as treatment group members had lower expenditures than control group members on long-term care services, particularly during the second year.
In New Jersey, the program had few significant effects on service use, although the direction of the treatment-control differences mirrors the expenditure results. During year 1, treatment group members were slightly less likely than control group members to use home health services (13.5 versus 16.1 percent; Table 7b). They also had fewer home health skilled nursing visits. However, treatment group members were more likely to have any Medicare nursing facility services expenditures (7.4 versus 5.6 percent). Although the treatment group had significantly lower nursing facility expenditures than the control group in the first year, the treatment-control difference in Medicaid nursing facility service use was negative but statistically insignificant (3.7 versus 4.9 percent).
In Florida, the program also had little effect on service use. One exception was that, during the second year, the treatment group had significantly fewer home health skilled nursing visits than the control group (Table 7c). This finding is somewhat anomalous, as the program did not affect whether beneficiaries used any home health services. The program also had no effect on overall home health expenditures, and, among the elderly, the treatment group had significantly higher Medicaid home health expenditures (probably a result of a few outliers having far more aide services) than the control group.
The Effect of Higher-than-Expected Costs on Care Quality
As noted, the personal care or waiver cost observed for the treatment group was substantially higher than that for the control group. This raises the question of whether the higher satisfaction levels observed for the treatment group (Carlson et al. 2005) were due solely to their average allowance being greater than the cost of services incurred by the control group and not to the program being more flexible and offering greater freedom of choice. If this were true, states might be less interested in developing a consumer-directed program. Therefore, we conducted additional analyses that tested whether the program's effects on key quality indicators (satisfaction with overall care arrangements, satisfaction with life, and unmet need for personal care) changed after we controlled for whether consumers incurred monthly costs that were higher than expected according to the discounted baseline value of their monthly care plan.
In Arkansas and New Jersey, our results suggest that members of both the treatment and the control groups were more satisfied and had fewer unmet needs when they received higher-than-expected benefits, but accounting for that difference did not fully explain the observed treatment-control differences in satisfaction. The program's impacts on satisfaction and unmet needs were smaller after we controlled for the ratio of actual to expected costs, but they were still sizable and statistically significant. For example, for the elderly in Arkansas, the treatment group was 15 percentage points more likely to be very satisfied with their overall care arrangements when we did not control for any cost-ratio indicators (Table A.4). After we controlled for the ratio of actual to expected costs, the estimated treatment-control difference was eight percentage points. Similarly, for the New Jersey elderly, the program's impact on overall satisfaction was 19 percentage points before we controlled for cost ratios and 18 percentage points afterward. (Results were similar for the nonelderly.) In one instance, the program had an adverse impact when we controlled for the ratio of actual to expected costs. Among the elderly in Arkansas, the program had no effect on people's unmet need for personal care before we controlled for cost ratios. However, after we controlled for the treatment group's higher-than-expected costs, the treatment group was significantly more likely than the control group to have an unmet need for personal care. In Florida, none of our cost ratio variables were statistically significant; therefore, including a measure of cost ratios in our regressions did not affect the program's impacts on quality.27
| TABLE 2a. Estimated Effect of Cash and Counseling on Receipt and Cost of Paid Services in Arkansas | |||||||||
| Full Sample, Year 1 | Cohort of Early Enrollees | ||||||||
| Year 1 | Year 2 | ||||||||
| PredictedTreatmentGroupMean(Dollars) | PredictedControlGroupMean(Dollars) | EstimatedEffect(p-value) | PredictedTreatmentGroupMean(Dollars) | PredictedControlGroupMean(Dollars) | EstimatedEffect(p-value) | PredictedTreatmentGroupMean(Dollars) | PredictedControlGroupMean(Dollars) | EstimatedEffect(p-value) | |
| Nonelderly | |||||||||
| Percentage Receiving Any Service | 97.8 | 63.2 | 34.6***(0.0001) | 98.4 | 60.9 | 37.6***(0.0001) | 84.0 | 48.2 | 35.9***(0.0001) |
| Expenditures for Personal Care | 5,435 | 2,430 | 3,005***(0.0001) | 5,736 | 2,545 | 3,191***(0.0001) | 5,030 | 2,009 | 3,021***(0.0001) |
| SAMPLE SIZE | 556 | 383 | 383 | ||||||
| Elderly | |||||||||
| Percentage Receiving Any Service | 96.8 | 75.2 | 21.6***(0.0001) | 97.4 | 76.1 | 21.3***(0.0001) | 71.6 | 56.8 | 14.8***(0.0001) |
| Expenditures for Personal Care | 4,313 | 2,292 | 2,021***(0.0001) | 4,524 | 2,307 | 2,216***(0.0001) | 3,396 | 1,734 | 1,661***(0.0001) |
| SAMPLE SIZE | 1,452 | 929 | 929 | ||||||
| All Ages | |||||||||
| Percentage Receiving Any Service | 97.1 | 71.9 | 25.2***(0.0001) | 97.7 | 71.7 | 26.0***(0.0001) | 75.2 | 54.3 | 20.9***(0.0001) |
| Expenditures for Personal Care | 4,605 | 2,349 | 2,256***(0.0001) | 4,855 | 2,402 | 2,453***(0.0001) | 3,852 | 1,839 | 2,014***(0.0001) |
| SAMPLE SIZE | 2,008 | 1,312 | 1,312 | ||||||
| SOURCE: Medicaid claims data. NOTES: Early enrollees enrolled in the demonstration before May 1, 2000. Expenditure means were predicted using ordinary least squares regression models. Treatment group members received services if they received agency care or an allowance; control group members received services if they received agency care. *** Estimated effect significantly different from zero at .01 level. | |||||||||
| TABLE 2b. Estimated Effect of Cash and Counseling on Receipt and Cost of Paid Services in New Jersey | |||||||||
| Full Sample, Year 1 | Cohort of Early Enrollees | ||||||||
| Year 1 | Year 2 | ||||||||
| PredictedTreatmentGroupMean(Dollars) | PredictedControlGroupMean(Dollars) | EstimatedEffect(p-value) | PredictedTreatmentGroupMean(Dollars) | PredictedControlGroupMean(Dollars) | EstimatedEffect(p-value) | PredictedTreatmentGroupMean(Dollars) | PredictedControlGroupMean(Dollars) | EstimatedEffect(p-value) | |
| Nonelderly | |||||||||
| Percentage Receiving Any Service | 95.8 | 87.6 | 8.2***(0.000) | 96.1 | 87.9 | 8.2***(0.000) | 85.2 | 67.6 | 17.7***(0.000) |
| Expenditures for Personal Care | 11,166 | 9,220 | 1,946***(0.000) | 11,086 | 9,123 | 1,964***(0.000) | 11,772 | 8,127 | 3,645***(0.000) |
| SAMPLE SIZE | 813 | 671 | 671 | ||||||
| Elderly | |||||||||
| Percentage Receiving Any Service | 97.0 | 89.7 | 7.2***(0.000) | 96.9 | 90.8 | 6.2***(0.000) | 83.2 | 74.0 | 9.2***(0.002) |
| Expenditures for Personal Care | 11,891 | 10,650 | 1,241***(0.000) | 11,689 | 10,825 | 864***(0.000) | 10,938 | 9,396 | 1,542**(0.025) |
| SAMPLE SIZE | 917 | 776 | 776 | ||||||
| All Ages | |||||||||
| Percentage Receiving Any Service | 86.4 | 88.7 | 7.7***(0.000) | 96.5 | 89.4 | 7.1***(0.000) | 84.1 | 71.0 | 13.1***(0.000) |
| Expenditures for Personal Care | 11,557 | 9,970 | 1,587***(0.000) | 11,412 | 10,031 | 1,381***(0.000) | 11,337 | 8,792 | 2,545***(0.000) |
| SAMPLE SIZE | 1,730 | 1,447 | 1,447 | ||||||
| SOURCE: Medicaid claims data. NOTES: Early enrollees enrolled in the demonstration before January 1, 2002. Expenditure means were predicted using ordinary least squares regression models. Treatment group members received services if they received agency care or an allowance; control group members received services if they received agency care. ** Estimated effect significantly different from zero at .05 level. *** Estimated effect significantly different from zero at .01 level. | |||||||||
| TABLE 2c. Estimated Effect of Cash and Counseling on Receipt and Cost of Paid Services in Florida | |||||||||
| Full Sample, Year 1 | Cohort of Early Enrollees | ||||||||
| Year 1 | Year 2 | ||||||||
| PredictedTreatmentGroupMean(Dollars) | PredictedControlGroupMean(Dollars) | EstimatedEffect(p-value) | PredictedTreatmentGroupMean(Dollars) | PredictedControlGroupMean(Dollars) | EstimatedEffect(p-value) | PredictedTreatmentGroupMean(Dollars) | PredictedControlGroupMean(Dollars) | EstimatedEffect(p-value) | |
| Nonelderly | |||||||||
| Percentage Receiving Any Service | 99.6 | 99.8 | -0.2(0.562) | 99.8 | 99.8 | 0.0(0.991) | 97.6 | 97.4 | 0.2(0.856) |
| Expenditures for Waiver Services | 22,017 | 18,321 | 3,696***(0.000) | 22,467 | 18,918 | 3,549***(0.000) | 24,932 | 21,491 | 3,441***(0.001) |
| SAMPLE SIZE | 913 | 833 | 833 | ||||||
| Elderly | |||||||||
| Percentage Receiving Any Service | 99.1 | 98.7 | 0.5(0.520) | 99.3 | 98.3 | 1.0(0.249) | 81.1 | 75.5 | 5.6*(0.097) |
| Expenditures for Waiver Services | 10,496 | 10,063 | 433(0.223) | 10,412 | 9,601 | 811*(0.077) | 8,983 | 8,328 | 655(0.328) |
| SAMPLE SIZE | 904 | 531 | 531 | ||||||
| All Ages | |||||||||
| Percentage Receiving Any Service | 99.3 | 99.2 | 0.1(0.779) | 99.6 | 99.2 | 0.4(0.320) | 90.7 | 88.4 | 2.3(0.151) |
| Expenditures for Waiver Services | 16,301 | 14,193 | 2,108***(0.000) | 17,508 | 14,999 | 2,507***(0.000) | 18,354 | 15,978 | 2,375***(0.000) |
| SAMPLE SIZE | 1,817 | 1,424 | 1,424 | ||||||
| SOURCE: Medicaid claims data. NOTES: Early enrollees enrolled in the demonstration before October 1, 2001. Expenditure means were predicted using ordinary least squares regression models. Treatment group members received services if they received agency care or an allowance; control group members received services if they received agency care. * Estimated effect significantly different from zero at .10 level. *** Estimated effect significantly different from zero at .01 level. | |||||||||
| TABLE 3a. Effect of Cash and Counseling on Personal Care Expenditures Per Recipient Month in Arkansas | ||||
| Expenditure Outcome | SampleSize | PredictedTreatmentGroup Mean(Dollars) | PredictedControlGroup Mean(Dollars) | EstimatedEffect(p-value) |
| All Enrollees | ||||
| Nonelderly | ||||
| - Expenditures per recipient month, first follow-up year | 454 | 513 | 422 | 91***(0.000) |
| Elderly | ||||
| - Expenditures per recipient month, first follow-up year | 1,269 | 420 | 336 | 84***(0.000) |
| Elderly and Nonelderly | ||||
| - Expenditures per recipient month, first follow-up year | 1,723 | 445 | 359 | 86***(0.000) |
| Early Enrollees Onlya | ||||
| Nonelderly and Elderly | ||||
| - Expenditures per recipient month, first follow-up year | 1,125 | 465 | 363 | 102***(0.000) |
| - Expenditures per recipient month, second follow-up year | 879 | 467 | 369 | 98***(0.000) |
SOURCE: Medicaid claims data for the period from December 1997 through April 2002. NOTE: Means were predicted using ordinary least squares regression models. *** Significantly different from zero at the .01 level, two-tailed test.
| ||||
| TABLE 3b. Effect of Cash and Counseling on Personal Care Expenditures Per Recipient Month in New Jersey | ||||
| Expenditure Outcome | SampleSize | PredictedTreatmentGroup Mean(Dollars) | PredictedControlGroup Mean(Dollars) | EstimatedEffect(p-value) |
| All Enrollees | ||||
| Nonelderly | ||||
| - First-year expenditures per recipient month | 745 | 1,153 | 1,106 | 47**(0.043) |
| Elderly | ||||
| - First-year expenditures per recipient month | 855 | 1,170 | 1,172 | -1(0.926) |
| All | ||||
| - First-year expenditures per recipient month | 1,600 | 1,164 | 1,140 | 25(0.112) |
| Early Enrollees Only | ||||
| All (Nonelderly and Elderly) Early Enrollees | ||||
| - First-year expenditures per recipient month | 1,344 | 1,151 | 1,129 | 22(0.193) |
| - Second-year expenditures per recipient month | 1,121 | 1,264 | 1,219 | 45*(0.051) |
| SOURCE: Medicaid claims data. NOTE: Early enrollees enrolled in the demonstration before January 1, 2002. Means were predicted using ordinary least squares regression models. Treatment group members received services if they received agency care or an allowance; control group members received services if they received agency care. * Estimated effect significantly different from zero at .10 level. ** Estimated effect significantly different from zero at .05 level. | ||||
| TABLE 3c. Effect of Cash and Counseling on Waiver Expenditures Per Recipient Month in Florida | ||||
| Expenditure Outcome | SampleSize | PredictedTreatmentGroup Mean(Dollars) | PredictedControlGroup Mean(Dollars) | EstimatedEffect(p-value) |
| All Enrollees | ||||
| Nonelderly | ||||
| - Expenditures per recipient month, first follow-up year | 910 | 1,884 | 1,593 | 291***(0.000) |
| Elderly | ||||
| - Expenditures per recipient month, first follow-up year | 894 | 983 | 967 | 16(0.509) |
| All | ||||
| - Expenditures per recipient month, first follow-up yaer | 1,804 | 1,460 | 1,292 | 168***(0.000) |
| Early Enrollees Only | ||||
| All (Nonelderly and Elderly) | ||||
| - First-year expenditures per recipient month | 1,415 | 1,553 | 1,357 | 197***(0.000) |
| - Second-year expenditures per recipient month | 1,275 | 1,814 | 1,630 | 184***(0.001) |
| SOURCE: Medicaid claims data. NOTE: Early enrollees enrolled in the demonstration before October 1, 2001. Means were predicted using ordinary least squares regression models. Treatment group members received services if they received waiver services or an allowance; control group members received services if they received waiver services. *** Estimated effect significantly different from zero at .01 level. | ||||
| FIGURE 1a. Arkansas's Ratios of Mean Actual to Mean Expected Cost Ratios for the Nonelderly |
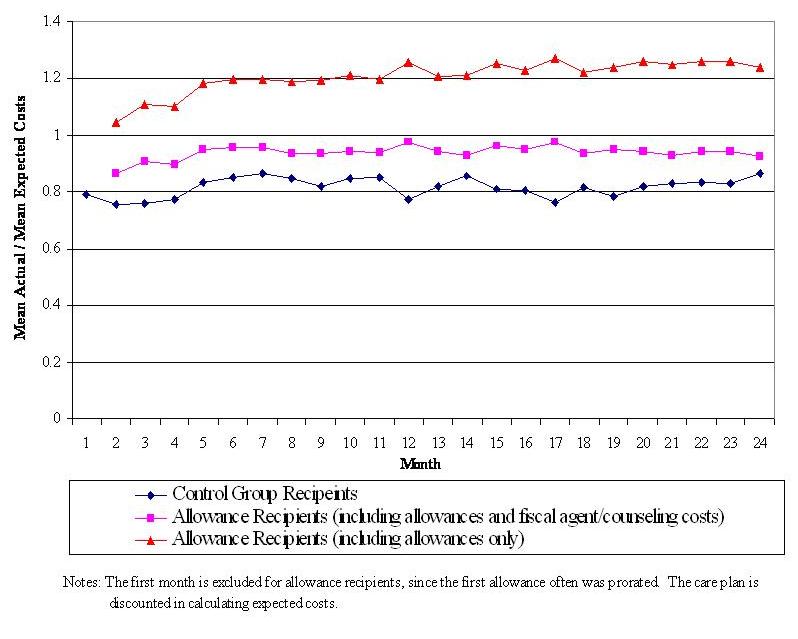 |
| FIGURE 1b. Arkansas's Ratios of Mean Actual to Mean Expected Cost Ratios for the Elderly |
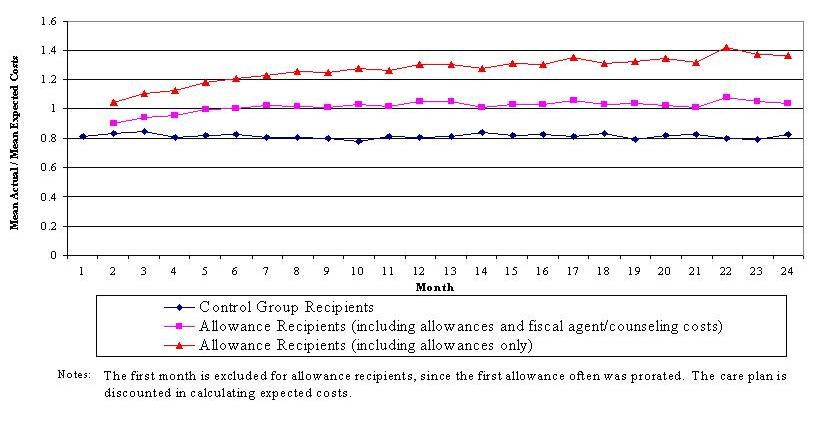 |
| FIGURE 2a. New Jersey's Ratios of Mean Actual to Mean Expected Costs for the Nonelderly |
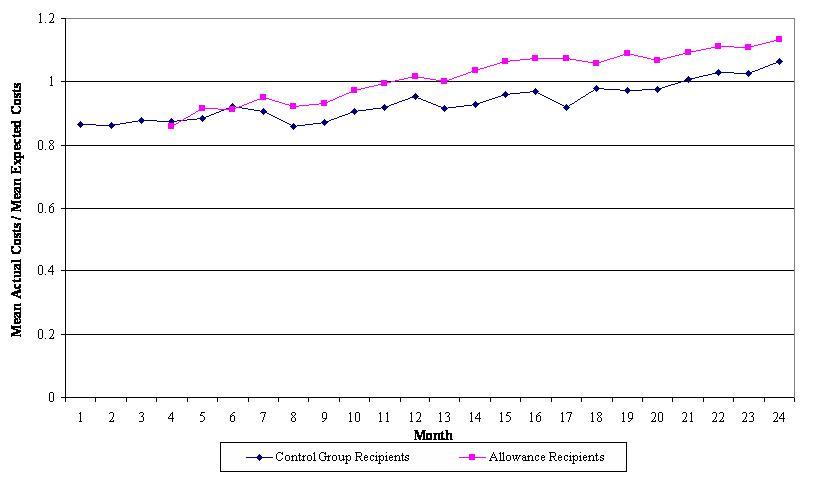 |
| Notes: Early months are excluded for allowance recipients since few (less than 100) individuals had received full allowance. |
| FIGURE 2b. New Jersey's Ratios of Mean Actual to Mean Expected Costs for the Elderly |
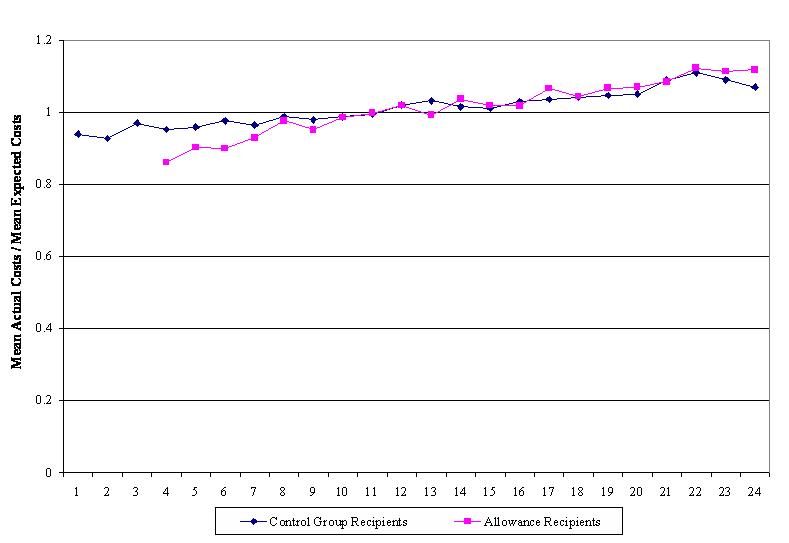 |
| Notes: Early months are excluded for allowance recipients since few (less than 100) individuals had received full allowances. |
| FIGURE 3a. Florida's Ratios of Mean Actual to Mean Expected Costs for the Nonelderly |
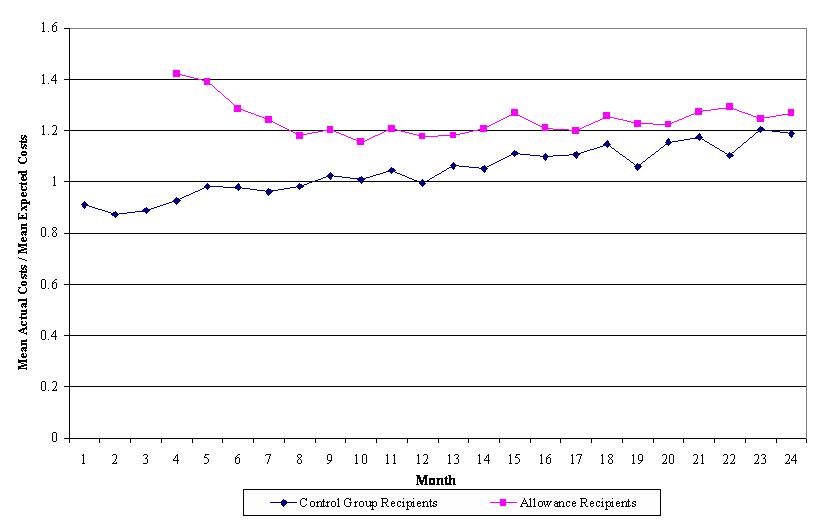 |
| Notes: Early months are excluded for allowance recipients since few (less than 100) individuals had received full allowances. |
| FIGURE 3b. Florida's Ratios of Mean Actual to Mean Expected Costs for the Elderly |
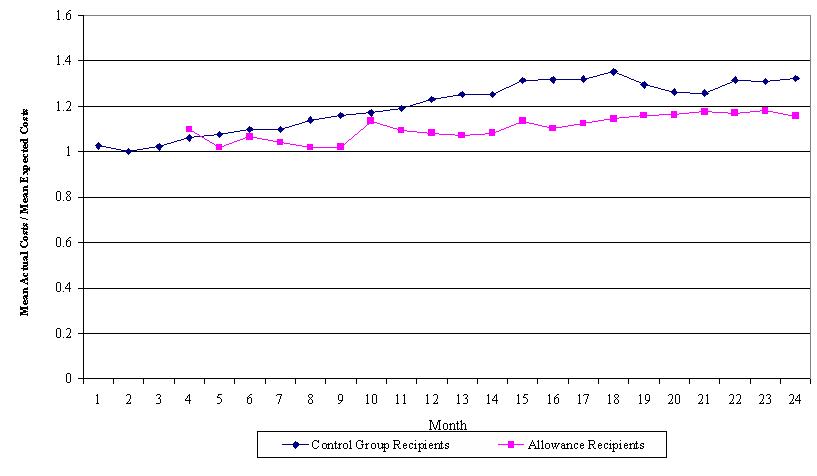 |
| Notes: Data for early months are excluded for allowance recipients since few (less than 50) individuals received full allowances. Baseline costs include the discounted care plan value plus expected fiscal agent and counseling costs. |
| TABLE 4a. Effect of Cash and Counseling on Annual Expenditures for Medicaid and Medicare Services During the First Postenrollment Year in Arkansas | |||||||||
| Expenditure Category | Nonelderly | Elderly | All | ||||||
| PredictedTreatmentGroupMean(Dollars) | PredictedControlGroupMean(Dollars) | EstimatedEffect(p-value) | PredictedTreatmentGroupMean(Dollars) | PredictedControlGroupMean(Dollars) | EstimatedEffect(p-value) | PredictedTreatmentGroupMean(Dollars) | PredictedControlGroupMean(Dollars) | EstimatedEffect(p-value) | |
| MEDICAID | |||||||||
| - Personal care | 5,435 | 2,430 | 3,005***(0.000) | 4,313 | 2,292 | 2,021***(0.000) | 4,605 | 2,349 | 2,256***(0.000) |
| - Nonpersonal care | 8,689 | 10,432 | -1,743**(0.035) | 7,211 | 7,530 | -320(0.197) | 7,613 | 8,339 | -726**(0.014) |
| - Total | 14,125 | 12,862 | 1,263(0.136) | 11,523 | 9,822 | 1,701***(0.000) | 12,219 | 10,688 | 1,531***(0.000) |
| MEDICARE | 5,986 | 5,884 | 102(0.942) | 10,888 | 10,806 | 82(0.917) | 9,434 | 9,539 | -105(0.878) |
| COMBINED MEDICAID AND MEDICARE | 20,111 | 18,746 | 1,365(0.418) | 22,411 | 20,628 | 1,784**(0.044) | 21,653 | 20,227 | 1,436*(0.071) |
| MEDICAID TYPE OF SERVICE | |||||||||
| - Personal care | 5,435 | 2,430 | 3,005***(0.000) | 4,313 | 2,292 | 2,021***(0.000) | 4,605 | 2,349 | 2,256***(0.000) |
| - Nursing facility | 18 | 242 | -224**(0.030) | 821 | 917 | -96(0.592) | 592 | 737 | -146(0.269) |
| - Home health | 594 | 916 | -322(0.123) | 187 | 231 | -43(0.125) | 311 | 410 | -99(0.106) |
| - ElderChoices | 11 | 13 | -2(0.917) | 2,673 | 2,810 | -137(0.282) | 1,919 | 2,053 | -134(0.147) |
| - Alternatives | 934 | 1,122 | -188(0.565) | n.a. | n.a. | n.a. | 265 | 304 | -40(0.714) |
| - Inpatient care | 1,087 | 1,911 | -824**(0.036) | 437 | 439 | -2(0.946) | 629 | 833 | -205*(0.061) |
| - Prescription drugs | 2,717 | 2,495 | 221(0.317) | 1,799 | 1,851 | -51(0.511) | 2,048 | 2,035 | 12(0.881) |
| - Transportation | 266 | 322 | -56(0.492) | 53 | 61 | -8(0.604) | 113 | 133 | -20(0.410) |
| - Case management | 22 | 15 | 7(0.413) | 111 | 115 | -4(0.705) | 85 | 89 | -3(0.657) |
| - DME | 567 | 719 | -152(0.106) | 283 | 282 | 1(0.929) | 361 | 403 | -42(0.134) |
| - Hospice | 112 | 19 | 94(0.465) | 28 | 9 | 19(0.428) | 49 | 13 | 36(0.346) |
| - Other servicesa | 2,362 | 2,659 | -297(0.313) | 818 | 815 | 3(0.970) | 1,243 | 1,328 | -84(0.343) |
| MEDICARE TYPE OF SERVICE | |||||||||
| - Nursing facility | 56 | 37 | 19(0.689) | 639 | 656 | -16(0.891) | 476 | 486 | -10(0.913) |
| - Home health | 216 | 359 | -143(0.207) | 1,050 | 1,060 | -9(0.945) | 823 | 862 | -39(0.705) |
| - DME | 741 | 686 | 54(0.751) | 952 | 1,038 | -86(0.351) | 908 | 926 | -18(0.824) |
| - Inpatient | 2,947 | 3,105 | -158(0887) | 5,465 | 5,488 | -23(0.966) | 4,646 | 4,949 | -303(0.540) |
| - Hospice | 98 | 6 | 92(0.403) | 42 | 146 | -103(0.138) | 56 | 109 | -52(0.367) |
| - Other | 1,928 | 1,690 | 238(0.492) | 2,739 | 2,419 | 320(0.174) | 2,525 | 2,207 | 318(0.103) |
| SAMPLE SIZE | 556 | 1,452 | 2,008 | ||||||
SOURCE: Medicaid and Medicare claims data, for the period from December 1997 through April 2002. NOTES: Means were predicted using ordinary least squares regression models. DME = durable medical equipment; n.a. = not applicable. * Significantly different from zero at the .10 level, two-tailed test. ** Significantly difference from zero at the .05 level, two-tailed test. *** Significantly difference from zero at the .01 level, two-tailed test.
| |||||||||
| TABLE 4b. Effect of Cash and Counseling on Early Enrollees' Annual Expenditures for Medicaid and Medicare Services in Arkansas, By Year | ||||||
| Expenditure Category | First Year Postenrollment | Second Year Postenrollment | ||||
| PredictedTreatmentGroupMean(Dollars) | PredictedControlGroupMean(Dollars) | EstimatedEffect(p-value) | PredictedTreatmentGroupMean(Dollars) | PredictedControlGroupMean(Dollars) | EstimatedEffect(p-value) | |
| MEDICAID | ||||||
| - Personal care | 4,855 | 2,402 | 2,452***(0.000) | 3,852 | 1,839 | 2.014***(0.000) |
| - Nonpersonal care | 7,229 | 8,261 | -1,033***(0.006) | 7,229 | 8,743 | -1,514***(0.003) |
| - Total | 12,083 | 10,663 | 1,420**(0.000) | 11,082 | 10,582 | 500(0.359) |
| MEDICARE | 8,827 | 9,261 | -435(0.606) | 7,948 | 8,091 | -143(0.859) |
| COMBINED MEDICAID AND MEDICARE | 20,910 | 19,924 | 986(0.309) | 19,030 | 18,673 | 357(0.736) |
| MEDICAID TYPE OF SERVICE | ||||||
| - Personal care | 4,855 | 2,402 | 2,453***(0.000) | 3,852 | 1,839 | 2,014***(0.000) |
| - Nursing facility | 460 | 696 | -235(0.125) | 1,149 | 1,749 | -600**(0.045) |
| - Home health | 337 | 479 | -142(0.109) | 218 | 373 | -156**(0.012) |
| - ElderChoices | 1,752 | 1,961 | -209**(0.047) | 1,384 | 1,585 | -202(0.147) |
| - Alternatives | 344 | 360 | 83(0.512) | 503 | 602 | -99(0.577) |
| - Inpatient care | 594 | 853 | -259*(0.086) | 594 | 743 | -149(0.218) |
| - Prescription drugs | 1,988 | 2,026 | -38(0.707) | 1,817 | 1,917 | -99(0.388) |
| - Transportation | 85 | 137 | -52**(0.029) | 102 | 150 | -48(0.263) |
| - Case management | 80 | 80 | -1(0.950) | 51 | 61 | -9(0.258) |
| - DME | 349 | 406 | -57(0.113) | 289 | 294 | -5(0.894) |
| - Hospice | 54 | 3 | 50(0.335) | 43 | 14 | 29(0.326) |
| - Other servicesa | 1,187 | 1,360 | -173(0.120) | 1,079 | 1,254 | -175(0.309) |
| MEDICARE TYPE OF SERVICE | ||||||
| - Nursing facility | 381 | 383 | -2(0.984) | 384 | 649 | -265**(0.027) |
| - Home health | 791 | 671 | 120(0.337) | 635 | 634 | 1(0.992) |
| - DME | 803 | 878 | -75(0.422) | 689 | 854 | -164(0.116) |
| - Inpatient | 4,504 | 5,079 | -575(0.370) | 3,953 | 3,811 | 142(0.796) |
| - Hospice | 84 | 169 | -85(0.341) | 15 | 78 | -64(0.154) |
| - Other | 2,264 | 2,081 | 182(0.326) | 2,272 | 2,065 | 207(0.391) |
| SAMPLE SIZE | 658 | 654 | 658 | 654 | ||
SOURCE: Medicaid and Medicare claims data for the period from December 1997 through April 2002. NOTE: Early enrollees were those who enrolled in the demonstration before May 2000. DME = durable medical equipment; n.a. = not applicable. * Significantly different from zero at the .10 level, two-tailed test. ** Significantly difference from zero at the .05 level, two-tailed test. *** Significantly difference from zero at the .01 level, two-tailed test.
| ||||||
| TABLE 5a. Effect of Cash and Counseling on Annual Expenditures for Medicaid and Medicare Services During the First Postenrollment Year in New Jersey | |||||||||
| Dependent Variable | Nonelderly | Elderly | Full Sample | ||||||
| PredictedTreatmentGroupMean(Dollars) | PredictedControlGroupMean(Dollars) | EstimatedEffect(p-value) | PredictedTreatmentGroupMean(Dollars) | PredictedControlGroupMean(Dollars) | EstimatedEffect(p-value) | PredictedTreatmentGroupMean(Dollars) | PredictedControlGroupMean(Dollars) | EstimatedEffect(p-value) | |
| TOTAL PERSONAL CARE, MEDICAID, AND MEDICARE | |||||||||
| - Personal care | 11,166 | 9,220 | 1,946***(0.000) | 11,891 | 10,650 | 1,241***(0.001) | 11,557 | 9,970 | 1,587***(0.000) |
| - Nonpersonal care | 15,697 | 16,829 | -1,132(0.430) | 8,345 | 8,757 | -413(0.501) | 11,813 | 12,540 | -727(0.333) |
| - Total Medicaid | 26,863 | 26,049 | 814(0.588) | 20,236 | 19,407 | 828(0.224) | 23,370 | 22,509 | 861(0.281) |
| - Total Medicare | 10,886 | 10,345 | 541(0.790) | 15,809 | 13,012 | 2,796(0.216) | 13,459 | 11,802 | 1,657(0.284) |
| - Total Medicaid plus Medicare | 37,749 | 36,394 | 1,355(0.591) | 36,044 | 32,420 | 3,625(0.137) | 36,829 | 34,311 | 2,518(0.154) |
| OTHER MEDICAID EXPENDITURES, BY TYPE OF SERVICE | |||||||||
| - Nursing facility | 266 | 621 | -354(0.275) | 521 | 1,170 | -649**(0.046) | 404 | 908 | -505**(0.027) |
| - Home health | 822 | 1,242 | -420*(0.082) | 208 | 351 | -143(0.135) | 502 | 765 | -263**(0.034) |
| - Inpatient | 3,755 | 3,628 | 126(0.899) | 1,724 | 1,484 | 240(0.497) | 2,674 | 2,497 | 177(0.727) |
| - Transportation | 978 | 1,186 | -208(0.236) | 457 | 539 | -82(0.364) | 700 | 845 | -145(0.129) |
| - Prescription drugs | 4,420 | 5,080 | -661(0.184) | 3,721 | 3,648 | 74(0.662) | 4,053 | 4,320 | -267(0.291) |
| - Physician | 114 | 95 | 19(0.529) | 19 | 20 | -1(0.883) | 64 | 55 | 9(0.537) |
| - DME | 669 | 575 | 93(0.655) | 34 | 56 | -22(0.218) | 341 | 291 | 49(0.619) |
| - Case management | 8 | 6 | 1(0.806) | 0 | 0 | 0(n.a.) | 3 | 3 | 0(0.912) |
| - Hospice | 147 | 20 | 127(0.254) | 145 | -1 | 146(0.110) | 146 | 9 | 136*(0.055) |
| - Capitation amount | 883 | 900 | -16(0.875) | 176 | 189 | -13(0.798) | 513 | 518 | -5(0.930) |
| - Other | 3,636 | 3,476 | 160(0.667) | 1,339 | 1,302 | 37(0.872) | 2,414 | 2,328 | 86(0.687) |
| MEDICARE EXPENDITURES, BY TYPE OF SERVICE | |||||||||
| - Nursing facility | 228 | 322 | -94(0.445) | 795 | 696 | 99(0.625) | 535 | 514 | 21(0.863) |
| - Home health | 575 | 534 | 41(0.761) | 942 | 1,108 | -166(0.341) | 767 | 841 | -74(0.508) |
| - Inpatient | 6,567 | 5,221 | 1,346(0.399) | 8,571 | 6,233 | 2,339(0.230) | 7,588 | 5,801 | 1,786(0.164) |
| - Physician | 181 | 219 | -39(0.153) | 399 | 401 | -1(0.966) | 295 | 317 | -22(0.252) |
| - DME | 591 | 511 | 80(0.490) | 588 | 575 | 12(0.874) | 586 | 548 | 38(0.582) |
| - Hospice | 33 | -2 | 34(0.158) | 64 | 6 | 59(0.356) | 51 | 1 | 49(0.161) |
| - Other | 2,712 | 3,539 | -827(0.113) | 4,449 | 3,994 | 454(0.266) | 3,638 | 3,779 | -141(0.672) |
| SAMPLE SIZE | 813 | 917 | 1,730 | ||||||
| SOURCE: Medicaid and Medicare claims data. NOTES: Early enrollees enrolled in the demonstration before January 1, 2002. Means were predicted using ordinary least squares regression models. DME = durable medical equipment. * Estimated effect significantly different from zero at .10 level. ** Estimated effect significantly different from zero at .05 level. *** Estimated effect significantly different from zero at 01 level. | |||||||||
| TABLE 5b. Effect of Cash and Counseling on Early Enrollees' Annual Expenditures for Medicaid and Medicare Services in New Jersey, By Year | ||||||
| Dependent Variable | Cohort of Early Enrollees | |||||
| Year 1 | Year 2 | |||||
| PredictedTreatmentGroupMean(Dollars) | PredictedControlGroupMean(Dollars) | EstimatedEffect(p-value) | PredictedTreatmentGroupMean(Dollars) | PredictedControlGroupMean(Dollars) | EstimatedEffect(p-value) | |
| TOTAL PERSONAL CARE, MEDICAID, AND MEDICARE | ||||||
| - Personal care | 11,412 | 10,031 | 1,381***(0.000) | 11,337 | 8,792 | 2,545***(0.000) |
| - Nonpersonal care | 11,607 | 12,660 | -1,053(0.185) | 10,696 | 10,861 | -165(0.825) |
| - Total Medicaid | 23,019 | 22,691 | 328(0.695) | 22,033 | 19,653 | 2,379***(0.006) |
| - Total Medicare | 13,279 | 11,521 | 1,759(0.300) | 12,217 | 12,303 | -87(0.952) |
| - Total Medicaid plus Medicare | 36,298 | 34,211 | 2,087(0.278) | 34,249 | 31,957 | 2,293(0.203) |
| MEDICAID EXPENDITURES, BY TYPE OF SERVICE | ||||||
| - Nursing facility | 438 | 887 | -449*(0.076) | 1,055 | 1,449 | -394(0.292) |
| - Home health | 526 | 803 | -278**(0.048) | 454 | 599 | -145(0.343) |
| - Inpatient | 2,440 | 2,686 | -246(0.642) | 1,975 | 1,583 | 392(0.246) |
| - Transportation | 696 | 936 | -239**(0.028) | 524 | 802 | -278**(0.010) |
| - Prescription drugs | 4,089 | 4,258 | -169(0.507) | 3,734 | 3,685 | 49(0.822) |
| - Physician | 59 | 57 | 2(0.878) | 61 | 30 | 30(0.320) |
| - DME | 383 | 298 | 86(0.454) | 343 | 173 | 170(0.144) |
| - Case management | 4 | 3 | 1(0.727) | 3 | 5 | -2(0.606) |
| - Hospice | 154 | 10 | 145*(0.079) | 149 | 46 | 103(0.211) |
| - Capitated payment | 373 | 397 | -24(0.673) | 677 | 649 | 29(0.729) |
| - Other | 2,445 | 2,327 | 118(0.612) | 1,721 | 1,841 | -119(0.663) |
| MEDICARE EXPENDITURES, BY TYPE OF SERVICE | ||||||
| - Nursing facility | 542 | 460 | 82(0.534) | 681 | 648 | 33(0.838) |
| - Home health | 758 | 825 | -67(0.576) | 640 | 740 | -100(0.411) |
| - Inpatient | 7,542 | 5,582 | 1,960(0.167) | 6,518 | 6,193 | 324(0.764) |
| - Physician | 295 | 312 | -17(0.411) | 294 | 311 | -17(0.465) |
| - DME | 613 | 556 | 58(0.460) | 621 | 568 | 52(0.538) |
| - Hospice | 40 | 1 | 39(0.330) | 90 | 88 | 2(0.981) |
| - Other | 3,489 | 3,784 | -295(0.411) | 3,374 | 3,754 | -381(0.317) |
| SAMPLE SIZE | 1,447 | 1,447 | ||||
| SOURCE: Medicaid and Medicare claims data. NOTE: Early enrollees enrolled in the demonstration before January 1, 2002. Means were predicted using ordinary least squares regression models. DME = durable medical equipment. * Estimated effect significantly different from zero at .10 level. ** Estimated effect significantly different from zero at .05 level. *** Estimated effect significantly different from zero at .01 level. | ||||||
| TABLE 6a. Effect of Cash and Counseling on Annual Expenditures for Medicaid and Medicare Services During the First Postenrollment Year in Florida | |||||||||
| Dependent Variable | Nonelderly | Elderly | All | ||||||
| PredictedTreatmentGroupMean(Dollars) | PredictedControlGroupMean(Dollars) | EstimatedEffect(p-value) | PredictedTreatmentGroupMean(Dollars) | PredictedControlGroupMean(Dollars) | EstimatedEffect(p-value) | PredictedTreatmentGroupMean(Dollars) | PredictedControlGroupMean(Dollars) | EstimatedEffect(p-value) | |
| TOTAL WAIVER, MEDICAID, AND MEDICARE EXPENDITURES | |||||||||
| - Total waiver | 22,017 | 18,321 | 3,696***(0.000) | 10,496 | 10,063 | 433(0.223) | 16,301 | 14,193 | 2,108***(0.000) |
| - Nonwaiver | 5,416 | 5,785 | -369(0.410) | 5,475 | 5,771 | -296(0.534) | 5,443 | 5,780 | -337(0.304) |
| - Total Medicaid | 27,433 | 24,106 | 3,327***(0.000) | 15,971 | 15,833 | 137(0.800) | 21,745 | 19,973 | 1,772***(0.000) |
| - Total Medicare | 2,434 | 2,744 | -309(0.565) | 14,498 | 15,226 | -728(0.564) | 8,467 | 8,923 | -457(0.504) |
| - Total Medicaid plus Medicare | 29,867 | 26,849 | 3,018***(0.002) | 30,469 | 31,060 | -591(0.674) | 30,211 | 28,896 | 1,315(0.125) |
| OTHER MEDICAID EXPENDITURES, BY TYPE OF SERVICE | |||||||||
| - Nursing facility | 70 | 130 | -60(0.543) | 893 | 1,128 | -235(0.474) | 477 | 628 | -151(0.372) |
| - Home health | 674 | 833 | -159(0.368) | 233 | 123 | 110*(0.073) | 463 | 471 | -8(0.931) |
| - Inpatient | 617 | 760 | -143(0.526) | 620 | 828 | -208(0.173) | 615 | 797 | -182(0.184) |
| - Transportation | 89 | 118 | -29(0.418) | 201 | 190 | 11(0.848) | 145 | 154 | -9(0.805) |
| - Prescription drugs | 2,128 | 1,931 | 197(0.281) | 2,627 | 2,756 | -129(0.386) | 2,392 | 2,325 | 67(0.569) |
| - Physician | 460 | 648 | -188(0.175) | 95 | 69 | 26(0.582) | 283 | 356 | -73(0.319) |
| - Case management | 12 | 10 | 2(0.775) | 0 | 4 | -4(0.356) | 6 | 7 | -1(0.848) |
| - Hospice | 5 | 12 | -8(0.643) | 170 | 117 | 52(0.692) | 104 | 47 | 57(0.399) |
| - Capitated payment | 950 | 888 | 61(0.660) | 192 | 138 | 53(0.486) | 529 | 559 | -30(0.710) |
| - Other | 412 | 453 | -41(0.566) | 446 | 418 | 27(0.732) | 429 | 435 | -6(0.906) |
| MEDICARE | |||||||||
| - Nursing facility | 33 | 141 | -108*(0.068) | 1,012 | 957 | 54(0.813) | 515 | 552 | -37(0.748) |
| - Home health | 327 | 409 | -82(0.529) | 1,761 | 1,852 | -91(0.740) | 1,061 | 1,106 | -45(0.766) |
| - Inpatient | 793 | 1,058 | -265(0.423) | 5,524 | 5,975 | -451(0.571) | 3,148 | 3,503 | -354(0.405) |
| - Physician | 94 | 87 | 8(0.478) | 322 | 317 | 5(0.855) | 205 | 204 | 1(0.920) |
| - DME | 445 | 380 | 65(0.534) | 1,491 | 1,724 | -233(0.304) | 970 | 1,044 | -74(0.554) |
| - Hospice | 49 | 28 | 22(0.687) | 911 | 681 | 230(0.440) | 491 | 339 | 152(0.310) |
| - Other | 692 | 642 | 50(0.755) | 3,477 | 3,720 | -243(0.417) | 2,075 | 2,175 | -100(0.563) |
| SAMPLE SIZE | 913 | 904 | 1,817 | ||||||
| SOURCE: Medicaid and Medicare claims data. NOTES: Means were predicted using ordinary least squares regression models. DME = durable medical equipment. * Estimated effect significantly different from zero at .10 level. *** Estimated effect significantly different from zero at 01 level. | |||||||||
| TABLE 6b. Effect of Cash and Counseling on Early Enrollees' Annual Expenditures for Medicaid and Medicare Services in Florida, By Year | ||||||
| Dependent Variable | Cohort of Early Enrollees | |||||
| Year 1 | Year 2 | |||||
| PredictedTreatmentGroupMean(Dollars) | PredictedControlGroupMean(Dollars) | EstimatedEffect(p-value) | PredictedTreatmentGroupMean(Dollars) | PredictedControlGroupMean(Dollars) | EstimatedEffect(p-value) | |
| TOTAL WAIVER, MEDICAID, AND MEDICARE EXPENDITURES | ||||||
| - Total Waiver | 17,506 | 14,999 | 2,507***(0.000) | 18,354 | 15,978 | 2,375***(0.000) |
| - Nonwaiver | 5,593 | 5,742 | -149(0.686) | 6,041 | 5,698 | 343(0.482) |
| - Total Medicaid | 23,099 | 20,741 | 2,358***(0.000) | 24,394 | 21,676 | 2,718***(0.000) |
| - Total Medicare | 7,697 | 7,371 | 326(0.658) | 7,298 | 6,988 | 309(0.669) |
| - Total Medicaid plus Medicare | 30,796 | 28,112 | 2,684***(0.004) | 31,691 | 28,664 | 3,027***(0.008) |
| OTHER MEDICAID EXPENDITURES, BY TYPE OF SERVICE | ||||||
| - Nursing facility | 483 | 390 | 92(0.568) | 1,225 | 1,001 | 223(0.475) |
| - Home health | 544 | 572 | -28(0.811) | 380 | 260 | 121(0.550) |
| - Inpatient | 680 | 880 | -200(0.232) | 591 | 752 | -161(0.274) |
| - Transportation | 120 | 141 | -21(0.455) | 109 | 106 | 3(0.894) |
| - Prescription drugs | 2,334 | 2,183 | 151(0.261) | 2,467 | 2,232 | 235(0.140) |
| - Physician | 330 | 424 | -94(0.309) | 285 | 284 | 1(0.989) |
| - Case management | 7 | 7 | 1(0.854) | 3 | 3 | 0(0.907) |
| - Hospice | 54 | 56 | -2(0.970) | 102 | 78 | 24(0.707) |
| - Capitation amount | 605 | 640 | -34(0.727) | 514 | 596 | -81(0.405) |
| - Other | 435 | 447 | -12(0.853) | 365 | 386 | -21(0.741) |
| MEDICARE | ||||||
| - Nursing facility | 466 | 443 | 24(0.850) | 620 | 631 | -11(0.944) |
| - Home health | 949 | 907 | 42(0.781) | 830 | 881 | -51(0.725) |
| - Inpatient | 2,956 | 2,961 | -5(0.992) | 2,613 | 2,522 | 91(0.822) |
| - Physician | 188 | 178 | 10(0.469) | 176 | 168 | 9(0.540) |
| - DME | 780 | 769 | 10(0.931) | 826 | 706 | 120(0.337) |
| - Hospice | 455 | 403 | 52(0.776) | 469 | 357 | 112(0.523) |
| - Other | 1,903 | 1,710 | 193(0.292) | 1,763 | 1,722 | 40(0.827) |
| SAMPLE SIZE | 1,424 | 1,424 | ||||
| SOURCE: Medicaid and Medicare claims data. NOTE: Early enrollees enrolled in the demonstration before October 1, 2001. Means were predicted using ordinary least squares regression models. DME = durable medical equipment. *** Estimated effect significantly different from zero at .01 level. | ||||||
| TABLE 7a. Effect of Cash and Counseling on Selected Measures of Service Use in Arkansas | |||||||||
| Full Sample | Cohort of Early Enrollees | ||||||||
| Year 1 | Year 2 | ||||||||
| PredictedTreatmentGroupMean | PredictedControlGroupMean | EstimatedEffect(p-value) | PredictedTreatmentGroupMean | PredictedControlGroupMean | EstimatedEffect(p-value) | PredictedTreatmentGroupMean | PredictedControlGroupMean | EstimatedEffect(p-value) | |
| NURSING FACILITY MEASURES | |||||||||
| Any Medicaid Nursing Facility Expenditures (Percent)a | 7.4 | 8.6 | -1.2(0.333) | 6.2 | 7.9 | -1.7(0.224) | 7.9 | 13.5 | -5.6***(0.001) |
| Any Medicare Nursing Facility Expenditures (Percent)a | 9.6 | 10.9 | -1.3(0.325) | 8.9 | 9.8 | -0.9(0.582) | 8.9 | 10.2 | -1.3**(0.042) |
| Any Medicaid or Medicare Nursing Facility Expenditures (Percent)a | 14.0 | 15.3 | -1.4(0.373) | 13.3 | 13.9 | -0.6(0.754) | 13.5 | 17.4 | -3.9**(0.042) |
| Medicaid or Medicare Nursing Facility Days (Percent)b | 11.7 | 13.3 | -1.6(0.309) | 11.1 | 12.5 | -1.4(0.460) | 19.1 | 26.3 | -7.3**(0.035) |
| HOME HEALTH MEASURES | |||||||||
| Medicare Skilled Nurse Visits (Number)b | 4.4 | 4.8 | -0.3(0.537) | 5.0 | 5.7 | -0.6(0.376) | 3.1 | 4.0 | -0.9(0.108) |
| Medicaid Home Health Therapy Vists (Number)b | 0.2 | 0.2 | 0.1(0.366) | 0.1 | 0.1 | 0.0(0.852) | 0.1 | 0.2 | -0.2**(0.013) |
| Any Home Health Visit (Percent)a | 18.0 | 18.2 | -0.2(0.885) | 19.7 | 20.4 | -0.7(0.726) | 12.99 | 14.9 | -2.0(0.289) |
| INPATIENT MEASURES | |||||||||
| Any Emergency Room Visitsa | 17.4 | 19.6 | -2.2(0.189) | 17.0 | 19.8 | -2.7(0.186) | 17.5 | 16.2 | 1.2(0.543) |
| Inpatient Days (Number)b | 9.1 | 9.7 | -0.6(0.336) | 8.6 | 9.5 | -0.9(0.202) | 7.3 | 7.8 | -0.5(0.482) |
| Any Inpatient Admission (Percent)a | 47.1 | 47.7 | -0.6(0.784) | 46.8 | 48.3 | -1.5(0.575) | 40.3 | 41.4 | -1.0(0.691) |
| SAMPLE SIZE | 2,008 | 1,312 | 1,312 | ||||||
SOURCE: Medicaid and Medicare claims data for the period from December 1997 through April 2002. ** Significantly different from zero at .05 level, two-tailed test. *** Significantly different from zero at 01 level, two-tailed test.
| |||||||||
| TABLE 7b. Effect of Cash and Counseling on Selected Measures of Service Use in New Jersey | |||||||||
| Full Sample | Cohort of Early Enrollees | ||||||||
| Year 1 | Year 2 | ||||||||
| PredictedTreatmentGroupMean | PredictedControlGroupMean | EstimatedEffect(p-value) | PredictedTreatmentGroupMean | PredictedControlGroupMean | EstimatedEffect(p-value) | PredictedTreatmentGroupMean | PredictedControlGroupMean | EstimatedEffect(p-value) | |
| NURSING FACILITY MEASURES | |||||||||
| Any Medicaid Nursing Facility Expenditures (Percent)a | 3.7 | 4.9 | -1.2(0.196) | 4.0 | 5.0 | -1.0(0.359) | 6.1 | 6.5 | -0.4(0.763) |
| Any Medicare Nursing Facility Expenditures (Percent)a | 7.4 | 5.6 | 1.8*(0.100) | 7.5 | 4.8 | 2.6**(0.030) | 7.8 | 7.3 | 0.5(0.717) |
| Any Medicaid or Medicare Nursing Facility Expenditures (Percent)a | 8.6 | 8.4 | 0.1(8.9) | 8.9 | 8.1 | 0.8(0.550) | 10.0 | 10.3 | -0.3(0.838) |
| Medicaid or Medicare Nursing Facility Days (Percent)b | 6.4 | 7.6 | -1.2(0.350) | 6.7 | 7.3 | -0.6(0.676) | 11.4 | 12.1 | -0.7(0.735) |
| HOME HEALTH MEASURES | |||||||||
| Medicare Skilled Nurse Visits (Number)b | 2.8 | 3.4 | -0.6*(0.090) | 3.0 | 3.5 | -0.5(0.205) | 2.9 | 2.9 | 0.0(0.949) |
| Any Home Health Visit (Percent)a | 13.5 | 16.1 | -2.5*(0.081) | 13.6 | 15.8 | -2.1(0.181) | 9.7 | 10.5 | -0.8(0.584) |
| INPATIENT MEASURES | |||||||||
| Any Emergency Room Visitsa | 30.9 | 28.9 | 2.0(0.340) | 31.1 | 29.4 | 1.7(0.462) | 28.0 | 27.7 | 0.3(0.908) |
| Inpatient Days (Number)b | 11.4 | 10.2 | 1.3(0.116) | 11.5 | 10.5 | 1.0(0.285) | 9.2 | 8.7 | 0.5(0.569) |
| Any Inpatient Admission (Percent)a | 38.5 | 36.9 | 1.6(0.460) | 38.5 | 37.8 | 0.8(0.745) | 35.0 | 34.8 | 0.1(0.950) |
| SAMPLE SIZE | 1,730 | 1,447 | 1,447 | ||||||
SOURCE: Medicaid and Medicare claims data. NOTES: Early enrollees enrolled in the demonstration before January 1, 2002. * Significantly different from zero at .10 level, two-tailed test. ** Significantly different from zero at .05 level, two-tailed test.
| |||||||||
| TABLE 7c. Effect of Cash and Counseling on Selected Measures of Service Use in Florida | |||||||||
| Full Sample | Cohort of Early Enrollees | ||||||||
| Year 1 | Year 2 | ||||||||
| PredictedTreatmentGroupMean | PredictedControlGroupMean | EstimatedEffect(p-value) | PredictedTreatmentGroupMean | PredictedControlGroupMean | EstimatedEffect(p-value) | PredictedTreatmentGroupMean | PredictedControlGroupMean | EstimatedEffect(p-value) | |
| NURSING FACILITY MEASURES | |||||||||
| Any Medicaid Nursing Facility Expenditures (Percent)a | 4.9 | 6.1 | -1.3(0.221) | 4.4 | 5.2 | -0.8(0.484) | 5.9 | 6.8 | -0.9(0.478) |
| Any Medicare Nursing Facility Expenditures (Percent)a | 6.4 | 7.8 | -1.4(0.224) | 5.7 | 6.3 | -0.6(0.605) | 6.3 | 6.6 | -0.3(0.801) |
| Any Medicaid or Medicare Nursing Facility Expenditures (Percent)a | 7.5 | 9.3 | -1.8(0.154) | 7.0 | 8.0 | -1.0(0.466) | 8.1 | 8.5 | -0.5(0.733) |
| Medicaid or Medicare Nursing Facility Days (Percent)b | 5.8 | 7.6 | -1.9(0.116) | 5.2 | 5.9 | -0.7(0.574) | 10.9 | 11.2 | -0.3(0.906) |
| HOME HEALTH MEASURES | |||||||||
| Medicare Skilled Nurse Visits (Number)b | 1.8 | 2.0 | -0.3(0.550) | 2.0 | 2.3 | -0.3(0.587) | 2.3 | 3.4 | -1.1***(0.002) |
| Any Home Health Visit (Percent)a | 5.8 | 5.8 | 0.1(0.953) | 6.7 | 6.1 | 0.7(0.540) | 4.4 | 5.2 | -0.8(0.479) |
| INPATIENT MEASURES | |||||||||
| Any Emergency Room Visitsa | 22.5 | 23.0 | -0.5(0.782) | 20.3 | 19.4 | 0.9(0.642) | 19.8 | 18.0 | 1.9(0.338) |
| Inpatient Days (Number)b | 4.7 | 5.2 | -0.6(0.177) | 4.6 | 4.8 | -0.2(0.714) | 4.1 | 4.1 | -0.0(0.933) |
| Any Inpatient Admission (Percent)a | 28.7 | 30.1 | -1.4(0.468) | 27.0 | 26.7 | 0.3(0.878) | 24.6 | 24.3 | 0.3(0.898) |
| SAMPLE SIZE | 1,817 | 1,424 | 1,424 | ||||||
SOURCE: Medicaid and Medicare claims data. NOTES: Early enrollees enrolled in the demonstration before October 1, 2001. *** Significantly different from zero at 01 level, two-tailed test.
| |||||||||
DISCUSSION
The finding that Medicaid costs are higher under Cash and Counseling than they would have been under the traditional program may raise concerns for states that have tight budget constraints but wish to offer consumers the sizable benefits the program offers. In all three states, consumers benefited greatly from Cash and Counseling, as they were more likely to receive paid care, had greater satisfaction with the care they received, and reported fewer unmet needs than those in the traditional program (Carlson et al. 2005). Similarly, the primary unpaid caregivers benefited from consumer direction, experiencing lower physical and emotional strain under Cash and Counseling than under the traditional program (Foster et al. 2005c). Costs per consumer under Cash and Counseling exceeded those of the traditional program during the first two postenrollment years, for varying reasons across states (as summarized below). A main reason was that Cash and Counseling increased access to paid care. During and after the study period, however, the states implemented changes that substantially reduce cost per recipient under Cash and Counseling. Our analysis suggests that, by adapting lessons the demonstration states learned, Cash and Counseling programs can be implemented in ways that preserve the substantial benefits while keeping monthly costs per recipient and, perhaps, total Medicaid costs to approximately what they would have been under the traditional program.
State-by-State Summary
In Arkansas, PCS expenditures were about twice as high for the treatment group as for the control group during the first year postenrollment, primarily because the control group received less care than was authorized. Nearly one-fourth of control group members did not receive any paid PCS. Those who did received only 68 percent of the hours of care they were entitled to, rather than the 86 percent they were expected to receive (based on historical data). A secondary reason for this difference was that treatment group members were more likely than control group members to have reassessments that authorized increases in the hours of care and, therefore, increased allowances. Nonetheless, the average total personal care expenditures (allowance costs plus fiscal agent/counseling costs) among allowance recipients over the first postenrollment year was slightly less than the cost that agencies would have incurred, on average, in supplying the expected number of baseline care plan hours. (The increased allowances were offset by decreased expenditures for fiscal agent/counseling costs.)
The treatment group's large increase in PCS costs was partly offset by savings in its expenditures on nursing facility, home health, and other Medicaid services. Thus, the treatment group's total Medicaid costs were only about 13 percent (or $1,100) higher than those of the control group during the first postenrollment year. (The pattern of expenditure impacts was similar for the elderly and nonelderly, although the increase in PCS expenditures and the offsetting decrease in non-PCS expenditures were both greater for the nonelderly.)
Because the savings in other Medicaid services (particularly nursing facility, home health, and other home care waiver services) grew between the first and second year, and the gap in PCS costs shrank, the increase in total Medicaid costs during the second year fell to 5 percent, a statistically insignificant difference. Thus, over the whole two-year period, Medicaid costs were about 9 percent higher for the treatment group.
In New Jersey, PCS costs for the treatment group were 16 percent higher than those for the control group during the first year, and this difference grew. The treatment-control difference in personal care costs was due largely to the fact that, for both age groups, the treatment group was more likely to receive at least some PCS. For the nonelderly, however, average costs were higher for the treatment group, even among PCS recipients. This appears to be largely due to the fact that control group recipients' average monthly costs for personal care were about 10 percent lower than expected until the second year postenrollment. Allowance recipients also may have received larger increases in their care plans than control group members did at the time of reassessment, or control group members may have had such increases but did not receive the additional care. During the study period, New Jersey had labor shortages that could have prevented control group members from receiving all of their authorized care. In addition, agencies may have been reluctant to increase beneficiaries' care plan hours because they knew they did not have enough staff to provide extra care. These factors would have affected the nonelderly sample more than the elderly one if the nonelderly were more aggressive about lobbying for more care plan hours.
Savings in other Medicaid services (transportation, home health, and nursing facility) offset about half the treatment group's higher PCS costs and rendered statistically insignificant the treatment-control difference in total Medicaid costs in the first year. While the treatment-control difference in PCS grew, however, the estimated savings in other Medicaid services declined. Therefore, the programs' impact on total Medicaid costs was sizable in year 2. The source of the higher year 2 Medicaid costs differed by age group. Costs for the elderly were higher solely due to the treatment-control difference in the percent who received any care, while costs for the nonelderly were higher due to the treatment-control difference both in the percent who received any care and in the amount of care recipients received.
In Florida, Cash and Counseling's effects were markedly different for the two age groups we examined. For the nonelderly, the treatment group's waiver costs were about $3,700 (or 20 percent) higher than the control group's, primarily because many treatment group members received allowances that were substantially greater than expected according to their baseline care plans. The time pattern of ratios of actual to expected costs over time suggests that allowance recipients obtained increases in their care plans when they developed spending plans. This pattern was similar to that observed for children in Florida, who are part of the same Developmental Disabilities waiver program as most of the nonelderly adults (Dale et al. 2004b). Because there were no offsetting savings in other Medicaid costs, there was a sizable treatment-control difference in total Medicaid costs. While treatment group costs for Medicare skilled nursing facility services were significantly lower than those of the control group, the program did not have a significant effect on total Medicare costs.
For the elderly, total waiver costs were similar for the treatment and control groups in both postenrollment years. Both groups had similar waiver costs in year 2, even though a somewhat higher percentage of elderly treatment group members (81 percent) than control group members (76 percent) actually received waiver services. The program had no effect on total Medicaid costs or on total Medicare costs. Given that less than 40 percent of elderly Florida treatment group members ever received an allowance, the lack of significant differences in not surprising.
Lessons Learned
A key benefit of the program--increasing access to paid care--may lead to increased costs. Under Cash and Counseling, treatment group members were more likely than control group members to receive paid assistance. The program's impact on whether beneficiaries received paid care was modest in Florida (and pertained only to the elderly and only to the second year), but it was sizable in New Jersey and particularly striking in Arkansas. Apparently, Cash and Counseling increased beneficiaries' access to paid care by allowing them to hire family and friends in times of labor shortages. This increased access to care was partly responsible for the higher costs of the treatment group.
The increased access to paid care did not result in consumers receiving more total hours of care. Family and friends might have been paid for care that they otherwise would have provided free, as the total number of hours of care that beneficiaries received under Cash and Counseling were similar to (or lower than) those the control group received (Carlson et al. 2005). However, beneficiaries reported fewer unmet needs and were more satisfied with the care they received under Cash and Counseling, suggesting that paid care may have been provided more efficiently and was of a higher quality than the care provided under the traditional program.
The fact that so many control group members did not receive any paid assistance at all during the whole postenrollment period in Arkansas and during the second year in Florida and New Jersey might be troubling to policymakers, especially since some have expressed concern about the adequacy of the care received under the traditional program (U.S. General Accounting Office 2003). These enrollees may not have received paid assistance because of the agency worker shortages that were prevalent nationwide and particularly severe in Arkansas during the study period. If this is the case, then Cash and Counseling helped obtain paid assistance for consumers who would have been unable to do so under the traditional program. Thus, the higher costs attributable to increased access might represent a quality improvement. Indeed, increasing access to care was a goal in Arkansas, especially since 40 percent of personal care recipients lived in rural areas.
In Arkansas, it also is possible that some control group members enrolled in the demonstration because they were attracted to the flexibility and control of the monthly allowance and would not have accepted agency care. Indeed, the high percentage of newly enrolled control group members who did not receive any PCS (66 percent) suggests that some of the difference was due to people enrolling in the demonstration who were interested in the flexibility and control that consumer direction offered but not interested in the traditional program (Dale et al. 2004a). If so, we might infer that some eligible beneficiaries considered the traditional program unacceptable. However, it might also be that Cash and Counseling increased state Medicaid expenditures by providing an allowance to people who (although entitled to services) would not have sought agency care. In addition, the greater dropoff in control group participation in the second year in the traditional program in Florida and New Jersey suggests that the consumers studied considered Cash and Counseling more appealing than traditional services. On the other hand, during the demonstration, the ratio of new to continuing beneficiaries never exceeded historical levels, meaning that Cash and Counseling did not trigger a large influx of new enrollees. Whatever the reason for the control group's lack of paid care, Cash and Counseling increased the likelihood that beneficiaries would obtain the services they need and were authorized to receive.
Even among recipients, costs generally were higher for the treatment group.28 Costs were higher than expected for recipients, partly because of underservice in the control group attributable to severe labor shortages during the study period. This was particularly true in Arkansas, where personal care recipients in the control group incurred only 68 percent of the value of their care plans, rather than the 86 percent they were expected to receive. Similarly, in New Jersey, nonelderly consumers in the control group did not receive all their authorized care.
A second reason for the treatment group's higher costs per recipient was that allowance recipients seemed to be more likely than those in the traditional program to receive increases in their care plans at the time of reassessment. Why might allowance recipients receive more generous reassessments than those in the traditional program? In Arkansas and New Jersey, agencies might not have wanted to increase care plan hours for control group members while there was a labor shortage. In contrast, because treatment group members could hire friends and relatives, labor shortages were not a factor during the counselors' assessments (in Arkansas) and the Medicaid nurses' assessments (in New Jersey). In addition, in Arkansas, counselors might have advocated for consumers and sought to increase their care plans. In Florida, counselors had only limited training and often were not sure of program rules.29 In an effort to be flexible, counselors may have authorized requests that would increase the care plan but that support coordinators would not have authorized under the traditional program.
Cash and Counseling did reduce costs for other Medicaid services in two states, which at least partly offset the program's higher costs for the costed-out service. Cash and Counseling can substitute for other Medicaid services, but it did not do so consistently across states and time periods. The results were most promising in Arkansas, where savings in nursing facility and other long-term care services were enough to offset 20 percent of the treatment group's higher personal care costs during the first postenrollment year and three-fourths of the treatment group's higher personal care costs during the second year. Likewise, savings in nursing facility and home health services in New Jersey were enough to offset half the treatment-control difference in personal care costs in the first postenrollment year. These savings did not persist in the second postenrollment year, however.
The program did not adversely affect the need for acute care. One might be concerned that consumers would experience adverse health outcomes under Cash and Counseling, receiving greater need for acute care services if workers neglected consumers or provided inadequate care. However, this did not happen. The program did not significantly affect Medicare expenditures or Medicaid expenditures for acute health care (that is, for services unrelated to long-term care). Moreover, self-reported data indicated that treatment group members were less likely than control group members to fall, develop contractures, have respiratory infections, experience shortness of breath, or have urinary infections (Carlson et al. 2005).
Policy Implications
In all three states, Cash and Counseling increased both the likelihood that beneficiaries would receive paid services and the quality of care received (Carlson et al. 2005). In spite of its sizable benefits, the higher initial costs of consumer direction might discourage some states from adopting a similar program. However, note that this evaluation was conducted over a two-year follow-up period that started immediately after enrollment began, before the states were able to identify and remedy any problems that occurred in implementing this innovative program.
Each state has different goals and constraints, and these differences should guide their decisions about the need to control program costs and the best method for doing so. Arkansas sought to increase access. Therefore, while it was important in that state for personal care costs per recipient to not be higher for the treatment group, higher total personal care costs were expected if the state achieved its goal of increased access to paid care. Florida and New Jersey expected total personal care costs to be similar for the treatment and control groups because their programs were limited to those already receiving, or scheduled to receive, PCS. The size of the allowance and what it can be used for could also affect states' approaches to controlling costs.
States also should realize that the program's cost effects may differ substantially for younger and older adults, especially if the two groups have very different characteristics (besides age). For example, nearly 90 percent of Florida's younger adults are enrolled in the state's Developmental Disabilities waiver program. These adults have different needs and living arrangements than frail older adults in Florida's program, many of whom need personal assistance primarily because of physical (rather than cognitive) difficulties. These differences can lead to differences in how aggressively the consumer (or the consumer's family) seeks increases in allowance amounts and differences in the amount of additional enrollment that the program might attract.
States interested in reaping the sizable benefits of Cash and Counseling, but concerned about its costs, should consider the following issues:
Limited Enrollment. States might consider limiting the program to (or only advertising it to) those receiving services in the traditional program, making exceptions for consumers who have tried and failed to obtain services or who live in areas that lack service providers. The major source of higher costs in Arkansas and New Jersey was attributable to the increased proportion of consumers receiving any services. If this increase is due in part to some consumers enrolling in the demonstration who otherwise would never have sought care under the traditional program, states might logically try to control these costs by limiting enrollment in consumer-directed care to consumers who had been receiving services under the traditional program for some time.
Limiting enrollment could be counterproductive, however. If enrollment were limited, states would not be able to expand access to paid care in rural areas or other areas where agencies cannot find enough workers. (Even in cities, a tight labor market may make it difficult for agencies to hire enough workers at wage rates compatible with the Medicaid payment for such services.) Furthermore, some consumers may not be willing to accept agency services because of problems encountered in the past with agency workers (such as unreliability, theft, or abuse). Thus, limiting enrollment to those who had already been receiving agency services would unfairly penalize some eligible consumers and undermine a primary objective some states have for introducing consumer direction: improving access to care. The finding that the largest reductions in Medicaid nursing home and other long-term care costs were in states and age groups for which the increases in access to care were largest validates the wisdom of this objective. Notably, during the second year, Arkansas appears to have been able to offset nearly all of the increase in PCS costs (including those attributable to increased enrollment) through savings in Medicaid long-term care services--a substitution that appeals to states, as well as to most consumers and their families.
Recoupment. States considering consumer-directed care may need to adopt procedures to recover funds the consumer did not need. Each of the three demonstration states eventually developed procedures for recouping funds, although their rules varied. For example, in Arkansas, the state began recouping funds (after the study period ended) for consumers who had balances of more than 150 percent of their monthly allowance and had not specified a purchase for which they were saving. Recoupment was most vigorous in New Jersey, where the state recovered more than $3 million in unspent allowances not designated for a particular purpose. Without recoupment, the cost difference reported in this study would have been substantially greater. Such procedures can be implemented fairly if counselors give consumers plenty of warning to help them avoid losing funds they are saving for a legitimate need.
Reassessments. Cash and Counseling programs may need to find a way to make revisions to care plans to ensure that allowances are no more likely to be increased for consumers if they participate in the program than if they receive agency care. In both Arkansas and Florida, some counselors appear to have increased the hours in consumer care plans more than agencies would have. Therefore, it might make sense for reassessments to be conducted by independent parties, rather than by counselors or other people who might be inclined to advocate for consumers.
Comprehensive training is needed to ensure that assessors fully understand program rules and are not overly permissive in granting increases to care plans. Ideally, states would adopt standardized assessment procedures that are blind to whether consumers direct their own care. For example, Florida's Developmental Disabilities program adopted a new assessment form--the Individual Cost Guideline--which standardized the method for determining the costs of services that all beneficiaries need (whether they receive care under Cash and Counseling or the traditional waiver program). All support coordinators and CDC consultants received comprehensive training on this approach as it was being implemented. Such changes might prevent beneficiaries from receiving sizable increases in their care plans during reassessments, as many people in Florida's Developmental Disabilities program did.
Payments to Counseling and Fiscal Agencies. While consumer-directed programs do not necessarily provide counseling and fiscal agent services, these features were key components of the Cash and Counseling model. Payment for these services needs to be carefully structured so that it is tied to the level of effort and gives the agency an incentive for developing the spending plan. For example, Arkansas discovered that its original payment structure for counseling and fiscal services was not ideal. When the demonstration began, Arkansas paid the counseling/fiscal agencies a high monthly payment ($115 per month) starting when the consumer enrolled in the program, even though the consumer was not yet using bookkeeping or counseling services regularly. Moreover, the state incurred the cost of traditional services and the cost of this monthly fee until the spending plan was developed and the first allowance was received. Partway through the demonstration, Arkansas changed its payment structure to more accurately reflect the level of effort that counseling/fiscal agencies incurred. It made a one-time payment after the spending plan was developed, then paid a fee of $75 per month once the consumer started the allowance. This payment structure gave the counseling/fiscal agencies an incentive to help the consumer complete the spending plan and reduced Arkansas's costs for fiscal agent and counseling services.
Discounting the Allowance. States should consider adopting a discount factor for the allowance, as Arkansas and Florida did, to account for the fact that, on average, consumers receive less than the full number of hours of care specified in their care plan. New Jersey did not discount allowances, because it found that personal care recipients historically received the full value of their care plan. However, personal care recipients in the control group did not receive all the care they were entitled to. In fact, nonelderly control group members received only 90 percent of their care plans during the first year of the study period. While they incurred greater costs during the second year, these greater costs were due partly to increases in agency worker's wage rates, rather than to hours of care. In retrospect, if New Jersey had used a discount factor, treatment group costs there (especially for the nonelderly) would have been much closer to control group costs.
The discount factor was even insufficient in Arkansas (where allowances were set to equal an average of 86 percent of the care plan value) to account for the gap between actual hours and care plan hours for the control group during the study period. Arkansas kept treatment group costs per recipient month on a par with control group costs by reducing the payment it made to counselors and through savings on other long-term care services. Another way to lower costs would have been to reduce the value of the care plan further; however, states may wish to investigate why beneficiaries in the traditional program do not receive all the services authorized for them before deciding to implement a discount factor. Few policymakers would want to hold costs down by depriving beneficiaries of services that assessment staff authorize as necessary. If care plans are routinely set at overly generous amounts, or if consumers have other reasons for not getting all the services authorized, discounting the allowance based on historical data might be appropriate. Even here, however, discounting allowances downward for all consumers to reflect the average penalizes those who truly need all the services authorized in their care plan. Nonetheless, despite the discounting of their allowance, Arkansas and Florida consumers were much more satisfied under Cash and Counseling than under the traditional program.
Whatever cost-cutting measures are introduced, policymakers need to monitor whether such measures reduce the quality of care received. Furthermore, states should weigh the potential for reducing nursing facility costs against the higher costs they may incur for personal care. If the effects on nursing home and long-term care costs such as those observed in Arkansas and New Jersey can be replicated elsewhere (and perhaps increased), while keeping cost per month of service close to the levels of the traditional program, consumers, their families, and the state will all benefit.
Assessing the Trade-Offs
Under Cash and Counseling, care can be provided for a cost less than or equal to what the cost would be for agencies to provide authorized care to eligible beneficiaries. The main reason that costs were higher under Cash and Counseling was that the traditional program provided far less care than was authorized. States may decide that it is inappropriate to compare costs under Cash and Counseling to costs under a system that did not provide care to many eligible beneficiaries and that provided less care than was authorized to those it did serve. Moreover, states need to consider whether, according to Medicaid statutes, failing to provide services authorized in beneficiaries' care plans is even legal. For these reasons, states may decide that they are willing to incur slightly higher total Medicaid costs to reap sizable gains in access to care and in consumer and caregiver well-being. Alternatively, they may feel that they can draw from the lessons learned in Arkansas, Florida, and New Jersey to find ways to keep costs at the level incurred under the traditional system. Modest percentages (about 8-20 percent) of eligible consumers participated in Cash and Counseling (even though states undertook considerable outreach efforts). Therefore, the impact on a state's total Medicaid costs also is likely to be modest, even if no changes were implemented to control personal care costs under Cash and Counseling.
Limitations
Because the randomized evaluation design ensures that the impact estimates are valid, the study limitations described here do not cast doubt on the basic findings. Because our study pertained to one model of consumer direction, our findings may not apply to all programs featuring consumer-directed care. Impacts may differ for programs with other features (for example, those whose PCS benefits are more, or less, generous). Estimated program effects also may depend, in part, on the extent to which the supply of personal care workers in an area can meet the demand for services. For example, while there still is a nationwide shortage of home care workers, the shortage was particularly severe during the 1999-2002 study period. In addition, the results are limited to a two-year follow-up period. Over time, differences in costs might increase (as they did in New Jersey) or decrease (as they did in Arkansas). Nor do the results reflect the recent changes states made as they learned about program costs and procedures.
Related Research
This report addresses only one aspect of consumer-directed care. As noted, other Mathematica Policy Research, Inc. reports have examined the effect of Cash and Counseling on the use of personal assistance and the quality of care received. We also are estimating program effects on informal caregivers, examining the experiences of workers hired by consumers, and describing implementation issues important to states. Finally, a companion report examines the impacts of Cash and Counseling on Medicaid and Medicare expenditures for children in Florida. In making decisions about consumer direction, states interested in Cash and Counseling may wish to consider findings from these other reports, as well as from the cost results.
COMPANION REPORTS
Impacts on Quality of Care and Use of Personal Care
These reports compare treatment and control group members, using data from telephone interviews describing, among other outcomes measured nine months after random assignment: satisfaction, unmet need, disability-related health, and hours and types of personal care received.
Carlson, Barbara, Barbara Phillips, Stacy Dale, Leslie Foster, Randy Brown, and Jennifer Schore. "The Effect of Cash and Counseling on Service Use and Care Quality in Three States." Princeton, NJ: Mathematica Policy Research, Inc., 2005.
Foster, Leslie, Randall Brown, Barbara Phillips, Jennifer Schore, and Barbara Carlson. "Does Consumer Direction Affect the Quality of Medicaid Personal Assistance in Arkansas?" Princeton, NJ: Mathematica Policy Research, Inc., March 2003. Available at http://aspe.hhs.gov/daltcp/reports/arqual.htm.
Also see published version of this report: Foster et al. "Improving the Quality of Medicaid Personal Care Through Consumer Direction." Health Affairs Web exclusive W3, March 26, 2003, pp. 162-175.
Dale, Stacy, Randall Brown, Barbara Phillips, Jennifer Schore, and Barbara Carlson. "The Effect of Consumer Direction on Personal Assistance Received in Arkansas." Princeton, NJ: Mathematica Policy Research, Inc., May 2004. Available at http://aspe.hhs.gov/daltcp/reports/Arkpa.htm.
Also see published version of this report: Dale et al. "The Effects of Cash and Counseling on Personal Care Services and Medicaid Costs in Arkansas." Health Affairs Web exclusive W3, November 19, 2003, pp. 566-575.
Foster, Leslie, Stacy Dale, Randall Brown, Barbara Phillips, Jennifer Schore, and Barbara Lepidus Carlson. "Do Consumer-Directed Medicaid Supportive Services Work for Children with Developmental Disabilities?" Princeton, NJ: Mathematica Policy Research, September 2004. Available at http://aspe.hhs.gov/daltcp/reports/ddkidsMss.htm.
Impacts on the Cost of Medicaid and Medicare Services
The current report is the third in a set of three. These reports compare treatment and control group members, using Medicaid and Medicare data describing the cost of personal care and other covered services measured during the year after random assignment, and also present information about Cash and Counseling program costs. Reports on costs in the Arkansas program and on the Florida program for children are listed below.
Dale, Stacy, Randall Brown, and Barbara Phillips. "Does Arkansas' Cash and Counseling Affect Service Use and Public Costs?" Princeton, NJ: Mathematica Policy Research, Inc., June 2004. Available at http://aspe.hhs.gov/daltcp/reports/ARsupc.htm.
Dale, Stacy, Randall Brown, and Barbara Phillips. "Medicaid Costs Under Consumer Direction for Children with Developmental Disabilities." Princeton, NJ: Mathematica Policy Research, Inc., December 2004. Available at http://aspe.hhs.gov/daltcp/reports/FLddkids.htm.
Impacts on Informal Caregiving
These reports compare the experiences of primary informal caregivers of treatment and control group members (identified at the time of random assignment), using data from telephone interviews describing caregiver burden and well-being nine months after random assignment. The Arkansas report and a report on caregivers for children participating in the Florida program are listed below. A report on caregivers for adults from all three programs is forthcoming.
Foster, Leslie, Randall Brown, Barbara Phillips, and Barbara Carlson. "Easing the Burden of Caregiving: The Effect of Consumer Direction on Primary Informal Caregivers in Arkansas." Princeton, NJ: Mathematica Policy Research, Inc., August 2003. Available at http://aspe.hhs.gov/daltcp/reports/easing.htm.
Foster, Leslie, Randall Brown, Barbara Phillips, and Barbara Carlson. "The Effects of Cash and Counseling on the Primary Informal Caregivers of Children with Developmental Disabilities." Princeton, NJ: Mathematica Policy Research, Inc., April 2005.
Experiences of Paid Workers
These reports compare the experiences of primary paid workers of treatment and control group members (identified nine months after random assignment), using data from telephone interviews describing working conditions, burden, and well-being 10 months after random assignment. The Arkansas report is listed below; a report on workers for the Florida and New Jersey programs is forthcoming.
Dale, Stacy, Randall Brown, Barbara Phillips, and Barbara Carlson. "The Experiences of Workers Hired Under Consumer Direction in Arkansas." Princeton, NJ: Mathematica Policy Research, Inc., June 2003. Available at http://aspe.hhs.gov/daltcp/reports/ARhired.htm.
Program Implementation
These reports describe program goals, features, and procedures in detail based on in-person interviews with program staff.
Phillips, Barbara, and Barbara Schneider. "Moving to IndependentChoices: The Implementation of the Cash and Counseling Demonstration in Arkansas." Princeton, NJ: Mathematica Policy Research, Inc., May 2002. Available at http://aspe.hhs.gov/daltcp/reports/movingic.htm.
Phillips, Barbara, and Barbara Schneider. "Enabling Personal Preference: The Implementation of the Cash and Counseling Demonstration in New Jersey." Princeton, NJ: Mathematica Policy Research, Inc., March 2003. Available at http://aspe.hhs.gov/daltcp/reports/enablepp.htm.
Phillips, Barbara, and Barbara Schneider. "Changing to Consumer-Directed Care: The Implementation of the Cash and Counseling Demonstration in Florida." Princeton, NJ: Mathematica Policy Research, Inc., July 2004. Available at http://aspe.hhs.gov/daltcp/reports/FLchange.htm.
Phillips, Barbara, Kevin Mahoney, Lori Simon-Rusinowitz, Jennifer Schore, Sandra Barrett, William Ditto, Tom Reimers, and Pamela Doty. "Lessons from the Implementation of Cash and Counseling in Arkansas, Florida, and New Jersey." Princeton, NJ: Mathematica Policy Research, Inc., June 2003. Available at http://aspe.hhs.gov/daltcp/reports/cclesson.htm.
Schore, Jennifer, and Barbara Phillips. "Consumer and Counselor Experiences in the Arkansas IndependentChoices Program." Princeton, NJ: Mathematica Policy Research, Inc., January 2004. Available at http://aspe.hhs.gov/daltcp/reports/arkexp.htm.
Foster, Leslie, Barbara Phillips, and Jennifer Schore. "Consumer and Consultant Experiences in the Florida Consumer Directed Care Program." Draft report. Princeton, NJ: Mathematica Policy Research, Inc., November 2004.
Foster, Leslie, Barbara Phillips, and Jennifer Schore. "Consumer and Consultant Experiences in the New Jersey Personal Preference Program." Draft report. Princeton, NJ: Mathematica Policy Research, Inc., December 2004.
Program Demand and Participation
This report will describe changes in enrollment in demonstration feeder programs before and after demonstration implementation, as well as compare program participants with eligible nonparticipants. The forthcoming report will include all three state programs.
Foster, Leslie, Randall Brown, and Rachel Shapiro. "Assessing the Appeal of the Cash and Counseling Program in Arkansas, Florida, and New Jersey." Princeton, NJ: Mathematica Policy Research, Inc., July 2005.
REFERENCES
Carlson, Barbara, Barbara Phillips, Stacy Dale, Leslie Foster, Randy Brown, and Jennifer Schore. "The Effect of Cash and Counseling on Service Use and Care Quality in Three States." Princeton, NJ: Mathematica Policy Research, Inc., 2005.
Dale, Stacy, Randy Brown, Barbara Phillips, Jennifer Schore, and Barbara Carlson. "Does Arkansas' Cash and Counseling Affect Service Use and Public Costs?" Princeton, NJ: Mathematica Policy Research, Inc., June 2004a. Available at http://aspe.hhs.gov/daltcp/reports/ARsupc.htm.
Dale, Stacy, Randy Brown, and Barbara Phillips. "Medicaid Costs Under Consumer Direction for Florida Children with Developmental Disabilities." Draft report. Princeton, NJ: Mathematica Policy Research, Inc., June 2004b. Available at http://aspe.hhs.gov/daltcp/reports/FLddkids.htm.
Foster, Leslie, Barbara Phillips, and Jennifer Schore. "Consumer and Consultant Experiences in the New Jersey Personal Preference Program." Draft report. Princeton, NJ: Mathematica Policy Research, Inc., 2005a.
Foster, Leslie, Barbara Phillips, and Jennifer Schore. "Consumer and Consultant Experiences in the Florida Consumer Directed Care Program." Draft report. Princeton, NJ: Mathematica Policy Research, Inc., 2005b.
Foster, Leslie, Randy Brown, Barbara Phillips, and Barbara Carlson. "How Cash and Counseling Affects Informal Caregivers: Findings from Three Arkansas, Florida and New Jersey." Princeton, NJ: Mathematica Policy Research, Inc., 2005c.
Foster, Leslie, Stacy Dale, Randy Brown, Barbara Phillips, Jennifer Schore, and Barbara Carlson. "Do Consumer-Directed Medicaid Supportive Services Work for Children with Developmental Disabilities?" Princeton, NJ: Mathematica Policy Research, Inc., September 2004. Available at http://aspe.hhs.gov/daltcp/reports/ddkidsMss.htm.
Harrington, Charlene, and Martin Kitchener. "Medicaid Long-Term Care: Changes, Innovations and Cost Containment." San Francisco, CA: University of California, San Francisco, July, 2003.
Kronick, R., T. Gilmer, T. Dreyfus, and L. Lee. "Improving Health-Based Payment for Medicaid Beneficiaries: CDPS." Health Care Financing Review, vol. 21, no. 3, spring 2000, pp. 29-64.
U.S. General Accounting Office. "Long-Term Care: Federal Oversight of Growing Medicaid Home and Community-Based Waivers Should Be Strengthened." Publication no. GAO-03-576. Washington, DC: GAO, June 20, 2003.
Velgouse, Linda, and Virginia Dize. "A Review of State Initiatives in Consumer-Directed Long-Term Care." Generations, vol. 24, no.3, fall 2000, pp. 28-33.
NOTES
-
For more than 20 years, states have developed programs that incorporate varying degrees of self-direction and self-determination. Two national pilot projects are testing these approaches: (1) the Self-Determination project in 19 states, focusing on HCBS Section 1915(c) waivers; and (2) the Cash and Counseling National Demonstration and Evaluation Program in three states, focusing on the Section 1115 Demonstrations. Based on the early lessons learned from state programs and these national demonstrations, CMS developed the Independence Plus Initiative in 2002. Independence Plus programs may be operated under Section 1115 demonstration authority or Section 1915(c) waiver authority.
-
For information on the costs of Cash and Counseling on developmentally disabled children in Florida, see Dale et al. 2004b. This report repeats the results for Arkansas provided in Dale et al. 2004a.
-
HCBS Section 1915(c) waivers permit states to offer Medicaid-eligible people alternatives to institutional care. These people can receive a broad array of services, including personal care and homemaker services not otherwise covered under a state's Medicaid program.
-
This requirement limited the likelihood of consumers enrolling in the demonstration who would not have sought or accepted agency services but who were interested in receiving a flexible monthly allowance.
-
The Section 1115 special terms and conditions had an express provision that people with cognitive disabilities could not deliberately be excluded from participation but should be given the support needed to self-direct.
-
Arkansas developed provider-specific discount factors by comparing, for the previous year, the hours in the care plans of random samples of people served by providers of traditional personal assistance and the hours actually used (according to claims data).
-
Florida's mean allowance (about $1,200) was the highest of the three states.
-
Participants in Arkansas had discretionary use of 10 percent of the cash allowance up to $75; the participant had to declare the uses of the discretionary income. Florida changed its initial cap for discretionary income from 20 percent of the monthly allowance to $250 of the monthly allowance (which equaled about 20 percent of the average monthly allowance). Participants may request additional discretionary funds, but the state must approve them.
-
Core services were designated before the demonstration and included services that would likely be affected by the costing out of PCS (or waiver services in Florida). These services included home health, targeted case management, hospice, durable medical equipment, and transportation (although the exact definition varied by state).
-
The federal budget neutrality test examines program costs over the duration of a demonstration rather than for the early postenrollment years only. Therefore, the outcomes in this report do not indicate whether the consumer-directed programs in Arkansas, Florida, or New Jersey met CMS's budget neutrality test.
-
The discount rate applied during the demonstration could have been inaccurate. The rate may have been based on the experiences of small samples of PCS recipients. It is also possible that the ratio of hours of services received to hours planned varied during the demonstration.
-
We used the Chronic Illness and Disability Payment System (CDPS) to classify people's diagnoses (according to their Medicaid and Medicare claims data) into major categories. A diagnosis is captured only if there is a Medicaid or Medicare claim related to it in the year before the demonstration. People could have chronic conditions (such as a psychiatric condition) that would not be captured in the claims data if they did not receive treatment for that condition in the preenrollment year. Many of the diagnostic categories are divided into subcategories (such as high cost, medium cost, and low cost) according to the level of Medicaid expenditures that would be expected for a particular diagnosis. In Arkansas, we used these categories as control variables. In Florida and New Jersey, we controlled for each person's level of predicted costs based on their CDPS categories. See Kronick et al. (2000) for a description of the CDPS.
-
Medicaid personal care costs are slightly overstated in Arkansas because they do not reflect the $600,000 of allowance payments that have been recouped from consumers during the study period. Individual recoupment amounts were not available at the time data for this report were analyzed. However, the average amount of money recouped per treatment group member was only $150 per year. As noted in the results section, factoring in the amount recouped would reduce our estimate of the treatment-control difference in personal care expenditures only slightly.
-
After the demonstration began, treatment group members could choose how many hours of care they would purchase with their allowance. They also were permitted to set their workers' wages, but those wages had to be at or above the state's minimum.
-
New Jersey provided data on the total amount of money that was to be recouped from each consumer's account as of December 2003. We calculated a monthly adjustment by dividing each consumer's total recoupment amount by the number of months of allowance receipt, then subtracted this monthly adjustment from the consumer's monthly personal care costs (according to the Medicaid claims data) during each month that people received an allowance.
-
Initially, consultants did not give consumers much help in developing their spending plans, believing that consumers who had difficulty developing the plans were not appropriate for the program. In 2002, however, Florida staff tried to provide more assistance, realizing that such consumers could manage program responsibilities after they developed the plans.
-
During the study period, the state began intensively scrutinizing beneficiary appropriateness for personal care, which resulted in denial of services to some longtime recipients. This change should have reduced the percentage of sample members receiving services in both the treatment and control groups.
-
If recoupment were factored in, the treatment-control difference in personal care expenditures would fall from $2,349 to about $2,200.
-
Except in New Jersey (where care plans were not adjusted), we calculated expected costs according to the discounted value of the care plan.
-
In general, we would expect the ratio of actual costs to baseline costs to increase, as beneficiaries may need more care as their health worsens, and agency wage rates per hour of care delivered (and the rate at which the allowance was cashed out) might increase. However, we would expect the trend to be similar for the treatment and control groups.
-
Because the allowance was prorated, some consumers who started receiving an allowance mid-month could appear to have lower-than-expected costs.
-
New Jersey's reassessment data for allowance recipients indicated that, by the end of the second year, about a quarter of allowance recipients were authorized to receive 5-30 percent more hours of care than they had at baseline, and another quarter were authorized to receive an increase of more than 30 percent. Some allowance recipients did receive reductions in their care plans, as a quarter of them had at least 5 percent fewer hours in their care plans than they did at baseline. We do not know whether control group members received a pattern of reassessments similar to that of treatment group members, as data were not available for members of the former group.
-
The lower inpatient expenditures for the small sample of nonelderly treatment group members could have been due to beneficial effects of consumer direction on consumers' health, such as fewer pressure sores or contractures. However, the treatment-control difference in the proportion of nonelderly consumers with any inpatient expenditure was not statistically significant, nor was there a significant reduction in inpatient expenditures during the second year. Thus, the reduction in inpatient expenditures seems more likely to have been due to chance than to large effects on the need for or cost of hospitalizations.
-
Most of those who received PCS in the first year but not in the second had died or entered nursing facilities.
-
Even this result may be anomalous, as it is driven largely by outliers. The treatment group contained three people with home health costs of more than $10,000 (one of which was $30,000), while the control group contained only one. The program had no effect on whether a person received any home health services.
-
Medicaid and Medicare claims will not appear for those in managed care programs that use capitated payments. Therefore, the percentage of people using particular Medicaid and Medicare services will be slightly understated, because some people in Florida and New Jersey are in this type of managed care program.
-
We tested both categorical and continuous versions of the cost ratio variable.
-
As noted, if there were offsetting savings in core services (home health, targeted case management, hospice, durable medical equipment, and transportation), the program could meet CMS's budget neutrality requirement even if costs for the cashed out service were higher under Cash and Counseling than under the traditional program.
-
Personal conversations with Florida program officials.
APPENDIX A. ADDITIONAL TABLES
| TABLE A.1a. Arkansas Baseline Means for Regression Control Variables | ||
| Characteristic | Treatment Group | Control Group |
| AGE AT BASELINE, IN YEARS (Percent) | ||
| - 18 to 39 | 7.2 | 8.1 |
| - 40 to 64 | 20.6 | 19.5 |
| - 65 to 79 | 36.4 | 36.6 |
| - 80 or older | 35.9 | 35.9 |
| FEMALE (Percent) | 77.7 | 77.6 |
| RACE/ETHNICITY (Percent) | ||
| - White | 61.2 | 59.6 |
| - Black | 32.9 | 33.8 |
| - Other | 5.9 | 6.6 |
| - Hispanic | 1.3 | 1.1 |
| ENROLLMENT IN PUBLIC PROGRAMS (Number) | ||
| - Months in Medicaid | 11.3 | 11.4 |
| - Months in Medicare | 9.6 | 9.8 |
| ENROLLED IN ALTERNATIVES OR ELDERCHOICES WAIVER PROGRAM (Percent) | 0.43 | 0.43 |
| CDPS DIAGNOSIS CATEGORY (Percent)a | ||
| - Cancer | 12.6 | 11.8 |
| - Cardiovascular (Low Cost) | 22.2 | 21.6 |
| - Cardiovascular (Medium or High Cost) | 35.3 | 33.8 |
| - Cerebrovascular | 26.2 | 29.5 |
| - Central Nervous System (Medium or High Cost) | 3 | 7.4 |
| - Central Nervous System (Low Cost) | 35.0 | 33.3 |
| - Diabetes (Medium or High Cost) | 17.5 | 16.4 |
| - Diabetes (Low Cost) | 12.9 | 13.5 |
| - Eye (Percent) | 26.2 | 23.9 |
| - Gastrointestinal (Medium or High Cost) | 4.9 | 5.5 |
| - Gastrointestinal (Low Cost) | 23.6 | 21.9 |
| - Hematological | 6.9 | 5.1* |
| - Infectious | 4.8 | 6.1 |
| - Metabolic (Medium or High Cost) | 4.3 | 6.6** |
| - Metabolic (Very Low Cost) | 6.2 | 7.3 |
| - Psychiatric | 1.7 | 2.7 |
| - Pulmonary | 9.1 | 8.0 |
| - Renal (Very High Cost) | 5.4 | 4.2 |
| - Renal (Medium Cost) | 33.1 | 34.2 |
| - Renal (Low Cost) | 4.2 | 5.9* |
| - Skeletal | 15.5 | 15.9 |
| - Skin (High Cost) | 6.6 | 7.4 |
| - Skin (Low or Very Low Cost) | 10.4 | 11.4 |
| MEDICAID EXPENDITURES IN THE 12 MONTHS PRECEDING BASELINE (Dollars) | ||
| - Medicaid PCS | 2,199 | 2,226 |
| - ElderChoices or Alternatives Expenditures | 1,446 | 1,534 |
| - Nursing Facility Services | 126 | 170 |
| - Inpatient Hospital Services | 877 | 687 |
| - Home Health Services | 373 | 373 |
| - DME | 331 | 328 |
| - Selected Other Services | 1,250 | 1,290 |
| SELF-REPORTED HEALTH STATUS, UNMET NEEDS, HEALTH AND FUNCTIONING (Percent) | ||
| - Said health was fair at baseline | 30.9 | 31.0 |
| - Said health was poor at baseline | 47.5 | 50.8 |
| - Said health was worse at baseline than in preceding year | 54.0 | 53.6 |
| - Needs help getting in and out of bed | 61.9 | 65.2 |
| - Had unmet personal care need | 65.1 | 66.7 |
| WEEKLY HOURS IN CARE PLAN AT BASELINE (Number) | 10.6 | 10.3 |
| SAMPLE SIZE | 1,004 | 1,004 |
SOURCE: Medicare and Medicaid claims, December 1997 to April 2000; Medicare and Medicaid enrollment files; MPR's baseline evaluation survey, conducted between December 1998 and April 2001. CDPS = Chronic Illness and Disability Payment System DME = durable medical equipment PCS = personal care services. * Treatment group mean significantly different from the control group mean at the .10 level, two-tailed test. ** Treatment group mean significantly different from the control group mean at the .05 level, two-tailed test.
| ||
| TABLE A.1b. New Jersey Baseline Means for Regression Control Variables | ||
| Variable | Treatment Group | Control Group |
| AGE IN YEARS (Percent) | ||
| - 18 to 39 | 15.3 | 16.3 |
| - 40 to 64 | 31.4 | 31.0 |
| - 65 to 79 | 32.3 | 30.0 |
| - 80 or older | 21.0 | 22.7 |
| FEMALE (Percent) | 74.0 | 71.6 |
| RACE/ETHNICITY (Percent) | ||
| - Other | 9.1 | 8.0 |
| - Black | 38.1 | 36.4 |
| - White | 52.8 | 55.6 |
| - Hispanic | 35.5 | 36.1 |
| MEDICAID EXPENDITURES IN YEAR BEFORE BASELINE (Dollars) | ||
| - Total Medicaid expenditures | 20,446 | 20,716 |
| MEDICAID EXPENDITURES FOR SELECTED SERVICES IN YEAR BEFORE BASELINE (Dollars) | ||
| - Inpatient expenditures | 2,941 | 2,816 |
| - Home health | 1,073 | 1,177 |
| - Personal care | 8,096 | 8,695* |
| - Other selected services | 2,861 | 2,275** |
| MONTHS ON MEDICAID/MEDICARE BEFORE ENROLLMENT | ||
| - Months in Medicaid | 11.8 | 11.8 |
| - Months in Medicare | 7.9 | 8.0 |
| MANAGED CARE AT BASELINE (Percent) | ||
| - Any Medicaid HMO | 10.2 | 11.9 |
| - Any Medicare HMO | 2.2 | 0.9** |
| PREDICTED MEDICAL COSTS (Percent)a | ||
| - Very high predicted costs | 24.0 | 26.1 |
| - High predicted costs | 25.4 | 24.7 |
| - Medium predicted costs | 26.4 | 24.2 |
| - Low predicted costs | 24.2 | 25.0 |
| HEALTH STATUS, FUNCTIONAL STATUS, AND NEED FOR PERSONAL CARE AT BASELINE (Percent) | ||
| - Said health was fair | 35.2 | 38.0 |
| - Said health was poor | 44.6 | 40.3* |
| - Health expected to be worse next year | 48.6 | 45.2 |
| - Unmet need for personal care | 74.2 | 73.9 |
| - Not independent in transferring | 66.8 | 65.9 |
| MONTHLY PROSPECTIVE ALLOWANCE AMOUNT (Dollars) | 1,052 | 1,106** |
| RURAL (Percent) | 10.5 | 9.7 |
| SAMPLE SIZE | 861 | 869 |
SOURCE: Medicaid and Medicare claims data and MPR's baseline survey. CDPS = Chronic Illness and Disability Payment System HMO = health maintenance organization * Treatment group mean different from control group mean at .10 level. ** Treatment group mean different from control group mean at .05 level.
| ||
| TABLE A.1c. Florida Baseline Means and Regression Control Variables | ||
| Variable | Treatment Group | Control Group |
| AGE IN YEARS (Percent) | ||
| - 18 to 39 | 37.9 | 38.0 |
| - 40 to 59 | 12.3 | 12.3 |
| - 60 to 79 | 28.3 | 24.3* |
| - 80 or older | 21.6 | 25.3* |
| FEMALE (Percent) | 61.2 | 63.0 |
| RACE/ETHNICITY (Percent) | ||
| - Black | 23.2 | 22.3 |
| - Hispanic | 26.0 | 29.7* |
| MEDICAID EXPENDITURES IN YEAR BEFORE BASELINE (Dollars) | ||
| - Total Medicaid expenditures | 16,232 | 15,878 |
| MEDICAID EXPENDITURES FOR SELECTED SERVICES IN YEAR BEFORE BASELINE (Dollars) | ||
| - Inpatient expenditures | 516 | 826* |
| - Home health | 731 | 537 |
| - Waiver services | 11,161 | 10,633 |
| - Other selected services | 461 | 412 |
| MONTHS ON MEDICAID/MEDICARE BEFORE ENROLLMENT | ||
| - Months in Medicaid | 11.8 | 11.8 |
| - Months in Medicare | 8.1 | 7.7 |
| MANAGED CARE AT BASELINE (Percent) | ||
| - Any Medicaid or Medicare HMO | 48.0 | 51.7 |
| - Any capitated Medicaid HMO | 14.6 | 15.3 |
| - Any Medicaid primary care case management | 26.0 | 29.1 |
| - Any Medicare HMO | 14.4 | 14.7 |
| PREDICTED MEDICAL COSTS (Percent)a | ||
| - Very high predicted costs | 24.0 | 26.1 |
| - High predicted costs | 25.5 | 24.6 |
| - Medium predicted costs | 30.9 | 30.6 |
| - Low predicted costs | 19.6 | 18.7 |
| HEALTH STATUS, FUNCTIONAL STATUS, AND NEED FOR PERSONAL CARE AT BASELINE (Percent) | ||
| - Said health was fair | 30.5 | 31.7 |
| - Said health was poor | 26.4 | 26.2 |
| - Health expected to be worse next year | 3.0 | 33.5 |
| - Received personal care in prior year | 77.5 | 77.9 |
| - Unmet need for personal care | 59.1 | 58.7 |
| - Not independent in transferring | 56.5 | 60.4* |
| MONTHLY PROSPECTIVE ALLOWANCE AMOUNT (Dollars) | 1,232 | 1,199 |
| RURAL (Percent) | 13.2 | 11.9 |
| SAMPLE SIZE | 909 | 908 |
SOURCE: Medicaid and Medicare claims data and MPR's baseline survey. CDPS = Chronic Illness and Disability Payment System HMO = health maintenance organization * Treatment group mean different from control group mean at .10 level.
| ||
| TABLE A.2a. Effect of Cash and Counseling on Early Enrollees' Annual Expenditures for Medicaid and Medicare Services in Arkansas, By Year | ||||||
| Dependent Variable | Year 1 | Year 2 | ||||
| PredictedTreatmentGroupMean | PredictedControlGroupMean | EstimatedEffect(p-value) | PredictedTreatmentGroupMean | PredictedControlGroupMean | EstimatedEffect(p-value) | |
| NONELDERLY | ||||||
| Personal care expenditures | 5,736 | 2,545 | 3,191(0.000***) | 5,030 | 2,009 | 3,021(0.000***) |
| Nonpersonal care expenditures | 8,373 | 10,720 | -2,347(0.025**) | 8,998 | 11,460 | -2,462(0.051*) |
| Total Medicaid expenditures | 14,109 | 13,265 | 844(0.425) | 14,027 | 13,469 | 559(0.677) |
| SAMPLE SIZE | 385 | 385 | ||||
| ELDERLY | ||||||
| Personal care expenditures | 4,524 | 2,307 | 2,216(0.000***) | 3,396 | 1,734 | 1,661(0.000***) |
| Nonpersonal care expenditures | 6,729 | 7,283 | -554(0.062*) | 6,425 | 7,704 | -1,279(0.009***) |
| Total Medicaid expenditures | 11,252 | 9,590 | 1,662(0.000***) | 9,820 | 9,438 | 382(0.478) |
| SAMPLE SIZE | 929 | 929 | ||||
| SOURCE: Medicaid claims data. NOTES: Early enrollees enrolled in the demonstration before May 1, 2000. Means were predicted using ordinary least squares regression models. * Estimated effect significantly different from zero at .10 level. ** Estimated effect significantly different from zero at .05 level. *** Estimated effect significantly different from zero at .01 level. | ||||||
| TABLE A.2b. Effect of Cash and Counseling on Early Enrollees' Annual Expenditures for Medicaid and Medicare Services in New Jersey, By Year | ||||||
| Dependent Variable | Year 1 | Year 2 | ||||
| PredictedTreatmentGroupMean | PredictedControlGroupMean | EstimatedEffect(p-value) | PredictedTreatmentGroupMean | PredictedControlGroupMean | EstimatedEffect(p-value) | |
| NONELDERLY | ||||||
| Personal care expenditures | 11,086 | 9,123 | 1,964(0.000***) | 11,772 | 8,127 | 3,645(0.000***) |
| Nonpersonal care expenditures | 15,173 | 17,348 | -2,175(0.151) | 12,653 | 13,411 | -758(0.548) |
| Total Medicaid expenditures | 26,259 | 26,471 | -212(0.893) | 24,425 | 21,539 | 2,887(0.042**) |
| SAMPLE SIZE | 671 | 671 | ||||
| ELDERLY | ||||||
| Personal care expenditures | 11,689 | 10,825 | 864(0.025**) | 10,938 | 9,396 | 1,542(0.005***) |
| Nonpersonal care expenditures | 8,487 | 8,635 | -149(0.827) | 9,077 | 8,579 | 498(0.569) |
| Total Medicaid expenditures | 20,176 | 19,461 | 715(0.335) | 20,015 | 17,975 | 2,040(0.048**) |
| SAMPLE SIZE | 776 | 776 | ||||
| SOURCE: Medicaid claims data. NOTES: Early enrollees enrolled in the demonstration before January 1, 2002. Means were predicted using ordinary least squares regression models. ** Estimated effect significantly different from zero at .05 level. *** Estimated effect significantly different from zero at .01 level. | ||||||
| TABLE A.2c. Effect of Cash and Counseling on Early Enrollees' Annual Expenditures for Medicaid Services in Florida, By Year | ||||||
| Dependent Variable | Year 1 | Year 2 | ||||
| PredictedTreatmentGroupMean | PredictedControlGroupMean | EstimatedEffect(p-value) | PredictedTreatmentGroupMean | PredictedControlGroupMean | EstimatedEffect(p-value) | |
| NONELDERLY | ||||||
| Waiver expenditures | 22,465 | 18,919 | 3,546(0.000***) | 24,931 | 21,491 | 3,440(0.001***) |
| Nonwaiver expenditures | 5,454 | 5,950 | -496(0.286) | 5,312 | 5,154 | 158(0.741) |
| Total Medicaid expenditures | 27,919 | 24,869 | 3,051(0.001***) | 30,243 | 26,645 | 3,598(0.001***) |
| SAMPLE SIZE | 833 | 833 | ||||
| ELDERLY | ||||||
| Waiver expenditures | 10,412 | 9,601 | 811(0.077*) | 8,983 | 8,328 | 655(0.328) |
| Nonwaiver expenditures | 5,788 | 5,442 | 346(0.564) | 6,970 | 6,558 | 412(0.668) |
| Total Medicaid expenditures | 16,200 | 15,043 | 1,157(0.098*) | 15,953 | 14,886 | 1,067(0.320) |
| SAMPLE SIZE | 591 | 591 | ||||
| SOURCE: Medicaid claims data. NOTES: Early enrollees enrolled in the demonstration before October 1, 2001. Means were predicted using ordinary least squares regression models. The nonelderly include those under age 60 and the elderly include those age 60 and older. * Estimated effect significantly different from zero at .10 level. *** Estimated effect significantly different from zero at .01 level. | ||||||
| TABLE A.3. STATISTICAL POWER(Percent) | ||||
| Power for a 10 Percent Change in Medicaid Expenditures | ||||
| Full Sample | Early Enrollees | Nonelderly | Elderly | |
| Arkansas | 96 | 85 | 44 | 97 |
| Florida | 99 | 97 | 89 | 90 |
| New Jersey | 88 | 86 | 54 | 89 |
| NOTE: Assumes a two-tailed test at the .10 significance level. | ||||
| TABLE A.4. Effect of Cash and Counseling on Key Quality Outcomes, by Whether Controlling for Ratio of Actual to Expected Costs | ||||||||||||
| Elderly | Nonelderly | |||||||||||
| With Cost Ratio Controls | Without Cost Ratio Controls | With Cost Ratio Controls | Without Cost Ratio Controls | |||||||||
| TreatmentGroup | ControlGroup | EstimatedEffect(p-value) | TreatmentGroup | ControlGroup | EstimatedEffect(p-value) | TreatmentGroup | ControlGroup | EstimatedEffect(p-value) | TreatmentGroup | ControlGroup | EstimatedEffect(p-value) | |
| Arkansas | ||||||||||||
| Very Satisfied with Overall Care | 65.4 | 57.1 | 8.3**(0.018) | 68.9 | 54.2 | 14.7***(0.000) | 65.9 | 46.6 | 19.4***(0.001) | 70.3 | 41.2 | 29.1***(0.000) |
| Very Satisfied with Life | 53.5 | 39.0 | 14.5***(0.000) | 56.1 | 37.4 | 18.7***(0.000) | 44.4 | 23.1 | 21.3***(0.000) | 43.8 | 23.5 | 20.3***(0.000) |
| Unmet Need for Personal Care | 40.3 | 33.3 | 7.0**(0.029) | 35.8 | 36.6 | -0.8(0.793) | 26.4 | 38.8 | -12.3**(0.022) | 25.9 | 40.9 | -15.0***(0.001) |
| SAMPLE SIZE | 1,266 | 1,266 | 473 | 473 | ||||||||
| New Jersey | ||||||||||||
| Very Satisfied with Overall Care | 55.2 | 37.6 | 17.7***(0.000) | 55.9 | 37.0 | 18.9***(0.000) | 51.3 | 35.4 | 15.9***(0.000) | 51.6 | 35.1 | 16.6***(0.000) |
| Very Satisfied with Life | 46.8 | 25.4 | 21.4***(0.000) | 47.1 | 25.2 | 21.9***(0.000) | 37.6 | 21.0 | 16.5***(0.000) | 37.7 | 21.0 | 16.7***(0.000) |
| Unmet Need for Personal Care | 44.4 | 56.7 | -12.3***(0.001) | 43.6 | 57.4 | -13.8***(0.000) | 46.4 | 54.6 | -8.2**(0.033) | 46.2 | 54.7 | -8.5**(0.027) |
| SAMPLE SIZE | 770 | 770 | 680 | 680 | ||||||||
| Florida | ||||||||||||
| Very Satisfied with Overall Care | 50.2 | 46.7 | 3.5(0.408) | 50.1 | 46.9 | 3.2(0.446) | 68.7 | 47.2 | 21.5***(0.000) | 68.8 | 46.9 | 21.9***(0.000) |
| Very Satisfied with Life | 36.0 | 27.8 | 8.2**(0.042) | 35.9 | 27.9 | 8.0**(0.049) | 63.2 | 49.7 | 13.5***(0.001) | 63.4 | 49.5 | 13.9***(0.001) |
| Unmet Need for Personal Care | 42.9 | 46.4 | -3.4(0.368) | 42.8 | 46.5 | -3.7(0.332) | 26.4 | 33.4 | -7.0**(0.018) | 26.5 | 33.4 | -6.9**(0.019) |
| SAMPLE SIZE | 736 | 736 | 775 | 775 | ||||||||
| SOURCE: Medicaid claims data and MPR's nine-month follow-up survey of consumers. NOTES: Results in the left-hand column were estimated with a logit model that included a control variable for the ratio of actual costs to "expected" costs (according to the discounted baseline care plan). Results in the right-hand column were estimated with a logit model that did not include any cost-ratio controls. ** Estimated effect significantly different from zero at .05 level. *** Estimated effect significantly different from zero at .01 level. | ||||||||||||
APPENDIX B. ADMINISTRATIVE COSTS
When deciding whether to adopt a consumer-directed program, policymakers might want to consider how much the program will cost to administer. We initially intended to estimate the difference between the ongoing cost of administering Cash and Counseling and the cost of administering the traditional PCS program. However, high quality data on such costs were generally not available for the traditional program.1 Nonetheless, we do report the other administrative costs for Cash and Counseling, because this information may help policymakers assess the full cost of running a Cash and Counseling model of consumer direction. (The administrative costs reported in the following discussion are not included in the treatment or control group's Medicaid PCS expenditures reported previously.)
We present the on-going costs of administering Cash and Counseling. We exclude the costs that states incurred for outreach and enrollment (which ranged from about $100,000 over the first two years in Arkansas to about $400,000 over the first two years in Florida), because these costs typically would not be part of an on-going program.
Arkansas. The IndependentChoices program employed the following staff in 2003: 15-25 percent of the time of a high-level administrator to oversee the program, a full-time project manager, a full-time programmer/analyst, and a half-time clerical person. The annual salary and fringe benefit costs for these staff members was about $100,000 for the period from July 2002 through July 2003. During that year, the program also incurred administrative costs of about $5,000 for travel and supplies. In total, then, the program had administrative costs of about $105,000, or roughly $126 per allowance recipient per year. These administrative costs represent about three percent of the total PCS costs per allowance recipient per year.
New Jersey. In 2001-2002, the New Jersey Personal Preference Program spent $104,000 on the salary and benefits of two full-time staff, a project manager and a coordinator of counseling. It spent $1,450 on quality assurance activities (developing a consumer satisfaction survey and a quality and improvement committee) and $200 on consultant trainings.2 Total costs administrative costs were about $105,450, or about $187 per allowance recipient per year (or less than 2 percent of total yearly PCS costs per allowance recipient).
Florida. Florida's Consumer Directed Care (CDC) program was administered by three agencies: the Department of Elder Affairs (DEA), the Department of Children and Families/Adult Services (AS), and Developmental Disabilities (DD). Much of the administration of AS was done under DEA; for example, DEA provided consultant training and fiscal services for both DEA and AS. In 2000-2001, DEA had three full time staff members administering Cash and Counseling whose salary and benefit costs were $146,000. It also paid $20,000 to fiscal agencies for processing cash allowances and spent $2,800 on quality assessment and monitoring for fraud and abuse. AS estimates that its ongoing salary costs for administering the program were $2,000 (a small total, since only 77 AS beneficiaries enrolled in the demonstration and most of its administrative costs were incurred by DEA.) DD spent $320,000 on the salaries and benefit of part of the time of 15 staff members in district offices and four full-time staff members in the central office. Staff in district offices worked as the liaison between the consultant and central office and would approve care plans. Training and technical assistance to the consultants was provided by staff in both the district and central offices. DD also spent $7,000 on travel and $2,000 on marketing. Across DEA, AS, and DD, Florida spent about $500,000 administering CDC for both adults and children, or about $616 per allowance recipient per year (less than 4 percent of the yearly costs for waiver services per allowance recipient).
Summary. The experiences of the three states suggests that the cost of administering a Cash and Counseling program was about 2-4 percent of each state's costs for allowances. However, these costs are greater than the net administrative costs that states should expect. If 10-20 percent of consumers no longer receive services from agencies, the costs of processing claims and administering the traditional program should decline somewhat. The extent to which such a reduction in those administrative costs would outweigh the new administrative costs of administering a Cash and Counseling program cannot be readily ascertained from the available data.
Notes
-
States did supply the costs for processing claims, but these costs were trivial for both the traditional program and for Cash and Counseling.
-
About $10,000 per year was spent on consultant trainings during fiscal year 1999-2000 and 2000-2001; these were considered to be start-up costs.
APPENDIX C. PROGRAM FEATURES
| TABLE C.1. Key Features of Cash and Counseling Programs, By State | |||
| Arkansas'sIndependentChoices | Florida'sCDC | New Jersey'sPersonal Preference Program | |
| Demonstration Enrollment Period | December 1998 - April 2001 | June 2000 - July 2002 (Adults) and June 2000 - August 2001 (Children) | November 1999 - July 2002 |
| Eligible Population | Adults (elderly and nonelderly) with physical disabilities (may also have cognitive disabilities) who were eligible for the state plan Medicaid personal care program | Those elderly adults and nonelderly adults with physical disabilities, and children and adults with developmental disabilities who were receiving services under the HCBS waiver | Adults (elderly and nonelderly) with physical disabilities who were already enrolled in the state plan Medicaid personal care program |
| Services Included in Calculating the Allowance Amount | Personal care | HCBS waiver services, except case management/support coordination | Personal care |
| Hiring Restrictions | Could not hire legally responsible relatives (such as spouses or parents) or representative | None | Could not hire representative |
| Care Plan Adjustment Factor Used in Setting Allowance | Provider specific, ranging from 70 to 91 percent and averaging 86 percent across all enrollees | 89 percent for elderly adults, 83 percent for adults with physical disabilities, 92 percent for children and adults with developmental disabilities | None |
| Method for Calculating Allowance | $8 per hour in care plan multiplied by provider-specific adjustment factor | Claims history or adjustment factor multiplied by value of care plan. (Care plan always used for those with developmental disabilities. Also used care plan if claims history was not stable or if care plan value was at least $50 per month more than claims history.) | Value of care plan minus 10 percent set-aside for fiscal agent and counseling services |
| Median Monthly Prospective Allowance of All Demonstration Enrollees | $313 | $829 (adults) and $768 (children) | $1,097 |
| Funding for Fiscal Agent and Counseling Services | Paid for through pool of money generated from difference between $12.36 per hour paid to agencies and $8.00 per hour rate at which allowance was cashed out. Originally, agencies were paid a per client, per month rate for counseling and fiscal services, which was reduced at 6 month intervals. Later in the demonstration, agencies were paid a fixed rate for developing a spending plan and then paid per client per month for counseling and fiscal services. | Counseling paid for through existing Medicaid funding stream for case management and support coordination in traditional program. Fiscal agent fees paid for by schedule of fees charged to consumers (for example, $5 per check). | Set aside 10 percent of care plan value to cover counseling services and some fiscal agent costs. From this pool of money, the state paid human services agencies a lump sum per consumer to complete a cash management plan and an hourly fee thereafter for consulting; state also paid fiscal agent for some tasks, such as the processing of employment-related forms. Consumers paid some fiscal agent fees (such as for cutting and stopping checks). |
| Who Conducted Reassessments? | Agencies (for traditional program) and counselors (for allowance recipients) | Support coordinators or case managers (for traditional program) and counselors (for allowance recipients) | Agencies (for traditional program) and Medicaid nurses (for allowance recipients) |
| Participation in Other Consumer-Directed or Home Care Programs | Demonstration enrollees could also participate in the HCBS waiver programs ElderChoices or Alternatives.a | For adults with developmental disabilities, the six northern counties with a state-funded consumer-directed program. | Demonstration enrollees could not participate in HCBS waiver programs or a state-funded consumer-directed program. |
CDC = Consumer Directed Care HCBS = home- and community-based services
| |||
| TABLE C.2. Allowance Receipt Among Treatment Group Members in Arkansas, Florida, and New Jersey | |||||||||
| Full Sample | Early Enrollees | ||||||||
| Year 1 | Year 1 | Year 2 | |||||||
| Nonelderly | Elderly | All | Nonelderly | Elderly | All | Nonelderly | Elderly | All | |
| Percent Receiving Allowance During Year | |||||||||
| Arkansas | 88.9 | 81.7 | 83.7 | 90.2 | 82.1 | 84.5 | 73.7 | 58.6 | 63.1 |
| Florida | 57.5 | 41.7 | 49.6 | 58.1 | 39.4 | 50.3 | 59.1 | 32.0 | 47.8 |
| New Jersey | 67.2 | 64.1 | 65.5 | 66.3 | 63.1 | 64.5 | 61.8 | 57.6 | 59.5 |
| Months of Allowance Receipt, Averaged Across All Treatment Group Members | |||||||||
| Arkansas | 8.5 | 7.4 | 7.7 | 8.7 | 7.5 | 7.8 | 7.9 | 5.8 | 6.4 |
| Florida | 4.2 | 3.3 | 3.8 | 4.5 | 3.0 | 3.9 | 6.6 | 3.3 | 5.2 |
| New Jersey | 5.5 | 5.3 | 5.4 | 5.3 | 5.1 | 5.2 | 6.9 | 6.1 | 6.5 |
| SOURCE: Medicaid claims data. NOTE: Early enrollees enrolled in the demonstration before May 2000 in Arkansas, October 2001 in Florida, and January 2002 in New Jersey. The sample includes the 1,004 treatment group members in Arkansas (658 of whom were early enrollees), 909 in Florida (710 of whom were early enrollees), and 861 in New Jersey (719 of whom were early enrollees). | |||||||||