
U.S. Department of Health and Human Services
Do Consumer-Directed Medicaid Supportive Services Work for Children with Developmental Disabilities
Leslie Foster, Stacy Dale, Randall Brown, Barbara Phillips, Jennifer Schore and Barbara Lepidus Carlson
Mathematica Policy Research, Inc.
September 2004
PDF Version: http://aspe.hhs.gov/daltcp/reports/2004/ddkidsMss.pdf (79 PDF pages)
This report was prepared under contract HHS-100-95-0046 between the U.S. Department of Health and Human Services (HHS), Office of Disability, Aging and Long-Term Care Policy (DALTCP) and the University of Maryland. Additional funding was provided by the Robert Wood Johnson Foundation. For additional information about this subject, you can visit the DALTCP home page at http://aspe.hhs.gov/_/office_specific/daltcp.cfm or contact the ASPE Project Officer, Pamela Doty, at HHS/ASPE/DALTCP, Room 424E, H.H. Humphrey Building, 200 Independence Avenue, S.W., Washington, D.C. 20201. Her e-mail address is: Pamela.Doty@hhs.gov.
The opinions and views expressed in this report are those of the authors. They do not necessarily reflect the views of the Department of Health and Human Services, the contractor or any other funding organization.
TABLE OF CONTENTS
- BACKGROUND
- A New Model of Medicaid Supportive Services
- Cash and Counseling for Florida Children
- EXPECTED PROGRAM EFFECTS
- Previous Research
- Hypotheses About Service Use
- Hypotheses About Care Quality
- Hypotheses About Subgroup Effects
- METHODS
- Data Collection and Sample
- Control Variables and Outcome Measures
- Sample Restrictions
- Estimation of Program Effects
- Statistical Power
- Baseline Characteristics of the Analysis Sample
- RESULTS
- Assistance from Paid Caregivers
- Hours of Assistance
- Purchases of Supplies, Equipment, and Environmental Modifications
- Satisfaction with Overall Care Arrangements and Prevalence of Unmet Needs
- Satisfaction with Paid Caregivers' Relationship and Attitude
- Satisfaction with Paid Caregivers' Reliability and Schedules
- Health Problems, Adverse Events, and General Health Status
- Satisfaction with Life
- Subgroup Effects
- Sensitivity Tests
- DISCUSSION
- Limitations
- Policy Concerns
- In Conclusion
- APPENDIX A: Waiver Benefits
- APPENDIX B: Additional Information on Methods
- Baseline Characteristics Controlled for in the Analysis
- Outcome Measures and Reference Periods
- Interviewing Considerations
- Sample Restrictions
- Statistical Power
- APPENDIX C: Additional Results
- Measures of Service Use
- Measures of Care Quality
- Subgroup Effects
- Sensitivity Tests
- LIST OF FIGURES
- FIGURE 1: Model of the Expected Effects of Consumer Directed Care on Service Use and Care Quality
- LIST OF TABLES
- TABLE 1: Selected Baseline Characteristics of the Nine-Month Sample, by Whether Received PCS From Publicly Funded Caregivers
- TABLE 2: Treatment-Control Differences in Types of Caregivers, by Whether Received PCS From Publicly Funded Caregivers at Baseline
- TABLE 3: Estimated Effects of Consumer Directed Care on Hours of Assistance In Past Two Weeks, by Whether Received PCS From Publicly Funded Caregivers at Baseline
- TABLE 4: Estimated Effects of Consumer Directed Care on Parents' Satisfaction with Care Arrangements and Prevalence of Unmet Needs
- TABLE 5: Estimated Effects of Consumer Directed Care on Parents' Satisfaction with Paid Caregiver Relationship and Attitude
- TABLE 6: Estimated Effects of Consumer Directed Care on Parents' Satisfaction with Paid Caregivers' Reliability and Schedules
- TABLE 7: Estimated Effects of Consumer Directed Care on Health Problems, Adverse Events, and General Health Status
- TABLE 8: Estimated Effects of Consumer Directed Care on Parents' Satisfaction with Child's Life
- TABLE A.1: Benefits Covered by Florida's Developmental Services Waiver
- TABLE B.1: Baseline Characteristics of Children and Their Parents, by Evaluation Status
- TABLE B.2: Outcome Measures Used in the Analysis, by Type
- TABLE B.3: Samples Used in the Analysis
- TABLE B.4: Minimum Detectable Effects
- TABLE C.1: Estimated Effects of Consumer Directed Care on Types of Assistance, by Whether Received PCS From Publicly Funded Caregivers at Baseline
- TABLE C.2. Distribution of Care Hours, by Whether Received PCS From Publicly Funded Caregivers at Baseline
- TABLE C.3. Estimated Effects of Consumer Directed Care on Purchasing Goods and Modifications, by Whether Received PCS From Publicly Funded Caregivers at Baseline
- TABLE C.4. Quality Indicators Measured at Baseline and Nine Months, by Evaluation Status
- TABLE C.5. Estimated Effects of Consumer Directed Care on Parents' Satisfaction with Paid Caregiver Performance and Transportation Assistance
- TABLE C.6. Estimated Effects of Consumer Directed Care on Parents' Care Knowledge and Children's Functioning
- TABLE C.7. Estimated Effects of Consumer Directed Care on Key Quality Outcomes, by Whether Received PCS From Publicly Funded Caregivers at Baseline
- TABLE C.8. Estimated Effects of Consumer Directed Care on Key Service-Use Outcomes, by Age at Baseline
- TABLE C.9. Estimated Effects of Consumer Directed Care on Key Quality Outcomes, by Age at Baseline
- TABLE C.10. Estimated Effects of Consumer Directed Care on Key Service-Use Outcomes, by Whether had an Unmet Need for Personal Care at Baseline
- TABLE C.11. Estimated Effects of Consumer Directed Care on Key Quality Outcomes, by Whether had an Unmet Need for Personal Care at Baseline
- TABLE C.12. Estimated Effects of Consumer Directed Care on Key Service-Use Outcomes, by Prospective Allowance at Baseline
- TABLE C.13. Estimated Effects of Consumer Directed Care on Key Quality Outcomes, by Prospective Allowance at Baseline
- TABLE C.14. Estimated Effects of Consumer Directed Care on Key Quality Outcomes, by Whether Outcomes Were Imputed for Disenrolled Treatment Group Members
- TABLE C.15. Estimated Effects of Consumer Directed Care on Key Quality Outcomes, by Whether Controlling for Ratios of Actual-to-Expected Waiver Costs
ACKNOWLEDGMENTS
This paper has benefited greatly from the thoughtful comments and suggestions of several people. In particular, we appreciate input from the Cash and the Counseling Demonstration and Evaluation management team, including Kevin Mahoney, Lori Simon-Rusinowitz, Marie Squillace, and Tonya Moore; and from external reviewers A.E. Benjamin (UCLA Center for Health Policy Research), Laurie Powers (Oregon Health & Science University), and Jean Tuller (Oregon Technical Assistance Corporation).
In addition, numerous colleagues at Mathematica Policy Research, Inc. made this paper possible. Licia Gaber and Amy Zambrowski programmed the analysis, and Henry Ireys provided thoughtful comments on an earlier draft. Walter Brower edited the paper, and Jill Miller produced it.
The opinions presented here are those of the authors and do not necessarily reflect those of the funders (The Robert Wood Johnson Foundation and the U.S. Department of Health and Human Services, Office of the Assistant Secretary for Planning and Evaluation), the Cash and Counseling National Program Office, the demonstration states, or the Centers for Medicare & Medicaid Services.
EXECUTIVE SUMMARY
When the parents of children with developmental disabilities rely on Medicaid waiver programs for home- and community-based services (HCBS), they may have less control over those services than they would like. If parents, rather than case managers, could allocate the resources for their child's assistance, supplies, and equipment, they might be better able to meet the child's needs and be more satisfied with the child's care and quality of life. This study of Florida's Cash and Counseling demonstration program, Consumer Directed Care (CDC), compares children's use of services and quality of care under traditional versus consumer-directed approaches to Medicaid HCBS.
A Randomized Design and Comprehensive Surveys Provide Definitive Results
Demonstration enrollment, which occurred between June 2000 and August 2001, was open to children who were 3-17 years old and participating in Florida's Developmental Services waiver program. After their parents completed a baseline interview, the 1,002 children enrolled in the demonstration were randomly assigned to participate in CDC (the treatment group) or to receive waiver services as usual (the control group). Parents of treatment group children had the opportunity to receive a monthly allowance roughly equal to the expected Medicaid expenditures for the waiver services for which the child was eligible. Parents could use the allowance to hire their choice of caregivers and to buy other services and goods to meet their child's care needs. Program consultants and fiscal agents were available to help parents manage these responsibilities.
Service-use and quality indicators were drawn from computer-assisted telephone interviews. Nine months after baseline, we asked treatment and control group parents factual questions about their child's use of paid and unpaid personal care services (PCS), disability-related health problems, and adverse events. We also elicited opinions about: (1) parents' satisfaction with their child's care and quality of life, (2) the child's unmet needs for PCS and care supplies, (3) the child's general health status, (4) whether parents felt knowledgeable about caring for their child, and (5) how much difficulty their child had in performing daily activities. We used logistic regression models to estimate the program's effects on all these outcomes (except hours of care), while controlling for a comprehensive set of baseline characteristics.
Parents Altered Service Use, Reported Higher Satisfaction with Children's Care and Lives
Compared with children in Florida's usual HCBS waiver program, children whose parents directed their services were more likely to receive PCS from someone who was paid to help them, and their parents were happier with their care and well-being. These treatment group children received more hours of paid PCS, but fewer hours of unpaid PCS, than did control group children. Parents of treatment group children were less likely than their counterparts in the control group to say their child had unmet needs for PCS and care supplies, and they were much more satisfied with their child's overall care arrangements and with the way paid caregivers performed their jobs. Moreover, children in the treatment group were less likely than children in the control group to experience certain disability-related health problems.
CDC clearly benefited children and their parents during our follow-up period, even when we accounted for the treatment group's higher ratio of actual to expected waiver costs (as assessed in a companion analysis). From a consumer satisfaction standpoint, Florida and other states have compelling reasons to offer programs like CDC to families with children who have developmental disabilities.
INTRODUCTION
Although the parents of a child with severe developmental disabilities have primary responsibility for the child's health and welfare, some parents must also rely on publicly funded "supportive services" to meet the child's needs. Medicaid home- and community-based services (HCBS) waiver programs typically offer eligible children a wide range of supportive services, such as personal care, consumable supplies, professional therapies, and caregiver respite. However, case managers decide which services a particular child needs, while states select the providers or vendors who supply them. This system leaves some parents wanting more control over their child's supportive services. Given the opportunity, they might choose different caregivers or different service combinations. If parents were able to make and implement such choices, they might become more satisfied with their child's care and quality of life, without any increase in public costs (Mahoney et al. 2000; and Simon-Rusinowitz et al. 1998).
Some states are giving interested parents more of the control they seek through "consumer-directed" supportive services programs. Under Cash and Counseling, an innovative example of consumer direction, parents work within a given budget to decide which services will best meet their child's needs and arrange for their purchase. Critics of consumer direction fear that, without the case management and professional oversight that HCBS waiver programs are expected to provide, parents might be unable or unwilling to arrange services of sufficient quality and quantity (Benjamin et al. 2000).
The evaluation of Cash and Counseling is the first to use a randomized design to compare service use and quality under traditional versus consumer-directed approaches to Medicaid supportive services. As part of the evaluation, this paper presents results for the children and parents who participated in Florida's Cash and Counseling demonstration program, Consumer Directed Care (CDC).
BACKGROUND
A New Model of Medicaid Supportive Services
About 1.4 million people receive supportive services in their homes through state Medicaid plans or through HCBS waiver programs (Harrington and Kitchener 2003). Rather than requiring beneficiaries and their families to rely on home care agencies for their services, states are increasingly offering them opportunities to obtain services directly from individual providers (Velgouse and Dize 2000). This alternative has become known as "consumer-directed care," because beneficiaries who use individual providers assume the employer's role of hiring, managing, and possibly terminating their paid caregivers (Eustis 2000). There were an estimated 139 publicly funded consumer-directed programs in the United States in 1999. About a third of the programs served children with physical or developmental disabilities (Flanagan 2001).
Cash and Counseling expands upon some other models of consumer-directed care in that it lets consumers do more than choose their paid providers.1 It offers a flexible monthly allowance that consumers may use to hire providers and to purchase the other services and goods they need (within state guidelines). Parents manage the allowance for consumers younger than 18. Adult consumers can designate a representative (such as a family caregiver) to make, or help make, decisions about their care. In addition, Cash and Counseling offers counseling and fiscal services to help consumers and representatives plan for and manage their responsibilities. These tenets of Cash and Counseling--a flexible allowance, availability of counseling and fiscal services, and use of representatives--are meant to make consumer direction adaptable to Medicaid beneficiaries of all ages and abilities.
Cash and Counseling demonstrations, all of them voluntary, have been implemented in Arkansas, Florida, and New Jersey. The Robert Wood Johnson Foundation and the Office of the Assistant Secretary for Planning and Evaluation of the U.S. Department of Health and Human Services funded the demonstrations. The Centers for Medicare & Medicaid Services administered the Section 1115 waivers under which they operated.
Because their Medicaid programs and political environments differed considerably from each other's, the three demonstration states were not required to implement a standardized intervention, but they did have to adhere to the basic Cash and Counseling tenets. Arkansas and New Jersey designed their demonstration programs for adults and gave participants an allowance for their Medicaid personal care services (PCS). By contrast, Florida designed its demonstration program for both adults and children, and based allowances on a variety of HCBS waiver benefits. In light of such differences, Mathematica Policy Research, Inc. (MPR) is evaluating the demonstration programs separately. (We examine the experiences of Florida adults in a companion analysis by Carlson et al. 2004.)
Cash and Counseling for Florida Children
Florida implemented CDC to promote the independence of people with disabilities, to offer services that would better meet families' needs, and to encourage the prudent use of public resources. Parents who participated in early focus groups conducted to aid the design of CDC said they wanted to participate in a program that would give them decision-making power, flexibility, and privacy; allow them to choose caregivers whom they trusted and their child liked; and enable them to obtain respite for themselves without unduly impinging on others (Zacharias 1998; and Simon-Rusinowitz et al. 1998).
The demonstration was open to children aged 3-17 who were enrolled in the state's home- and community-based Developmental Services (DS) waiver program. To be thus enrolled, these children required the level of care that is furnished in Florida's intermediate care facilities for people with developmental disabilities. For example, children had to have mental retardation, autism, spina bifida, cerebral palsy, or Prader-Willi syndrome (listed in descending order of prevalence in the United States population). They also had to have severe limitations in at least three of the following: self-care, understanding and use of language, learning, mobility or self-direction, and capacity for independent living (Florida Medicaid Program 2000). In order to evaluate rigorously the impacts of Florida's CDC program relative to the usual DS waiver program, MPR randomly assigned half of all interested and eligible applicants to the demonstration's treatment group (to participate in CDC) and half to its control group (to continue receiving their DS waiver benefits).
At the time of random assignment, children who enrolled in the demonstration had been receiving a wide variety of benefits through the DS waiver. For example, children with spina bifida may have received supplies to care for incontinence and pressure sores, whereas children with autism may have received behavior therapy to prevent self-injury. Overall, the most commonly used benefits were support coordination (used by 99 percent of children), supplies and equipment (71 percent), and PCS (53 percent), according to preenrollment Medicaid claims. Children also received benefits such as environmental modifications (6 percent), professional services and therapies (3 percent), private-duty nursing (1 percent), and transportation (0.5 percent).
When parents (or legal guardians) were deciding whether to enroll their child in the demonstration, CDC staff told them what the child's monthly allowance would be if he or she were to be randomly assigned to the treatment group. Allowances were based on the expected costs of benefits in children's waiver "support plans," and they were discounted to reflect historic differences between the expected and actual costs of DS waiver services. (Support plans specify the types and amounts of services that children are eligible to receive through the DS waiver program. They are prepared by "support coordinators," who serve as case managers in that program.2) At the time of random assignment, the average allowance was $1,164 per month, or $269 per week, after discounting.3
The enrollment and random assignment of children began in June 2000 and continued until the evaluation target of 1,000 children was met, in August 2001.4 MPR conducted a baseline telephone interview with one parent of each enrolled child and then randomly assigned each child to the treatment or the control group. After random assignment, the experiences of treatment and control group children diverged. While control group children continued to receive DS waiver benefits, the parents of treatment group children were contacted by CDC consultants about starting on the allowance. (Florida used the term "consulting" rather than "counseling" in its demonstration.)
With assistance from consultants, the parent acting as the enrolled child's CDC representative developed and implemented a written plan for using the child's monthly allowance. As long as parents used the allowance to purchase services or goods that met their child's needs for home or community support, they were not restricted to state-selected suppliers or to Medicaid-covered benefits. Parents thus had the flexibility to purchase experimental therapies if they wished, and they could pay themselves or other relatives for caregiving.
Parents could call on program consultants for advice about recruiting caregivers, arranging backup assistance, and similar matters. (Unlike support coordinators in the DS waiver program, CDC consultants would not be expected to coordinate and access goods and services on behalf of families. Thus consultants bore less responsibility than coordinators for decisions about children's care.) In addition, consultants monitored satisfaction, safety, and use of funds through monthly telephone calls and periodic home visits. At least once annually, CDC consultants reassessed children's needs for HBCS and could recommend adjustments in children's monthly allowances. (Similarly, in the DS waiver program, support coordinators conducted reassessments and could recommend changes to children's benefits.) CDC consulting services were provided at no direct cost to families.
Finally, parents chose between two levels of fiscal services. In the more comprehensive level, CDC fiscal agents maintained families' program-related accounts, withheld paid caregivers' payroll taxes, filed payroll tax returns, and wrote checks for wages and other purchases. Parents were charged $5 per check, up to a $25 monthly maximum. Alternatively, parents who preferred to maintain their own accounts and handle payroll, taxes, and checking activities themselves could do so if they passed a skills examination. In these cases, CDC fiscal agents performed monthly "desk reviews" of participating families' program-related records. Families paid $10 a month for desk reviews.
EXPECTED PROGRAM EFFECTS
It was intended that, by giving parents control over the budget for their child's Medicaid waiver benefits, CDC would produce changes in the types, amounts, and providers of goods and services that families used (Figure 1). These changes, in turn, were expected to reduce children's unmet needs, improve parents' satisfaction, and enhance children's quality of life, without compromising children's health and safety or increasing public costs.
Previous Research
We are not aware of any previous studies that used random assignment to investigate the effect of consumer direction on the use of supportive services by children with developmental disabilities. However, in an evaluation of a cash assistance program in the Netherlands, researchers found that adult treatment group members used more hours of services than did control group members. The difference arose because the services that treatments bought in the private market cost less than the services that controls received from agencies (Miltenburg et al. 1996). In studying the types of caregivers hired by self-directing consumers, some researchers have found that consumers hire family and friends to replace other paid workers (for example, Benjamin and Matthias 2001; Grana and Yamashiro 1987; and Osterle 1994). Others have found that consumers hire mostly workers who are not family or friends (for example, Cameron and Firman 1995).
The Arkansas Cash and Counseling demonstration program, IndependentChoices, had two major effects on use of Medicaid PCS by adults with physical dependencies. First, it seemed to improve access to paid PCS, in part by reducing the proportion of beneficiaries who, for various reasons, were not receiving the services for which they qualified (Dale et al. 2003). Second, IndependentChoices seemed to affect the way nonelderly adults met their personal care needs. Self-directing nonelderly adults were more likely than their counterparts in the traditional program to receive assistance with various activities, such as eating, bathing, and transportation. They also were more likely than their counterparts in the traditional program to have purchased assistive equipment. At the same time, self-directing consumers received fewer unpaid and fewer total hours of assistance from caregivers, on average, than did their counterparts.
In addition to affecting Arkansas consumers' use of PCS, IndependentChoices produced many of the intended effects on consumers' well-being (Foster et al. 2003). Compared with their counterparts in the traditional program, IndependentChoices consumers were much more satisfied with the timing and reliability of their services, less likely to feel neglected or rudely treated by paid caregivers, and more satisfied with the way paid caregivers performed their tasks. The Arkansas program also seemed to reduce some unmet needs for PCS and greatly enhanced consumers' satisfaction with the way they were spending their lives. Furthermore, self-directing consumers were no more likely than control group members to experience adverse events such as falls, infections, pressure sores, or contractures, despite the absence of agency oversight.
Hypotheses About Service Use
Previous research suggests that CDC is likely to affect at least some dimensions of children's service use. We expect that, like IndependentChoices, CDC will increase the proportion of children receiving PCS from paid caregivers. In the DS waiver program, some parents may do without paid caregivers because their child does not adapt well to strangers, because Medicaid-certified caregivers can be scarce in rural areas or in strong labor markets, or because the child's support plan does not include caregiver assistance. By contrast, we hypothesize that parents' having the freedom to choose and hire caregivers under CDC will be evident in a relatively large proportion of treatment group children receiving PCS from paid caregivers at followup. Among children who already were receiving PCS from paid caregivers when they enrolled in the demonstration, CDC might not affect the likelihood of their receiving paid assistance, but it might well affect the number and type of paid caregivers they have (for example, family members versus agency workers, or live-in versus visiting caregivers).
It is less clear how CDC might affect other service-use outcomes, such as the amounts of paid and unpaid care children receive, and their use of supplies, equipment, and environmental modifications. If treatment group parents use their child's allowance to purchase equipment or home modifications, it could reduce the child's need for assistance from caregivers. On the other hand, treatment group parents could, for the express purpose of buying more assistance from caregivers, purchase less equipment or fewer supplies than the child received under the DS waiver. Alternatively, if treatment group parents use the allowance to compensate family and friends for respite care they had provided free, then we might observe a shift between unpaid and paid care hours, but no difference in total hours.
Hypotheses About Care Quality
The literature on the service needs of children with disabilities suggests that consumer direction could be a boon or a detriment to the quality of care they receive. On the one hand, parents of children with developmental disabilities are "known to be good observers of their children and to provide valid assessments of their abilities..." (Krahn et al. 1990). Thus, merely having to cede some control over their child's care to support coordinators may undercut parents' satisfaction with that care (Chomicki and Wilgosh 1992). Under CDC, parents' increased feelings of control could improve their perceptions of care quality. On the other hand, children with developmental disabilities often require services from several types of providers (Sloper and Turner 1992). If parents are less able than support coordinators to arrange for a complex array of services, they may find it overly burdensome to assume greater responsibility for meeting their child's needs, and their satisfaction would then diminish. Worse, if parents are unable to find competent caregivers, their child's health could deteriorate.
Individual family circumstances also could affect the way parents and children experience consumer direction. For example, single parents might find managing all their child's care to be too much additional responsibility, while married parents might have problems dividing the increased workload. Family dynamics, as well as parental satisfaction with the program, could suffer if the siblings of participating children feel neglected when their parents begin managing their brother's or sister's care, or if siblings resent being called upon to provide care, or more care, themselves. Conversely, the program might enable parents to spend more time with their other children, thereby improving the quality of family life as a whole. Moreover, being able to hire family and friends, rather than rely on agency staff, could be a great relief for parents and a valuable comfort for their children.
Hypotheses About Subgroup Effects
It is possible that program effects will differ, in magnitude or even direction, for certain subgroups of children. In particular, we hypothesize that differences may arise depending on whether children:
-
Were receiving PCS from publicly funded caregivers at baseline.
-
Were younger than 12 years at baseline.
-
Had an unmet need for personal care at baseline.
-
Were eligible for a relatively generous CDC allowance at baseline.
The distinction between children who were and were not receiving PCS from publicly funded caregivers at baseline is of particular interest in our evaluation of service use.5 As noted, a child's waiver support plan would not have included paid PCS unless a support coordinator recommended them. Even if a child's support plan did include paid PCS, some parents may have been unable or unwilling to use them, given available providers. As noted, we expect that more treatment group than control group children will be using paid PCS at followup. If this difference exists within the subset of children who were not receiving those services at baseline, it would suggest that the CDC program enabled some parents to obtain PCS that they would have been unable to obtain (or unwilling to accept) if they had not been allowed to manage their child's waiver benefits.
We examine program effects by children's age group (pre-teens and teens versus others) simply because children's needs change as they mature, and because parents' ability to meet those needs to their satisfaction may well differ as their child ages. To explore whether CDC worked well for children who had unmet needs or high levels of need at baseline, we examined effects for subgroups defined by whether parents said their child needed more help with personal care at baseline, and whether the child was eligible for a relatively generous CDC allowance (assuming that large allowances reflect high needs).6
| FIGURE 1. Model of the Expected Effects of Consumer Directed Care on Service Use and Care Quality |
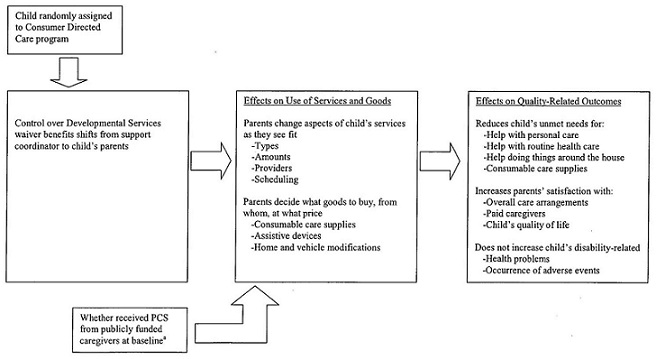 |
PCS = Personal care services; includes help with personal care, routine health care, doing things around the house, and transportation.
|
METHODS
Data Collection and Sample
Data for this analysis were drawn primarily from two computer-assisted telephone surveys of children's parents. As noted, between June 2000 and August 2001, one parent of each child who enrolled in the demonstration (n = 1,002) completed a baseline interview, and then each child was randomly assigned to the treatment or control group.7 About nine months later, we attempted a follow-up interview with the same parents. (We interviewed a child's other parent, if necessary.) Nine-month interviews were completed by 859 parents, 441 in the treatment group and 418 in the control group, yielding response rates of 88 and 84 percent, respectively.8 To preserve the groups' comparability and obtain a complete picture of program experiences, we attempted to conduct nine-month interviews even if children were deceased or if those in the treatment group had disenrolled from CDC.
Control Variables and Outcome Measures
Both the baseline and the nine-month survey instruments used established measures and pre-tested questions.
Control Variables. For reasons described below, we used multivariate regression models to estimate the effects of the CDC program. We constructed the models' control variables from parents' responses to the baseline interview and from preenrollment program records. These variables include demographic characteristics of children and/or their parents, children's health and functioning and prior use of PCS, parents' reasons for enrolling their child in the demonstration, and parents' work and supervisory experience. The models also control for baseline measures of several of the service use and quality outcomes that we measured at followup. (Table B.1 lists all control variables, with treatment and control group means.)
Outcome Measures. Our analysis includes objective and subjective outcome measures. To measure service use, we asked parents factual questions about the types and amounts of PCS their child received, and about their purchases of supplies, equipment, and home and vehicle modifications. We also asked factual questions about disability-related adverse events and health problems the child might have experienced. To measure other components of care quality, we asked about parents' perceptions and opinions regarding: (1) satisfaction with their child's care, (2) the child's unmet needs for PCS and care supplies, (3) the child's quality of life, (4) the child's general health status, (5) whether parents felt knowledgeable about caring for the child, and (6) how much difficulty the child had performing the activities of daily living.
Our outcome measures focus on children's PCS, even though Florida's CDC program also "cashed out" other types of supportive services. Our focus on PCS arose from interviewing considerations and the need to collect data that were consistent across the three demonstration states. As noted, Arkansas and New Jersey cashed out only beneficiaries' Medicaid PCS. While the same was not true in Florida, it was not feasible to conduct interviews of reasonable length and collect data on other services (such as professional therapies and respite care) that were cashed out there.
Table B.2 presents a complete list of the service-use and quality outcomes we examined and identifies the reference periods for which they were measured. The table also notes the literature and data collection instruments we consulted during survey design. The following measures merit further explanation.
Total Hours of Assistance. In our nine-month survey, we asked parents how many hours of help their child received during a recent two-week period from each of up to three visiting paid caregivers, three visiting unpaid caregivers, two live-in paid caregivers, and two live-in unpaid caregivers.9 We asked separate questions about the hours each caregiver spent on tasks that benefited the child exclusively (such as help with bathing and eating) and the hours spent on tasks that might have benefited others in the household (such as preparing meals, doing laundry, and housekeeping). We summed across all relevant caregivers to measure the total hours of each type of care that children received.
Paid and Unpaid Hours of Assistance. We expected that the treatment group would receive paid care from both live-in and visiting caregivers and that many of these paid caregivers also would provide unpaid care. Thus, we asked treatment group parents how many hours of care their child received from each paid live-in and visiting caregiver, and then we asked them to report the number of hours for which each caregiver was paid. We subtracted paid hours from the child's total hours to calculate unpaid hours.
In contrast, we expected that the control group would receive all or very nearly all its paid care from visiting caregivers (that is, from agency workers). Although we did not ask parents to report the number of hours for which live-in caregivers might have been paid, we did impute paid live-in hours for the small number of relevant cases.10 As we did with the treatment group, we subtracted paid hours from the child's total hours to calculate unpaid hours.11
Measures Based on Scales. Many of our quality indicators are categorical measures derived from survey questions with four-point scales (for example, degree of satisfaction). For each scale, we constructed one measure that was set equal to 1 only if the respondent gave the most favorable rating ("very satisfied"), with all other ratings set to 0. We constructed a second measure that was set equal to 1 only if the respondent gave an unfavorable rating ("somewhat" or "very dissatisfied"), with all other ratings set to 0.12 We converted the scales into two binary outcome measures, rather than analyzing the scales with multinomial logit models, to reduce the number of parameters estimated and simplify the presentation and interpretation of results.13 Because we examined program effects on the ends of each scale, we could infer whether consumer direction increased the proportion of highly satisfied caregivers, decreased the proportion of dissatisfied caregivers, or had both effects.14
Sample Restrictions
Although 859 respondents completed nine-month interviews, some survey questions were posed only to subsets of respondents. The restrictions were of two types:
- We did not ask parents (or proxies) about their overall satisfaction or about unmet needs if they were also paid caregivers, because these parents may not have answered such questions objectively. This restriction applied to 63 parents (14 percent) of treatment group children but to no parents of control group children. The resulting sample for these types of questions consisted of 378 treatment group and 418 control group members.
- We could not ask parents about their satisfaction with help received from paid caregivers during given reference periods if their child did not receive paid care (or paid care with a specific activity, such as transportation), during the period in question. This restriction applied to as many as 145 control group and 89 treatment group members, depending on the question. The 63 treatment group parents who were paid caregivers were also excluded from these questions, for a resulting sample of 289 treatment group and 273 control group members.
In addition, if a sample member died by the time of our interview, we did not ask the parent about adverse events, health problems, their knowledge of their child's care, or the child's quality of life. Two children, both treatment group members, had died by the time of our nine-month interview. (The sample restrictions described here are also shown in Table B.3.)
Estimation of Program Effects
Our impact estimates measure the effects of children's having the opportunity to receive the monthly allowance (by virtue of their being assigned to the treatment group), regardless of whether the children actually received it. Of the 441 treatment group parents who completed the nine-month interview, 307 (69 percent) said their child was actually receiving the monthly allowance at the time of the interview. Those not receiving it included the two children who died, 78 (18 percent) who disenrolled from the program, and 54 (12 percent) whose parents did not yet have an approved plan for spending the allowance or who had not yet hired caregivers.15 Furthermore, 74 (over half) of the treatment group children who were not on the allowance were receiving paid assistance from some other source during the reference period we asked about. (Children could continue receiving DS waiver benefits until their CDC allowances began, so this was the most likely source of other paid assistance.) We have included these cases, where treatment group members were not experiencing CDC quite as intended, in our analysis, because excluding them could bias the analysis by inducing unmeasured, preexisting differences between the treatment and control groups. Finally, our results do not measure the possible effects of a mandatory consumer-directed program, which could differ greatly from those of a voluntary one.
Because the demonstration used random assignment, we could have obtained unbiased impact estimates for most measures simply by comparing the treatment and control groups' unadjusted means. However, for reasons explained above, the pattern of missing data on outcome variables from the nine-month interview differed for the treatment and control groups. As a result, treatment group members with data on a particular outcome may have differed systematically from control group members with data on the same outcome. Furthermore, there were a few chance differences in the treatment and control groups' baseline characteristics (Table B.1). To account for these differences and provide more efficient estimates of program effects, we used regression models to control for the sample's baseline characteristics.
For binary outcome measures, we assessed the impacts of CDC by using the estimated coefficients from logit models to calculate the predicted probabilities that the dependent variable took a value of 1, first with each sample member assumed to be in the treatment group, and then with each assumed to be in the control group. For the few continuous outcome measures (hours of care received, of various types), we measured impacts by calculating the treatment-control difference in the means predicted by ordinary-least-squares regression models. With both types of models, we used the p-values of the estimated coefficients on the treatment status variable to assess the statistical significance of the impacts.16
As noted, our analysis included assessments of program effects on subgroups defined by selected baseline characteristics. In our most extensive subgroup analysis, we examined key service use outcomes by whether sample members were receiving PCS from publicly funded caregivers at baseline. To do this, we interacted a binary indicator for the subgroup with the treatment status indicator in each of the models that predicted service use outcomes. When modeling subgroup effects for other outcomes, we interacted multiple subgroup indicators with the treatment status indicator in each model. The subgroup indicators in these models were defined by baseline measures of each child's age group, whether the child had unmet needs for personal care, whether the child's prospective allowance was above the median for the sample, and whether the child received PCS from publicly funded caregivers.
Statistical Power
With 859 cases in the sample, we had 80 percent power to detect impacts of 8.5 percentage points for binary outcome variables with a mean of .50 (assuming two-tailed tests at the .05 significance level; Table B.4). For variables with a mean of .10 or .90, the detectable difference was 5.1 percentage points with 80 percent power. Although smaller impacts may not be detected, they are not likely to be policy relevant.
Baseline Characteristics of the Analysis Sample
Most of the children in this analysis were white and male, and nearly half were under age 10 (Table 1, first column). More than two-thirds of the parents we interviewed had attended at least some college. Slightly more than half the sample lived in parts of Florida that parents described as rural or as having high crime or poor public transportation. (These conditions could make it difficult for agencies to recruit paid workers or for treatment group families to hire workers other than nearby relatives and friends.) About 40 percent of parents said their child's health was fair or poor, rather than excellent or good, compared with the health of the child's peers. Most children could not bathe or get out of bed without help or supervision.
At baseline, nearly half the sample was not receiving PCS from publicly funded caregivers, and children in this group differed from others in several respects (Table 1, second and third columns). They were, according to their parents, less likely to be in fair or poor health than the other children, less likely to need help getting in or out of bed, and less likely to have unmet needs for personal care. The CDC allowances proposed for these children were smaller, on average, than allowances for the other children ($181 versus $347 per week). The parents of children who were not receiving PCS from publicly funded caregivers were less satisfied with their child's overall care than were other parents, perhaps because they had to rely more on informal care.
| TABLE 1. Selected Baseline Characteristics of the Nine-Month Sample, by Whether Received PCS From Publicly Funded Caregivers(Percentages, Unless Noted) | |||
| Characteristic | All Children (n = 859) | Did Not ReceivePCS from Publicly Funded Caregivers atBaseline(n = 403) | Received PCS from PubliclyFundedCaregivers at Baseline(n = 456) |
| AGE IN YEARS | |||
| 3 to 6 | 21.1 | 18.6 | 23.2 |
| 7 to 9 | 28.5 | 28.3 | 28.7 |
| 10 to 12 | 21.4 | 19.9 | 22.8 |
| 13 to 15 | 17.0 | 20.1 | 14.3 |
| 16 to 17 | 12.0 | 13.2 | 11.0 |
| MALE | 63.1 | 61.3 | 64.7 |
| OF HISPANIC ANCESTRY | 18.0 | 13.9 | 21.5 |
| RACE | |||
| White | 81.8 | 80.3 | 83.3 |
| Black | 13.6 | 15.4 | 12.0 |
| Other | 4.5 | 4.3 | 4.8 |
| PARENT ATTENDED AT LEAST SOME COLLEGE | 68.1 | 64.7 | 71.2 |
| AREA OF RESIDENCE IS: | |||
| Rural | 18.9 | 19.7 | 18.2 |
| Not rural, but high-crime or without good public transportation | 35.2 | 28.8 | 40.8 |
| Not rural, not high-crime, with good public transportation | 45.9 | 51.5 | 41.0 |
| IN FAIR OR POOR HEALTH RELATIVE TO PEERS | 41.3 | 38.2 | 44.1 |
| IN PAST WEEK, COULD NOT: | |||
| Bathe without help | 92.7 | 90.3 | 94.7 |
| Get in or out of bed without help | 60.8 | 55.5 | 65.5 |
| RECEIVED PCS FROM PRIVATELY PAID CAREGIVERS IN PAST WEEKa | 26.9 | 22.3 | 30.9 |
| PARENTS DISSATISFIED WITH OVERALL CARE ARRANGEMENTS | 38.9 | 43.7 | 34.9 |
| NOT GETTING ENOUGH HELP WITH PERSONAL CARE | 66.4 | 59.6 | 72.5 |
| ALLOWANCE IF ASSIGNED TO THE TREATMENT GROUP (Mean Dollars per Week) | 268.9 | 180.5 | 347.0 |
SOURCE: MPR's baseline interview, conducted between June 2000 and August 2001, and the CDC Program. PCS = Personal care services; includes help with personal care, routine health care, doing things around the house, and transportation.
| |||
RESULTS
Assistance from Paid Caregivers
At followup, considerably more children in the treatment group than in the control group were getting PCS from someone who was paid to help them. Of the 403 children who were not receiving PCS from publicly funded caregivers at baseline, 76 percent of those in the treatment group, but only 52 percent of those in the control group, were receiving PCS from paid caregivers at followup (Table 2). One-quarter of these treatment group children were receiving some of this help from a parent, one-third from some other family member, and the remaining 41 percent only from people outside the family. Compared with control group children, treatment group children had more caregivers who were paid to provide PCS and fewer who were not paid. They were also more likely to have paid live-in caregivers and less likely to have paid visiting caregivers.
Of the 456 children who were receiving PCS from publicly funded caregivers at baseline, 86 percent of treatment group members and 80 percent of control group members also were receiving PCS from paid caregivers at followup (Table 2). For nearly 60 percent of these treatment group children, all their paid caregivers were unrelated to them; the others received PCS from a parent (23 percent) or other family member (19 percent) who was paid to help them. Children in the treatment group had fewer unpaid caregivers than those in the control group. These children were also more likely than their control group counterparts to have paid live-in caregivers, and they were less likely to have paid visiting caregivers.17
Hours of Assistance
Compared with children in the control group, children in the treatment group received more hours of paid PCS, on average, during the two-week reference period (Table 3). In the subgroup of children who were not receiving PCS from publicly funded caregivers at baseline, treatment group children received an average of 23 hours of paid PCS during the two weeks we asked about, compared with 11 hours of paid PCS that control group children received. This difference was offset by an opposing, but statistically insignificant, difference in the amount of unpaid care the groups received, leaving the treatment and control groups with similar hours of care overall (219 and 213 total hours per two weeks, respectively, or about 15 hours a day). About 6 hours a day were solely for the care of the child; the rest benefited other household members as well as the child.
In the subgroup of children who were receiving PCS from publicly funded caregivers at baseline, treatment group members received 54 hours of paid care during the two weeks we asked about, compared with the control group's 47 paid hours (Table 3). In this subgroup, the difference in paid hours was more than offset by an opposing difference in the amount of unpaid care the group received. Thus, treatment group children in this subgroup received fewer total hours of care than control group children received (254 versus 277 hours, respectively).18
Purchases of Supplies, Equipment, and Environmental Modifications
CDC seemed not to have had much effect on whether parents purchased care supplies or assistive equipment for their child, or on whether they modified their homes or vehicles to accommodate the child's needs. Regardless of the evaluation group their child was in, or whether their child was receiving PCS from publicly funded caregivers at baseline, more than 8 in 10 parents made at least one such purchase since their child's demonstration enrollment (shown in Appendix C, Table C.3). Purchases of supplies, such as diapers and disposable gloves, were most common (reported by roughly two-thirds of parents), and vehicle modifications were least common (reported by about one-eighth). Because our survey measured only whether parents made these purchases, we do not know if one group bought more or spent more than the other.
Satisfaction with Overall Care Arrangements and Prevalence of Unmet Needs
At the time of our follow-up interviews, twice as many parents in the treatment group as in the control group were very satisfied with the arrangements for their child's paid and unpaid care (56 versus 27 percent, Table 4), and less than half as many were dissatisfied (16 versus 35 percent). Moreover, the proportion of treatment group parents dissatisfied with their child's care arrangements fell sharply from baseline to followup (from 41 to 16 percent), while the proportion of control group parents who were dissatisfied stayed about the same (Table C.4).19
Compared with control group parents, significantly fewer treatment group parents reported that their child had unmet needs for paid or unpaid assistance in each of five areas we asked about (Table 4). Unmet needs in the control group were common, affecting from one-third to over one-half the group, depending on the need in question. By contrast, treatment group parents were 20-30 percent less likely (estimated effects divided by control group means) to report unmet needs for assistance with personal care, such as help with eating and bathing; for routine health care, such as help taking medicine and exercising; and for help doing other things around the house, such as homework. Finally, although treatment and control group parents were equally likely to have purchased care supplies during our follow-up period, treatment group parents were less likely to say their child needed more supplies than they were getting.
Satisfaction with Paid Caregivers' Relationship and Attitude
CDC had two important effects on parents' satisfaction with the way paid caregivers interacted with their child. Although satisfaction was high overall, treatment group parents were 14 percentage points more likely than control group parents to be very satisfied with the relationship between their child and his or her paid caregiver(s) (Table 5). Second, these parents were half as likely to say that paid caregivers sometimes neglected their child. Neglect was reported by one-eighth of treatment group parents and by one-quarter of control group parents.
For other measures, treatment-control differences were quite small or statistically insignificant (Table 5). Reports of dissatisfaction with caregiver-child relationships were rare for parents in either evaluation group, as were reports of caregivers taking family belongings without asking. In contrast, reports of paid caregivers helping the child when the child did not wish to be helped were quite common, but equally so for both evaluation groups.
Satisfaction with Paid Caregivers' Reliability and Schedules
Under CDC, substantially fewer parents said they had problems with paid caregivers' reliability or schedules. Compared with control group parents, significantly greater proportions of treatment group parents said paid caregivers always completed their tasks and never arrived late or left early (Table 6). In addition, 85 percent of treatment group parents were very satisfied with paid caregivers' schedules, compared with 64 percent of control group parents. Under CDC, proportionally more parents said they could change paid caregivers' schedules easily if they needed to.
Health Problems, Adverse Events, and General Health Status
With respect to health problems, accidents, and injuries that can easily befall children who have disabilities, treatment group children fared better than or as well as control group children. For four out of five health problems, differences were statistically significant in favor of the treatment group, even though the health problems were not common (Table 7). (The treatment-control difference for the most commonly reported health problem, respiratory infections, was not significant.) Treatment group children also were significantly less likely than their control group counterparts to have fallen in the past month. Very few children in either group sustained injuries while receiving help from paid caregivers, and very few saw a doctor because of a fall, or because of a cut, burn, or scald. By more general measures of health status, the two groups also were similar. About 13 percent of all parents described their child's health as "poor" relative to the health of his or her peers, and about 7 percent reported that their child had been hospitalized in the past two months.20
Satisfaction with Life
Compared with parents of control group children, parents of treatment group children were much more satisfied with the way their child was spending his or her life at the time of our follow-up interview. The proportion of treatment group parents who said they were very satisfied in this regard was 23 percentage points higher than it was in the control group, and the proportion of dissatisfied treatment group parents was 17 points lower (Table 8). Moreover, the proportion of treatment group parents who were dissatisfied with the way their child was spending his or her life fell dramatically from baseline to followup (from 39 to 14 percent), while dissatisfaction among control group parents stayed fairly level (Table C.4). Asked to name the most important way the CDC allowance improved their child's life, most treatment group parents (about 60 percent) cited reasons such as being able to hire whomever they chose, or being able to hire better-qualified or more reliable people than had been available previously (not shown).21
Subgroup Effects
With respect to key service-use and quality outcomes, CDC affected the subgroups we examined in much the same way that it affected the overall sample (Tables C.7 through C.13). As noted in our presentation of service-use results, there were some striking differences between the subgroups of children who were, or were not, receiving PCS from publicly funded caregivers at baseline (Table 2 and Table 3). However, given the small sample sizes, only a few of the differences between subgroups were statistically significant (as identified with daggers in the left-hand column of the tables). Likewise, differences in impacts between other subgroups were seldom significantly different from each other.
Sensitivity Tests
As noted, we measured program impacts by asking both treatment and control group parents the same questions about their child's unmet needs and about their own satisfaction during a two-week period shortly before the nine-month follow-up interview. Because we asked the questions without regard for treatment group members' CDC enrollment status, our impact estimates are a fair illustration of Florida's ability to retain enrollees and deliver the CDC intervention as planned. However, to understand whether our impact estimates might have differed had we asked parents of the 78 disenrolled treatment group members about their child's experiences while they were still enrolled, we used their responses to a program-specific question--Would you recommend the CDC program to others wanting more control over their PCS?--to stand in for their actual responses to questions designed to measure program impacts.22 After we imputed those responses, the proportions of dissatisfied treatment group parents were a few points larger for each of the key variables we examined, and the proportion of very satisfied treatment group parents changed by six points at most, in one direction or the other (Table C.14). Even with these variations, program effects were large and significant, and would not materially affect our interpretation of the results.
We also conducted tests to assess whether the greater satisfaction levels reported by treatment group parents could be explained by the fact that their children's allowances were more generous than the costs paid by Medicaid for waiver benefits delivered to control group children. Dale et al. (2004a) show that the average allowance for treatment group children during the ninth month after enrollment was about 16 percent more than the average baseline allowance (that is, the amount offered at the time of enrollment). Average waiver costs for control group children in month nine, on the other hand, were 18 percent less than the average baseline allowance amount.23
To test this hypothesis, we estimated regressions on key quality outcomes that controlled for a child's ratio of actual to expected waiver costs. Our results suggested that parents were more satisfied with their child's overall care when their child received higher-than-expected benefits (according to the child's discounted baseline waiver support plan). However, none of the estimated program effects on key outcomes were appreciably different from those presented in this paper. For example, when we do not control for any cost ratio indicators, treatment group parents are 29.7 percentage points more likely than control group parents to be very satisfied with their child's overall care arrangements (as reported in Table 4). When we do control for whether a child incurred higher costs than expected, the estimated treatment-control difference is 28.3 percentage points (Table C.15).24
| TABLE 2. Treatment-Control Differences in Types of Caregivers, by Whether Received PCS From Publicly Funded Caregivers at Baseline | ||||||
| Outcome | Did Not Receive PCS fromPublicly Funded Caregivers atBaseline(n = 403) | Received PCS from PubliclyFunded Caregivers at Baseline(n = 456) | ||||
| Treatment GroupMean | Control GroupMean | Treatment- ControlDifference(p-Value) | Treatment GroupMean | Control GroupMean | Treatment- ControlDifference(p-Value) | |
| RECEIVED PCS FROM PAID CAREGIVERS AT FOLLOWUP (Percent) | 76.1 | 51.8 | 24.2***(.000) | 85.9 | 79.7 | 6.2**(.032) |
| PAID CAREGIVERS' RELATIONSHIP TO CHILDa (Percent) | ||||||
| Parent | 25.4 | n.a. | n.a. | 22.9 | n.a. | n.a. |
| Other relative, not parent | 34.0 | n.a. | n.a. | 18.7 | n.a. | n.a. |
| Nonrelatives only | 40.6 | n.a. | n.a. | 58.4 | n.a. | n.a. |
| NUMBER OF CAREGIVERS | ||||||
| Paid | 1.3 | 0.8 | 0.5***(.000) | 2.2 | 2.1 | 0.1(.670) |
| Unpaid | 2.6 | 3.2 | -0.6***(.001) | 2.7 | 3.3 | -0.6***(.001) |
| Total | 3.9 | 3.9 | 0.0(.848) | 4.9 | 5.4 | -0.5**(.043) |
| AMONG THOSE WITH PAID CAREGIVERS AT FOLLOWUP: | ||||||
| Had a paid live-in caregiver (Percent) | 39.9 | 6.0 | 33.8***(.000) | 29.9 | 2.1 | 27.8***(.000) |
| Had a paid visiting caregiver (Percent) | 78.3 | 97.6 | -19.3***(.000) | 90.7 | 98.4 | -7.8***(.001) |
| AMONG THOSE RECEIVING PAID CARE, PERCENTAGE WITH: | ||||||
| 1 paid caregiver | 47.8 | 57.8 | -10.0(.280) | 36.0 | 38.9 | -3.0(.389) |
| 2 paid caregivers | 27.5 | 25.3 | 2.2 | 26.6 | 25.8 | 0.8 |
| 3 or more | 24.6 | 16.9 | 7.8 | 37.4 | 35.3 | 2.1 |
SOURCE: MPR's baseline interview, conducted between June 2000 and August 2001, and nine-month interview, conducted between April 2001 and July 2002. NOTE: At followup, paid caregivers included those funded by public or private sources. "Received assistance" means were predicted with logit models. For other outcomes in this table, the results presented are the unadjusted means and treatment-control differences. Chi-square tests were used to test significance levels for categorical variables and t-tests were used to test significance levels for continuous variables. **Significantly different from zero at the .05 level, two-tailed test. ***Significantly different from zero at the .01 level, two-tailed test. Estimated effects for the two subgroups were significantly different from each other at the .01 level. n.a. = not applicable. PCS = Personal care services; includes help with personal care, routine health care, doing things around the house, and transportation.
| ||||||
| TABLE 3. Estimated Effects of Consumer Directed Care on Hours of Assistance in Past Two Weeks, by Whether Received PCS From Publicly Funded Caregivers at Baseline | ||||||
| Outcome | Did Not Receive PCS from PubliclyFunded Caregivers at Baseline(n = 386) | Received PCS from PubliclyFunded Caregivers at Baseline(n = 433) | ||||
| Predicted Treatment GroupMean | Predicted ControlGroupMean | Estimated Effect(p-Value) | Predicted Treatment GroupMean | Predicted ControlGroupMean | Estimated Effect(p-Value) | |
| TOTAL HOURS | 218.5 | 212.6 | 5.9(.602) | 253.7 | 277.4 | -23.7**(.030) |
| Paid hours | 23.4 | 10.5 | 12.8***(.001) | 53.9 | 46.7 | 7.2**(0.43) |
| Unpaid hours | 195.2 | 202.1 | -6.9(.515) | 199.8 | 230.7 | -30.9***(.002) |
| FROM LIVE-IN CAREGIVERS: | ||||||
| Hours that benefited child only | 85.0 | 80.8 | 4.2(.449) | 91.5 | 103.6 | -12.1**(.024) |
| Hours that benefited entire household | 109.0 | 109.5 | -0.4(.424) | 110.3 | 115.0 | -4.7(.944) |
| HOURS FROM VISITING CAREGIVERS | 24.5 | 22.4 | 2.1(.617) | 51.9 | 58.7 | -6.8*(.094) |
| SOURCE: MPR's baseline interview, conducted between June 2000 and August 2001, and nine-month interview, conducted between April 2001 and July 2002. NOTE: Means were predicted with regression models. *Significantly different from zero at the .10 level, two-tailed test. **Significantly different from zero at the .05 level, two-tailed test. ***Significantly different from zero at the .01 level, two-tailed test. Estimated effects for the two subgroups were significantly different from each other at the .10 level. Estimated effects for the two subgroups were significantly different from each other at the .05 level. PCS = Personal care services; includes help with personal care, routine health care, doing things around the house, and transportation. | ||||||
| TABLE 4. Estimated Effects of Consumer Directed Care on Parents' Satisfaction with Care Arrangements and Prevalence of Unmet Needs | |||
| Outcome | Predicted Treatment Group Mean(Percent) | Predicted Control Group Mean(Percent) | Estimated Effect(p-Value) |
| HOW SATISFIED WITH CHILD'S OVERALL CARE ARRANGEMENTS (n = 794) | |||
| Very satisfied | 56.4 | 26.8 | 29.7***(.000) |
| Dissatisfied | 15.5 | 34.5 | -19.0***(.000) |
| CHILD HAS AN UNMET NEED FOR: (n = 796) | |||
| Help doing things around the house | 38.0 | 54.9 | -17.0***(.000) |
| Help with personal care | 32.8 | 44.6 | -11.8***(.000) |
| Help with transportation | 28.1 | 37.2 | -9.2***(.004) |
| Help with routine health care | 22.1 | 32.1 | -10.0***(.001) |
| Care supplies | 26.1 | 38.1 | -12.0***(.000) |
| SOURCE: MPR's nine-month interview, conducted between April 2001 and July 2002. Sample sizes vary slightly from measure to measure because of item nonresponse. NOTE: Means were predicted with logit models. ***Significantly different from zero at the .01 level, two-tailed test. | |||
| TABLE 5. Estimated Effects of Consumer Directed Care on Parents' Satisfaction with Paid Caregiver Relationship and Attitude | |||
| Outcome | Predicted Treatment Group Mean(Percent) | Predicted Control Group Mean(Percent) | Estimated Effect(p-Value) |
| HOW SATISFIED WITH CHILD'S RELATIONSHIP WITH PAID CAREGIVER(S) (n = 562) | |||
| Very satisfied | 96.0 | 82.4 | 13.5***(.000) |
| Dissatisfieda | 0.7 | 1.5 | -0.8(.371) |
| SINCE ENROLLMENT, PAID CAREGIVER(S): (n = 655) | |||
| Neglected child | 12.0 | 25.2 | -13.2***(.000) |
| Were rude or disrespectful to child | 10.8 | 15.1 | -4.3*(0.97) |
| Took something without askinga | 1.9 | 4.0 | -2.1(.107) |
| Gave unwanted help to child | 51.9 | 50.5 | 1.4(.721) |
SOURCE: MPR's nine-month interview, conducted between April 2001 and July 2002. Except where larger changes are noted, sample sizes vary slightly from measure to measure because of item nonresponse. NOTE: Means were predicted with logit models, unless noted. *Significantly different from zero at the .10 level, two-tailed test. ***Significantly different from zero at the .01 level, two-tailed test.
| |||
| TABLE 6. Estimated Effects of Consumer Directed Care on Parents' Satisfaction with Paid Caregivers' Reliability and Schedules | |||
| Outcome | Predicted Treatment Group Mean(Percent) | Predicted Control Group Mean(Percent) | Estimated Effect(p-Value) |
| SINCE ENROLLMENT, HOW OFTEN DID PAID CAREGIVER(S) (n = 655) | |||
| Complete Tasksa | |||
| Always | 51.7 | 39.8 | 11.9***(.002) |
| Usually/sometimes/rarely | 13.2 | 30.8 | -17.6***(.000) |
| Arrive Late or Leave Early | |||
| Never | 53.6 | 37.8 | 15.8***(.000) |
| Often | 8.1 | 20.0 | -11.8***(.000) |
| Not Come as Scheduled (n = 567) | 19.7 | 24.6 | -4.9(.158) |
| HOW SATISFIED WITH PAID CAREGIVERS' SCHEDULE (n = 562) | |||
| Very satisfied | 85.3 | 63.9 | 21.4***(.000) |
| Dissatisfiedb | 3.5 | 10.7 | -7.2***(.001) |
| COULD EASILY CHANGE SCHEDULE (n = 562) | 36.2 | 27.7 | 8.5**(.031) |
SOURCE: MPR's nine-month interview, conducted between April 2001 and July 2002. Except where larger changes are noted, sample sizes vary slightly from measure to measure because of item nonresponse. NOTE: Means were predicted with logit models, unless noted. **Significantly different from zero at the .05 level, two-tailed test. ***Significantly different from zero at the .01 level, two-tailed test.
| |||
| TABLE 7. Estimated Effects of Consumer Directed Care on Health Problems, Adverse Events, and General Health Status | |||
| Outcome(n = 857) | Predicted Treatment Group Mean(Percent) | Predicted Control Group Mean(Percent) | Estimated Effect(p-Value) |
| Health Problems in Past Month | |||
| Had a Respiratory Infection | 26.2 | 29.8 | -3.7(.227) |
| Contractures Developed or Worsened | 9.4 | 13.4 | -4.0**(.049) |
| Shortness of Breath Developed or Worseneda | 5.5 | 10.6 | -5.1***(.007) |
| Bedsores Developed or Worseneda | 3.0 | 6.0 | -3.0**(.033) |
| Had a Urinary Tract Infectiona | 2.5 | 6.0 | -3.5**(.011) |
| Adverse Events in Past Month | |||
| Fell | 27.3 | 36.2 | -8.9***(.004) |
| Saw a Doctor Because of a Fall | 3.0 | 1.9 | 1.1(.343) |
| Was Injured While Receiving Paid Helpa | 2.3 | 3.8 | -1.5(.190) |
| Saw a Doctor Because of a Cut, Burn, or Scalda | 1.6 | 1.2 | 0.4(.617) |
| General Health Status | |||
| Current Health Is Poor Relative to Peers' | 12.7 | 12.5 | 0.2(.936) |
| Spent Night in Hospital or Nursing Home in Past Two Months | 6.2 | 7.6 | -1.4(.425) |
SOURCE: MPR's nine-month interview, conducted between April 2001 and July 2002. Sample sizes vary slightly from measure to measure because of item nonresponse. NOTE: Means were predicted with logit models, unless noted. **Significantly different from zero at the .05 level, two-tailed test. ***Significantly different from zero at the .01 level, two-tailed test.
| |||
| TABLE 8. Estimated Effects of Consumer Directed Care on Parents' Satisfaction with Child's Life | |||
| Outcome(n = 794) | Predicted Treatment Group Mean(Percent) | Predicted Control Group Mean(Percent) | Estimated Effect(p-Value) |
| HOW SATISFIED WITH THE WAY CHILD IS SPENDING LIFE THESE DAYS | |||
| Very satisfied | 51.9 | 28.7 | 23.2***(.000) |
| Dissatisfied | 13.4 | 30.3 | -16.9***(.000) |
| SOURCE: MPR's nine-month interview, conducted between April 2001 and July 2002. NOTE: Means were predicted with logit models. ***Significantly different from zero at the .01 level, two-tailed test. | |||
DISCUSSION
Under Florida's Cash and Counseling demonstration, children whose parents directed their HCBS waiver benefits were more likely than children in the DS waiver program to receive PCS from someone who was paid to help them. Children in the consumer-directed program also received more hours of paid PCS than the other children did. Parents who directed their child's care were less likely than their counterparts in the DS waiver program to say their child had unmet needs for PCS and care supplies. They were much more satisfied with their child's overall care arrangements and with the way paid caregivers did their jobs. Moreover, children in the consumer-directed program were less likely than children in the DS waiver program to experience certain disability-related health problems, and their parents were more satisfied with the way the children were living their lives.
It is likely that several factors contributed to the observed effects on children's receipt of PCS from paid caregivers. While some control group parents may have had difficulty finding Medicaid-certified providers in their area, or opted not to have a stranger care for their child, many treatment group parents were able to bypass these obstacles by hiring family or friends, or even paying themselves, to provide such services.25 Second, many parents of children whose baseline support plans did not include paid PCS used at least part of the allowance to hire caregivers who did provide such services. Thus, our findings show that CDC enabled more parents to obtain the services they wanted. They also may reflect a divergence between the services parents want and the services that support coordinators recommend when they prepare children's waiver support plans. In addition, it is likely that some parents used the monthly allowance to pay themselves for providing PCS and then used their wages to buy care supplies or other items for their child. This approach could increase benefits to the child and free parents from having to include supplies in their purchasing plans and ask the program to issue checks to pay for them.
Viewed together, our findings about parents' satisfaction and the amount of assistance children received suggest that treatment group parents' relatively high satisfaction stemmed not from whether they obtained more care for their child. Rather, most treatment group parents said (in response to an open-ended survey question about how the CDC allowance improved their quality of life) that they derived satisfaction from having greater control over their child's care, and particularly from being able to hire caregivers themselves. Thus, parents who hired nonrelatives (the majority) may have been more satisfied because they hired a caregiver whom their child liked rather than merely accepting the one assigned by a Medicaid-certified agency. Other parents may have been more satisfied because they were able to compensate family members for helping their child rather than depending on them for favors. That treatment group parents chose their child's paid caregivers may largely explain why these parents were less likely than their control group counterparts to say their child was neglected by a paid caregiver or had unmet needs, even though treatment group children received fewer hours of care than did control group children.26 Moreover, the treatment group's more favorable health outcomes suggest not only that parents were satisfied with the care arrangements they made, but that those arrangements helped protect children's health.
Finally, the effects of CDC on parental satisfaction were large and significant even when we controlled for the treatment group's higher-than-expected costs. While postenrollment needs assessments may have been advantageous for the treatment group, the effect of CDC on parents seemed, again, to arise not from the dollar value of their child's benefits, but from the control that parents exercised over those benefits.
Limitations
Although this analysis was based on a strong, randomized design, a few caveats are warranted about study duration, generalizability, possible reporting bias, and the limitations of our survey instrument. First, given the rather short duration of our follow-up period (nine months), it is impossible to know whether the positive effects we observed for treatment group children and their parents would persist over time, as children mature and their needs change. Similarly, parents' experiences with consumer direction may have been unusually positive during the first nine months because of the novelty of the service model.27
Second, because our findings are based on a single, fairly new program, they may not be broadly generalizable. Variations in state benefits (including their dollar value and the types of services covered), program implementation, and environmental factors (such as the labor market for service providers) could all affect the potential impact of consumer direction on service use, parents' satisfaction, and children's well-being.
Third, some parents of control group children may have exaggerated their dissatisfaction during follow-up interviews because they were disappointed that their child was not assigned to the treatment group. In the same vein, some treatment group parents may not have reported health problems or other adverse events that their child experienced. This may be because these parents strongly supported the program and wished to see it continue, or because they were loath to admit that these problems occurred while they were managing the child's care. Without directly observing service provision, it is impossible to assess any such reporting bias.
Fourth, our evaluation relies on a single survey instrument to assess service-use and quality outcomes in all three demonstration states, despite variations in covered benefits and target populations. The wording of questions was varied to apply to children; however, the instrument was developed with the PCS needs of adult beneficiaries foremost in mind. As noted, it was not possible both to keep interviews to a reasonable length and to ask about the particular needs of children or about the needs of children with specific disabilities, even though having such information would have enriched our analysis. That said, when responding to several open-ended survey questions, few treatment group parents commented on non-PCS services or reported that they hired or tried to hire specialized service providers. Asked about the most important benefits of the CDC allowance, about 5 percent of parents cited access to services such as behavior therapy. Another 3 percent cited access to respite care, which we also did not ask about directly.28
Likewise, although our analysis suggests that the CDC program did not adversely affect children's physical health and safety, we did not specifically measure effects it may have had on children's social, behavioral, and emotional health. That treatment group parents were more likely than control group parents to be very satisfied with the way their child was spending his or her life at followup may suggest that CDC did favorably affect these aspects of children's overall health. In addition, when we asked treatment group parents about the most important benefits of the CDC allowance, several parents (9 percent of respondents) cited improvements in their child's behavior or social and emotional health. A few parents remarked that their son or daughter was successfully socializing with nonrelatives for the first time, as a result of services they purchased with the CDC allowance (not shown).
Policy Concerns
Although the evaluation's findings are overwhelmingly positive from the perspective of parents and their children, they may raise a few concerns for policymakers.
Were children receiving enough assistance in the CDC program?
Among children who were receiving PCS from paid caregivers at baseline, those in the treatment group received fewer total hours of care (paid plus unpaid) than did those in the control group, on average. This finding may raise questions as to whether this subset of treatment group children received enough assistance.
We found no evidence to suggest that children received too little assistance under the CDC program. The parents of treatment group children were less likely than other parents to report that their child had unmet needs, and they were more likely to say their child's paid caregivers always finished appointed tasks. Parents of treatment group children were less likely to report that their child experienced adverse health events, and claims data confirm that children in both evaluation groups used hospitals and emergency rooms at the same rate.
It is not difficult to imagine that parents were more satisfied with their child's supportive services in the CDC program than they would have been in the DS waiver program, even though their child may have received fewer hours of assistance. Fourteen percent of treatment group parents told us that the ability to obtain a higher quality of care was the most important benefit they derived from the CDC allowance (not shown). In fact, some treatment group parents may have chosen to pay caregivers a higher wage than the DS waiver program would pay in order to attract better-qualified providers, albeit for fewer hours (forthcoming from Dale et al. 2004b). Alternatively, caregivers hired with the monthly allowance may have accomplished more, in less time, than did control members' agency workers. During our interviews, one parent said she hired college students as caregivers because students have "endless energy." Moreover, compared with agency workers, directly hired caregivers may have accomplished more because they were personally, rather than professionally, motivated to meet the child's needs. Finally, treatment group parents who paid themselves may have saved time by performing tasks concurrently--bathing the child while dinner was cooking--instead of having an agency worker perform one of the tasks.
Were children getting the right types of services in the CDC program?
A second concern is that parents of treatment group children whose DS waiver support plans called for professional services (such as physical therapy) and other benefits, but not PCS, may have used some of the allowance to buy PCS and left too few resources to cover the cost of other benefits the child needed. We do not have survey data with which to examine use of professional services or other authorized benefits; however, in a future analysis of program data on parents' use of the monthly allowance, we will examine whether children in the CDC program used services commensurate with those recommended in their DS waiver support plans.
Can gains in satisfaction be achieved without increases in Medicaid waiver costs?
As noted in this paper and analyzed thoroughly in a companion analysis by Dale et al. (2004a), Medicaid waiver costs were higher for the treatment group than for the control group in the year after children's random assignment. Waiver costs differed because serving the control group cost less than the state expected and because treatment group allowances were larger than expected. The larger allowances suggest that some of the CDC consultants who approved parents' spending plans were more generous than the support coordinators who developed support plans for the control group. Anecdotal evidence suggests that some consultants may have believed they were expected to be more receptive to parents' wishes under CDC than they would have been in the usual waiver program.
Because of its demonstration experience, Florida has adopted for its ongoing CDC program (CDC-Plus) many changes that might help control costs. These changes include limiting the number of consultants and improving their training; retraining program staff with regard to approving consumers' purchasing plans; developing a needs assessment form to standardize the method for determining the cost of services; requiring that consumers who wish to make costly, one-time purchases first use any unspent funds in their account, rather than ask consultants to authorize revisions to their purchasing plans; and mandating that consumers spend or forfeit unspent balances that exceed 1.5 times the monthly allowance. In addition, the state is studying options for recouping funds from consumers who died, disenrolled, or have significant unexpended funds in their accounts.
We observed large, positive program effects on satisfaction even when we controlled for higher-than-expected treatment group costs. Such findings suggest that Florida could implement cost-containment measures like those just described and continue to see the highly favorable effects of the CDC program on the welfare of children with developmental disabilities.
In Conclusion
Our findings about children's service use and quality under Florida's CDC program, together with those from the Arkansas demonstration, strongly suggest that the Cash and Counseling model of consumer-directed supportive services can increase access to paid caregiver assistance, improve care quality from the perspective of consumers, and enhance quality of life for both adults and children.
REFERENCES
Allen, Susan M., and Vincent Mor. "The Prevalence and Consequences of Unmet Need: Contrasts Between Older and Younger Adults with Disability." Medical Care, vol. 35, no. 11, November 1997, pp. 1132-48.
Benjamin, A.E. "Alternative Models of Personal Assistance Services: Paperwork Reduction Act Submission Supporting Statement." Los Angeles: University of California, February 1996.
Benjamin, A.E., Ruth E. Matthias, and Todd M. Franke. "Comparing Consumer-Directed and Agency Models for Providing Supportive Services at Home." Health Services Research, vol. 35, no. 1, April 2000, pp. 351-66.
Benjamin, A.E., and Ruth E. Matthias. "Age, Consumer Direction and Outcomes of Supportive Services at Home." Gerontologist, vol. 41, no. 5, 2001, pp. 632-42.
Cameron, K., and J. Firman. "International and Domestic Programs Using 'Cash and Counseling' Strategies to Pay for Long-Term Care." Washington, DC: National Council on the Aging, 1995.
Carlson, Barbara Lepidus, Stacy Dale, Leslie Foster, Barbara Phillips, Randall Brown, and Jennifer Schore. "Effect of Consumer Direction on Adults' Personal Care and Well-Being in Three States." Draft Report. Princeton, NJ: Mathematica Policy Research, Inc., July 2004.
Carlson, Barbara Lepidus, and Barbara Phillips. "Survey Methodology Report for the Cash and Counseling Demonstration." Draft Report. Princeton, NJ: Mathematica Policy Research, Inc., October 2003.
Chomicki, S., and L. Wilgosh. "Health Care Concerns Among Parents of Children with Mental Retardation." Children's Health Care, vol. 21, no. 4, fall 1992, pp. 206-12.
Connally, Patrick. "The California Quality of Life Project: A Project Summary." In Quality of Life for Persons with Disabilities: International Perspectives and Issues, edited by David Goode. Cambridge, MA: Brookline Books, Inc., 1994.
Dale, Stacy, Randy Brown, and Barbara Phillips. "Medicaid Costs Under Consumer Direction for Florida Children with Developmental Disabilities." Draft Report. Princeton, NJ: Mathematica Policy Research, Inc., June 2004a. Available at [http://aspe.hhs.gov/daltcp/reports/FLddkids.htm].
Dale, Stacy, Randy Brown, Barbara Phillips, and Barbara Lepidus Carlson. Report on the Experiences of Paid Workers in the Three Demonstration States. Princeton, NJ: Mathematica Policy Research, Inc., forthcoming 2004b.
Dale, Stacy, Randy Brown, Barbara Phillips, Jennifer Schore, and Barbara Lepidus Carlson. "The Effect of Consumer Direction on Personal Assistance Received in Arkansas." Princeton, NJ: Mathematica Policy Research, Inc., March 2003. Available at [http://aspe.hhs.gov/daltcp/reports/Arkpa.htm].
Eustis, Nancy. "Consumer-Directed Long-Term Care Services: Evolving Perspectives and Alliances." Generations, vol. 20, no. 3, fall 2000, pp. 10-15.
Eustis, Nancy N., Rosalie A. Kane, and Lucy Rose Fischer. "Home Care Quality and the Home Care Worker: Beyond Quality Assurance as Usual." Gerontologist, vol. 33, no. 1, 1993, pp. 64-73.
Flanagan, Susan. "An Inventory of Consumer-Directed Support Service Programs: Overview of Key Program Characteristics." Presentation at the Cash and Counseling annual meeting, Arlington, VA, 2001.
Florida Medicaid Program. "Summary of Services." Tallahassee, FL: Agency for Health Care Administration, July 2003. Available at [http://www.fdhc.state.fl.us/Medicaid/sos.pdf]. Accessed December 10, 2003.
Florida Medicaid Program. "ICF/DD Services Coverage and Limitations Handbook." Tallahassee, FL: Agency for Health Care Administration, July 2000. Available at [http://floridamedicaid.acs-inc.com/XJContent/Independent%20Care%20Facili.... Accessed June 10, 2003.
Foster, Leslie, Barbara Phillips, and Jennifer Schore. "Consumer and Consultant Experiences in the Florida Consumer Directed Care Program." Draft Report. Princeton, NJ: Mathematica Policy Research, Inc., September 2004a.
Foster, Leslie, Randall Brown, Barbara Phillips, and Barbara Lepidus Carlson. "The Effects of Cash and Counseling on the Primary Informal Caregivers of Children with Developmental Disabilities." Draft Report. Princeton, NJ: Mathematica Policy Research, Inc., March 2004b.
Foster, Leslie, Randall Brown, Barbara Phillips, Jennifer Schore, and Barbara Lepidus Carlson. "Improving the Quality of Medicaid Personal Assistance Through Consumer Direction." Health Affairs Web Exclusive, March 26, 2003. Available at [http://content.healthaffairs.org/webexclusives/index.dtl?year=2003].
Goode, David. Discussing Quality of Life: Framework and Findings of the Work Group on Quality of Life for Persons with Disabilities. Valhalla, NY: Mental Retardation Institute, 1988.
Grana, J.M., and Yamashiro, S.M. An Evaluation of the Veterans Administration Housebound and Aid and Attendant Allowance Program. Prepared for the Office of the Assistant Secretary for Policy and Evaluation, U.S. Department of Health and Human Services. Washington, DC: Project HOPE, 1987. Available at [http://aspe.hhs.gov/daltcp/reports/vahbapes.htm].
Harrington, Charlene, and Martin Kitchener. "Medicaid Long-Term Care: Changes, Innovations, and Cost Containment." San Francisco, CA: University of California, San Francisco, July 2003. Available at [http://www.ncsl.org/programs/health/harrington]. Accessed March 18, 2004.
Krahn, Gloria L., Debra Eisert, and Bryce Fifield. "Obtaining Parental Perceptions of the Quality of Services for Children with Special Health Needs." Journal of Pediatric Psychology, vol. 15, no. 6, 1990, pp. 761-74.
Mahoney, Kevin J., Kristin Simone, and Lori Simon-Rusinowitz. "Early Lessons from the Cash and Counseling Demonstration and Evaluation." Generations, vol. 20, no. 3, fall 2000, pp. 41-46.
Miltenburg, Theo, Clarie Ramakers, and Jos Mensink. A Personal Budget for Clients: Summary of an Experiment with Cash Benefits in Home Care in the Netherlands. Nijemen, Netherlands: Institute for Applied Social Sciences, 1996.
Osterle, A. "Attendance Allowance Programs and the Socio-Economic Situation of Informal Caregivers: Empirical Results from Austria." Paper presented at the 6th Annual International Conference on Socio-Economics, Paris, July 1994.
Phillips, Barbara, and Barbara Schneider. "Changing to Consumer-Directed Care: The Implementation of the Cash and Counseling Demonstration in Florida." Princeton, NJ: Mathematica Policy Research, Inc., February 2004. Available at [http://aspe.hhs.gov/daltcp/reports/FLchange.htm].
Shaughnessy, Peter, Kathryn S. Crisler, Robert E. Schlenker, Angela G. Arnold, Andrew M. Kramer, Martha C. Powell, and David F. Little. "Measuring and Assuring the Quality of Home Health Care." Health Care Financing Review, vol. 16, no. 1, fall 1994, pp. 35-68.
Simon-Rusinowitz, Lori, Kevin J. Mahoney, and A.E. Benjamin. "Payments to Families Who Provide Care: An Option That Should Be Available." Generations, vol. 22, no. 3, fall 1998, pp. 69-75.
Sloper, Patricia, and Stephen Turner. "Service Needs of Families of Children with Severe Disability." Child Care, Health and Development, no. 18, 1992, pp. 259-82.
Velgouse, Linda, and Virginia Dize. "A Review of State Initiatives in Consumer-Directed Long-Term Care." Generations, vol. 24, no. 3, fall 2000, pp. 28-33.
Woodill, Gary, Rebecca Renwick, Ivan Brown, and Dennis Raphael. "Being, Belonging, Becoming: An Approach to the Quality of Life of Persons with Developmental Disabilities." In Quality of Life for Persons with Disabilities: International Perspectives and Issues, edited by David Goode. Cambridge, MA: Brookline Books, Inc., 1994.
Zacharias, B. Lee. "Consumer Directed Care: Report on Florida Post-Survey Focus Groups." Submitted to the National Program Office of the Cash and Counseling Demonstration and Evaluation, University of Maryland Center on Aging, fall 1998.
APPENDIX A. WAIVER BENEFITS
Florida's DS waiver program, which serves adults and children who have developmental disabilities, covers the benefits listed in Table A.1. Florida's regular Medicaid program also covers some of these services, such as physical and occupational therapy, but in limited amounts. Thus, the waiver program allows covered adults and children to obtain services beyond Medicaid's traditional limits.
| TABLE A.1. Benefits Covered by Florida's Developmental Services Waiver | ||
| Adult day training | Personal care assistance | Special medical equipment and supplies |
| Adult dental | Personal emergency response systems | Special medical home care |
| Behavioral services | Physical therapy | Speech therapy |
| Chore services | Private duty nursing | Specialized mental health services |
| Companion services | Psychological services | Support coordination |
| Dietitian | Respiratory therapy | Supported employment |
| Environmental modifications | Residential habilitation | Supported living coaching |
| Homemaker | Residential nursing | Therapeutic massage |
| In-home supports | Respite | Transportation |
| Non-residential support services | Skilled nursing services | |
| Occupational therapy | ||
| SOURCE: Florida Medicaid Program 2003. | ||
APPENDIX B. ADDITIONAL INFORMATION ON METHODS
Baseline Characteristics Controlled for in the Analysis
The models used to estimate program impacts controlled for baseline measures of children's demographic characteristics, health and functioning, use of PCS, unmet needs, and the timing of their enrollment in the demonstration (Table B.1). The models also control for several baseline characteristics of children's parents, including their level of education, satisfaction with the child's care and quality of life, reasons for enrolling the child in the demonstration, and work and supervisory experience. When sample members were missing data on one or two control variables, we imputed the sample mean of the missing variable(s) to keep the case in the analysis.
Outcome Measures and Reference Periods
Table B.2 presents a complete list of the service-use and quality outcomes examined for this analysis. As noted in the table, the questions in our survey instrument referred to a variety of periods, including the day of the interview (the "present"), the most recent two weeks the sample member was living at home (as opposed to being in a hospital, nursing home, or long-term care facility), the past month, and the entire nine months since random assignment. For example, we asked about parents' present satisfaction with their child's overall care arrangements, unmet needs, quality of life, and health status because that is what they could report most accurately. We used the two-week reference period for questions about daily activities or events (such as satisfaction with the way paid caregivers provided specific types of assistance) because the interview day may have been atypical and the use of a two-week reference period should not have led to serious recall problems. When we asked about less frequent activities or events, we extended the reference period accordingly. For example, we asked if falls or other accidents occurred in the past month. Finally, we used the nine-month reference period for questions about paid caregivers' attitudes and their relationships with sample members so that we would be measuring long-term tendencies rather than isolated disagreements or vagaries of mood.
Interviewing Considerations
Most of the survey questions used in the analysis of care quality called for one-word replies (such as yes/no, very/somewhat, always/sometimes/rarely/never) that would not reveal the content of the question to third parties who may have had personal interests in the response. Although we suggested in advance letters and during interviews that we preferred that parents be alone during interviews, we assumed some interviews would be conducted within hearing range of paid caregivers. We were particularly concerned that this would be the case in treatment group households, which presumably would be more likely than control group households to include live-in paid caregivers. By eliciting one-word, nonrevelatory responses, we ensured that the parents of treatment and control group members would be equally likely to give candid responses to questions about satisfaction and unmet needs, thus reducing a potential source of bias in impact estimates.
Sample Restrictions
As noted in the body of the report, many of the survey questions used in the analysis of care quality were posed only to subsets of respondents, either because the situations addressed by certain questions did not apply to some sample members (for example, those without paid caregivers), or because certain respondents had vested interests in the replies (for example, respondents who were paid caregivers might not assess their own performance objectively). Table B.3 shows the sample sizes that result from such restrictions and identifies the sections of the analysis to which they apply.
Statistical Power
With 859 children in the analysis sample, we had 80 percent power to detect impacts of the sizes listed in Table B.4 for binary outcome variables with a mean of 10 to 90 percent, assuming two-tailed tests at the .05 significance level.
| TABLE B.1. Baseline Characteristics of Children and Their Parents, by Evaluation Status(Percentages, Unless Otherwise Noted) | ||
| Characteristic | Treatment Group | Control Group |
| Children's Demographic Characteristics | ||
| YOUNGER THAN 12 YEARS OLD | 63.3 | 63.4 |
| MALE | 61.5 | 64.8 |
| OF HISPANIC ANCESTRY | 17.3 | 18.7 |
| RACE | ||
| White | 81.4 | 82.3 |
| Black | 13.7 | 13.5 |
| Other | 4.9 | 4.2 |
| PARENTS DESCRIBED AREA OF RESIDENCE AS: | ** | |
| Rural | 17.1 | 20.8 |
| Not rural but high-crime or lacking adequate public transportation | 32.9 | 37.7 |
| Not rural, not high-crime, with adequate public transportation | 50.0 | 41.5 |
| PARENT ATTENDED AT LEAST SOME COLLEGE | 69.0 | 67.2 |
| Children's Health and Functioning | ||
| RELATIVE HEALTH STATUS | ||
| Excellent or good | 58.8 | 58.6 |
| Fair | 28.9 | 25.6 |
| Poor | 12.3 | 15.8 |
| COMPARED TO LAST YEAR: | ||
| Health is worse | 10.0 | 9.4 |
| Is less physically active | 15.4 | 12.7 |
| NEXT YEAR PARENT EXPECTS CHILD'S HEALTH TO: | ||
| Improve | 32.2 | 34.2 |
| Stay the same | 56.0 | 55.7 |
| Decline | 5.9 | 3.8 |
| Doesn't know | 5.9 | 6.2 |
| NOT INDEPENDENT IN PAST WEEK IN:a | ||
| Getting in or out of bed | 59.2 | 62.5 |
| Bathing | 92.7 | 92.6 |
| Using toilet (or uses diapers) | 84.6 | 86.8 |
| Children's Use of Personal Care Services | ||
| USED SPECIAL TRANSPORTATION SERVICES IN PAST YEAR | 65.0 | 62.2 |
| MODIFIED HOME OR VEHICLE IN PAST YEAR | 60.3 | 60.2 |
| ASSISTIVE OR SECURITY EQUIPMENT WAS PURCHASED FOR CHILD IN PAST YEAR | 63.5 | 56.5** |
| NUMBER OF UNPAID CAREGIVERS WHO PROVIDED HELP IN PAST WEEK | ||
| 1 | 11.3 | 11.0 |
| 2 | 26.5 | 20.3 |
| 3 or more | 62.1 | 68.7 |
| PRIMARY UNPAID CAREGIVER IS A PARNET | 89.3 | 89.5 |
| PRIMARY UNPAID CAREGIVER IS EMPLOYED | 48.8 | 49.0 |
| NUMBER OF PAID CAREGIVERS IN PAST WEEK | ||
| 0 | 37.6 | 35.2 |
| 1 | 27.4 | 25.4 |
| 2 | 17.2 | 19.6 |
| 3 or more | 17.7 | 19.9 |
| ALLOWANCE IF ASSIGNED TO TREATMENT GROUP (mean dollars per week) | 266 | 272 |
| IN PAST WEEK, RECEIVED PCS FROM: | ||
| Publicly Funded Caregivers | 52.8 | 53.2 |
| Privately Funded Caregivers | 23.8 | 30.1** |
| HAD LIVE-IN PAID CAREGIVERb | 2.7 | 3.6 |
| ENROLLED IN WAIVER PROGRAM FOR FEWER THAN 6 MONTHS | 39.9 | 39.5 |
| Parents' Satisfaction with Paid Care | ||
| HOW SATISFIED WITH THE WAY PAID CAREGIVER HELPED WITH PERSONAL CARE, DOING THINGS AROUND THE HOUSE, ROUTINE HEALTH CARE | ||
| Very satisfied | 29.3 | 34.4 |
| Satisfied | 17.6 | 14.8 |
| Dissatisfied | 9.2 | 8.9 |
| No paid help with these activities in past week | 43.9 | 41.9 |
| HOW SATISFIED WITH TIME OF DAY PAID WORKER HELPED | ||
| Very satisfied | 21.0 | 22.8 |
| Satisfied | 19.8 | 21.8 |
| Dissatisfied | 14.1 | 12.7 |
| No paid help in past week | 45.1 | 42.7 |
| HOW DIFFICULT TO CHANGE PAID CAREGIVER'S SCHEDULE | ||
| Very difficult | 22.1 | 24.9 |
| Somewhat difficult | 24.4 | 24.0 |
| Not at all difficult | 8.2 | 8.4 |
| No paid help in past week | 45.2 | 42.7 |
| HOW SATISFIED WITH OVERALL CARE ARRANGEMENTS | ||
| Very satisfied | 17.7 | 17.2 |
| Satisfied | 39.7 | 44.1 |
| Dissatisfied | 39.7 | 35.6 |
| No paid services or goods in past week | 3.0 | 3.1 |
| Parents' Perception of Unmet Needs for Personal Assistance | ||
| CHILD IS NOT GETTING ENOUGH HELP WITH: | ||
| Doing things around the house | 77.5 | 73.1 |
| Personal care | 66.6 | 66.3 |
| Transportation | 47.5 | 46.5 |
| Parents' Satisfaction with Children's Quality of Life | ||
| HOW SATISFIED WITH WAY SPENDING LIFE | ||
| Very satisfied | 17.6 | 19.7 |
| Satisfied | 43.4 | 47.1 |
| Dissatisfied | 38.8 | 33.2 |
| Proxy respondent-question not asked | 0.2 | 0.0 |
| Parents' Attitude Toward Consumer Directed Care | ||
| BEING ALLOWED TO PAY FAMILY MEMBERS OR FRIENDS WAS VERY IMPORTANT | 69.2 | 71.8 |
| HAVING A CHOICE ABOUT PAID WORKERS' SCHEDULE WAS VERY IMPORTANT | 92.1 | 91.9 |
| HAVING A CHOICE ABOUT TYPES OF SERVICES RECEIVED WAS VERY IMPORTANT | 97.7 | 98.3 |
| PRIMARY INFORMAL CAREGIVER EXPRESSED INTEREST IN BEING PAID | 23.7 | 23.1 |
| Work Experience and Community Activities | ||
| PARENT EVER SUPERVISED SOMEONE | 76.8 | 77.5 |
| PARENT EVER HIRED SOMEONE PRIVATELY | 75.1 | 76.8 |
| PARENT EVER WORKED FOR PAYb | 98.6 | 98.6 |
| CHILD ATTENDED RECREATIONAL PROGRAMS IN PAST YEAR | 48.3 | 46.7 |
| CHILD ATTENDED DAY CARE IN PAST YEAR | 24.9 | 20.1* |
| Enrollment Monthc | ||
| WAS BETWEEN: | ||
| June 2000 and May 2001 | 74.4 | 75.1 |
| June 2001 and July 2002 | 25.6 | 24.9 |
| SAMPLE SIZE | 441 | 418 |
SOURCE: MPR's baseline evaluation interview, conducted between June 2000 and August 2001, and the CDC Program. * Difference between treatment and control groups significantly different from 0 at the .10 level, two-tailed test. ** Difference between treatment and control groups significantly different from 0 at the .05 level, two-tailed test. PCS = Personal care services; includes help with personal care, routine health care, doing things around the house, and transportation.
| ||
| TABLE B.2. Outcome Measures Used in the Analysis, by Type | |||
Service Use In past two weeks:
In past nine months, whether met personal care needs by:
| Parent's Satisfaction with Paid Caregiver Performancea Whether paid caregiver ever failed to complete tasks in past nine months How often paid caregiver arrived late or left early in past nine months Whether visiting paid caregiver did not come as scheduled in past two weeks How satisfied with times of day paid caregiver came in past two weeks How difficult to change paid caregiver's schedule in past two weeks | Parent's Satisfaction with Paid Caregiver Relationship and Attitudea How satisfied with relationship between child and paid caregiver in past two weeks During past nine months, paid caregiver:
| Parent's Satisfaction with Child's Carea How satisfied with overall care arrangements How satisfied with ability to get help with transportation when needed How satisfied with the way paid caregiver helped child with personal care in past two weeks How satisfied with the way paid caregiver helped child do things around the house in past two weeks How satisfied with the way paid caregiver helped child with routine health care in past two weeks |
Unmet Needs for Personal Assistanceb Whether child needed help but wasn't getting it or needed more help with:
Whether child needed care supplies but was not getting them or needed more supplies | Adverse Eventsc In past month, child:
| Health Outcomesc In past month, child had:
| General Health Statusc Child's current health is poor relative to that of peers Child was hospitalized in past two months |
| Parent's Care Knowledge and Adherence to Medication Routines Whether parent knows enough about child's chronic conditions to care for them, if child has chronic conditions Whether child missed a dose of prescribed medication in past week, among regular users | Functioningc How difficult for child to bathe without help in past two weeks How difficult for child to get in or out of bed without help in past two weeks How difficult for child to use toilet without help in past two weeks Whether health problems or lack of assistance limit child's recreational, cultural, religious or social activities | Parent's Satisfaction with Child's Lifed How satisfied with way child is spending life these days | |
NOTE: If a child had multiple paid caregivers, we asked parents about their satisfaction with them as a group, rather than as individuals. PCS = Personal care services; includes help with personal care, routine health care, doing things around the house, and transportation.
| |||
| TABLE B.3. Samples Used in the Analysis | |||
| Sample | Sample Size | Used in theAnalysis of: | |
| Treatment Group | Control Group | ||
| A. FULL SAMPLE | 441 | 418 | |
| B. FULL SAMPLE MINUS: | |||
| Sample members without paid help in two-week reference perioda | -89 | -145 | Satisfaction with paid caregiversb |
| Respondents who were paid caregivers | -63 | -0 | |
| SAMPLE SIZE | 289 | 273 | |
| C. FULL SAMPLE MINUS: | |||
| Respondents who were paid caregivers | -63 | -0 | Satisfaction with overall care arrangements and perception of unmet needs |
| SAMPLE SIZE | 378 | 418 | |
| D. FULL SAMPLE MINUS: | |||
| Respondents who were paid caregivers | -63 | -0 | Satisfaction with life |
| Deceased sample members | -2 | -0 | |
| SAMPLE SIZE | 376 | 481 | |
| E. FULL SAMPLE MINUS: | |||
| Deceased sample members | -2 | -0 | Adverse events, health problems, general health status, and care knowledge |
| SAMPLE SIZE | 439 | 418 | |
| |||
| TABLE B.4. Minimum Detectable Effects | |
| Binary Variable Mean | Detectable Effects (Percentage Points) |
| .50 | 8.5 |
| .30 or .70 | 7.8 |
| .10 or .90 | 5.1 |
APPENDIX C. ADDITIONAL RESULTS
This appendix presents (1) treatment-control comparisons for additional service-use and care quality outcomes, (2) the results of subgroup analyses not presented in the body of the report, and (3) the results of sensitivity tests. The results generally reinforce our main findings and our interpretation of them. For this reason, the appendix consists mostly of tables, with noteworthy findings summarized in the text.
Measures of Service Use
Types of Care Received
By most measures, CDC did not seem to affect the likelihood that children received paid or unpaid assistance with the types of PCS we asked about (Table C.1). The absence of a greater number of effects may simply reflect the fact that, regardless of whether they were managing their child's waiver benefits, parents helped children with these basic activities if help was needed. It is possible that children received more assistance with PCS under CDC than they would have under the traditional waiver program, but our measures capture only whether a child received any such services.
The few statistically significant treatment control differences that we did observe may have been anomalous or driven by reporting error. For example, within the subgroup of children who were receiving PCS from publicly funded caregivers at baseline, 98 percent of children in the treatment group, compared with 94 percent of children in the control group, received assistance with bathing. This result is probably a statistical anomaly, because children who needed help bathing presumably would have received it at some point during our reference period. Similarly, within the subgroup of children who were not receiving PCS from publicly funded caregivers at baseline, treatment group parents were more likely than control group parents to say their child received help taking medicine and with other routine health care tasks. Parents who were the sole providers of their child's help with routine health care may have underreported their child's use of such help, because it was not provided by other caregivers. Control group parents, whose children were less likely to have paid assistance from visiting caregivers, may have been more likely than others to make this type of reporting error, which could account for the statistically significant difference we observed.
Distributions of Paid and Unpaid Hours of Care
In keeping with our findings on children's mean hours of PCS (Table 3), larger proportions of children in the treatment group than in the control group received very high levels of paid care (measured in categorical increments), and smaller proportions received very high levels of unpaid care (Table C.2). The distributions also demonstrate that treatment-control differences in mean hours of service use were not driven by a small number of "outliers."
Purchasing Goods and Modifications
As noted in the body of the report, CDC did not seem to affect the likelihood that parents purchased supplies, equipment or equipment repairs, or environmental modifications to meet their child's personal care needs. Because the treatment and control groups looked alike on all other outcomes related to goods and modifications, the single statistically significant difference we did find appears to be an anomaly (Table C.3). (In the subgroup of children receiving PCS from publicly funded caregivers at baseline, 23 percent of treatment group parents, and 33 percent of control group parents, reported repairing equipment since their child's enrollment in the demonstration.)
Measures of Care Quality
Indicators Measured at Baseline and Nine Months
We used data from our two evaluation surveys to compare the treatment and control groups' respective quality indicators at baseline and nine months. As noted in the body of the report, the level of dissatisfaction in the control group changed only slightly from baseline to followup for two key quality indicators parents' satisfaction with their child's overall care arrangements and with their quality of life (Table C.4). By contrast, dissatisfaction in the treatment group dropped precipitously, for both outcomes.
Satisfaction With Paid Caregivers' Performance and Transportation Assistance
For brevity's sake we did not include all the results of our quality analysis in the body of the report, and those we omitted provide further evidence that treatment group families benefited from CDC. For example, compared with control group parents, treatment group parents were significantly more likely to be very satisfied with the way their child's paid caregivers helped with the three types of activities we asked about: personal care, doing things around the house, and routine health care (Table C.5). And, although Florida's traditional waiver program covers special transportation services, treatment group parents were more likely to be very satisfied, and less likely to be dissatisfied, with their ability to obtain such services for their child when needed.
Parents' Care Knowledge and Children's Functioning
Compared with control group parents, treatment group parents were less likely to say they did not know enough about their child's chronic conditions to properly care for them, and they were less likely to report that their child had missed a dose of prescribed medication in the past week (Table C.6). CDC did not seem to affect children's ability to perform activities of daily living without help from others.
Subgroup Effects
With respect to key service use and quality outcomes, CDC affected the subgroups we examined in much the way it affected the overall sample. In all the subgroups we examined, treatment group children were more likely than control group children to have received PCS from someone who was paid to help them, and treatment group parents were more likely to be very satisfied with key aspects of their child's care. A few of the differences in impacts between subgroups were statistically significant from each other (for example, the program seemed to have a larger impact on the overall satisfaction of parents of younger children than it did on other parents), but most of these seem to be isolated differences, and do not seem to reveal meaningful patterns. Noteworthy results are highlighted below, by subgroup.
Whether Received PCS from Publicly Funded Caregivers at Baseline
Regardless of whether children received PCS from publicly funded caregivers at baseline, treatment control differences for key quality outcomes were large and consistently favored the treatment group (Table C.7). None of the differences in impacts between subgroups were significantly different from each other. Service use results for these two subgroups are presented in the body of the report (and in Table C.1, Table C.2 and Table C.3).
Whether Younger than 12 Years of Age at Baseline
As noted, treatment group children in both age groups were more likely than their control group counterparts to have received PCS from paid caregivers (Table C.8). Regardless of age group, treatment group children also seemed to enjoy better quality related outcomes, although impacts were significantly larger for one group than they were for the other in two instances (Table C.9). (Program effects on parents' overall satisfaction and reports of unmet needs for personal care were larger for parents of younger children than they were for parents of older children.)
Whether Had Unmet Needs for Personal Care at Baseline
Within the subgroup of children who had unmet needs for personal care at baseline, those in the treatment group were, again, more likely than those in the control group to have received PCS from paid caregivers at followup (Table C.10). Interestingly, these treatment group children also received fewer hours of assistance than their control group counterparts, which seems to underscore the argument, made in the body of this report, that treatment group parents made efficient use of caregivers. With regard to quality outcomes, it is notable that, within the subgroup of children who had unmet needs for personal care at baseline, those in the treatment group were 15 points less likely than those in the control group to have the same unmet need at followup (Table C.11).
Whether Eligible for a Relatively Generous Allowance if Assigned to the Treatment Group
The dollar amount of children's monthly allowances (which were calculated for all children prior to their random assignment) is an indication both of parents' potential "purchasing power" under CDC, and of children's need for services and other benefits. In comparing subgroups of children by whether their allowances were above or below the median allowance for the sample, we found that program effects on whether children received PCS from paid caregivers at followup, and on whether they received assistance with routine health care tasks, were greater for the subgroup of children with relatively generous allowances than it was for other children (Table C.12). Moreover, program effects on parents' satisfaction with their child's overall care arrangements and quality of life were larger for children with relatively generous allowances than they were for other children (Table C.13). A possible explanation for the service use findings is simply that children with less generous allowances had less need for caregiver assistance and help with routine health care. However, the differences in subgroup impacts for the two satisfaction measures may suggest that larger allowances give parents more flexibility in their purchasing plans, which in turn bettered their satisfaction.
Sensitivity Tests
Table C.14 presents the results of a sensitivity test used to assess the effects of disenrollment on our impact estimates for quality related outcomes. Table C.15 compares impact estimates for key quality outcomes when we used logit models that did, and did not, control for ratios of actual-to-expected waiver costs. The results for both tables are discussed in the body of the report.
| TABLE C.1. Estimated Effects of Consumer Directed Care on Types of Assistance, by Whether Received PCS From Publicly Funded Caregivers at Baseline | ||||||
| Outcome | Did Not Receive PCS fromPublicly Funded Caregivers at Baseline(n = 403) | Received PCS from PubliclyFunded Caregivers at Baseline(n = 456) | ||||
| Predicted Treatment GroupMean(Percent) | Predicted ControlGroupMean(Percent) | Estimated Effect(p-Value) | Predicted Treatment GroupMean(Percent) | Predicted ControlGroupMean(Percent) | Estimated Effect(p-Value) | |
| ANY PAID OR UNPAID ASSISTANCE WITH: | ||||||
| Bathing | 93.1 | 90.8 | 2.4(.180) | 98.2 | 93.8 | 4.3**(.035) |
| Eating | 87.6 | 88.1 | -0.5(.364) | 89.2 | 89.8 | -0.5(.436) |
| Taking medicine | 81.8 | 74.1 | 7.7*(.057) | 75.0 | 78.3 | -3.3(.421) |
| Other routine health care | 77.2 | 66.6 | 10.6***(.010) | 78.9 | 75.8 | 3.1(.436) |
| Using the toilet | 71.6 | 70.0 | 1.6(.713) | 67.0 | 67.0 | 0.0(.999) |
| Getting in and out of bed | 70.9 | 68.4 | 2.5(.536) | 70.5 | 67.2 | 3.4(.415) |
| SOURCE: MPR's baseline interview, conducted between June 2000 and August 2001, and nine-month interview, conducted between April 2001 and July 2002. NOTE: Means were predicted with logit models. *Significantly different from zero at the .10 level, two-tailed test. **Significantly different from zero at the .05 level, two-tailed test. ***Significantly different from zero at the .01 level, two-tailed test. Estimated effects for the two subgroups were significantly different from each other at the .05 level. PCS = Personal care services; includes help with personal care, routine health care, doing things around the house, and transportation. | ||||||
| TABLE C.2. Distribution of Care Hours, by Whether Received PCS From Publicly Funded Caregivers at Baseline(Percentages) | ||||||
| Outcome | Did Not Receive PCS fromPublicly Funded Caregivers atBaseline(n = 395) | Received PCS from PubliclyFunded Caregivers at Baseline(n = 451) | ||||
| Treatment Group | Control Group | Difference (p-Value) | Treatment Group | Control Group | Difference (p-Value) | |
| In Recent Two Weeks: | ||||||
| HOURS OF PAID AND UNPAID ASSISTANCE | ||||||
| Fewer than 112 | 13.7 | 17.5 | -3.8(.495) | 9.1 | 2.3 | 6.8(.009) |
| 112 to 167 | 18.3 | 19.6 | -1.3 | 15.1 | 18.2 | -3.1 |
| 168 to 223 | 23.9 | 19.6 | 4.3 | 22.8 | 16.4 | 6.4 |
| 224 to 336 | 33.5 | 29.1 | 4.4 | 31.5 | 36.9 | -5.4 |
| More than 336a | 10.7 | 14.3 | -3.6 | 21.5 | 26.2 | -4.7 |
| HOURS OF UNPAID ASSISTANCE | ||||||
| Fewer than 112 | 21.8 | 18.5 | 3.3(.762) | 22.4 | 12.2 | 10.2(.009) |
| 112 to 167 | 20.3 | 20.6 | -0.3 | 21.0 | 23.4 | -2.4 |
| 168 to 223 | 23.4 | 22.2 | 1.2 | 19.6 | 19.6 | 0.0 |
| 224 to 336 | 26.9 | 27.5 | -0.6 | 26.9 | 25.2 | 1.7 |
| More than 336a | 7.6 | 11.1 | -3.5 | 10.1 | 19.6 | -9.5 |
| HOURS OF PAID ASSISTANCE, IF ANY | ||||||
| 1 to 27 | 51.2 | 67.1 | -15.9(.148) | 27.5 | 30.8 | -3.3(.609) |
| 28 to 55 | 30.2 | 22.0 | 8.2 | 29.0 | 30.8 | -1.8 |
| 56 to 79 | 10.1 | 6.1 | 4.0 | 15.0 | 15.9 | -0.9 |
| 80 or more | 8.5 | 4.9 | 3.6 | 28.5 | 22.5 | 6.0 |
SOURCE: MPR's baseline interview, conducted between June 2000 and August 2001, and nine-month interview, conducted between April 2001 and July 2002. NOTE: Table includes only those sample members who had complete data for each component of total hours. PCS = Personal care services; includes help with personal care, routine health care, doing things around the house, and transportation.
| ||||||
| TABLE C.3. Estimated Effects of Consumer Directed Care on Purchasing Goods and Modifications, by Whether Received PCS From Publicly Funded Caregivers at Baseline | ||||||
| Outcome | Did Not Receive PCS fromPublicly Funded Caregivers at Baseline(n = 403) | Received PCS from PubliclyFunded Caregivers at Baseline(n = 456) | ||||
| Predicted Treatment GroupMean (Percent) | Predicted ControlGroupMean (Percent) | Estimated Effect(p-Value) | Predicted Treatment GroupMean (Percent) | Predicted ControlGroupMean (Percent) | Estimated Effect(p-Value) | |
| SINCE ENROLLMENT: | ||||||
| Purchased suppliesa | 69.8 | 68.4 | 1.3(.734) | 65.3 | 70.4 | -5.1(.243) |
| Purchased equipmenta | 45.4 | 43.9 | 1.6(.756) | 50.5 | 53.2 | -2.7(.566) |
| Modified homea | 30.9 | 30.1 | 0.8(.925) | 27.3 | 32.7 | -5.4(.168) |
| Repaired equipment | 26.4 | 33.8 | -7.5(.120) | 22.6 | 32.5 | -9.8**(.021) |
| Modified car or van | 11.5 | 13.1 | -1.6(.592) | 10.6 | 8.1 | 2.5(.407) |
| Did any of the above | 85.6 | 84.6 | 1.0(.741) | 87.2 | 82.5 | 4.7(.175) |
SOURCE: MPR's baseline interview, conducted between June 2000 and August 2001, and nine-month interview, conducted between April 2001 and July 2002. NOTE: Means were predicted with logit models. **Significantly different from zero at the .05 level, two-tailed test. PCS = Personal care services; includes help with personal care, routine health care, doing things around the house, and transportation.
| ||||||
| TABLE C.4. Quality Indicators Measured at Baseline and Nine Months, by Evaluation Status(Percentages) | ||||
| Indicator | Baseline | Nine Months | ||
| Treatment Group | Control Group | Treatment Group | Control Group | |
| HOW SATISFIED WITH TIMES OF DAY PAID CAREGIVERS HELPED | ||||
| Very satisfied | 38.2 | 39.8 | 85.1 | 64.3 |
| Dissatisfied | 25.7 | 22.2 | 3.5 | 10.7 |
| HOW SATISFIED WITH OVERALL CARE ARRANGEMENTS | ||||
| Very satisfied | 18.2 | 17.8 | 55.9 | 27.2 |
| Dissatisfied | 40.9 | 36.8 | 15.9 | 34.2 |
| AREA OF RESIDENCE IS: | ||||
| Personal care | 66.6 | 66.3 | 32.4 | 45.0 |
| Household activities | 77.5 | 73.1 | 38.3 | 54.6 |
| Transportation | 47.5 | 46.5 | 28.2 | 37.0 |
| IN POOR HEALTH RELATIVE TO PEERS | 12.3 | 15.8 | 12.4 | 12.8 |
| HOW SATISFIED WITH THE WAY SPENDING LIFE | ||||
| Very satisfied | 17.6 | 19.7 | 50.8 | 29.2 |
| Dissatisfied | 38.9 | 33.2 | 13.8 | 29.7 |
| SOURCE: MPR's baseline interview, conducted between June 2000 and August 2001, and nine-month interview, conducted between April 2001 and July 2002. NOTE: Baseline means for satisfaction measures were calculated only for sample members who met certain criteria (for example, received paid assistance in the past week); thus they differ from the means presented in Table B.1, which were calculated over all sample members. The nine-month means presented in this table are not adjusted for baseline characteristics; thus, they differ slightly from the predicted means presented in Tables 4 through 8. The purpose of this table is to compare the treatment and control groups' respective measures at baseline and at followup, rather than to compare differences between the groups at each interval. For this reason, we did not test the significance of treatment-control differences, as we do elsewhere in the report. | ||||
| TABLE C.5. Estimated Effects of Consumer Directed Care on Parents' Satisfaction with Paid Caregiver Performance and Transportation Assistance | |||
| Outcome | Predicted Treatment Group Mean(Percent) | Predicted Control Group Mean(Percent) | Estimated Effect(p-Value) |
| HOW SATISFIED WITH THE WAY PAID CAREGIVERS HELPED WITH PERSONAL CARE IN RECENT TWO WEEKS (n = 530) | |||
| Very satisfied | 88.3 | 74.9 | 13.4***(.000) |
| Dissatisfieda | 1.4 | 9.4 | -8.0***(.004) |
| HOW SATISFIED WITH THE WAY PAID CAREGIVERS HELPED AROUND THE HOUSE/COMMUNITY IN RECENT TWO WEEKS (n = 507) | |||
| Very satisfied | 85.3 | 73.1 | 12.3***(.001) |
| Dissatisfieda | 0.0 | 6.8 | -6.8***(.000) |
| HOW SATISFIED WITH THE WAY PAID CAREGIVERS HELPED WITH ROUTINE HEALTH CARE IN RECENT TWO WEEKS (n = 406) | |||
| Very satisfied | 95.3 | 81.0 | 14.3***(.000) |
| Dissatisfieda | 1.0 | 3.1 | -2.1(.134) |
| HOW SATISFIED WITH ABILITY TO GET HELP WITH TRANSPORTATION WHEN NEEDED (n = 609) | |||
| Very satisfied | 56.4 | 43.6 | 12.8***(.001) |
| Dissatisfied | 20.1 | 31.8 | -11.6***(.001) |
SOURCE: MPR's nine-month interview, conducted between March 2001 and July 2002. NOTE: Means were predicted with logit models, unless otherwise noted. ***Significantly different from zero at the .01 level, two-tailed test.
| |||
| TABLE C.6. Estimated Effects of Consumer Directed Care on Parents' Care Knowledge and Children's Functioning | |||
| Outcome | Predicted Treatment Group Mean (Percent) | Predicted ControlGroup Mean(Percent) | Estimated Effect(p-Value) |
| CARE KNOWLEDGE AND MEDICATION ADHERENCE | |||
| Among Children with a Chronic Condition, Parent Does Not Feel Knowledgeable Enough to Care for Condition (n = 698) | 1.7 | 7.4 | -5.7***(.001) |
| Among Children Taking Prescribed Medicines, Parent Reported at Least One Missed Dose in Past Week (n = 630) | 11.9 | 18.3 | -6.4**(.026) |
| FUNCTIONING | |||
| Performing Activity Without Help Would Have Been Very Difficult or Impossible for Child in Past Two Weeks: (n = 820) | |||
| Bathing | 8.05 | 80.1 | 0.5(.853) |
| Getting in or out of bed | 36.8 | 38.0 | -1.2(.680) |
| Using the toilet | 53.1 | 52.1 | 1.0(.728) |
| Health Problems or Lack of Assistance Currently Limit Child's Recreational, Social, or Cultural Pursuits (n = 779) | 68.0 | 72.8 | -4.8(.134) |
| SOURCE: MPR's nine-month interview, conducted between April 2001 and July 2002. NOTE: Means were predicted with logit models. **Significantly different from zero at the .05 level, two-tailed test. ***Significantly different from zero at the .01 level, two-tailed test. | |||
| TABLE C.7. Estimated Effects of Consumer Directed Care on Key Quality Outcomes, by Whether Received PCS From Publicly Funded Caregivers at Baseline | ||||||
| Outcome | Did Not Receive PCS from PubliclyFunded Caregivers at Baseline | Received PCS from Publicly FundedCaregivers at Baseline | ||||
| Predicted Treatment GroupMean(Percent) | Predicted ControlGroupMean(Percent) | Estimated Effect(p-Value) | Predicted Treatment GroupMean(Percent) | Predicted ControlGroupMean(Percent) | Estimated Effect(p-Value) | |
| PARENT VERY SATISFIED WITH: | ||||||
| Paid caregivers' schedule in past two weeks | 89.5 | 71.5 | 18.0***(.001) | 84.4 | 61.2 | 23.2***(.000) |
| Overall care arrangements | 61.2 | 27.4 | 33.8***(.000) | 52.1 | 26.4 | 25.7***(.000) |
| Child's relationship with paid caregivers | 96.7 | 84.5 | 12.2***(.004) | 95.4 | 78.4 | 17.1***(.000) |
| The way child is spending life | 58.2 | 28.5 | 29.7***(.000) | 46.1 | 28.8 | 17.4***(.000) |
| CHILD NOT GETTING ENOUGH HELP WITH PERSONAL CARE | 35.1 | 47.5 | -12.4**(.021) | 31.1 | 42.8 | -11.7**(.020) |
| SOURCE: MPR's baseline interview, conducted between June 2000 and August 2001, and nine-month interview, conducted between April 2001 and July 2002. NOTE: Sample sizes vary from measure to measure (from 562 to 796) because some questions were posed only if sample members met certain criteria and because of item nonresponse. In the largest sample used, 416 children received publicly funded assistance from caregivers at baseline, and 380 did not. **Significantly different from zero at the .05 level, two-tailed test. ***Significantly different from zero at the .01 level, two-tailed test. Estimated effects for the two subgroups were significantly different from each other at the .10 level, two-tailed test. PCS = Personal care services; includes help with personal care, routine health care, doing things around the house, and transportation. | ||||||
| TABLE C.8. Estimated Effects of Consumer Directed Care on Key Service-Use Outcomes, by Age at Baseline | ||||||
| Outcome | Younger than Twelve at Baseline(n = 544) | Twelve or Older at Baseline(n = 315) | ||||
| Predicted Treatment GroupMean | Predicted ControlGroupMean | Estimated Effect(p-Value) | Predicted Treatment GroupMean | Predicted ControlGroupMean | Estimated Effect(p-Value) | |
| IN RECENT TWO WEEKS: | ||||||
| Received PCS from paid caregivers (percent) | 81.2 | 66.0 | 15.2***(.000) | 77.7 | 63.7 | 14.0***(.003) |
| Hours of paid and unpaid assistance | 234.5 | 252.7 | -18.2*(.067) | 241.7 | 236.9 | 4.8(.713) |
| Received any routine health care assistance (percent) | 80.1 | 70.0 | 10.1***(.006) | 74.3 | 72.9 | 1.4(.853) |
| SINCE ENROLLMENT: | ||||||
| Modified home or vehicle, purchased supplies, or purchased or repaired equipment | 87.8 | 84.7 | 3.2(.226) | 84.0 | 82.2 | 1.8(.595) |
| SOURCE: MPR's baseline interview, conducted between June 2000 and August 2001, and nine-month interview, conducted between April 2001 and July 2002. *Significantly different from zero at the .10 level, two-tailed test. ***Significantly different from zero at the .01 level, two-tailed test. PCS = Personal care services; includes help with personal care, routine health care, doing things around the house, and transportation. | ||||||
| TABLE C.9. Estimated Effects of Consumer Directed Care on Key Quality Outcomes, by Age at Baseline | ||||||
| Outcome | Younger than Twelve at Baseline | Twelve or Older at Baseline | ||||
| Predicted Treatment GroupMean (Percent) | Predicted ControlGroupMean (Percent) | Estimated Effect(p-Value) | Predicted Treatment GroupMean (Percent) | Predicted ControlGroupMean (Percent) | Estimated Effect(p-Value) | |
| PARENT VERY SATISFIED WITH: | ||||||
| Paid caregivers' schedule in past two weeks | 86.5 | 64.8 | 21.7***(.000) | 86.2 | 68.0 | 18.2***(.001) |
| Overall care arrangements | 60.7 | 25.0 | 35.7***(.000) | 49.4 | 30.2 | 19.2***(.001) |
| Child's relationship with paid caregivers | 96.1 | 85.3 | 10.8***(.001) | 96.0 | 74.1 | 21.9***(.000) |
| The way child is spending life | 53.9 | 29.9 | 24.0***(.000) | 48.4 | 26.4 | 21.9***(.000) |
| CHILD NOT GETTING ENOUGH HELP WITH PERSONAL CARE | 29.7 | 46.2 | -16.5***(.000) | 38.4 | 42.6 | -4.2(.535) |
| SOURCE: MPR's baseline interview, conducted between June 2000 and August 2001, and nine-month interview, conducted between April 2001 and July 2002. NOTE: Sample sizes vary from measure to measure (from 562 to 796) because some questions were posed only if sample members met certain criteria and because of item non-response. In the largest sample used, 297 children were younger than 12 at baseline, and 499 were 12 or older. ***Significantly different from zero at the .01 level, two-tailed test. Estimated effects for the two subgroups were significantly different from each other at the .10 level, two-tailed test. Estimated effects for the two subgroups were significantly different from each other at the .05 level, two-tailed test. | ||||||
| TABLE C.10. Estimated Effects of Consumer Directed Care on Key Service-Use Outcomes, by Whether had an Unmet Need for Personal Care at Baseline | ||||||
| Outcome | Had an Unmet Need for PersonalCare at Baseline(n = 560) | Did Not Have an Unmet Need forPersonal Care at Baseline(n = 293) | ||||
| Predicted Treatment GroupMean | Predicted ControlGroupMean | Estimated Effect(p-Value) | Predicted Treatment GroupMean | Predicted ControlGroupMean | Estimated Effect(p-Value) | |
| IN RECENT TWO WEEKS: | ||||||
| Received PCS from paid caregivers (percent) | 83.9 | 67.2 | 16.7***(.000) | 73.2 | 61.4 | 11.8**(.023) |
| Hours of paid and unpaid assistance | 248.0 | 266.1 | -18.1*(.063) | 215.8 | 209.3 | 6.5(.630) |
| Received any routine health care assistance (percent) | 79.6 | 74.8 | 4.7(.181) | 75.3 | 64.3 | 11.0**(.029) |
| SINCE ENROLLMENT: | ||||||
| Modified home or vehicle, purchased supplies, or purchased or repaired equipment (percent) | 89.4 | 86.9 | 2.5(.296) | 81.0 | 77.9 | 3.1(.445) |
| SOURCE: MPR's baseline interview, conducted between June 2000 and August 2001, and nine-month interview, conducted between April 2001 and July 2002. NOTE: Means were predicted with logit models for binary outcomes and with ordinary least squares regressions for continuous outcomes. *Significantly different from zero at the .10 level, two-tailed test **Significantly different from zero at the .05 level, two-tailed test. ***Significantly different from zero at the .01 level, two-tailed test. PCS = Personal care services; includes help with personal care, routine health care, doing things around the house, and transportation. | ||||||
| TABLE C.11. Estimated Effects of Consumer Directed Care on Key Quality Outcomes, by Whether had an Unmet Need for Personal Care at Baseline | ||||||
| Outcome | Had an Unmet Need for PersonalCare at Baseline | Did Not Have an Unmet Need forPersonal Care at Baseline | ||||
| Predicted Treatment GroupMean (Percent) | Predicted ControlGroupMean (Percent) | Estimated Effect(p-Value) | Predicted Treatment GroupMean (Percent) | Predicted ControlGroupMean (Percent) | Estimated Effect(p-Value) | |
| PARENT VERY SATISFIED WITH: | ||||||
| Paid caregivers' schedule in past two weeks | 86.0 | 63.9 | 22.1***(.000) | 87.7 | 70.7 | 17.0***(.008) |
| Overall care arrangements | 56.0 | 26.0 | 30.0***(.000) | 57.6 | 28.3 | 29.3***(.000) |
| Child's relationship with paid caregivers | 97.2 | 80.1 | 17.1***(.000) | 92.8 | 85.0 | 7.8(.121) |
| The way child is spending life | 51.7 | 27.5 | 24.2***(.000) | 52.3 | 30.7 | 21.6***(.000) |
| CHILD NOT GETTING ENOUGH HELP WITH PERSONAL CARE | 37.7 | 52.6 | -14.9***(.000) | 20.8 | 27.1 | -6.3(.282) |
| SOURCE: MPR's baseline interview, conducted between June 2000 and August 2001, and nine-month interview, conducted between April 2001 and July 2002. NOTE: Sample sizes vary from measure to measure (from 562 to 795) because some questions were posed only if sample members met certain criteria and because of item nonresponse. In the largest sample used, 520 children had an unmet need for personal care at baseline, and 275 did not. ***Significantly different from zero at the .01 level, two-tailed test. Estimated effects for the two subgroups were significantly different from each other at the .05 level, two-tailed test. | ||||||
| TABLE C.12. Estimated Effects of Consumer Directed Care on Key Service-Use Outcomes, by Prospective Allowance at Baseline | ||||||
| Outcome | Prospective Allowance at BaselineWas Above the Median(n = 429) | Prospective Allowance at BaselineWas Below the Median(n = 430) | ||||
| Predicted Treatment GroupMean | Predicted ControlGroupMean | Estimated Effect(p-Value) | Predicted Treatment GroupMean | Predicted ControlGroupMean | Estimated Effect(p-Value) | |
| IN RECENT TWO WEEKS: | ||||||
| Received PCS from paid caregivers (percent) | 89.3 | 70.0 | 19.3***(.000) | 73.5 | 61.3 | 12.2**(.013) |
| Hours of paid and unpaid assistance | 254.0 | 267.0 | -13.0(.243) | 220.5 | 227.2 | -6.7(.546) |
| Received any routine health care assistance (percent) | 80.0 | 67.7 | 12.3***(.007) | 76.3 | 73.7 | 2.6(.684) |
| SINCE ENROLLMENT: | ||||||
| Modified home or vehicle, purchased supplies, or purchased or repaired equipment | 87.4 | 85.8 | 1.5(.538) | 85.5 | 81.9 | 3.6(.227) |
| SOURCE: MPR's baseline interview, conducted between June 2000 and August 2001, and nine-month evaluation interview, conducted between April 2001 and July 2002. NOTES: Means were predicted with logit models for binary outcomes and with ordinary least squares regressions for continuous outcomes. The median value of prospective allowances at baseline was $196 per week. **Significantly different from zero at the .05 level, two-tailed test. ***Significantly different from zero at the .01 level, two-tailed test. Estimated effects for the two subgroups were significantly different from each other at the .10 level. PCS = Personal care services; includes help with personal care, routine health care, doing things around the house, and transportation. | ||||||
| TABLE C.13. Estimated Effects of Consumer Directed Care on Key Quality Outcomes, by Prospective Allowance at Baseline | ||||||
| Outcome | Prospective Allowance at BaselineWas Above the Mediana | Prospective Allowance at BaselineWas Below the Mediana | ||||
| Predicted Treatment GroupMean (Percent) | Predicted ControlGroupMean (Percent) | Estimated Effect(p-Value) | Predicted Treatment GroupMean (Percent) | Predicted ControlGroupMean (Percent) | Estimated Effect(p-Value) | |
| PARENT VERY SATISFIED WITH: | ||||||
| Paid caregivers' schedule in past two weeks | 83.9 | 66.8 | 17.1***(.001) | 89.5 | 65.0 | 24.5***(.000) |
| Overall care arrangements | 62.0 | 25.7 | 36.4***(.000) | 51.0 | 28.0 | 23.0***(.000) |
| Child's relationship with paid caregivers | 94.4 | 83.7 | 10.7***(.008) | 97.4 | 79.5 | 17.9***(.000) |
| The way child is spending life | 57.8 | 25.8 | 32.0***(.000) | 45.8 | 31.6 | 14.2***(.004) |
| CHILD NOT GETTING ENOUGH HELP WITH PERSONAL CARE | 30.9 | 48.7 | -17.8***(.000) | 35.0 | 40.8 | -5.8(.275) |
SOURCE: MPR's baseline interview, conducted between June 2000 and August 2001, and nine-month interview, conducted between April 2001 and July 2002. NOTE: Sample sizes vary from measure to measure (from 562 to 796) because some questions were posed only if sample members met certain criteria and because of item nonresponse. In the largest sample used, 386 children's prosepctive allowances were above the median value, and 410 members' allowances were not. ***Significantly different from zero at the .01 level, two-tailed test. Estimated effects for the two subgroups were significantly different from each other at the .10 level, two-tailed test. Estimated effects for the two subgroups were significantly different from each other at the .05 level, two-tailed test.
| ||||||
| TABLE C.14. Estimated Effects of Consumer Directed Care on Key Quality Outcomes, by Whether Outcomes Were Imputed for Disenrolled Treatment Group Members | ||||||
| Outcomec | Without Imputinga | With Imputingb | ||||
| Predicted Treatment GroupMean (Percent) | Predicted ControlGroupMean (Percent) | Estimated Effect(p-Value) | Predicted Treatment GroupMean (Percent) | Predicted ControlGroupMean (Percent) | Estimated Effect(p-Value) | |
| How Satisfied Parents Were with: | ||||||
| PAID CAREGIVERS' SCHEDULE | ||||||
| Very satisfied | 85.3 | 63.9 | 21.4***(.000) | 81.3 | 64.0 | 17.3***(.000) |
| Dissatisfiedd | 3.5 | 10.7 | -7.2***(.001) | 7.1 | 10.8 | -3.7(.140) |
| OVERALL CARE ARRANGEMENTS | ||||||
| Very satisfied | 56.4 | 26.8 | 29.6***(.000) | 58.0 | 26.9 | 31.1***(.000) |
| Dissatisfied | 15.5 | 34.5 | -19.0***(.000) | 18.6 | 34.3 | -15.7***(.000) |
| CHILD'S RELATIONSHIP WITH PAID CAREGIVERS | ||||||
| Very satisfied | 96.0 | 82.4 | 13.6***(.000) | 89.8 | 83.1 | 6.7**(.020) |
| Dissatisfiedd | 0.7 | 1.5 | -0.8(.371) | 5.3 | 1.5 | 3.8**(.013) |
| THE WAY CHILD IS SPENDING LIFE | ||||||
| Very satisfied | 51.9 | 28.7 | 23.2***(.000) | 52.8 | 28.9 | 23.9***(.000) |
| Dissatisfied | 13.4 | 30.3 | -16.9***(.000) | 16.6 | 30.1 | -13.5***(.000) |
| CHILD HAS UNMET NEED FOR HELP WITH PERSONAL CARE | 32.8 | 44.6 | -11.8***(.000) | 33.9 | 44.5 | -10.6***(.002) |
SOURCE: MPR's baseline interview, conducted between June 2000 and August 2001, and nine-month interview, conducted between April 2001 and July 2002. **Significantly different from zero at the .05 level, two-tailed test. ***Significantly different from zero at the .01 level, two-tailed test.
| ||||||
| TABLE C.15. Estimated Effects of Consumer Directed Care on Key Quality Outcomes, by Whether Controlling for Ratios of Actual-to-Expected Waiver Costs | ||
| Outcome | Estimated Effect (p-Value) | |
| Cost Ratio Not Controlled For | Cost Ratio Controlled For | |
| VERY SATISFIED WITH CHILD'S OVERALL CARE ARRANGEMENTS (n = 794) | 29.7***(.000) | 28.3***(.000) |
| CHILD HAS AN UNMET NEED FOR: (n = 796) | ||
| Help doing things around the house | -17.0***(.000) | -17.7***(.000) |
| Help with personal care | -11.8***(.000) | -12.4***(.000) |
| Help with transportation | -9.2***(.004) | -9.2***(.004) |
| Help with routine health care | -10.0***(.001) | -9.5***(.002) |
| Care supplies | -12.0***(.000) | -11.5***(.001) |
| VERY SATISFIED WITH PAID CAREGIVERS' SCHEDULE (n = 562) | 21.4***(.000) | 21.8***(.000) |
| VERY SATISFIED WITH WAY CHILD IS SPENDING LIFE THESE DAYS (n = 794) | 23.2***(.000) | 22.8***(.000) |
| SOURCE: MPR's nine-month interview, conducted between April 2001 and July 2002. NOTE: Means were predicted with logit models. Results in the right-hand column were estimated with a logit model that included a binary control variable indicating whether a child incurred higher waiver costs during the first post-enrollment year than would have been expected according to the child's discounted baseline waiver support plan. ***Significantly different from zero at the .01 level, two-tailed test. | ||
NOTES
-
Although Cash and Counseling stood out among earlier, more limited models of consumer direction when it was implemented (from 1996 to 1999), it is becoming more common. In the coming months, as many as 10 states will receive grants to implement Cash and Counseling programs. The organizations that provided funding and waivers for the original demonstrations also will do so for the new programs (see above).
-
Table A.1 provides a complete list of Florida's DS waiver benefits. If any of these benefits, with the exception of support coordination, were in a child's waiver support plan, they would be "cashed out" under CDC. Florida used the funds it would have spent on support coordination to pay for CDC consulting services.
-
See Phillips and Schneider (2004) for a detailed description of program operations.
-
Florida enrolled 1,002 children into its Cash and Counseling demonstration, or 34 percent of the 3,000 children it estimated were eligible to participate. Children continued to enroll and be randomly assigned after August 2001, but they were not included in the evaluation. Instead, random assignment continued so that Florida could compare the costs of those in the program to a comparison group over a longer time period in order to meet federal requirements that CDC be budget neutral.
-
This subgroup indicator is derived from a baseline survey question that asked whether children received help with personal care, routine health care, doing things around the house, or transportation from someone who was paid by Medicaid or some other public program.
-
We considered a subgroup analysis in which children were grouped by the diagnoses underlying their developmental disability. However, the only available data on diagnoses were those on Medicaid claims. During the year before enrollment, fewer than half the children in our sample had claims that captured one of the covered diagnoses. Roughly another third had claims for multiple diagnoses. Because these children would be classified as having two or more of the five covered conditions, it would be impossible to define mutually exclusive subgroups.
-
As a rule, we conducted baseline interviews with the first parent who came to the telephone and agreed to speak with us. The interview solicited the opinions of that parent, even if another parent also was involved in the child's care. If a parent was not available for an interview within seven days of our first attempted contact, we asked to interview a knowledgeable proxy respondent, such as another relative of the sample member. Non-parent proxies completed one baseline and two follow-up interviews. In these cases, we asked the proxy about the satisfaction of both parents (if applicable). If the proxy also was a paid caregiver, we did not ask him or her to assess parents' satisfaction with the child's paid care. We describe our survey methods in more detail in a companion analysis by Carlson and Phillips (2003).
-
The response rates equal the number of respondents who completed interviews divided by the number who were eligible to be interviewed. Eleven percent of the eligible nonrespondents refused to be interviewed. The others could not be reached despite numerous attempts, at different times of day, over a one-month period. They also did not call MPR's toll-free telephone number to be interviewed at their convenience.
-
In the few instances where a child had more caregivers in any of these categories, we asked about the two or three who provided the most hours of assistance.
-
About 2 percent of control group members had paid live-in caregivers. We imputed the hours of care for which these live-in caregivers were paid based on the fraction of total hours that live-in workers for the control group were paid for, as reported during separate interviews with paid caregivers. According to these interviews, the control group's paid live-in caregivers were paid for about 34 percent of the care they provided.
-
We also assumed that the control group would not receive any unpaid care from agency workers. Therefore, when we asked control group parents to report the hours of care their child received from each visiting paid caregiver, we did not ask them to specify the number of hours for which each caregiver actually was paid. During separate interviews with the control group's paid caregivers, we learned that they were paid for 95 percent of the care they provided, on average. Thus we believe we accurately measured the total number of hours the control group received from visiting caregivers, but the group's paid hours may be slightly overestimated (by about one hour per week), and its unpaid hours underestimated by the same amount.
-
These measures best represented the distribution of survey responses. Highly favorable ratings were quite common, but very negative ones were quite uncommon. Therefore, we created a categorical measure that combined the most-negative and the next-most-negative ratings.
-
While both impacts could be estimated with one multinomial logit model, such estimates would be less precise because of the large number of parameters estimated. Ordered logit models are designed for such outcome measures but may mask important nonlinear impact patterns.
-
We chose to measure impacts by estimating straightforward binary logit models on individual outcomes, rather than by creating and analyzing indexes that combine various measures. We did this for several reasons: (1) the meaning of what is being measured is clearer when responses to actual survey questions are examined, (2) the magnitude of impacts is easier for readers to assess, (3) indexes assign arbitrary weights to component measures and treat ordinal measures as if they were cardinal, and (4) indexes sometimes mask important effects on component measures.
-
Allowances were sometimes delayed because both CDC consultants and district or state staff had to approve spending plans before families could begin receiving their allowance. Disenrollment was in most cases (88 percent) initiated by parents who changed their minds about the program or found that some aspect of it was not working well for them, according to records from the program's first year. Other children disenrolled because they were no longer eligible for Medicaid or HCBS waiver benefits. The program did not disenroll any children because of abuse or mismanagement of the allowance. Allowance delays and disenrollment are further discussed in a companion analysis (Foster et al. 2004a).
-
For logit models, this approach provides a formal two-tailed test of whether the odds ratio is significantly different from 1.0. To give readers a better feel for the magnitude of estimated effects, we present predicted mean probabilities, rather than odds ratios, for the treatment and control groups.
-
CDC did not seem to affect whether children received various types of personal care services (Table C.1).
-
Categorical distributions of paid and unpaid care hours show that the differences in means are not driven by outliers (Table C.2).
-
The results presented here and in the rest of the report are for the full sample of children. As explained later in this section (and shown in Table C.7), separate estimates for subgroups of children defined by whether they were receiving PCS from publicly funded caregivers at baseline were quite similar, despite differences between these two groups in whether they received PCS from paid caregivers at followup.
-
In a companion analysis of Medicaid claims, we found no significant treatment-control differences in the likelihood that children had inpatient hospital stays or emergency room visits. The groups also were similar on inpatient expenditures and number of inpatient days (Dale et al. 2004a).
-
Table C.5 and Table C.6 present results for additional quality outcomes.
-
Specifically, if parents said they would recommend the program, we imputed values of "very satisfied" or "no unmet need." If parents would not recommend the program, we imputed values of "dissatisfied" or "has an unmet need." If parents gave a qualified recommendation (such as "it depends"), we imputed values of "somewhat satisfied" or "don't know" whether has an unmet need.
-
The greater-than-expected allowances for treatment group children resulted from frequent reassessments after random assignment. The lower-than-expected waiver costs for control group children resulted from parents being unable to obtain all the benefits in their child's baseline support plan or from their deciding not to use all the benefits.
-
These results are based on a logit model that included a binary control variable indicating whether a child incurred higher costs during the first postenrollment year than would have been expected according to the child's discounted baseline waiver support plan. The program's impacts on quality outcomes were not appreciably affected when we included a continuous cost-ratio measure rather than a binary measure.
-
Of 61 control group parents who said their child did not receive paid PCS during our two-week reference period, 46 percent (28 parents) said a home care agency had been unable to serve them, and 25 percent (15 parents) had discontinued the services because they found them objectionable in some way (not shown).
-
The extent to which parents themselves benefited from CDC, as children's primary informal caregivers, is the subject of a companion analysis (Foster et al. 2004b).
-
Although we suspected that a novelty effect may have been particularly strong for parents who had been receiving the allowance for only a few months by the time of our follow-up interview, the data did not reveal a correlation between length of time on allowance and satisfaction (not shown).
-
Foster et al. (2004a) provide a more detailed analysis of treatment group experiences--as opposed to program impacts--in a companion analysis.
PERSONAL ASSISTANCE SERVICES "CASH AND COUNSELING" DEMONSTRATION/EVALUATION REPORTS AVAILABLE
- Assessing the Appeal of the Cash and Counseling Demonstration in Arkansas, New Jersey and Florida
- Executive Summary: http://aspe.hhs.gov/daltcp/reports/CCappeales.htm
- Full HTML Version: http://aspe.hhs.gov/daltcp/reports/CCappeal.htm
- Full PDF Version: http://aspe.hhs.gov/daltcp/reports/CCappeal.pdf
- Cash and Counseling: Consumers' Early Experiences in Arkansas
- Full HTML Version: http://aspe.hhs.gov/daltcp/2000/reports/earlyAR.htm
- Full PDF Version: http://aspe.hhs.gov/daltcp/2000/reports/earlyAR.pdf
- Cash and Counseling: Early Experiences in Arkansas
- Full HTML Version:
- Full PDF Version: http://aspe.hhs.gov/daltcp/reports/mpr-ark.pdf
- Changing to Consumer-Directed Care: The Implementation of the Cash and Counseling Demonstration in Florida
- Executive Summary: http://aspe.hhs.gov/daltcp/reports/FLchangees.htm
- Full HTML Version: http://aspe.hhs.gov/daltcp/reports/FLchange.htm
- Full PDF Version: http://aspe.hhs.gov/daltcp/reports/FLchange.pdf
- Consumer and Consultant Experiences in the Florida Consumer Directed Care Program
- Executive Summary: http://aspe.hhs.gov/daltcp/reports/FLcdcpes.htm
- Full HTML Version: http://aspe.hhs.gov/daltcp/reports/FLcdcp.htm
- Full PDF Version: http://aspe.hhs.gov/daltcp/reports/FLcdcp.pdf
- Consumer and Consultant Experiences in the New Jersey Personal Preference Program
- Executive Summary: http://aspe.hhs.gov/daltcp/reports/NJpppes.htm
- Full HTML Version: http://aspe.hhs.gov/daltcp/reports/NJppp.htm
- Full PDF Version: http://aspe.hhs.gov/daltcp/reports/NJppp.pdf
- Consumer and Counselor Experiences in the Arkansas IndependentChoices Program
- Executive Summary: http://aspe.hhs.gov/daltcp/reports/arkexpes.htm
- Full HTML Version: http://aspe.hhs.gov/daltcp/reports/arkexp.htm
- Full PDF Version: http://aspe.hhs.gov/daltcp/reports/arkexp.pdf
- Determining Consumer Preferences for a Cash Option: Arkansas Survey Results
- Full HTML Version: http://aspe.hhs.gov/daltcp/reports/arksrvy.htm
- Full PDF Version: http://aspe.hhs.gov/daltcp/reports/arksrvy.pdf
- Do Consumer-Directed Medicaid Supportive Services Work for Children with Developmental Disabilities
- Executive Summary: http://aspe.hhs.gov/daltcp/reports/2004/ddkidsMsses.htm
- Full HTML Version: http://aspe.hhs.gov/daltcp/reports/2004/ddkidsMss.htm
- Full PDF Version: http://aspe.hhs.gov/daltcp/reports/2004/ddkidsMss.pdf
- Does Arkansas' Cash and Counseling Affect Service Use and Public Costs?
- Executive Summary: http://aspe.hhs.gov/daltcp/reports/ARsupces.htm
- Full HTML Version: http://aspe.hhs.gov/daltcp/reports/ARsupc.htm
- Full PDF Version: http://aspe.hhs.gov/daltcp/reports/ARsupc.pdf
- Does Consumer Direction Affect the Quality of Medicaid Personal Assistance in Arkansas?
- Executive Summary: http://aspe.hhs.gov/daltcp/reports/arquales.htm
- Full HTML Version: http://aspe.hhs.gov/daltcp/reports/arqual.htm
- Full PDF Version: http://aspe.hhs.gov/daltcp/reports/arqual.pdf
- Easing the Burden of Caregiving: The Impact of Consumer Direction on Primary Informal Caregivers in Arkansas
- Executive Summary: http://aspe.hhs.gov/daltcp/reports/easinges.htm
- Full HTML Version: http://aspe.hhs.gov/daltcp/reports/easing.htm
- Full PDF Version: http://aspe.hhs.gov/daltcp/reports/easing.pdf
- Effect of Consumer Direction on Adults' Personal Care and Well-Being in Arkansas, New Jersey, and Florida
- Executive Summary: http://aspe.hhs.gov/daltcp/reports/adultpcwes.htm
- Full HTML Version: http://aspe.hhs.gov/daltcp/reports/adultpcw.htm
- Full PDF Version: http://aspe.hhs.gov/daltcp/reports/adultpcw.pdf
- Enabling Personal Preference: The Implementation of the Cash and Counseling Demonstration in New Jersey
- Executive Summary: http://aspe.hhs.gov/daltcp/reports/enableppes.htm
- Full HTML Version: http://aspe.hhs.gov/daltcp/reports/enablepp.htm
- Full PDF Version: http://aspe.hhs.gov/daltcp/reports/enablepp.pdf
- Experiences of Workers Hired Under Cash and Counseling: Findings from Arkansas, Florida, and New Jersey
- Executive Summary: http://aspe.hhs.gov/daltcp/reports/workerexpes.htm
- Full HTML Version: http://aspe.hhs.gov/daltcp/reports/workerexp.htm
- Full PDF Version: http://aspe.hhs.gov/daltcp/reports/workerexp.pdf
- How Cash and Counseling Affects Informal Caregivers: Findings from Arkansas, Florida, and New Jersey
- Executive Summary: http://aspe.hhs.gov/daltcp/reports/ICaffectes.htm
- Full HTML Version: http://aspe.hhs.gov/daltcp/reports/ICaffect.htm
- Full PDF Version: http://aspe.hhs.gov/daltcp/reports/ICaffect.pdf
- Lessons from the Implementation of Cash and Counseling in Arkansas, Florida, and New Jersey
- Executive Summary: http://aspe.hhs.gov/daltcp/reports/cclessones.htm
- Full HTML Version: http://aspe.hhs.gov/daltcp/reports/cclesson.htm
- Full PDF Version: http://aspe.hhs.gov/daltcp/reports/cclesson.pdf
- Medicaid Costs Under Consumer Direction for Florida Children with Developmental Disabilities
- Executive Summary: http://aspe.hhs.gov/daltcp/reports/2004/FLddkidses.htm
- Full HTML Version: http://aspe.hhs.gov/daltcp/reports/2004/FLddkids.htm
- Full PDF Version: http://aspe.hhs.gov/daltcp/reports/2004/FLddkids.pdf
- Moving to IndependentChoices: The Implementation of the Cash and Counseling Demonstration in Arkansas
- Executive Summary: http://aspe.hhs.gov/daltcp/reports/movingices.htm
- Full HTML Version: http://aspe.hhs.gov/daltcp/reports/movingic.htm
- Full PDF Version: http://aspe.hhs.gov/daltcp/reports/movingic.pdf
- The Cash and Counseling Demonstration: An Experiment in Consumer-Directed Personal Assistance Services
- Full HTML Version: http://aspe.hhs.gov/daltcp/reports/ccdartcl.htm
- Full PDF Version: http://aspe.hhs.gov/daltcp/reports/ccdartcl.pdf
- The Effect of Cash and Counseling on Medicaid and Medicare Costs: Findings for Adults in Three States
- Executive Summary: http://aspe.hhs.gov/daltcp/reports/3stcostes.htm
- Full HTML Version: http://aspe.hhs.gov/daltcp/reports/3stcost.htm
- Full PDF Version: http://aspe.hhs.gov/daltcp/reports/3stcost.pdf
- The Effect of Consumer Direction on Personal Assistance Received in Arkansas
- Executive Summary: http://aspe.hhs.gov/daltcp/reports/Arkpaes.htm
- Full HTML Version: http://aspe.hhs.gov/daltcp/reports/Arkpa.htm
- Full PDF Version: http://aspe.hhs.gov/daltcp/reports/Arkpa.pdf
- The Effects of Cash and Counseling on the Primary Informal Caregivers of Children with Developmental Disabilities
- Executive Summary: http://aspe.hhs.gov/daltcp/reports/ddkidpices.htm
- Full HTML Version: http://aspe.hhs.gov/daltcp/reports/ddkidpic.htm
- Full PDF Version: http://aspe.hhs.gov/daltcp/reports/ddkidpic.pdf
- The Experiences of Workers Hired Under Consumer Direction in Arkansas
- Executive Summary: http://aspe.hhs.gov/daltcp/reports/ARhiredes.htm
- Full HTML Version: http://aspe.hhs.gov/daltcp/reports/ARhired.htm
- Full PDF Version: http://aspe.hhs.gov/daltcp/reports/ARhired.pdf
INSTRUMENTS AVAILABLE
- Cash and Counseling Demonstration Participation Questionnaire
- Full HTML Version:
- Full PDF Version: http://aspe.hhs.gov/daltcp/instruments/DecideFm.pdf
To obtain a printed copy of this report, send the full report title and your mailing information to:
U.S. Department of Health and Human ServicesOffice of Disability, Aging and Long-Term Care PolicyRoom 424E, H.H. Humphrey Building200 Independence Avenue, S.W.Washington, D.C. 20201FAX: 202-401-7733Email: webmaster.DALTCP@hhs.gov
RETURN TO:
Office of Disability, Aging and Long-Term Care Policy (DALTCP) Home [http://aspe.hhs.gov/_/office_specific/daltcp.cfm]Assistant Secretary for Planning and Evaluation (ASPE) Home [http://aspe.hhs.gov]U.S. Department of Health and Human Services Home [http://www.hhs.gov]