
This Issue Brief highlights basic facts about direct care workers.
This Brief was prepared through intramural research by the U.S. Department of Health and Human Services, Office of the Assistant Secretary for Planning and Evaluation, Office of Disability, Aging and Long-Term Care Policy. For additional information about this subject, visit the DALTCP home page at http://aspe.hhs.gov/office_specific/daltcp.cfm or contact Ruth Katz at HHS/ASPE/DALTCP, Room 424E, H.H. Humphrey Building, 200 Independence Avenue, S.W., Washington, D.C. 20201, Ruth.Katz@hhs.gov.
Millions of people with disabilities rely on long-term services and supports to assist them with activities of daily living such as bathing, toileting, and dressing. Most of this support is provided by family members and friends, often in informal arrangements. In addition to the support provided by friends and family members, many people will require the services of paid direct care workers, making these workers an integral component of the long-term services and supports delivery system in the United States.
There are 1.9 million direct care workers--nurse aides and home health aides--in the United States workforce.1 These professionals are the primary providers of paid hands-on care for more than 13 million people with disabilities in the United States. They assist individuals with a broad range of support, including meal preparation, medication assistance, bathing, dressing, mobility and getting to planned activities on a daily basis. Direct care workers are essential to the delivery of long-term services and supports. The American Taxpayer Relief Act of 2012 (the “fiscal cliff” legislation) established a new commission to come up with new long-term care reform options. One of the issues the legislation specifically charged the commission with was examining issues related to workers who provide long-term services and supports, including whether the number of such workers is adequate to provide long-term services and supports to individuals who need them; and workforce development necessary to deliver high-quality services to such individuals.2
The purpose of this Issue Brief is to highlight basic facts about these workers, summarizing key findings from two surveys of the direct care workforce. The National Home Health Aide Survey is a national probability survey of home health aides designed to provide national estimates of home health aides employed by agencies that provide home health and/or hospice care.3 The National Nursing Assistant Survey is a parallel national survey of nursing assistants working in nursing facilities in the United States.4 Neither of these surveys includes personal care aides working outside of a home health or hospice agency or a nursing home.
"Who Are Direct Care Workers?
Direct care workers are disproportionately female; over 90% are women. Home Health Aides (HHAs) tend to be older than Certified Nursing Assistants (CNAs)--the average age of CNAs is 39 years old and the average age of HHAs is 46 (Figure 1). About half of all direct care workers are married or live with a partner (Figure 2). A minority are immigrants (22% of CNAs and 14% of HHAs).5 Direct care is a demanding profession, with low wages and limited fringe benefits. In 2007, the average hourly wage for direct care workers was between $11 and $12 per hour (Figure 3). Many CNAs and HHAs do not have access to health insurance through their employer, and about 23% of CNAs and 13% of HHAs participate in Medicaid or other government programs that pay for medical care (Figure 4). This number may increase when the Medicaid expansions in the Affordable Care Act (ACA) are implemented. The ACA permits states to expand Medicaid eligibility to all persons with incomes lower than 133% of the federal poverty level. Given their low incomes, more CNAs and HHAs are likely to become eligible when the expansion goes into effect.
| FIGURE 1. Age/Gender |
|---|
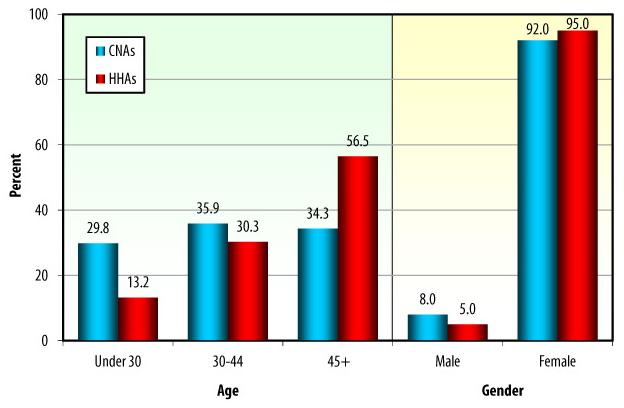 |
| SOURCE: RTI analysis of the 2007 National Home Health Aide Survey and the 2004 National Nursing Assistant Survey, 2009. [Available at http://aspe.hhs.gov/daltcp/reports/2011/CNAchart.htm.] CNAs = certified nursing assistants; HHAs = home health aides. |
Direct care workers have low incomes. Almost two-thirds of CNAs report household incomes of less than $30,000 per year. HHAs have slightly higher household incomes, with nearly 50% reporting incomes of less than $30,000 per year (Figure 5). Additionally, many direct care workers rely on public assistance at some point, to supplement their low incomes. Almost 25% received cash welfare for families and children presently or at some point in the past, and more than 40% have received food stamps.6
| FIGURE 2. Marital Status |
|---|
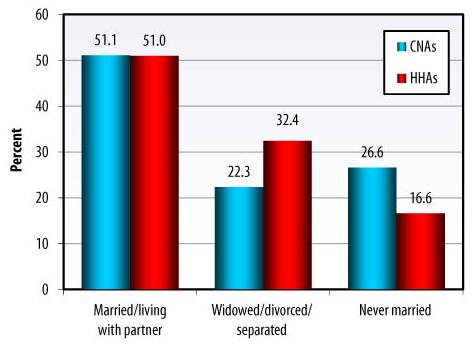 |
| SOURCE: RTI analysis of the 2007 National Home Health Aide Survey and the 2004 National Nursing Assistant Survey, 2009. [Available at http://aspe.hhs.gov/daltcp/reports/2011/CNAchart.htm.] CNAs = certified nursing assistants; HHAs = home health aides. |
| FIGURE 3. Compensation |
|---|
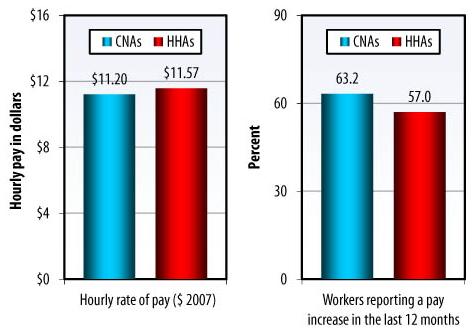 |
| SOURCE: RTI analysis of the 2007 National Home Health Aide Survey and the 2004 National Nursing Assistant Survey, 2009. [Available at http://aspe.hhs.gov/daltcp/reports/2011/CNAchart.htm.] NOTE: Wage data are in 2007 dollars. Wage data from the 2004 NNAS were adjusted to 2007 using U.S. Bureau of Labor Statistics data on percentage increase in CNA wages over the time period. CNAs = certified nursing assistants; HHAs = home health aides. |
| FIGURE 4. Health Coverage Choices |
|---|
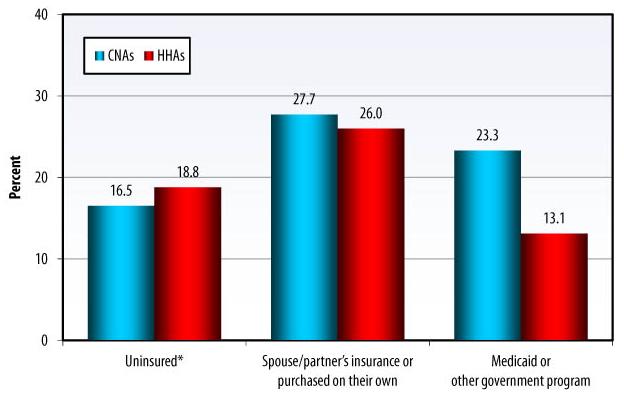 |
| SOURCE: RTI analysis of the 2007 National Home Health Aide Survey and the 2004 National Nursing Assistant Survey, 2009. [Available at http://aspe.hhs.gov/daltcp/reports/2011/CNAchart.htm.] CNAs = certified nursing assistants; HHAs = home health aides. * Respondents reporting no health insurance coverage purchased privately or provided by employers, government, or other family members. Employees had to work at least 16 hrs/week to be eligible to participate in this survey. Thus, findings may underestimate the percentage of part-time workers and, subsequently, the total number of uninsured workers. |
| FIGURE 5. Household Income |
|---|
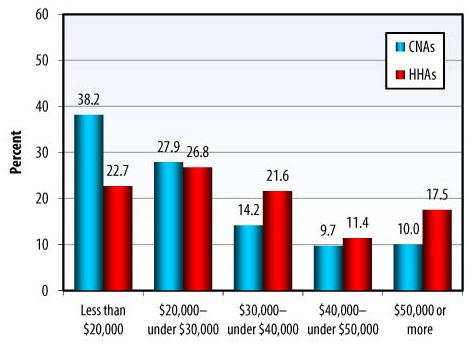 |
| SOURCE: RTI analysis of the 2007 National Home Health Aide Survey and the 2004 National Nursing Assistant Survey, 2009. [Available at http://aspe.hhs.gov/daltcp/reports/2011/CNAchart.htm.] CNAs = certified nursing assistants; HHAs = home health aides. |
Training
Overall, most direct care workers believe their training has prepared them well for their job; however, HHAs are more likely than CNAs to report feeling well prepared (Figure 6).
| FIGURE 6. Initial Training Rating: How Well Does It Prepare for Direct Care Work? |
|---|
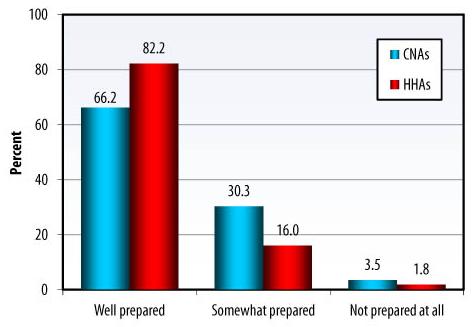 |
| SOURCE: RTI analysis of the 2007 National Home Health Aide Survey and the 2004 National Nursing Assistant Survey, 2009. [Available at http://aspe.hhs.gov/daltcp/reports/2011/CNAchart.htm.] CNAs = certified nursing assistants; HHAs = home health aides. |
Turnover in this field of work is high. According to one study, in 2007 annual turnover among CNAs in nursing facilities was 66% and in some states exceeded 100%.7 One in four CNAs and one in five HHAs report that they are looking for another job. Overall, 45% of CNAs and 35% of HHAs report that they are very likely or somewhat likely to leave their current job in the new year.8 High turnover means that direct care workers do not get to know the needs and preferences of individual residents or consumers, with potentially negative effects on quality of care (Figure 7).
| FIGURE 7. Currently Looking for Another Job, by Age |
|---|
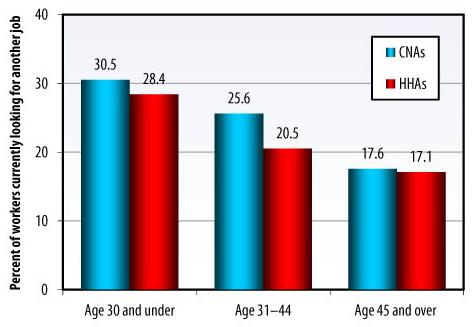 |
| SOURCE: RTI analysis of the 2007 National Home Health Aide Survey and the 2004 National Nursing Assistant Survey, 2009. [Available at http://aspe.hhs.gov/daltcp/reports/2011/CNAchart.htm.] CNAs = certified nursing assistants; HHAs = home health aides. |
Conclusion
Direct care workers are an essential part of a robust long-term care workforce. They provide daily living services to more than 13 million people with disabilities. Direct care work is difficult, the wages are low and fringe benefits are often limited. The Bureau of Labor Statistics estimates that the demand for CNAs and HHAs will increase by about 20% and 69%, respectively, between 2010 and 2020.9, 10 As the population ages and the demand for long-term services and supports grows, it is important for policy to address the challenge of recruiting, supporting, and training the workers needed to meet increased need for services.
Endnotes
-
Bureau of Labor Statistics, U.S. Department of Labor. Occupational Outlook Handbook, 2012-13 Edition, Home Health and Personal Care Aides. Available at http://www.bls.gov/ooh/healthcare/home-health-and-personal-care-aides.htm. (Accessed on March 15, 2013.)
-
The American Taxpayer Relief Act of 2012; Section 643(a)2C.
-
Bercovitz A, Moss A, Sengupta M, et al. 2011. An Overview of Home Health Aides: United States, 2007. National Health Statistics Reports; No. 34. Hyattsville, MD: National Center for Health Statistics. Available at http://www.cdc.gov/nchs/data/nhsr/nhsr034.pdf. (Accessed on March 15, 2013.)
-
Squillace MR, Remsburg RE, Bercovitz A, Rosenoff E, Branden L. 2007. An Introduction to the National Nursing Assistant Survey. Vital Health Stat 1(44). 2007. Hyattsville, MD: National Center for Health Statistics. Available at http://www.cdc.gov/nchs/data/series/sr_01/sr01_044.pdf. (Accessed on March 15, 2013.) Also available at http://aspe.hhs.gov/daltcp/reports/2006/NNASintro.htm.
-
Squillace MR, Khatutsky G, Wiener J, Anderson W, Akhermova V, Jessup AE. 2001. Understanding Direct Care Workers: A Snapshot of Two of America’s Most Important Jobs. Page 8. Washington, DC: Office of the Assistant Secretary for Planning and Evaluation, U.S. Department of Health and Human Services. Available at http://aspe.hhs.gov/daltcp/reports/2011/CNAchart.htm. (Accessed on March 15, 2013.)
-
Bureau of Labor Statistics, U.S. Department of Labor. Occupational Outlook Handbook, 2012-13 Edition, Home Health and Personal Care Aides. Available at http://www.bls.gov/ooh/healthcare/home-health-and-personal-care-aides.htm. (Accessed on March 15, 2013.)
-
American Health Care Association. 2008. Report of Findings of 2007 AHCA Survey: Nursing Staff Vacancy and Turnover in Nursing Facilities. Washington, DC: American Health Care Association. Available at http://www.ahcancal.org/research_data/staffing/Documents/Vacancy_Turnover_Survey2007.pdf. (Accessed on March 26, 2013.)
-
Bureau of Labor Statistics, U.S. Department of Labor. Occupational Outlook Handbook, 2012-13 Edition, Home Health and Personal Care Aides. Page 44. Available at http://www.bls.gov/ooh/healthcare/home-health-and-personal-care-aides.htm. (Accessed on March 15, 2013.)
-
Bureau of Labor Statistics, U.S. Department of Labor. Occupational Outlook Handbook, 2012-13 Edition, Nursing Aides, Orderlies, and Attendants. Available at http://www.bls.gov/ooh/healthcare/nursing-assistants.htm. (Accessed on April 1, 2013.)
-
Bureau of Labor Statistics, U.S. Department of Labor. Occupational Outlook Handbook, 2012-13 Edition, Home Health and Personal Care Aides. Available at http://www.bls.gov/ooh/healthcare/home-health-and-personal-care-aides.htm. (Accessed on March 15, 2013.)