
U.S. Department of Health and Human Services
The Contribution of Medication Use to Recent Trends in Old-Age Functioning
Vicki A. Freedman, Ph.D., and Hakan Aykan, Ph.D.
Polisher Research Institute, Madlyn and Leonard Abramson Center for Jewish Life(formerly the Philadelphia Geriatric Center)
August 2002
PDF Version: http://aspe.hhs.gov/daltcp/reports/2002/oldagemu.pdf (54 PDF pages)
This report was prepared under contract between the U.S. Department of Health and Human Services (HHS), Office of Disability, Aging and Long-Term Care Policy (DALTCP) and the Philadelphia Geriatric Center. For additional information about this subject, you can visit the DALTCP home page at http://aspe.hhs.gov/_/office_specific/daltcp.cfm or contact the office at HHS/ASPE/DALTCP, Room 424E, H.H. Humphrey Building, 200 Independence Avenue, S.W., Washington, D.C. 20201. The e-mail address is: webmaster.DALTCP@hhs.gov. The Project Officer was William Marton.
This research was funded by a supplement from the Office of the Assistant Secretary for Planning and Evaluation of the U.S. Department of Health and Human Services to the National Institute on Aging (Grant No. R01-14346). The views expressed are those of the authors alone and do not reflect the opinions of the funding agencies.
TABLE OF CONTENTS
I. BACKGROUND
II. PURPOSE
III. ANALYTIC FRAMEWORK
IV. DATA AND STATISTICAL APPROACH
A. The Health and Retirement Study
B. Functional Limitation Items
C. Chronic Conditions and Medication Use
D. Analytic Samples
E. Statistical Approach
F. Exploration of Design Effect Adjustments to Variances in Statistical Tests
V. AGGREGATE CHANGES IN FUNCTIONING AND MEDICATION USE
A. Have Reports of Functional Limitations Declined Over Time Among 51-61 Year Olds?
B. Have Reports of Chronic Conditions and Medication Use Increased Over Time Among 51-61 Year Olds?
C. What Other Characteristics Have Changed Among 51-61 Years Old from 1992 to 1998 and Did Functioning Change for Those Groups?
VI. LINKING MEDICATION USE AND FUNCTIONING
A. Do Changes in Medication Use Account for Changes in Functional Limitations from 1992 to 1998?
B. Do Changes in Medication Use Account for Changes in Functional Limitations from 1994 to 2000?
C. Do Aggregate Changes in Functioning from 1992 to 1998 Vary by Reports of Chronic Conditions and Medication Use?
VII. CONCLUSIONS
A. Summary of Findings
B. Limitations
C. Policy Implications
APPENDICES
APPENDIX I: DEVELOPMENT OF A FUNCTIONAL LIMITATION SCALE THAT MINIMIZES SENSITIVITY TO QUESTION WORDING CHANGES
APPENDIX II: DEVELOPMENT OF A FACTOR TO CORRECT FOR QUESTION WORDING CHANGES BETWEEN THE 1992 AND 1998 WAVES OF THE HEALTH AND RETIREMENT STUDY
LIST OF FIGURES
FIGURE 1. Framework for Understanding the Pathway from Pathology to Functional Limitations
FIGURE 2. Mean Number of Functional Limitations in 1992 and 1998 Among Older Americans Reporting Select Chronic Conditions, by Medication Use
FIGURE 3. Mean Number of Functional Limitations in 1994 and 2000 Among Older Americans Reporting Select Chronic Conditions, by Medication Use
LIST OF TABLES
TABLE 1. Mean Number of Functional Limitations in 1992 and 1998 Among Older Americans Reporting Select Chronic Conditions, by Medication Use
TABLE 2. Sample Sizes for All 51-61 Year Olds and For Those with Specific Chronic Conditions: 1992-1998
TABLE 3. Percentage of Respondents Re-interviewed, Lost to Follow-Up and Deceased between 1992-1994 and 1998-2000
TABLE 4. Mean Number of Functional Limitations for All 51-61 Year Olds and For Those with Specific Chronic Conditions: 1992-1998
TABLE 5. Mean Number of Functional Limitations for All 51-61 Year Olds and For Those with Specific Chronic Conditions: 1994-2000
TABLE 6. Percentage of Americans Ages 51-61 Reporting Select Chronic Conditions, 1992 and 1998
TABLE 7. Percentage of Americans Ages 51-61 Reporting Medication Use for Select Chronic Conditions, 1992 and 1998
TABLE 8. Distribution of Demographic and Socioeconomic Characteristics Among Americans Ages 51-61, 1992 and 1998
TABLE 9. Mean Number of Functional Limitations Among Americans Ages 51-61 by Demographic and Socioeconomic Characteristics, 1992 and 1998
TABLE 10. Mean Number of Functional Limitations Among Americans Ages 53-63 by Demographic and Socioeconomic Characteristics, 1994 and 2000
TABLE 11. Change in Mean Number of Limitations from 1992 to 1998 Among 51-61 Year Olds, Controlling for Socioeconomic and Demographic Changes, Chronic Conditions, and Medication Use
TABLE 12. Change in Mean Number of Limitations from 1992 to 1998 Among 51-61 Year Olds With Specific Conditions, Controlling for Socioeconomic and Demographic Changes, Chronic Conditions, and Medication Use
TABLE 13. Change in Mean Number of Limitations from 1994 to 2000 Among 53-63 Year Olds
TABLE 14. Change in Mean Number of Limitations from 1994 to 2000 Among 53-63 Year Olds Reporting Specific Chronic Conditions
TABLE 15. Change in Mean Number of Limitations from 1992 to 1998 Among 51-61 Year Olds Reporting Specific Chronic Conditions, by Reported Medication Use
TABLE 16. Change in Mean Number of Limitations from 1994 to 2000 Among 53-63 Year Olds Reporting Specific Chronic Conditions, by Reported Medication Use
TABLE AI-1: Inconsistencies in Reports of Leading and Neutral Functional Limitations
TABLE AI-2: Agreement Between Leading and Neutral Functional Limitation Scales
TABLE AI-3: Reliability and Predictive Validity of Leading and Neutral Functional Limitation Scales
TABLE AII-1: Analysis of Sample Characteristics and Predictors of Discrepancies Between Leading and Neutral Functional Limitation Questions, 1992 and 1994
EXECUTIVE SUMMARY
Introduction
After nearly a decade of debate among academics and policy makers, a consensus has emerged that disability rates among older Americans have declined over the last fifteen years. However, the implications of such trends for publicly funded programs such as Medicare, Medicaid, and Social Security remain far from clear. In order to understand the consequences of disability declines for such programs, better insight into the causes driving the trend is needed.
Several existing studies raise the possibility that changes in the management of chronic disease--and in changes in medication use in particular--could be a potentially important explanation for observed improvements in functioning. Indeed, drug treatment has become an increasingly important aspect of medical care for older Americans; currently nine out of ten older Americans take one or more prescription drugs daily and many consume multiple medications. During the 1980s and early 1990s there also have been major shifts in the classes of drugs prescribed for some of the more debilitating chronic conditions.
The purpose of this study is to explore the extent to which changes in medication use account for improvements in functioning among older Americans. Using several waves of the Health and Retirement Study (HRS), a nationally representative survey of non-institutionalized Americans ages 51-61, we examine changes during the 1990s in the prevalence of functional limitations and medication use associated with five highly prevalent and often debilitating chronic conditions: hypertension, diabetes, lung disease, stroke, and arthritis.
For Americans of pre-retirement age (51-61) and for subgroups of this age group with specific chronic conditions we explore the following questions:
-
Has functioning improved over time?
-
Has medication use increased over time?
-
Do changes in medication use account for improvements in functioning?
-
Have improvements over time been greater for those groups reporting medication use?
Data
Drawing upon multiple waves of the HRS, we compare estimates of functional limitations and medication use for the population ages 51-61 in 1992 (N=9,573) and in 1998 (N=7,099). We also model the number of functional limitations as a function of year, chronic conditions, and various demographic and socioeconomic characteristics. Because medication use may be a reflection of the severity of an underlying functional problem, we also present evidence about changes in functioning between 1994 (N=8,618) and 2000 (N=6,486), using medication use and other predictors from 1992 and 1998, respectively.
In all four waves, respondents were asked to report about difficulty with 12 functional limitation items. However, in 1992 respondents were asked "How much difficulty do you have _____" whereas in subsequent waves respondents were asked "Do you have any difficulty " We handle this change in question wording in two ways. First, we limit our analysis to 7 of the 12 functional limitation items (sitting for about 2 hours; getting up from a chair after sitting for long periods; lifting or carrying weights over 10 pounds; stooping, kneeling, or crouching; picking up a dime from a table; reaching or extending arms above shoulder level; and pulling or pushing large objects). Our analysis of experimental module data included in the 1994 wave (presented in detail in Appendix I) suggests that the 7-item scale is less sensitive to question wording changes without sacrificing internal consistency or predictive validity. Second, we 'correct' comparisons between 1992 and 1998 for changes in question wording based on a correction factor developed from our analysis of the experimental module (see Appendix II for details).
In 1992 and 1998, the HRS obtained information in an identical fashion about five chronic conditions--hypertension, diabetes, chronic lung disease, stroke, and arthritis. For arthritis, survey respondents were asked if they ever had or a doctor ever told them they have arthritis. For all other conditions, they were asked to report whether a doctor ever told them they have the given condition. In both years, respondents reporting a given condition were asked follow-up questions about medication use. Medication use questions were tailored to each condition but were essentially identical in 1992 and 1998.
Results
After correcting for changes in wording, we find the average number of functional limitations declined from 1.57 in 1992 to 1.34 in 1998 (p0.01). Statistically significant improvements were also found among those reporting hypertension, diabetes, and arthritis. Improvements were experienced widely with the important exception of non-Whites whose functioning remained constant over this time period.
When we limit the analysis to 53-63 year olds in 1994 and 2000, we find no significant improvement in functioning (1.39 in 1994 vs. 1.40 in 2000), except among those reporting no arthritis, those who were not married, and those with no liquid assets (savings, checking, CD, or stocks). Functioning was significantly worse among those with arthritis and among those with more than a high school education.
We also find large increases in the reports of medication use among older Americans reporting hypertension (from 64% in 1992 to 75% in 1998) and reporting diabetes (from 62% in 1992 to 77% in 1998). However, for the five conditions considered here, changes in medication use do not appear to account for any of the improvements in functioning between 1992 and 1998 or the stability between 1994 and 2000. Instead, increases in educational attainment appear to be offsetting increases in the prevalence of chronic conditions, most notably obesity (which increased by over 25% in just six years) and arthritis.
Finally, we find no evidence that improvements in functioning were larger for Americans taking medications than for those with the same condition but not taking medication. Thus, it does not appear that medications have become more effective during the 1990s in averting functional limitations among Americans of pre-retirement age.
Conclusions
We conclude that changes in medication use for five highly prevalent conditions do not appear to explain improvements in functioning among Americans nearing old age. Our analysis also provides a cautionary tale for policy makers. The year-to-year variation we observe in whether there have been improvements in functioning for this cohort underscores the need for analysis of multiple data sets and time points before drawing conclusions about trends. More importantly, given that educational increases will be smaller in the future than they have been in the past, and that increases in the prevalence of obesity are likely to continue as younger cohorts enter old-age, caution is warranted in projecting forward improvements in old-age functioning.
I. BACKGROUND
After nearly a decade of debate among academics and policy makers, a consensus is emerging that disability rates among older Americans have declined over the last fifteen years (Schoeni, Freedman, and Wallace, 2001). However, the implications of such trends for publicly funded programs such as Medicare, Medicaid, and Social Security remain far from clear in part because it is uncertain whether such declines will continue. While some have suggested continued declines of 1.5% per year are plausible well into the future (Singer and Manton, 1998), others have cautioned future trends may not mirror those of the last decade (Freedman and Martin, 1998).
In order to understand the consequences of disability declines for publicly financed programs, better insight into the causes driving the trend is needed. Current hypotheses for the improvements may be classified broadly into long-term and shorter-term factors. Long-term factors might include better nutrition (including advances in food preparation and storage), improvements in the public health infrastructure, and widespread use of infectious disease treatments such as antibiotics. More recent explanations include changes in the socioeconomic status of older Americans, healthier life-styles, increased use of assistive technologies, less restrictive environments, and better treatment of chronic diseases through medical procedures and medication use.
The relative importance of such potential influences depends in part on the specific measure under consideration. Indeed, improvements have not been consistent across all measures of disability and functioning. Schoeni, Freedman, and Wallace (2001), for example, show disability declines are limited to those with only difficulty in instrumental activities of daily living (IADLs)--that is activities such as shopping, using the telephone, doing housework--but do not extend to those with disability in personal care activities such as bathing, dressing, and eating. Similarly, Spillman (2001) shows that disability declines are limited to those reporting difficulty with IADLS but do not extend to those reporting needing help with these activities.
In an attempt to hold constant changes in the environment and social roles, Freedman and Martin (1998; 1999; 2000) have focused their attention on trends in functional limitations. As highlighted by the Institute on Medicines (IOMs) model of the disablement process (Pope and Tarlov, 1991), functional limitations constitute a key pathway between pathology and disability, and are defined as manifestations of difficulty with body movements and tasks--such as reaching, bending, and lifting--that occur at the level of the organism. Though often used interchangeably in the literature functional limitations and disability are distinct in that the former involves limitations within the organism itself whereas the latter involves the inability to carry out roles or activities within a specific environment. Freedman and Martin (1998) and Cutler (2001) have shown improvements in functioning among Americans ages 65 and older and among those of pre-retirement age (50-64). Their work suggests that disability declines likely reflect at least in part improvements in the underlying health of older Americans.
The question remains, however, what is driving improvements in the underlying health of older Americans? With respect to functional limitations, two recent studies begin to shed light on some of the possible factors driving such improvements. Although shifts in the demographic composition of the older population do not fully explain improvements in functioning, Freedman and Martin (1999) identify dramatic increases in the percentage of older Americans with a high school education as an important factor contributing to recent trends. They speculate that education could operate through a number of pathways, including different patterns of health care service and prescription drug use. In related work, Freedman and Martin (2000) show that several major diseases--arthritis most prominently--appear to have become less debilitating over time. The authors speculate that for some conditions this pattern could be explained by progress in disease management, in part due to changes in drug treatment.
Together such studies point to changes in the management of chronic disease--and in changes in medication use in particular--as a possible explanation for observed improvements in functioning. Indeed, drug treatment has become an increasingly important aspect of medical care for older Americans (Cherry et al., 2001). Approximately nine out of ten older Americans currently take one or more prescription drugs daily (Rogowski et al., 1997). During the 1980s and early 1990s there have been major shifts in the classes of drugs prescribed for some of the more debilitating chronic conditions. For example, for arthritis, increased availability of disease modifying anti-rheumatic drugs (Fries et al., 1996; Ward and Fries, 1998), non-steroidal anti-inflammatory drugs, and, for women, estrogen replacement therapy (Zhang et al., 1998) may be associated with fewer debilitating effects. New classes of psychotropic agents have become available to treat depression and other psychiatric conditions (Luisi et al., 1999), which have been identified as a major cause of premature disability among the elderly (Boult et al., 1994; Verbrugge et al., 1989). Drug treatments for diabetes and hypertension have also expanded significantly during this period (Luisi et al., 1999).
II. PURPOSE
The purpose of this study is to explore the extent to which changes in medication use account for improvements in functioning among older Americans. Using several waves of the Health and Retirement Study, a nationally representative survey of non-institutionalized Americans ages 51-61, we examine changes between 1992 and 1998 and between 1994 and 2000 in the prevalence of functional limitations and medication use associated with five highly prevalent and often debilitating chronic conditions: hypertension, diabetes, lung disease, stroke, and arthritis.
For Americans of pre-retirement age (51-61) and for subgroups of this age group with specific chronic conditions we explore the following questions:
-
Has functioning improved over time?
-
Has medication use increased over time?
-
Do changes in medication use account for improvements in functioning?
-
Have improvements over time been greater for those groups reporting medication use?
Answers to these questions are intended to yield insight into the role of medication use in recent trends in old-age functioning. If medication use is pinpointed as responsible for a sizeable portion of the decline, such analyses could yield important insights into the potential for future improvements, particularly in light of recent federal interest to add a prescription drug benefit to Medicare. Conversely, if no link is found between medication use and recent improvements in functioning, the study may help to refocus efforts to explain recent disability declines.
III. ANALYTIC FRAMEWORK
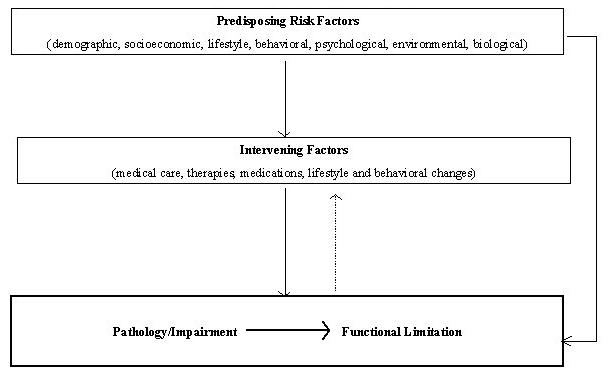
We draw upon a framework developed by Verbrugge and Jette (1994) in their depiction of the disablement process. The framework purports that the disablement process is governed by predisposing and intervening factors. They define predisposing as existing at or prior to the onset of the disablement process and include demographic, social, and life long behavioral factors. They also distinguish between extra- and inter-individual intervening factors that are inserted during the disablement process in an effort to avoid, retard, or reverse outcomes.
Their approach, while a useful starting point, does not attempt to distinguish the factors most likely to intervene at each stage of the disablement process. So, for example, environmental factors are most likely to be salient in determining whether a functional limitation results in a disability whereas medical treatment might be more salient in determining whether a pathology leads to a functional limitation.
Here we limit our attention to the factors most likely to intervene between pathology and functional limitations: medical care, medication use, treatments, and lifestyle and behavioral changes (see Figure 1).
| FIGURE 1. Framework for Understanding the Pathway from Pathology to Functional Limitations |
 |
The existing literature on explanations for trends in functioning has thus far focused on the role of predisposing risk factors and on the changing chronic disease profile. Freedman and Martin (1998), for example, find that changes in eight socioeconomic and demographic characteristics do not fully explain improvements in functioning between 1984 and 1993 among Americans ages 50 and older. Similarly, Schoeni et al. (2001) and Waidman and Liu (2000) find that disability declines are not fully explained by demographic shifts. Changes in the chronic disease profile also do not appear to explain improvements in functioning; instead it appears that chronic diseases are less debilitating now than in the recent past. Whether this is because of improved treatment or earlier detection or improved reporting remains to be seen.
As Verbrugge and Jette point out (1994; p. 8), because intervening factors are inserted during the disablement process, and the timing of their effects may be immediate, delayed, or cumulative, estimating the effects of specific interventions in observational research is problematic. Indeed, the intervention of interest in this report, medication use, may reflect in part the severity of a particular condition or impairment. We note this potential for reverse causality with a dotted line in Figure 1.
More importantly, we attempt to address this potential circularity in our analysis by supplementing cross-sectional comparisons between 1992 and 1998 with panel data. In particular, we present evidence about changes between 1994 and 2000, using information about medication use and other predictors from 1992 and 1998, respectively.
IV. DATA AND STATISTICAL APPROACH
A. The Health and Retirement Study
Data for these analyses come from the Health and Retirement Study (HRS). The HRS is a national longitudinal study of the noninstitutionalized population born between 1931 and 1941 (i.e., age 51-61 at the time of the baseline survey in 1992) and their spouses. Respondents and their spouses were reinterviewed in 1994 and in 1996. In 1998, the HRS was combined with another survey of older Americans and missing cohorts were added to form a uniform survey of individuals ages 51 and older in 1998. Respondents to the 1998 wave and their spouses were reinterviewed in 2000.
Thus, the 1992 and 1998 surveys provide nationally representative cross-sections of the non-institutionalized population ages 51-61 in 1992 and 1998, respectively. When merged with data from the 1994 and 2000 waves, respectively, the 1992 and 1998 provide parallel longitudinal samples of Americans ages 53-63 in 1994 and 2000. We use the public release versions of the 1992 and 1994 and the preliminary release versions of the 1998 and 2000 waves. The preliminary data have not been cleaned and may contain errors that will be corrected in the final public release version of the dataset.
In both 1992 and 1998, a complex sample design was used, in which Blacks, Hispanics, and residents of Florida were oversampled. We account for this complex design in our analyses by using sampling weights.
Wave-specific overall response rates to the 1992, 1994, 1998, and 2000 waves have improved from 81.7% in 1992 to close to 90% at later waves. Approximately 80.4% of the baseline HRS respondents (including over 600 who have died and for whom exit interviews were obtained) have participated in all waves through 1998 at which they were eligible. About 9.7% of all baseline respondents are missing one follow-up interview; 5.9% are missing two, and 4.1 are missing all three interviews. Sampling weights have been post-stratified to the Current Population Survey by age, sex, race, ethnicity, and marital status groups to account for differential non-response by those major demographic groups.
B. Functional Limitation Items
In all waves, respondents were asked to report about difficulty with 12 functional limitation items: running or jogging about a mile; walking several blocks; walking one block; sitting for about 2 hours; getting up from a chair after sitting for long periods; climbing several flights of stairs without resting; climbing one flight of stairs without resting; lifting or carrying weights over 10 pounds; stooping, kneeling, or crouching; picking up a dime from a table; reaching or extending arms above shoulder level; and pulling or pushing large objects.
In the 1992 wave of the HRS, respondents were instructed, We are interested in how much difficulty people have with various activities because of a health or physical problem. Exclude any difficulties that you expect to last less than three months. They were then asked: How difficult is it for you to ___. Responses included not at all difficult; a little difficult; somewhat difficult; very difficult/cant do; and dont do. In subsequent waves, the introduction and specific tasks were identical to those included in the baseline survey. However, for each item respondents were asked: Do you have any difficulty with ___. Response options included yes, no, cant do, and dont do.
To gauge the extent of inconsistencies between the two approaches, the 1994 wave included an experimental module that included the functional limitation questions from the 1992 wave. Thus, for a randomly selected group of respondents ages 51-61 (N=564), answers to both sets of functional limitation questions are available for the same point in time.
Our analysis of the 1994 data (presented in detail in Appendix I) suggests that eliminating 5 of the 12 items (jogging; walking several blocks; walking one block; climbing several flights of stairs; climbing one flight of stairs) results in a scale that is less sensitive to question wording changes without sacrificing internal consistency or predictive validity. For this analysis we therefore adopt a functional limitation scale consisting of seven items: sitting for about 2 hours; getting up from a chair after sitting for long periods; lifting or carrying weights over 10 pounds; stooping, kneeling, or crouching; picking up a dime from a table; reaching or extending arms above shoulder level; and pulling or pushing large objects. Respondents are given one point for each item with which they report having any difficulty.1
C. Chronic Conditions and Medication Use
In 1992 and 1998, the HRS obtained information in an identical fashion about five chronic conditions--hypertension, diabetes, chronic lung disease, stroke, and arthritis.2 For arthritis, survey respondents were asked if they ever had or a doctor ever told them they have arthritis. For all other conditions, they were asked to report whether a doctor ever told them they have the given condition.
In both years, respondents reporting a given condition were asked follow-up questions about medication use. Medication use questions were tailored to each condition but were essentially identical in 1992 and 1998. Those reporting hypertension were asked whether they are currently taking any medication for the condition. Respondents reporting diabetes were asked if they now use medication that they swallow or insulin injections to treat or control their diabetes. Respondents reporting lung disease were asked whether they were taking medication or other treatments for their condition. Those reporting ever having a stroke were asked if they are taking any medications because of the stroke and its complications. Finally, those reporting arthritis were asked whether they were currently taking any medication or other treatments for their condition.
Previous studies have evaluated the validity and reliability of self-reported chronic conditions in the United States (Bush et al., 1989; Kehoe et al., 1994; Martin et al., 2000; Paganini-Hill and Ross, 1982) and abroad (Engstad et al., 2000; Haliovaara et al., 1993; Kriegsman et al., 1996; Muhajarine et al., 1997). In general such studies show excellent agreement between self-reported conditions and claims or medical records for hypertension, diabetes. Studies of Scandanavian populations (Haliovaara et al., 1993; Kriegsman et al., 1996) suggest self-reports may yield underestimates of arthritis and lung disease relative to medical records; however, caution is clearly in order in attempting to generalize these findings to an American population, which is likely to be far more heterogenous than Finland or Holland in terms of culture and health care access and utilization.
Studies of the reliability and validity of medication use are less common and with one exception (Kehoe et al., 1994) involve foreign populations (Cotterchio et al., 1999; Midthjell et al., 1992; Klugel et al., 1999, 2000; Sjahid et al., 1998; Van den Brandt et al., 1991). Still, they point to excellent agreement between self-reported medication use and pharmacy or physician records for anti-hypertensives (Kehoe et al., 1994; Klugel et al., 1999), for insulin and oral diabetes medication (Kehoe et al., 1994; Midthjell et al., 1992), and for medications associated with long-term illnesses (Van den Brandt et al., 1991). Moreover a study of the influence of question structure on the recall of self-reported medication use found that when questions about medication are linked to specific conditions, as they are in the HRS, 88% of medications are accurately recalled (Klugel et al., 2000).
D. Analytic Samples
We use several analytic samples, each with its own strengths and weaknesses, to investigate the role of medication use in changes in population-level estimates of functional limitations.
1. Comparisons of Functioning in 1992 and 1998
To compare aggregate-level changes in functioning between 1992 and 1998, we create (a) a complete sample of 51-61 year olds in 1992 and in 1998 and (b) five sub-samples of people 51-61 years old in 1992 and in 1998 with each of the five specific chronic conditions. Sample sizes for the complete sample and each condition-specific sample are provided in Table 1.
The complete samples provide the advantage of elegance--that is, they allow for modeling of changes over time controlling for changes in all other conditions. The complete samples also provide ample statistical power to detect even small improvements in functioning over time.
The condition-specific groups allow us to control through selection for possible changes in the composition of chronic conditions. These condition-specific samples allow us to explore whether functioning has improved among people with a given chronic condition and whether medication use contributes to that improvement.
| TABLE 1. Sample Sizes for All 51-61 Year Olds and For Those with Specific Chronic Conditions: 1992 and 1998 | ||
| Condition | 1992 | 1998 |
| All 51-61 year olds (complete sample) | 9,573 | 7,099 |
| Hypertension | 3,825 | 2,795 |
| Diabetes | 1,051 | 816 |
| Lung disease | 783 | 483 |
| Stroke | 287 | 229 |
| Arthritis | 3,652 | 3,077 |
The major drawback of making comparisons between 1992 and 1998 is that the functional limitation questions were slightly different between the waves. By inflating the number of functional limitations reported in 1992, the change in question wording introduces bias in the direction of overstating declines in functioning. The issue of question wording differences is resolved at later waves because a uniform approach is used in all follow-up waves to the HRS (e.g., do you have any difficulty ).
To make valid comparisons between 1992 and 1998, we apply corrections to the 1992 descriptive estimates, based on our analysis of data from the 1994 HRS. We also provide tests of whether improvements exceeded what would have been expected due to changes in wording changes. In doing so, we assume that sensitivities to question wording do not vary across disease groups or by medication use. Justification for this decision is provided in Appendix II.
Two additional potential threats to the validity of comparisons between the 1992 and 1998 waves are worth noting. First, only the 1998 wave is subject to loss-to-follow-up. We computed that 4,674 of the 9,573 respondents in 1992 were alive and fell into the 51-61 age range in 1998. Approximately 15% (n=695) of this group was missing the 1998 interview. In the elderly population, persons lost to follow-up generally are more functionally impaired than those reinterviewed (Aykan et al., 1998), and loss-to-follow-up can lead to overstated declines. In our investigation of this issue we found just the opposite--that is, those lost to follow-up had on average fewer functional limitations at baseline than those successfully reinterviewed in 1998 (1.52 vs 1.58, difference not significant at 0.05). Thus, any bias introduced is likely to be small and against finding a decline.
Second, the preferred mode of data collection differed for the two survey waves. In 1992, the preferred mode was a face-to-face. In subsequent waves, including 1998, telephone interviews became the preferred mode for all respondents except those cohorts newly added to the survey. An experimental design built into the second wave of the Asset and Health Dynamics of the Oldest Old (AHEAD) study (HRSs sister survey), suggests that no major differences exist in data quality between phone and face-to-face interviews (Herzog and Rodgers, 1999). We attempt to account for differences between 1992 and 1998 in interview mode by controlling statistically for mode in our multivariate analyses.
2. Comparisons of Functioning in 1994 and 2000
To circumvent question wording changes and directionality issues, we also analyze aggregate level changes in functioning between 1994 and 2000. We use as predictors of functional limitations in 1994 and 2000 characteristics measured in 1992 and 1998, respectively.
The 1994 and 2000 samples include survivors from 1992 and 1998, respectively, who were not lost to follow-up. That is respondents are ages 53-63 in 1994 and 2000. We analyze both complete samples and condition-specific samples (see Table 2 for relevant sample sizes).
| TABLE 2. Sample Sizes for All 53-63 Year Olds and For Those with Specific Chronic Conditions: 1994 and 2000 | |||
| Condition | 1994 | 2000 | |
| All 53-63 year olds (complete sample) | 8,618 | 6,486 | |
| Hypertension | 3,412 | 2,510 | |
| Diabetes | 938 | 730 | |
| Lung disease | 682 | 423 | |
| Stroke | 243 | 200 | |
| Arthritis | 3,312 | 2,822 | |
| NOTE: Conditions for 1994 and 2000 samples are from reports in 1992 and 1998, respectively. | |||
The 1994 and 2000 samples provide the advantage of uniform wording of the functional limitation questions and lagged measurement of medication use. In addition, the preferred mode in both 1994 and 2000 was the telephone interview. By limiting our analysis to those who also appear in the 1994 and 2000 samples, however, we potentially introduce additional biases due differential to loss to follow-up. That is, if the link between functioning, medication use, and loss to follow-up differed between 1992-1994 and 1998-2000, then we could introduce bias into our comparisons over time.
Overall, re-interview rates between 1992-1994 and 1998-2000 were quite high (see Table 3). Only 8.6% of those interviewed in 1992 were lost to follow-up and another 1.3% died by 1994. Data are not yet available that allow us to distinguish between deaths and loss to follow-up between 1998 and 2000; however, only 8.6% of those interviewed in 1998 were not re-interviewed in 2000, suggesting that the loss to follow-up rate is slightly lower between 1998 and 2000 than between 1992 and 1994
| TABLE 3. Percentage of Respondents Re-Interviewed, Lost to Follow-Up and Deceased between 1992-1994 and 1998-2000 | |||
| 1992-1994 | 1998-2000 | ||
| Re-interviewed | 90.1 | 91.4 | |
| Lost to Follow-up | 8.6 | NA | |
| Deceased | 1.3 | NA | |
| Lost to Follow-up or Deceased | NA | 8.6 | |
We also examined for 1992-1994 whether those lost to follow-up had different baseline functional limitations from those re-interviewed. Among those who appeared in 1992 who were alive but not re-interviewed in 1994, the mean number of limitations in 1992 was 1.73. The mean number of limitations in 1992 among those appearing in both 1992 and 1994 was 1.72. This finding suggests that the threat to point estimates from differential loss to follow-up is likely to be minimal.
E. Statistical Approach
Each of the questions posed above involves a slightly different statistical approach.
To answer whether reports of functional limitations declined over time, we use a one-tailed t-test for differences in means. For the 1992 and 1998 comparisons, we present the actual data and corrected estimates for 1992. Our corrected estimates are based on our analysis of the 1994 wave of the HRS, in which we found that on average, the 1992 questions result in 0.168 more functional limitations than the 1998 approach. We therefore subtract 0.168 from the 1992 actual estimates to obtain 1992 corrected estimates. Justification for applying this correction factor to the complete and condition-specific 1992 samples is presented in Appendix II. For the 1994 and 2000 comparisons, we also provide one-tailed t-tests for differences in means (but no correction is needed).
To answer whether reports of chronic conditions and medication use increased over time, we provide X2 tests for differences between 1992 and 1998.
To address whether changes in medication use can be linked to improvements in functioning, we present a series of four nested regression models3:
-
Model 1 contains only an indicator of year.
-
In Model 2, we introduce a group of socioeconomic and demographic characteristics, including age group (51-56 vs. 57-61 in 1992 and 1998 and 53-58 and 59-63 in 1994 and 2000), sex, race (White vs. non-White), ethnicity (Hispanic vs. non-Hispanic), marital status (married vs. unmarried), education (high school or less vs. more than high school), and ownership of liquid assets (checking or savings account, CDs, or stocks). We also include in Model 2 two indicators of circumstances surrounding the interview, namely whether the interview was conducted over the telephone and whether a proxy respondent was interviewed.
-
Model 3 includes all the variables in Model 2 plus a measure of obesity (body mass index >30) and indicators of the presence of the five chronic conditions of interest in this analysis: hypertension, diabetes, lung disease, stroke, and arthritis.4
-
Finally, Model 4 distinguishes for each chronic condition those who report having the condition but do not report taking medication for it and those who report having the condition and taking medication.5
For the models estimated with the 1992 and 1998 samples, we test whether the year coefficient is different from the change that would be expected due to question wording changes (0.168). The test is an F-test with one degree of freedom. For the models estimated with the 1994 and 2000 samples, we test whether the year coefficient is different from zero.
Finally, we explore whether improvements over time have been greater for groups using medication. For each chronic condition we present changes over time in functioning for (1) those reporting the condition but not medication use and (2) those reporting the condition and medication use. For each group we test whether the change is greater than 0.168 (for 1992-1998) and from 0.0 (for 1994-2000). We also test whether changes over time differ across the three groups.
We also model differences across these groups, controlling for differences in demographic and socioeconomic characteristics. To accomplish this, we add to each condition-specific Model 4 (described above) interactions between year and reported medication use. We compare the year effects for groups reporting and not reporting medication use for a given condition.
-
For the models estimated with the 1992 and 1998 samples, we test whether the year effect for each medication use group is different from the change that would be expected due to question wording changes (0.168). The test is an F-test with one degree of freedom. We also provide tests of whether year effects differ across the medication use groups (e.g., we compare changes over time for those reporting medication and those reporting no medication use for a given condition).
-
For the models estimated with the 1994 and 2000 samples, we test whether the year effects for each medication group are different from zero. We also test whether changes over time are different for those reporting and not reporting medication sue for a given condition.
F. Exploration of Design Effect Adjustments to Variances in Statistical Tests
The complex design of the HRS has implications for both estimates and variance calculations upon which we base our statistical tests. Because the HRS over-sampled several groups, we calculate all year effects (both descriptive changes and model estimates) using sampling weights.
In addition, because of the sampling weights, the geographic clustering, and the fact that 3,588 appear in both the 1992 and 1998 waves (the sample overlap), variance estimates produced by SAS under the assumption of simple random sample will not be correct. The sampling weights and geographic clustering require simple random sample variance estimates to be inflated. In contrast, the increased correlation introduced by having an overlapping sample will necessitate the simple random sample variances be reduced.
In our discussions of this problem with the University of Michigan statistical staff, and our extensive exploration of this problem with STATA and SUDAAN, we have found that neither package can accommodate all three survey design issues simultaneously in calculating a design effect for year effects. We have therefore developed an approach in which we use SUDAAN to calculate design effects due to weighting and clustering and then we externally calculate an additional downward adjustment due to the correlation introduced by the sample overlap.
Ideally, this approach should be implemented on a model specific basis. However, in most instances the results we present for year effects in this report are either highly significant (e.g., p0.01) or not any where near significant (e.g., p>0.10). Moreover, in our experience making these calculations for comparisons of cognitive functioning between 1993 and 1998, we found overall design effects to be quite small (1.2).
Because of the intense labor involved in making these calculations, we instead chose a more cost-effective approach of estimating a single, conservative (large) design effect, based on a model containing only year and estimated for the complete sample. Using SUDAAN, we estimated a design effect due to weighting and clustering of 1.8. Based on a formula provided by Kish (1965, p. 457-458), we calculated an overlap adjustment of 0.86. This resulted in an overall design effect of 1.55.
Rather than incorporate these design effects explicitly into the statistical tests presented in the table, we instead present tests based on simple random sample assumptions and note in the text where these conclusions might be sensitive to design effects.
V. AGGREGATE CHANGES IN FUNCTIONING AND MEDICATION USE
A. Have Reports of Functional Limitations Declined Over Time Among 51-61 Year Olds?
Comparison of 1992 and 1998. After applying corrections for wording changes, we estimate that between 1992 and 1998, the average number of functional limitations reported by 51-61 year olds declined from 1.57 to 1.34 (p0.01) (see Table 4). Fewer functional limitations were reported by subgroups of respondents with four of the five chronic conditions considered here: hypertension, diabetes, stroke, and arthritis. Only those reporting lung disease did not report significantly fewer limitations in 1998 than in 1992.
| TABLE 4. Mean Number of Functional Limitations for All 51-61 Year Olds and For Those with Specific Chronic Conditions: 1992 and 1998 | |||||
| Actual 1992 | Corrected 1992 | 1998 | Actual Change | Corrected Change | |
| All 51-61 year olds | 1.74 | 1.57 | 1.34 | -0.40 | -0.23** |
| By Chronic Condition: | |||||
| Hypertension | |||||
| No | 1.49 | 1.32 | 1.11 | -0.38 | 0.21** |
| Yes | 2.15 | 1.99 | 1.74 | -0.41 | -0.24 |
| Diabetes | |||||
| No | 1.64 | 1.47 | 1.24 | -0.40 | -0.23** |
| Yes | 2.69 | 2.52 | 2.24 | -0.45 | -0.28** |
| Lung disease | |||||
| No | 1.63 | 1.46 | 1.25 | -0.38 | -0.21** |
| Yes | 2.98 | 2.81 | 2.69 | -0.29 | -0.12 |
| Stroke | |||||
| No | 1.69 | 1.52 | 1.29 | -0.40 | -0.24** |
| Yes | 3.55 | 3.38 | 2.96 | -0.59 | -0.42* |
| Arthritis | |||||
| No | 1.22 | 1.05 | 0.74 | -0.47 | -0.30** |
| Yes | 2.62 | 2.45 | 2.27 | -0.35 | -0.18** |
| * p0.05; ** p0.01 | |||||
Comparison of 1994 and 2000. When the samples are limited to those surviving from 1992 to 1994 and from 1998 to 2000, however, no decline in functional limitations is observed for 51-61 year olds (Table 5). Among those reporting no arthritis, functioning improved marginally from an average of 0.90 limitations in 1994 to 0.81 limitations in 2000. In contrast, among those with arthritis, reports of limitations increased from an average of 2.19 to 2.31.
| TABLE 5. Mean Number of Functional Limitations for All 53-63 Year Olds and For Those with Specific Chronic Conditions: 1994 and 2000 | |||
| 1994 | 2000 | Change | |
| All 53-63 year olds | 1.39 | 1.40 | 0.00 |
| By Chronic Condition: | |||
| Hypertension | |||
| No | 1.16 | 1.16 | -0.01 |
| Yes | 1.77 | 1.84 | 0.06 |
| Diabetes | |||
| No | 1.29 | 1.29 | 0.01 |
| Yes | 2.39 | 2.34 | -0.05 |
| Lung disease | |||
| No | 1.28 | 1.31 | 0.03 |
| Yes | 2.69 | 2.75 | 0.06 |
| Stroke | |||
| No | 1.36 | 1.35 | -0.01 |
| Yes | 2.88 | 3.12 | 0.24 |
| Arthritis | |||
| No | 0.91 | 0.81 | -0.10** |
| Yes | 2.19 | 2.31 | 0.12 |
| NOTE: Conditions for 1994 and 2000 samples based on reports from 1992 and 1998, respectively. * p0.05; ** p0.01 | |||
B. Have Reports of Chronic Conditions and Medication Use Increased Over Time Among 51-61 Year Olds?
Changes in chronic conditions. Table 6 shows reports by near-elderly Americans about the presence of five chronic conditions in 1992 and 1998. Reports for three of the five conditions--diabetes, stroke, and arthritis--have increased, but this change is statistically significant only for arthritis.6 During the same time period reports of hypertension and lung disease declined.
These findings are fairly consistent with published results from the Supplements on Aging to the National Health Interview Survey, which show an increased prevalence of diabetes, stroke, and arthritis, and a decreased prevalence of hypertension between 1984 and 1995 among the non-institutionalized elderly population ages 70 and older (Freedman and Martin, 2000; Crimmins and Saito, 2000; Liao et al., 2001). Similarly, published results from the National Long Term Care Survey (Manton et al., 1995) indicate a higher prevalence of diabetes and a lower prevalence of hypertension in 1989 than in 1982 among the non-institutionalized older population ages 65 and older.
| TABLE 6. Percentage of Americans Ages 51-61 Reporting Select Chronic Conditions, 1992 and 1998 | |||
| Condition | 1992 | 1998 | Change |
| Hypertension | 38.1 | 35.9 | -2.2** |
| Diabetes | 9.9 | 10.0 | +0.1 |
| Lung disease | 8.2 | 6.0 | -2.2** |
| Stroke | 2.6 | 2.9 | +0.3 |
| Arthritis | 37.5 | 39.0 | +1.5* |
| * p0.05; ** p0.01 | |||
Changes in reported medication use for select chronic conditions. As shown in Table 7, statistically significant increases in reports of medication use are observed for hypertension and diabetes. In 1998, nearly 75% of persons ages 51-61 reporting hypertension reported taking medication, up from 64% in 1992. Similarly, 77% of persons ages 51-61 with diabetes reported medication use, up from 62% in 1992.
| TABLE 7. Percentage of Americans Ages 51-61 Reporting Medication Use for Select Chronic Conditions, 1992 and 1998 | |||
| Condition | 1992 | 1998 | Change |
| Hypertension | 64.2 | 74.5 | 10.3** |
| Diabetes | 61.7 | 77.1 | 15.4** |
| Lung disease | 34.9 | 40.2 | 5.3 |
| Stroke | 40.6 | 37.8 | -2.9 |
| Arthritis | 36.3 | 38.5 | 2.2 |
| * p0.05; ** p0.01 | |||
From these data it appears that medication use has increased among Americans ages 51-61 with hypertension and with diabetes. It is possible that such increases in use may be contributing to improvements in functioning between 1992 and 1998 and to stabilized functioning between 1994 and 2000. Although the rates of reported medication use for other conditions, such as arthritis, stroke, and lung disease, appear to be stable over time, it may be that the changes in the type of medication--and consequently changes in the effectiveness of treatment--may be contributing to improvements in functioning. We explore the linkages between medication use and functioning in the next section.
C. What Other Characteristics Have Changed Among 51-61 Years Old from 1992 to 1998 and Did Functioning Change for Those Groups?
As shown in Table 8, compared to 1992, in 1998 Americans ages 51-61 were slightly younger and more likely to be Hispanic, unmarried, and to have completed years of education beyond high school. Interviews in 1998 were much more likely than in 1992 to be completed over the phone and slightly more likely to be carried out with a proxy. The prevalence of obesity also increased dramatically from 21% in 1992 to over 27% in 1998, an increase of over 25% in 6 years.
With the notable exception of non-Whites, all other groups experienced significant improvements in functioning between 1992 and 1998 (see Table 9).7 In contrast, from 1994 to 2000 (see Table 10), most groups did not experience improvements and a few experienced worsening in functioning. Two notable exceptions experiencing improvements in functioning were unmarried persons and the relatively small group of Americans reporting no liquid assets. Interestingly, those with more than a high school education experienced significantly more limitations in 2000 than in 1994.8
| TABLE 8. Distribution of Demographic and Socioeconomic Characteristics Among Americans Ages 51-61, 1992 and 1998 | |||
| Characteristics | 1992 % | 1998 % | Change |
| Age | |||
| 51-56 | 58.2 | 61.9 | 3.7** |
| 57-61 | 41.8 | 38.1 | |
| Sex | |||
| Male | 47.8 | 47.4 | -0.4 |
| Female | 52.2 | 52.6 | |
| Race | |||
| White | 86.3 | 85.7 | -0.6 |
| Non-White | 13.7 | 14.3 | |
| Ethnicity | |||
| Hispanic | 6.4 | 7.6 | 1.2** |
| Non-Hispanic | 93.6 | 92.4 | |
| Marital Status | |||
| Married | 76.8 | 71.7 | -5.1** |
| Unmarried | 23.2 | 28.3 | |
| Completed Education | |||
| High school | 62.1 | 52.9 | 9.2** |
| >High school | 37.9 | 47.1 | |
| Liquid Assets | |||
| Yes | 84.7 | 85.0 | 0.3 |
| No | 15.3 | 15.0 | |
| Interview Status | |||
| Phone | 6.5 | 62.8 | 56.3** |
| Face-to-fact | 93.5 | 37.2 | |
| Response Status | |||
| Proxy | 4.6 | 6.3 | 1.7** |
| Self | 95.4 | 93.7 | |
| Obese | |||
| Yes | 21.4 | 27.3 | 5.9** |
| No | 78.6 | 72.7 | |
| * p0.05; ** p0.01 | |||
| TABLE 9. Mean Number of Functional Limitations Among Americans Ages 51-61 by Demographic and Socioeconomic Characteristics, 1992 and 1998 | |||||
| Characteristics | Actual 1992 | Corrected 1992 | 1998 | Actual Change | Corrected Change |
| Age | |||||
| 51-56 | 1.64 | 1.47 | 1.26 | -0.38 | 0.21** |
| 57-61 | 1.88 | 1.71 | 1.47 | 0.41 | -0.24** |
| Sex | |||||
| Male | 1.40 | 1.23 | 1.08 | -0.32 | 0.16** |
| Female | 2.05 | 1.88 | 1.57 | -0.48 | 0.31** |
| Race | |||||
| White | 1.70 | 1.53 | 1.27 | -0.43 | -0.27** |
| Non-White | 1.99 | 1.82 | 1.77 | -0.22 | -0.05 |
| Ethnicity | |||||
| Hispanic | 2.09 | 1.92 | 1.62 | -0.47 | -0.30** |
| Non-Hispanic | 1.72 | 1.55 | 1.31 | -0.40 | -0.23** |
| Marital Status | |||||
| Married | 1.65 | 1.48 | 1.23 | -0.41 | 0.25** |
| Unmarried | 2.05 | 1.88 | 1.60 | -0.45 | -0.28** |
| Completed Education | |||||
| High school | 1.99 | 1.82 | 1.62 | -0.37 | -0.21** |
| >High school | 1.33 | 1.16 | 1.02 | -0.31 | -0.14** |
| Liquid Assets | |||||
| Yes | 1.59 | 1.42 | 1.23 | -0.36 | -0.19** |
| No | 2.55 | 2.39 | 1.95 | -0.61 | -0.44** |
| Obese | |||||
| Yes | 2.30 | 2.14 | 1.84 | -0.47 | -0.30** |
| No | 1.59 | 1.42 | 1.15 | -0.44 | -0.27** |
| ** p0.01 | |||||
| TABLE 10. Mean Number of Functional Limitations Among Americans Ages 53-63 by Demographic and Socioeconomic Characteristics, 1994 and 2000 | |||
| Characteristics | 1994 | 2000 | Change |
| Age in 92/98 | |||
| 51-56 | 1.30 | 1.32 | 0.02 |
| 57-61 | 1.52 | 1.52 | 0.01 |
| Sex | |||
| Male | 1.10 | 1.10 | 0.00 |
| Female | 1.65 | 1.66 | 0.00 |
| Race | |||
| White | 1.33 | 1.32 | 0.00 |
| Non-White | 1.82 | 1.85 | 0.03 |
| Ethnicity | |||
| Hispanic | 1.88 | 1.72 | -0.16 |
| Non-Hispanic | 1.36 | 1.37 | 0.01 |
| Marital Status | |||
| Married | 1.28 | 1.30 | 0.01 |
| Unmarried | 1.76 | 1.65 | -0.11* |
| Completed Education | |||
| High school | 1.68 | 1.74 | 0.06 |
| >High school | 0.94 | 1.02 | 0.08* |
| Liquid Assets | |||
| Yes | 1.23 | 1.28 | 0.05 |
| No | 2.38 | 2.13 | -0.25** |
| Obese | |||
| Yes | 1.93 | 1.89 | -0.04 |
| No | 1.25 | 1.21 | -0.04 |
| * p0.05; ** p0.01 | |||
VI. LINKING MEDICATION USE AND FUNCTIONING
A. Do Changes in Medication Use Account for Changes in Functional Limitations from 1992 to 1998?
In Table 11 we show results from several regression models in which the outcome is number of functional limitations among 51-61 year olds. The test of the model coefficient Year=1998 indicates whether the change in mean number of limitations between 1992 and 1998 was different from zero. The F-test at the bottom of the table indicates whether the change over time exceeded 0.168 (i.e., what was expected due to changes in question wording).
In the model containing only an indicator of year, we find that between 1992 and 1998, the mean number of limitations declined by 0.40. Controlling for demographic and socioeconomic factors accounts about 40% of the decline, attenuating it to -0.24. That is, increases in educational attainment, wealth, and the growing ranks of men, appear to account for much of the improvement. When we add controls for changes in the chronic condition profile (including obesity, hypertension, diabetes, lung disease, stroke, and arthritis), the change increases to -0.31. That is, had chronic conditions not increased over this time period, limitations would have declined even more than they did. Adding information about medication does not change this finding appreciably. That is, medication use does not appear to account for any of the improvements in functioning beyond that explained by demographic and socioeconomic characteristics.
The F-tests indicate that even after controlling for socioeconomic and demographic changes, chronic conditions, and medication use, the average number of functional limitations declined beyond what would been expected due to question wording changes.
Similar results are evident when we focus on subgroups of people with specific chronic conditions (see Table 12). For the five conditions considered here we find statistically significant declines, ranging from 0.29 to 0.59, depending on the condition. For all conditions except lung disease these declines are in excess of changes due to question wording.
Controlling for shifts in the demographic and socioeconomic composition of the population account for a sizeable portion of the decline--about half for arthritis and hypertension and nearly the entire decline for diabetes and stroke. Changes in the chronic condition profile work in the opposite direction, offsetting some of the decline. For four of the five conditions, medication use does not further explain any of the declines. Only among those reporting a stroke does the coefficient on year attenuate when information about medication use is included (e.g., from -0.34 to -0.26), but neither effect is statistically different from finding no change.
| TABLE 11. Change in Mean Number of Limitations Between 1992 and 1998 Among 51-61 Year Olds, Controlling for Socioeconomic and Demographic Changes, Chronic Conditions, and Medication Use | ||||
| Variable | Model 1 B | Model 2 B | Model 3 B | Model 4 B |
| Intercept | 1.74** | 3.08** | 1.77** | 1.73** |
| Year=1998 (vs. 1992) | -1.40** | -0.24** | -0.31** | -0.32** |
| Ages 51-56 (vs. 57-61) | --- | -0.24** | -0.06* | -0.06* |
| Male (vs. female) | --- | -0.51** | -0.41** | -0.38** |
| White (vs. non-White) | --- | -0.11* | -0.03 | -0.01 |
| Hispanic (vs. non-Hispanic) | --- | 0.01 | 0.13* | 0.11* |
| Currently married (vs. not) | --- | -0.16** | -0.08** | -0.07* |
| Completed >high school (vs. high school) | -- | -0.47** | -0.29** | -0.30** |
| Owner of liquid assets (vs. not) | --- | -0.64** | -0.45** | -0.41** |
| Phone interview (vs. in-person) | --- | -0.20** | -0.16** | -0.16** |
| Proxy interview (vs. self) | --- | -0.05 | 0.04 | 0.03 |
| Obese (bmi >30 vs. 30) | --- | --- | 0.35** | 0.31** |
| Hypertension | --- | --- | 0.29** | --- |
| Diabetes | --- | --- | 0.51** | --- |
| Lung disease | --- | --- | 0.90** | --- |
| Stroke | --- | --- | 1.29** | --- |
| Arthritis | --- | --- | 1.16** | --- |
| Hypertension, no medication | --- | --- | --- | 0.25** |
| Diabetes, no medication | --- | --- | --- | 0.26** |
| Lung disease, no medication | --- | --- | --- | 0.43** |
| Stroke, no medication | --- | --- | --- | 0.50** |
| Arthritis, no medication | --- | --- | --- | 0.65** |
| Hypertension, medication | --- | --- | --- | 1.13** |
| Diabetes, medication | --- | --- | --- | 1.07** |
| Lung disease, medication | --- | --- | --- | 1.46** |
| Stroke, medication | --- | --- | --- | 0.78** |
| Arthritis, medication | --- | --- | --- | 1.85** |
| Test of change between 1992 and 1998, corrected for wording change F-value, 1 d.f. | 64.67** | 4.39* | 18.32** | 22.70** |
| * p0.05; ** p0.01 | ||||
| TABLE 12. Change in Mean Number of Limitations Between 1992 and 1998 Among 51-61 Year Olds with Specific Chronic Conditions, Controlling for Socioeconomic and Demographic Changes, Chronic Conditions, and Medication Use | ||||||||
| Condition Group | Model 1 | Model 2 | Model 3 | Model 4 | ||||
| B | F, 1 d.f. | B | F, 1 d.f. | B | F, 1 d.f. | B | F, 1 d.f. | |
| Hypertension | -0.41** | 22.73** | -0.21** | 0.37 | -0.33** | 8.76** | -0.34** | 10.10** |
| Diabetes | -0.45** | 7.25** | -0.07 | 0.59 | -0.19 | 0.04 | -0.19 | 0.03 |
| Lung disease | -0.29* | 0.91 | 0.07 | 1.69 | -0.16 | 0.00 | -0.17 | 0.00 |
| Stroke | -0.59** | 3.88* | -0.08 | 0.10 | -0.34 | 0.45 | -0.26 | 0.12 |
| Arthritis | -0.35** | 12.76** | -0.16* | 0.03 | -0.19** | 0.16 | -0.22** | 0.70 |
| NOTE: See text or Table 11 for control variables in each model.* p0.05; ** p0.01 | ||||||||
B. Do Changes in Medication Use Account for Changes in Functional Limitations from 1994 to 2000?
When we focus on the years 1994 and 2000, a slightly different picture emerges (Table 13). For the entire sample of 51-61 year olds, we find no change in the mean number of limitations reported. Controlling for demographic and socioeconomic characteristics suggests that functioning might have worsened had those factors not also changed over this period. Additional controls for the chronic disease profile suggest that functioning would not have worsened had the chronic disease profile not also changed. Medication use did not account for any of the changes in functioning between 1994 and 2000.
| TABLE 13. Change in Mean Number of Limitations Between 1994 and 2000 Among 53-63 Year Olds | ||||
| Variable | Model 1 B | Model 2 B | Model 3 B | Model 4 B |
| Intercept | 1.39** | 2.89** | 1.62** | 1.58** |
| Year=2000 (vs. 1994) | 0.00 | 0.10** | 0.04 | 0.04 |
| Ages 53-58 (vs. 59-63) | --- | -0.19** | -0.02 | -0.01 |
| Male (vs. female) | --- | -0.46** | -0.37** | -0.35** |
| White (vs. non-White) | --- | -0.18** | -0.10** | -0.08* |
| Hispanic (vs. non-Hispanic) | --- | 0.04 | 0.16** | 0.15** |
| Currently married (vs. not) | --- | -0.19** | -0.10** | -0.09** |
| Completed >high school (vs. high school) | -- | -0.56** | -0.39** | -0.40** |
| Owner of liquid assets (vs. not) | --- | -0.75** | -0.55** | -0.52** |
| Phone interview (vs. in-person) | --- | -0.09* | -0.05 | -0.05 |
| Proxy interview (vs. self) | --- | -0.02 | 0.06 | 0.06 |
| Obese (bmi >30 vs. 30) | --- | --- | 0.33** | 0.29** |
| Hypertension | --- | --- | 0.27** | --- |
| Diabetes | --- | --- | 0.56** | --- |
| Lung disease | --- | --- | 0.93** | --- |
| Stroke | --- | --- | 1.13** | --- |
| Arthritis | --- | --- | 1.08** | --- |
| Hypertension, no medication | --- | --- | --- | 0.23** |
| Diabetes, no medication | --- | --- | --- | 0.26** |
| Lung disease, no medication | --- | --- | --- | 0.51** |
| Stroke, no medication | --- | --- | --- | 0.56** |
| Arthritis, no medication | --- | --- | --- | 0.72** |
| Hypertension, medication | --- | --- | --- | 1.09** |
| Diabetes, medication | --- | --- | --- | 1.02** |
| Lung disease, medication | --- | --- | --- | 1.13** |
| Stroke, medication | --- | --- | --- | 0.74** |
| Arthritis, medication | --- | --- | --- | 1.69** |
| NOTE: Variables other than year and age measured in 1992 and 1998 for observations in 1994 and 2000, respectively.* p0.05; ** p0.01 | ||||
Results are similar when we focus on subgroups of people with specific chronic conditions (Table 14). We do not find statistically significant declines in functional limitations for any of the five conditions and show statistically significant increases in limitations for those with arthritis.
Had shifts in the demographic and socioeconomic composition of the population not occurred, functional limitations would have increased for hypertension, stroke, and arthritis. Changes in the chronic condition profile work in the opposite direction, offsetting some of this increase. For all five conditions, medication use does not further explain any of the change in functioning.
| TABLE 14. Change in Mean Number of Limitations Between 1994 and 2000 Among 53-63 Year Olds Reporting Specific Chronic Conditions | ||||
| Condition Group | Model 1 B | Model 2 B | Model 3 B | Model 4 B |
| Hypertension | 0.06 | 0.23** | 0.11 | 0.10 |
| Diabetes | -0.05 | 0.17 | 0.06 | 0.07 |
| Lung disease | 0.06 | 0.30 | 0.05 | 0.03 |
| Stroke | 0.24 | 0.66* | 0.44 | 0.42 |
| Arthritis | 0.12* | 0.32** | 0.30** | 0.29** |
| NOTE: See text or Table 13 for control variables in each model.* p0.05; ** p0.01 | ||||
C. Do Aggregate Changes in Functioning from 1992 to 1998 Vary by Reports of Chronic Conditions and Medication Use?
If changes in the type of medication--and consequently changes in the effectiveness of treatment--are contributing to improvements in functioning, we would expect to see greater improvements in functioning among those reporting medication use compared to those who are not currently receiving treatment. In Figure 2 we show for Americans ages 51-61 with each of the five chronic conditions, the mean number of functional limitations in 1992 and 1998 for those reporting for the select condition (1) no medication use and (2) medication use.
Two patterns are noteworthy. First, for all five conditions those reporting medication use have more functional limitations on average than those reporting no medication use. The relationship likely reflects disease severity: that is, those with more severe chronic conditions are more likely to be put on medication and are also more likely to have functional impairments.
Second, the improvements do not appear to be greater for those reporting medication use. For those reporting diabetes, only those not on medication report statistically significant improvements in functioning over time. For those reporting hypertension and arthritis, functioning improved for both persons on medication and not on medication. Statistical tests for differences in improvements by medication use (not shown) were not, however, statistically significant.
| FIGURE 2. Mean Number of Functional Limitations in 1992 and 1998 Among Older Americans Reporting Select Chronic Conditions, by Medication Use |
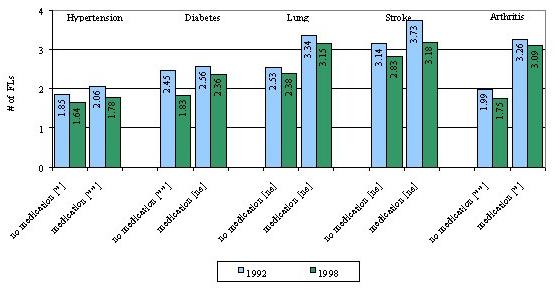 |
| ** p 0.01 | * p 0.05 | ns = not significant for differences between 1992 and 1998 |
| FIGURE 3. Mean Number of Functional Limitations in 1994 and 2000 Among Older Americans Reporting Select Chronic Conditions, by Medication Use |
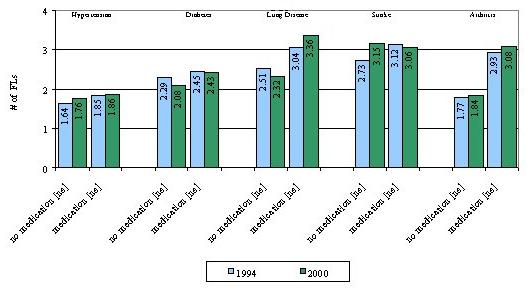 |
| ** p 0.01 | * p 0.05 | ns = not significant for differences between 1994 and 2000 |
When we control for potential differences between those reporting medication and their counterparts reporting no medication use (see Table 15), improvements in functioning are different for those reporting diabetes. However, among diabetics improvements are greater among those reporting no medication.
When we focus on changes in functioning between 1994 and 2000, a similar pattern is found (see Figure 3). That is, those reporting medication use for a given condition generally report more functional limitations than those reporting no medication use, but changes over time--which are for the most part not statistically significant from zero--are not different between medication users and non-users. Controlling for demographic and socioeconomic differences between groups by medication status (see Table 16), we find that functioning changes differed among those reporting lung disease. However, improvements were greater for those reporting no medication use and functioning appeared to worsen for those reporting being on medication for their lung condition.
In sum, we find no evidence that improvements in functioning were greater among those reporting medication use. For two conditions (diabetes and lung disease), improvements were limited to those reporting no medication use.
| TABLE 15. Change in Mean Number of Limitations Between 1992 and 1998 Among 51-61 Year Olds Reporting Specific Chronic Conditions, by Reported Medication Use | |||||
| Condition Group | Reporting No Medication Use for This Condition | Reporting Medication Use for This Condition | Test for Difference | ||
| Change in # of FLs | F, 1 d.f. | Change in # of FLs | F, 1 d.f. | ||
| Hypertension | -0.40** | 7.12** | -0.32** | 6.08* | |
| Diabetes | -0.50** | 3.03 | -0.08 | 0.44 | * |
| Lung disease | -0.22 | 0.08 | -0.08 | 0.19 | |
| Stroke | -0.11 | 0.03 | -0.45 | 0.72 | |
| Arthritis | -0.27** | 2.18 | -0.13 | 0.21 | |
| See test or Table 11 for control variables in each model.* p0.05; ** p0.01 | |||||
| TABLE 16. Change in Mean Number of Limitations Between 1994 and 2000 Among 53-63 Year Olds Reporting Specific Chronic Conditions, by Reported Medication Use | |||
| Condition Group | Reporting No Medication Use for This Condition(Change in # of FLs) | Reporting Medication Use for This Condition(Change in # of FLs) | Test for Difference |
| Hypertension | 0.10 | 0.11 | |
| Diabetes | -0.11 | 0.14 | |
| Lung disease | -0.23 | 0.47* | ** |
| Stroke | 0.58 | 0.19 | |
| Arthritis | 0.23** | 0.40** | |
| See test or Table 13 for control variables in each model.* p0.05; ** p0.01 | |||
VII. CONCLUSIONS
A. Summary of Findings
Our analysis provides limited support for improvements in functioning during the 1990s for Americans of pre-retirement age. However, our findings are sensitive to the year of choice: overall, improvements were observed for the years 1992 to 1998 but not for the years 1994 to 2000. Such year-to-year variation is also evident in old-age disability trend analyses (Schoeni, Freedman, and Wallace, 2001) and indeed underscores the need for analysis of multiple data sets and time points before drawing conclusions about functioning trends in this age group.
During the same period, reports of medication use also increased dramatically for two chronic conditions: hypertension and diabetes. For the other conditions considered here--lung disease, stroke, and arthritis--reports of medication use remained stable for this age group during the 1990s.
We were unable to find statistical evidence with these data linking medication use to improvements in functioning. Increases in medication use for the five conditions explored here do not appear to account for improvements in functioning, nor have improvements in functioning been greater for subgroups reporting medication use. For two of the five conditions (diabetes and lung disease), aggregate improvements were greater for those groups reporting no medication use.
B. Limitations
This study is limited in several important respects. First, our analysis is limited to reported medication use associated with five chronic conditions: hypertension, diabetes, lung disease, stroke, and arthritis. It may be that medication use for other disease processes has played an integral role in improving functioning. For example, pharmaceutical treatment of depression has increased markedly during the 1990s. Newer medications targeting the adverse side effects of cancer have also become more widely used. Estrogen therapy has also increased dramatically among post-menopausal women in the last two decades.
Second, we have not considered medical treatments beyond pharmaceutical agents. For example, surgical treatments for vision loss due to cataracts and glaucoma and for hip and knee replacements have also increased dramatically over the last decade. If the relative importance of medical treatment to recent trends in old-age functioning is to be fully understood, further study of the contribution of these important medical procedures is warranted.
Third, our analysis focuses on Americans ages 51-61. The largest improvements in functioning, however, have been observed for much older Americans (Freedman and Martin, 1998). It may be that the beneficial effects of medication use in mid-life are not fully apparent until late-life. Follow-up analyses with future waves of the HRS could provide valuable insight into the cumulative benefits of medication use in mid-life for old age functioning.
Finally, because of changes in question wording in the HRS, we excluded from our measure of functioning several mobility items that are typically included in functional limitation scales (e.g., walking one or several blocks, climbing one flight or several flights of stairs). It may be that medication use has a greater effect on mobility than on other body functions included here (e.g., picking up a dime, reaching, bending). In analyses not shown, we explored whether improvements in functioning between 1994 and 2000 would have occurred had we included these mobility items. We found just the opposite: when we included mobility items in the functional limitation scale, we found statistically significant increases in the mean number of functional limitations reported between 1994 and 2000. This finding persisted even after controlling for socioeconomic and demographic shifts, chronic conditions and reported medication.
C. Policy Implications
Our analysis provides a cautionary tale for policy makers. Simulations that assume continued declines in disability for several more decades at the rate observed for the 1980s and early 1990s (Singer and Manton, 1995; Cutler, 2001) are at best speculative. There is no guarantee that disability declines of the 1980s and early 1990s will continue into the future. Indeed, among the pre-retirement age cohorts we considered we found inconsistent findings depending on the years we selected for analysis. From 1992 to 1998 we found on average a 2.4% decline per year in the mean number of functional limitations. From 1994 to 2000, however, we found no change at all in functional limitations. Such inconsistencies should serve as a reminder to policy makers that assumptions about improvements in functioning in the future should be made cautiously.
Equally important, although most groups reported improvements between 1992 and 1998, non-Whites--a group well documented to be disadvantaged in terms of late-life health--did not experience gains in functioning. This finding may signal that the recent narrowing of the racial gap in old-age disability (Manton and Xu, 2000) may yet again reverse course in the near future as the remaining members of the birth cohorts of 1931-1941 enter old age.
In light of the focus of this report, the lack of improvement among non-Whites also raises the question of whether barriers to medication are somehow preventing this group from achieving parity with Whites. In additional analyses (not shown), we explored this possibility by comparing rates of medication use in 1992 and 1998 for Whites and non-Whites. We found that for each of the five conditions, non-Whites had as high or significantly higher rates of medication use than Whites in both 1992 and in 1998. In terms of changes in medication use, both Whites and non-Whites used significantly more medication for hypertension in 1998 than in 1992, but only Whites experienced increases in medication use for diabetes and lung disease. Given that the medication gap continues to favor non-Whites over Whites, it seems unlikely that the lack of improvement in functioning among non-Whites can be attributed to medication use or lack thereof.
Our analysis suggests that medication use does not appear to account for much of the changes in functioning during the 1990s among 50 year olds. Instead we find, consistent with previous studies (Freedman and Martin, 1999; Schoeni, Freedman, and Wallace, 2001; Waidman and Liu, 2000), increases in educational attainment appear to be important. Had education not increased, functioning would have improved only half as much as it did from 1992 to 1998. Freedman and Martins analysis of future education rates among older Americans (1998) suggests educational attainment will continue to increase over the next several decades, but not at the rates observed during the 1980s and early 1990s. Taken together these findings underscore the need for caution in projecting forward improvements in old-age functioning.
At the same time, consistent with an earlier analysis of the 70 and older population (Freedman and Martin, 2000), we found large increases in some of the most disabling conditions in our analytical sample of respondents in pre-retirement ages. Perhaps most importantly, obesity increased over 25% in just 6 years. Other studies have confirmed an obesity epidemic occurring in the United States that reaches down the age spectrum, affecting one in four of Americas children (Mokdad et al., 2001). Obesity has been linked not only to disability but also to heart disease, stroke, and diabetes. Studies of the implications of increases in obesity are clearly a critical next step for evaluating the likelihood of continued disability declines.
What does our analysis imply for a Medicare drug benefit recently debated in Congress? Unfortunately, with the data at hand, we cannot speak to the most critical question, namely, would a Medicare drug benefit fuel further declines in late-life disability rates? Nevertheless, our analysis does provide several limited insights. First, our analysis does not mean that medications do not improve the health of older Americans, only that in the aggregate medication use for a few highly prevalent conditions does not appear to explain improvements in the cohort recently nearing or entering retirement age. Second, our analysis also suggests that factors other than medication use are at work so prescription drugs are not the only vehicles toward improved health. Finally, we find that negative factors--primarily in the form of increased obesity--can offset the potential benefits of medication use and are therefore deserving of public attention. In particular, public health efforts aimed at preventing obesity earlier in life appear to be important in ensuring high functioning among the nations older population.
REFERENCES
Boult, C., Kane, R.L., Louis, T.A., Boult, L., and McCaffrey, D. 1994. Chronic conditions that lead to functional limitation in the elderly. Journal of Gerontology: Medical Sciences, 49(1):M28-M36.
Bush T.L., Miller, S.R., Golden, A.L. and Hale, W.E. 1987. Self-report and medical record report agreement of selected medical conditions in the elderly. American Journal Public Health, 79(11):1554-1556.
Cherry, D.K., Burt, C.W., and Woodwell, D.A. 2001. National Ambulatory Medical Care Survey: 1999 Summary. Advance Data No. 322. Hyattsville, MD: National Center for Health Statistics, http://www.cdc.gov/nchs/.
Clark, D.O., Stump, T.E., and Wolinsky, F.D. 1998. Predictors of mobility and basic ADL difficulty among adults aged 70 years and older. Journal of Aging and Health, 10:422-440.
Clark, D.O., Stump, T.E., Hui, S.L., and Wolinsky, F.D. 1997. Race- and gender- specific replication of five dimensions of functional limitation and disability. Journal of Aging and Health, 9:28-42.
Cotterchio, M., Kreiger, N., Darlington, G., and Steingart, A. 1999. Comparison of self-reported and physician-reported antidepressant medication use. Annals of Epidemiology, 9(5):283-289.
Cutler, D.M. 2001. Declining disability among the elderly. Health Affairs, November/December, 11-27.
Engstad T., Bonaa K.H., and Viitanen, M. 2000. Validity of self-reported stroke: The Tromso Study. Stroke, 31(7):1602-1607.
Freedman, V.A., and Martin, L.G. 1999. The Role of Education in Explaining and Forecasting Trends in Functional Limitations Among Older Americans. Demography, 36(4):461-473.
Freedman, V.A., and Martin, L.G. 1998. Understanding Trends in Functional Limitations Among Older Americans. American Journal of Public Health, 88:1457-1462.
Freedman, V.A., and Martin, L.G. 2000. Contribution of Chronic Conditions to Aggregate Changes in Old-Age Functioning. American Journal of Public Health, 90:1755-1760.
Fries, J.F., Williams, C.A., Morfeld, D., Singh, G., and Sibley, J. 1996. Reduction in long-term disability in patients with rheumatoid arthritis by disease-modifying antirheumatic drug-based treatment strategies. Arthritis Rheumatology, 39(4):616-622.
Heliovaara, M., Aromaa, A., Klaukka, T., Knekt, P., Joukamaa, M. and Impivaar, O. 1993. Reliability and validity of interview data on chronic diseases. The Mini-Finland Health Survey. Journal of Clinical Epidemiology, 46(2):181-191.
Herzog, A.R., and Rodgers, W.L. 1988. Interviewing older adults: Mode comparisons using data from a face-to-face survey and a telephone survey. Public Opinion Quarterly, 47:405-418.
Herzog, A.R., and Rodgers, W.L. 1999. Cognitive performance measures in survey research on older adults. In Schwarz, N., Park, D.C., Knauper, B., and Sudman, S. (Eds.) Cognition, Aging, and Self reports. Philadelphia: Psychology Press.
Johnson, R.J., and Wolinsky, F.D. 1993. The structure of health status among older adults: Disease, disability, functional limitation, and perceived health. Journal of Health and Social Behavior, 34:105-121.
Kehoe, R., Wu, S.Y., Leske, M.C., and Chylack L.T. Jr. 1994. Comparing self-reported and physician-reported medical history. American Journal of Epidemiology, 139(8):813-818.
Kish, L. 1965. Survey Sampling. New York: John Wiley & Sons.
Klungel, O.H., de Boer, A., Paes, A.H., Herings, R.M., Seidell, J.C., and Bakker, A. 1999. Agreement between self-reported antihypertensive drug use and pharmacy records in a population-based study in The Netherlands. Pharmacology World Science, 21(5):217-220.
Klungel, O.H., de Boer, A., Paes, A.H., Herings, R.M., Seidell, J.C., and Bakker, A. 2000. Influence of question structure on the recall of self-reported drug use. Journal of Clinical Epidemiology, 53(3):273-277.
Kriegsman, D.M., Penninx, B.W., van Eijk, J.T., Boeke, A.J., and Deeg, D.J. 1996. Self-reports and general practitioner information on the presence of chronic diseases in community dwelling elderly. A study on the accuracy of patients self-reports and on determinants of inaccuracy. J Clin Epidemiol, 49(12):1407-1417.
Luisi, A., Owens, N.J., and Hume, A.L. 1999. Drugs and the elderly. Chapter 5 in Gallo, J.J. et al. (Eds.) Clinical Aspects of Aging (5th Edition). Baltimore: Lippinott, Williams & Wilkens.
Manton, K.G., Stallard, E., and Corder, L. 1995. Changes in morbidity and chronic disability in the U.S. elderly population: Evidence for the 1982, 1984, and 1989 National Long Term Care Surveys. Journal of Gerontology, 50B(4):S194-S204.
Martin, L.M., Leff, M., Calonge, N., Garrett, C., and Nelson, D.E. 2000. Validation of self-reported chronic conditions and health services in a managed care population. American Journal of Preventive Medicine, 18(3):215-218.
Midthjell, K., Holmen, J., Bjorndal, A., and Lund-Larsen, G. 1992. Is questionnaire information valid in the study of a chronic disease such as diabetes? The Nord-Trondelag diabetes study. Journal of Epidemiology and Community Health, 46(5):537-542.
Mokdad, A.H., Bowman, B.A., Ford, E.S., Vinicor, F., Marks, J.S., and Koplan, J.P. 2001. The Continuing Epidemics of Obesity and Diabetes in the United States. Journal of the American Medical Association, 286(10):1195-1200.
Muhajarine, N., Mustard, C., Roos, L.L., Young, T.K., and Gelskey, D.E. 1997. Comparison of survey and physician claims data for detecting hypertension. Journal of Clinical Epidemiology, 50(6):711-718.
Paganini-Hill, A., and Ross, R.K. 1982. Reliability of recall of drug usage and other health-related information. American Journal of Epidemioogy, 116(1):114-122.
Rogowski, J., Lillard, L.A., and Kington, R. 1997. The financial burden of prescription drug use among elderly persons. Gerontologist, 37(4):475-482.
Schoeni, R., Freedman, V.A., and Wallace, R. 2001. Persistent, Consistent, Widespread, and Robust? Another Look at Recent Trends in Old-Age Disability. Journal of Gerontology: Social Sciences, 56B:S206-S218.
Singer, B.H., and Manton, K.G. 1998. The effects of health changes on projections of health service needs for the elderly population of the United States. Proceedings of the National Academy of Sciences USA, 95:15618-15622.
Sjahid, S.I., van der Linden, P.D., and Stricker, B.H. 1998. Agreement between the pharmacy medication history and patient interview for cardiovascular drugs: the Rotterdam elderly study. British Journal of Clinical Pharmacology, 45(6):591-595.
Spillman, B.C. 2001. Declines in Elderly Disability Rates: What Has Really Changed? Association for Health Services Research and Policy annual meeting, Atlanta, June 2001.
Van den Brandt, P.A., Petri, H., Dorant, E., Goldbohm, R.A., and Van de Crommert ,S. 1991. Comparison of questionnaire information and pharmacy data on drug use. Pharmacology Weekly Science, 13(2):91-96.
Verbrugge, L.M., and Jette, A. 1994. The disablement process. Social Science and Medicine, 38(1):1-14.
Verbrugge, L.M., Lepkowski, J.M., and Imanaka, Y. 1989. Comorbidity and its impact on disability. Milbank Memorial Fund Quarterly, 67(3-4):450-484.
Waidmann, T., and Liu, K. 2000. Disability trends among the elderly and implications for the future. Journal of Gerontology: Social Sciences, 55B:S298-S307.
Ward, M.M., and Fries, J.F. 1998. Trends in antirheumatic medication use among patients with rheumatoid arthritis, 1981-1996. Journal of Rheumatology, 25(3):408-416.
Zhang, Y., McAlindon, T.E., Hannan, M.T., Chaisson, C.E., Klein, R., Wilson, P.W., and Felson, D.T. 1998. Estrogen replacement therapy and worsening of radiographic knee osteoarthritis: The Framingham Study. Arthritis Rheumatology, 41(10):1867-1873.
NOTES
-
Previous studies have shown that functional limitation items generally scale into two highly correlated factors: upper and lower body limitations (Johnson and Wolinsky, 1993; Clark et al., 1997, 1998). We found that after eliminating the five mobility-related items, we were unable to support two separate factors. Consequently, we present here a single scale reflecting the total number of functional limitations reported (ranging from 0 to 7).
-
The surveys also asked about cancer, heart problems, and psychiatric problems but the wording of these questions changed substantially over time. To minimize the influence of question wording changes, we focus in this analysis on the five conditions asked consistently over time.
-
We also explored models (not shown) that explicitly capture heaping at zero (e.g., tobit models) but the results did not vary substantively from those presented here.
-
In the condition-specific models, indicators of the specific condition of interest are omitted but the remaining co-morbid conditions are controlled for.
-
Note that technically, Model 3 is not nested in Model 4. Instead, Model 3 can be considered a constrained version of Model 4. Models 1 and 2 are nested in both Models 3 and 4.
-
Increases in reports of arthritis may be sensitive to further design adjustments.
- The difference between Whites and non-Whites in terms of change (-0.27 vs -0.05) is statistically significant (test not shown; p0.05). There were also differences by mode of interview and proxy status, with improvements limited to those answering for themselves and those being interviewed in person. The latter is likely the result of changes in rules about preferred mode (see text for details).
-
Significant increases in limitations were also observed among those interviewed by phone and those with a proxy interview (not shown).
APPENDIX I. DEVELOPMENT OF A FUNCTIONAL LIMITATION SCALE THAT MINIMIZES SENSITIVITY TO QUESTION WORDING CHANGES
Introduction
The Health and Retirement Study (HRS) was designed in part to track changes in the health of pre-retirement age Americans. However, the functional limitation items were changed between 1992 and subsequent waves of the survey.
In the 1992 wave of the HRS, respondents were instructed, "We are interested in how much difficulty people have with various activities because of a health or physical problem. Exclude any difficulties that you expect to last less than three months." They were then asked: "How difficult is it for you to ___." Responses included not at all difficult; a little difficult; somewhat difficult; very difficult/can't do; and don't do. Because the question is asked in such a way that respondents are assumed to have some difficulty, we call this approach "leading."
In subsequent waves, the introduction and specific tasks were identical to those included in the core survey. However, for each item respondents were asked: "Because of a health problem do you have any difficulty with ___." Response options included yes, no, can't do, and don't do. Because the focus is on whether or not a respondent has difficulty, we call this approach "neutral."
To gauge the extent of inconsistencies between the two approaches, the 1994 wave included an experimental module that included the functional limitation items from the 1992 wave. Thus, for a randomly selected group of respondents ages 51-61 (N=564), answers to both sets of functional limitation items are available for the same point in time.
Here we explore the extent of discordance between the leading and neutral approaches. We also investigate whether eliminating items with high inconsistency results in a scale that is less sensitive to question wording changes without sacrificing internal consistency or predictive validity.
Our descriptive labels of "neutral" and "leading" are not intended to pre-judge which set of questions is a more valid indicator of functioning problems. There is no existing gold standard for measuring points along the disablement process. It may be that leading questions allow older persons who are reluctant to admit problems to speak more freely about their functioning difficulties (reducing type 2 error); conversely, it may be that such questions put suggestions of difficulty where there otherwise would not be any (increasing type 1 error). We do not attempt to disentangle such intricacies but instead limit ourselves to identifying a scale that is less sensitive to such question wording nuances.
Data
Data for this analysis come from the second wave of the HRS. The HRS is a national longitudinal study of the noninstitutionalized population conducted by the University of Michigan with funding from the National Institute on Aging. The HRS began in 1992 with a cohort of respondents born between 1931 and 1941 (i.e., age 51-61 in 1992) and their spouses. In the HRS, a complex sample design was used, in which Blacks, Hispanics, and residents of Florida were over-sampled. We account for this complex design in our analyses by using sampling weights. Follow-up interviews have been conducted every two years. Response rates in 1992 and 1994 were 81.7 percent and 89.2 percent, respectively. Weights have been post-stratified to the 1994 CPS to account for differential loss-to-follow-up by age, sex, race and ethnicity, and marital status groups. The overwhelming majority of these respondents answered both the core and experimental module for themselves; 555 out of 564 were indicated to be self-respondents.
For this analysis we constructed dichotomous indicators of any difficulty. Respondents answering yes, can't do and don't do to the neutrally worded questions were classified as having difficulty. For the leading questions, respondents answering a little, somewhat, very difficult/can't do, and don't do were classified as having difficulty. For each approach we also constructed summary indicators of having one or more functional limitation and a count of the number of functional limitations.
Statistical Methods
To assess the extent of external consistency between the leading and neutral approaches, we calculated p-values associated with chi-square statistics for differences between leading and neutral questions in the prevalence of difficulty with each specific activity and with one or more functional limitations. We also calculated t-statistics associated with differences using each approach in the mean number of functional limitations reported.
Based on these descriptive results we identified items with particularly poor agreement to be removed sequentially from the full 12-item scale. We began by removing items with the highest percentage of respondents providing inconsistent responses. When an item used as a lead-in to a skip pattern (i.e., jogging, climbing several flights of stairs) was removed, we also removed the items embedded in that skip (i.e., walking several blocks and walking one block, which were embedded in the jogging item; climbing one flight of stairs, which was embedded in climbing several flights of stairs). We removed items sequentially until no additional improvement in agreement was observed.
For each scale we calculated measures of agreement, reliability, and predictive validity. We used Cronbach's alpha as a measure of reliability; this statistic quantifies the internal consistency of items within a given scale. We examined the predictive validity of the measures by calculating correlations with two measures of subsequent stages in the disablement process: the number of ADLs reported in 1994 and, for those reinterviewed (N=523), the number of ADLs in 1996. In 1994, respondents in our analysis were asked both leading and neutral questions about difficulty with five ADLs (bathing, dressing, eating, transferring, and walking across a room). In 1996, respondents in our analysis were asked about the five ADLs using neutrally-worded questions.
Results
Table AI-1 shows for each of the 12 tasks in the HRS the percentage of respondents with inconsistent responses to the leading and neutral approaches. Discrepancies were largest for jogging: 14% of respondents provide inconsistent responses to neutral and leading questions about jogging. Discrepancies are also large for climbing several flights of stairs (13.4%) and getting up from a chair after sitting for long periods (12.9%). Overall, 10.5% of respondents are classified in an inconsistent manner on a summary indicator of having one or more functional limitations.
| TABLE AI-1. Inconsistencies in Reports of Leading and Neutral Functional Limitations | |||
| Percentage with Consistent Response | Percentage with InconsistentResponse | ||
| No Difficulty | Any Difficulty | ||
| Specific Activities: | |||
| Running or jogging about a mile | 13.5 | 71.9 | 14.7 |
| Walking several blocks | 72.7 | 18.0 | 9.4 |
| Walking one block | 86.1 | 5.8 | 8.1 |
| Sitting for about 2 hours | 72.1 | 17.9 | 10.0 |
| Getting up from a chair after sitting for long periods | 58.9 | 28.3 | 12.9 |
| Climbing several flights of stairs without resting | 54.7 | 31.9 | 13.4 |
| Climbing one flight of stairs without resting | 82.0 | 8.2 | 9.8 |
| Lifting or carrying weighs over 10 pound | 76.1 | 15.2 | 8.8 |
| Stooping, kneeling, or crouching | 56.6 | 33.9 | 9.5 |
| Picking up a dime from a table | 93.8 | 4.4 | 1.8 |
| Reaching or extending arms above shoulder level | 88.1 | 8.8 | 3.1 |
| Pulling or pushing large objects | 73.6 | 18.5 | 8.0 |
| One or more functional limitation | 9.9 | 79.6 | 10.5 |
| NOTE: Weighted tabulations from the 1994 Health and Retirement Survey (N=564). | |||
In Table AI-2, we explore whether reducing the number of limitations in the scale can improve the external consistency between the leading and neutral approaches. As shown in the first row of the table, in the 12-item scale, leading questions are not only more likely than neutrally-worded questions to elicit one or more functional limitations, but also result in a greater number of functional limitations being reported (p 0.01 for differences of 7.6 percentage points and 0.57 mean limitations). Overall, only 47.5 percent of people ages 51-61 report the same number of functional limitations under both approaches; 80.7 percent report differences of at most 1 limitation.
| TABLE AI-2. Agreement Between Leading and Neutral Functional Limitation Scales | ||||||
| Scale | Excluded Items | Mean Number of FLs | Consistency in Number of FLs Between Leading andNeutral Approaches | |||
| Leading | Neutral | Difference | Percentwith Same Number of FLs | PercentDiffering by at most 1 FL | ||
| 12-item | None | 3.46 | 2.89 | 0.57** | 47.5 | 80.7 |
| 11-item | jog | 2.61 | 2.15 | 0.46** | 55.9 | 82.9 |
| 9-item | + blocks, block | 2.22 | 1.89 | 0.34** | 59.3 | 86.6 |
| 7-item | + stairs, stair | 1.62 | 1.46 | 0.17** | 66.1 | 92.3 |
| 6-item | + chair | 1.27 | 1.11 | 0.16** | 71.2 | 94.3 |
| NOTE: Weighted tabulations from the 1994 Health and Retirement Survey (N=564).** p0.01 for difference between leading and neutral approaches. | ||||||
Eliminating items with relatively poor consistency improves agreement between the two approaches. For example, when the scale is reduced to the seven most consistent items (sitting; getting up from a chair; lifting or carrying; stooping, kneeling or crouching; picking up a dime; reaching; pulling or pushing), the difference in mean number of limitations is reduced to 0.17 (p 0.01 for differences). Two-thirds of respondents report the same number of limitations and over 90% report differences of at most 1 limitation. Further reducing the number of items (in this case by removing the item about getting up from a chair) increases the difference in the percentage with one or more limitations and does not appreciably improve the consistency between the mean number of limitations.
Finally, as shown in Table AI-3, the loss of reliability and predictive validity in moving from a 12-item to a 7-item scale is nominal. Internal consistency for both leading and neutral 7-item scales remains at widely acceptable levels above 0.80. The predictive validity, as evidenced by correlations with the number of ADLs in 1994 and 1996, remains strong.
Implications
We find that eliminating five of the 12 functional limitation items in the HRS results in a scale that is less sensitive to wording changes. The scale retains both internal validity and external predictive validity. To minimize the influence of changes in the functional limitation items that took place between 1992 and subsequent waves, we adopt the 7-item scale in our analysis of aggregate changes in functioning among Americans ages 51-61.
| TABLE AI-3. Reliability and Predictive Validity of Leading and Neutral Functional Limitation Scales | |||||||||
| Scale | Excluded Items | Cronbach's Alpha (N=564) | Correlation with Number of Leading ADLs, 1994(N=564) | Correlation with Number of Neutral ADLs, 1994(N=564) | Correlation with Number of Neutral ADLs, 1996(N=523) | ||||
| Leading FLs | Neutral FLs | Leading FLs | Neutral FLs | Leading FLs | Neutral FLs | Leading FLs | Neutral FLs | ||
| 12-item | None | 0.875 | 0.855 | 0.61 | 0.61 | 0.50 | 0.54 | 0.41 | 0.45 |
| 11-item | jog | 0.882 | 0.856 | 0.62 | 0.62 | 0.51 | 0.56 | 0.42 | 0.46 |
| 9-item | + blocks, block | 0.854 | 0.837 | 0.59 | 0.60 | 0.49 | 0.52 | 0.40 | 0.43 |
| 7-item | + stairs, stair | 0.816 | 0.803 | 0.57 | 0.57 | 0.47 | 0.49 | 0.39 | 0.41 |
| 6-item | + chair | 0.788 | 0.780 | 0.58 | 0.58 | 0.48 | 0.49 | 0.39 | 0.41 |
| NOTE: Weighted tabulations from the 1994 Health and Retirement Survey.** p0.01 for difference between leading and neutral approaches. | |||||||||
APPENDIX II. DEVELOPMENT OF A FACTOR TO CORRECT FOR QUESTION WORDING CHANGES BETWEEN THE 1992 AND 1998 WAVES OF THE HEALTH AND RETIREMENT STUDY
Introduction
As discussed in Appendix I, seemingly minor changes in question wording can affect estimates of the prevalence of functional limitations. In an attempt to limit the influence of question wording changes on comparisons between 1992 and 1998, in this report we have adopted a 7-item scale that is less sensitive than a full 12-item scale to question wording changes.
Nevertheless, differences persist in reports obtained from the "leading" approach adopted in 1992 (how much difficulty do you have ) and from the more "neutral" approach used in subsequent years (do you have any difficulty ), including 1998. Here we develop and justify the use of a correction factor to apply to the 1992 estimates of functioning from the HRS so that valid comparisons may be made to the 1998 wave. The correction factor accounts for the portion of the observed change between 1992 and 1998 that is due to this difference in question wording.
Note that neither approach necessarily represents a gold standard for measuring functional limitations. Both approaches have been used in other surveys (e.g., the Medicare Current Beneficiary Survey and the National Long Term Care Survey use the 1992 (how much difficulty?) approach, whereas the Supplements on Aging to the National Health Interview Survey and the Survey of Income and Program Participation use the 1998 (do you have any difficulty?) approach). However, the 1992 approach was used only in the initial wave of the HRS; all subsequent waves have used the 1998 approach.
Consequently, in calculating correction factors to make the two approaches comparable, we adjust prevalence rates from the 1992 approach to make them comparable with the 1998 approach. That is, we ask what would the 1992 rates have been had the questions been asked using the 1998 approach?
Calculation and Application of Correction Factor
Data. In the 1994 wave of the HRS, all respondents were asked functional limitation items that were identical to those included in the 1998 survey. In addition, a subsample of respondents to the 1994 survey were asked the functional limitation items from the 1992 survey. Thus, for a randomly selected group of respondents (N=771), answers to both sets of functional limitation items are available for the same point in time. Approximately three-fourths (72%) of these respondents (N=557) fall into the 51-61 age range of interest in this analysis.
Calculation of correction factor. The average number of limitations among this group of respondents in 1994 is 1.623 when leading (1992) approach is used, but only 1.455 when the neutral (1998) approach is used. We treat the difference between these two estimates, 0.168, as the correction factor and interpret it to be the effect of question wording changes.
We also explored using the ratio of leading to neutral number of functional limitations as the correction factor. In most cases, corrections based on a difference and those based on a ratio produced the same results.
This simple correction factor cannot be applied to the 1992 prevalence rates if the 1992 and 1994 samples differ on characteristics that are related to the extent of error rate. For example, if better-educated respondents are more likely to provide consistent answers to the 1992 and 1998 approaches and if the 1992 and 1994 samples differ in terms of educational composition, then an education-specific correction factor would be needed, rather than a simple correction factor. If many characteristics were related to the extent of error and the samples differed on those characteristics then a more complex, potentially model-based approach would be warranted.
We explored whether the assumptions of a simple correction factor were met for the 7-item functional limitation scale. Specifically, we examined differences in the 1992 and 1994 samples with respect to age, sex, race, ethnicity, marital status, education, ownership of liquid assets, obesity, self-assessed health status, number of functional limitations (under the leading approach), presence of five chronic conditions, and the use of medications for these conditions. We then examined whether the differences between the leading and neutral approaches varied by these characteristics (see Table AII-1.)
We found that the 1994 module sample is composed of respondents who are older; less likely to be of Hispanic origin; more likely to have more than high school education; more likely to have hypertension, diabetes and arthritis with no medication for any of the three conditions. However, none of these characteristics significantly predict the discrepancy in number of functional limitations under leading and neutral approaches. Therefore, we concluded that it is reasonable to use, without any stratification, the correction factor from 1994 module to correct the 1992 estimates of functional limitation.
Exploration of additional correction factors. We also explored the construction of condition-specific and medication-status specific correction factors.
We found for three of the conditions--diabetes, lung disease, and stroke--sample sizes in the 1994 wave of the HRS would not permit analysis of the assumptions for applying a sample correction factor. Further, we found that the correction factors for hypertension and arthritis were very similar to the simple correction factors for the entire sample.
| TABLE AII-1. Analysis of Sample Characteristics and Predictors of Discrepancies Between Leading and Neutral Functional Limitation Questions, 1992 and 1994 | ||||||
| Sample Comparisons | Predictors of Discrepancy | |||||
| % in 1992 | % in 1994 | Absolute Difference | Estimate | Std. Err. | Absolute t-value | |
| Age 51-56 | 58.2 | 50.4 | 7.7** | 0.05 | 0.07 | 0.73 |
| Male | 47.8 | 46.5 | 1.3 | 0.09 | 0.07 | 1.28 |
| White | 86.3 | 88.2 | 1.8 | 0.05 | 0.11 | 0.42 |
| Hispanic | 6.4 | 3.8 | 2.7** | -0.27 | 0.19 | 1.40 |
| Married | 76.8 | 74.5 | 2.3 | 0.03 | 0.08 | 0.37 |
| Education >HS | 37.9 | 43.8 | 5.8** | 0.06 | 0.07 | 0.88 |
| Has liquid assets | 84.7 | 87.5 | 2.8 | -0.13 | 0.12 | 1.10 |
| Obese | 21.4 | 23.2 | 1.8 | 0.15 | 0.08 | 1.82 |
| Poor health | 20.1 | 19.7 | 0.4 | -0.25 | 0.11 | 2.26* |
| # of FLs (leading app.) | 1.7 | 1.5 | 0.2 | 0.18 | 0.02 | 8.31** |
| Hypertension (no medication) | 13.6 | 16.6 | 2.9* | -0.12 | 0.10 | 1.21 |
| Hypertension (medication) | 24.4 | 24.9 | 0.5 | -0.04 | 0.08 | 0.46 |
| Diabetes (no medication) | 3.8 | 7.2 | 3.5** | -0.08 | 0.13 | 0.57 |
| Diabetes (medication) | 6.1 | 7.7 | 1.6 | 0.03 | 0.13 | 0.25 |
| Lung disease (no medication) | 5.4 | 6.2 | 0.9 | -0.35 | 0.15 | 2.43* |
| Lung disease (medication) | 2.9 | 3.3 | 0.4 | 0.16 | 0.20 | 0.79 |
| Stroke (no medication) | 1.5 | 0.7 | 0.9 | 0.56 | 0.43 | 1.29 |
| Stroke (medication) | 1.1 | 1.4 | 0.4 | 0.52 | 0.29 | 1.81 |
| Arthritis (no medication) | 23.9 | 29.6 | 5.7** | -0.11 | 0.08 | 1.35 |
| Arthritis (medication) | 13.6 | 16.4 | 2.8 | -0.22 | 0.11 | 2.06* |
| N | 9,573 | 564 | 564 | |||
| NOTE: All estimates are weighted. Sample comparisons are adjusted for the overlap between 1994 module and 1992 samples. | ||||||
We also found that when we included indicators of the five chronic conditions in a model predicting discrepancies (a constrained version of the model in Table AII-1, not shown), only having a stroke was associated with the size of the discrepancy. However, only 13 out of the 557 cases responding to the module reported ever having ever had a stroke, and the regression model predicting the discrepancy between leading and neutral number of functional limitations was sensitive to the exclusion of one outlier with a discrepancy of three. It may be that because of cognitive deficits stroke victims provide less reliable answers irrespective of question wording changes. Therefore, we chose not to develop a different correction factor for the subsample of respondents reporting that they had a stroke.
Using the same logic, we explored the need for medication-status specific correction factors. With only two exceptions, those reporting lung disease but not on medication and those on medication for arthritis, we found medication status was not a significant predictor of discrepancies (see Table AII-1). Upon closer examination of these groups, we found that only 34 people in the 1994 sample reported having lung disease and not taking medication for that condition, and results were sensitive to the exclusion of a single outlier. With respect to arthritis, 98 people in the 1994 sample reporting having arthritis and taking medication for it, and no single outlier explaining the relationship with discrepant reporting. Interestingly, those reporting medication use for arthritis report on average more limitations using the leading approach compared to the neutral approach; however, once other factors are controlled for, the effect of medication use for arthritis flips so that these respondents report fewer limitations using the leading approach. Given this finding, we believe that applying a correction factor of 0.168 to this group may be overly conservative, and we point this out in the report where relevant. In all other cases, however, we did not find evidence to support the development of medication-status specific correction factors.
Application of Correction Factor
For our descriptive results, we subtract the correction factor directly from the 1992 estimates. This allows us to test whether changes in functioning between 1992 and 1998 exceed the amount that would be expected due to question wording. For our regression models, we test explicitly whether the coefficient on a variable reflecting year is different from 0.168 (rather than the usual test of being different from zero).
To obtain a printed copy of this report, send the full report title and your mailing information to:
U.S. Department of Health and Human ServicesOffice of Disability, Aging and Long-Term Care PolicyRoom 424E, H.H. Humphrey Building200 Independence Avenue, S.W.Washington, D.C. 20201FAX: 202-401-7733Email: webmaster.DALTCP@hhs.gov
RETURN TO:
Office of Disability, Aging and Long-Term Care Policy (DALTCP) Home [http://aspe.hhs.gov/_/office_specific/daltcp.cfm]Assistant Secretary for Planning and Evaluation (ASPE) Home [http://aspe.hhs.gov]U.S. Department of Health and Human Services Home [http://www.hhs.gov]