
January 2017
Printer Friendly Version in PDF Format (90 PDF pages)
ABSTRACT
Until relatively recently, insurance coverage for behavioral health has had more restrictions and limitations than coverage for medical/surgical care. Moreover, behavioral health coverage has often been more restricted in individual and small group private plans than in large group employer-sponsored insurance plans. Recently, parity protections were extended to individual and small group plans that offer coverage for behavioral health treatment to have terms of coverage that are no more restrictive than for medical/surgical treatment. For this report, we assessed the degree to which behavioral health coverage and medical/surgical coverage in individual and small group plans changed after federal parity requirements in coverage took effect in 2014. The results focus on changes in scope of coverage (what conditions and services are covered) and level of coverage (quantitative restrictions, such as the co-payment and limits on visits). The findings suggest that parity legislation may have had the intended effect.
DISCLAIMER: The opinions and views expressed in this report are those of the authors. They do not necessarily reflect the views of the Department of Health and Human Services, the contractor or any other funding organization.
TABLE OF CONTENTS
1. INTRODUCTION
2. BACKGROUND
2.1. Overview
2.2. Legislation Affecting Behavioral Health Coverage
2.3. Literature on Behavioral Health Coverage, Network Adequacy, and Workforce Shortage
2.4. Literature on the Impact of Parity
3. METHODS
3.1. Overview
3.2. Identify States, Issuers, and Plans
3.3. Abstract Plan Benefit Data
3.4. Perform Analysis
3.5. Key Informant Discussion: Data and Analysis
4. RESULTS
4.1. Scope of Coverage
4.2. Level of Coverage
4.3. Formulary Coverage and Non-Quantitative Treatment Limitation for Prescription Medication
4.4. Sub-Analyses
4.5. Results from Stakeholder Discussions on Network Adequacy
5. DISCUSSION
APPENDICES
- APPENDIX A: Candidate Measures for Selecting States
- APPENDIX B: Top Four Issuers per State by Market Share
- APPENDIX C: Working Definitions of Behavioral Health Services and Types of Care Used to Abstract Plan Data
- APPENDIX D: Guidance Used to Identify Non-Quantitative Treatment Limitations
- APPENDIX E: T-Tests
LIST OF FIGURES
- FIGURE 3-1: Methods Flow
- FIGURE 3-2: Process of Identifying States and Data Sources
- FIGURE 3-3: Health Insurance Rating Area Selection Process
- FIGURE 3-4: Health Insurance Plan Selection Process
- FIGURE 4-1: Percentage of Plans with Any Explicitly Stated Exclusion for Behavioral Health and for Medical/Surgical Conditions, 2013 and 2014
- FIGURE 4-2: Percentage of Plans in 2013 Explicitly Stating In-Network Coverage for Behavioral Health, by Setting, Behavioral Health Condition, and Type of Marketplace
- FIGURE 4-3: Percentage of Plans in 2014 Explicitly Stating In-Network Coverage for Behavioral Health, by Setting/Network Status, Behavioral Health Condition, and Type of Marketplace
- FIGURE 4-4: Percentage of Plans Explicitly Stating Exclusions for Health Conditions, by Year, Health Condition, and Type of Exchange
- FIGURE 4-5: Percentage of Plans Explicitly Stating Exclusions for Health Conditions, by Year, Health Condition, and Insurance Market
LIST OF TABLES
- TABLE 3-1: Sample States and Selection Criteria Information
- TABLE 3-2: Source of Health Insurance Rate Filings, by State
- TABLE 3-3: Plan Selection Data Sources by Issuer and Year/Exchange
- TABLE 3-4: Source of Health Insurance Benefit Information Policy Documents, by State
- TABLE 4-1: Percentage of Plans with Explicitly Stated Coverage and Exclusions for Select Health Conditions, 2013 and 2014
- TABLE 4-2: Percentage of Plans with Explicitly Stated Coverage and Exclusions, for Setting and Health Condition Category, 2013 and 2014
- TABLE 4-3: Percentage of Plans with Explicitly Stated Coverage and Exclusions for Select Services, by Health Condition Category, 2013 and 2014
- TABLE 4-4: Percentage of Plans with Select NQTLs for Behavioral Health Care, 2013 and 2014
- TABLE 4-5: Percentage of Plans with Co-Payments for the Initial Visit, by Setting and Health Condition Category, 2013 and 2014
- TABLE 4-6: Average Co-Payment Amounts for the Initial Visit, Among Plans with Co-Payments, by Setting and Health Condition Category, 2013 and 2014
- TABLE 4-7: Percentage of Plans with Co-Insurance for the Initial Visit, by Setting and Health Condition Category, 2013 and 2014
- TABLE 4-8: Consumer Co-Insurance Payment for Initial Visit, by Setting and Health Condition, 2013 and 2014
- TABLE 4-9: Average Percentage of Initial Visit Cost Paid for by Consumer, by Setting and Health Condition, 2013 and 2014
- TABLE 4-10: Distribution of Behavioral Health Medications across Formulary Tiers, 2013 and 2014
- TABLE 4-11: Distribution of Medical/Surgical Medications across Formulary Tiers, 2013 and 2014
- TABLE 4-12: Percentage of Behavioral Health Medications with Selected Types of Limitations, 2013 and 2014
- TABLE 4-13: Percentage of Medical/Surgical Medications with Selected Types of Limitations, 2013 and 2014
- TABLE 4-14: Percentage of Plans with Select NQTLs for Prescription Medication, by Health Condition, 2013 and 2014
- TABLE 4-15: Percentage of Plans with Explicitly Stated Coverage and Exclusions, by Setting/Network Status and Health Condition, 2013 and 2014
- TABLE 4-16: Percentage of Plans with Select NQTLs for Behavioral Health Care in the Inpatient Setting, by Network Status, 2013 and 2014
- TABLE 4-17: Percentage of Plans with Select NQTLs for Behavioral Health Care in Ambulatory Settings, by Network Status, 2013 and 2014
- TABLE 4-18: Percentage of Plans with Co-Insurance for the Initial Visit, by Setting/Network Status, Health Condition, 2013 and 2014
- TABLE 4-19: Consumer Co-Insurance Payment for Initial Visit, by Setting/Network Status and Health Condition, 2013 and 2014
- TABLE 4-20: Percentage of Plans with Select NQTLs for Prescription Medication for Behavioral Health Conditions, by Network Status, 2013 and 2014
- TABLE A-1: Candidate Measures by State and Region
- TABLE B-1: Top 4 Issuers per State by Market Share
- TABLE C-1: Data Abstraction Template Keywords for Select Services
- TABLE E-1: Percentage of Plans with any Explicitly Stated Exclusion for Behavioral Health and for Medical/Surgical Conditions: T-test across 2013 and 2014
- TABLE E-2: Percentage of Plans with any Explicitly Stated Exclusion for Behavioral Health and for Medical/Surgical Conditions: T-test across Health Conditions
- TABLE E-3: Percentage of Plans with Explicitly Stated Coverage and Exclusions for Select Health Conditions: T-test across 2013 and 2014
- TABLE E-4: Percentage of Plans with Explicitly Stated Coverage and Exclusions, by Setting and Health Condition: T-test across 2013 and 2014
- TABLE E-5: Percentage of Plans with Explicitly Stated Coverage and Exclusions, by Setting and Health Condition: T-test across Health Condition Categories
- TABLE E-6: Percentage of Plans with Explicitly Stated Coverage and Exclusions for Selected Services, by Health Condition: T-test across 2013 and 2014
- TABLE E-7: Percentage of Plans with Explicitly Stated Coverage and Exclusion for Selected Services, by 2013 and 2014: T-test across Health Conditions
- TABLE E-8: Percentage of Plans with Select NQTLs for Behavioral Health Care, 2013 and 2014: T-test across Year
- TABLE E-9: Percentage of Plans with Co-Payments for the Initial Visit, by Setting and Health Condition: T-test across 2013 and 2014
- TABLE E-10: Percentage of Plans with Co-Payments for the Initial Visit, by Setting, 2013 and 2014: T-test across Health Conditions
- TABLE E-11: Average Co-Payment Amounts for the Initial Visit, Among Plans with Co-Payments, by Setting and Health Condition: T-test across 2013 and 2014
- TABLE E-12: Average Co-Payment Amounts for the Initial Visit, Among Plans with Co-Payments, by Setting, 2013 and 2014: T-test across Health Conditions
- TABLE E-13: Percentage of Plans with Co-Insurance for the Initial Visit, by Setting and Health Condition: T-test across 2013 and 2014
- TABLE E-14: Percentage of Plans with Co-Insurance for the Initial Visit, by Setting, 2013 and 2014: T-test across Health Conditions
- TABLE E-15: Consumer Co-Insurance Payment for Initial Visit, by Setting and Health Condition: T-test across 2013 and 2014
- TABLE E-16: Consumer Co-Insurance Payment for Initial Visit, by Setting, 2013 and 2014: T-test across Health Conditions
- TABLE E-17: Average Percentage of Initial Visit Cost Paid for by Consumer, by Setting and Health Condition: T-test across 2013 and 2014
- TABLE E-18: Average Percentage of Initial Visit Cost Paid for by Consumer, by Setting, 2013 and 2014: T-test across Health Conditions
- TABLE E-19: Percentage of Plans with Select NQTLs for Prescription Medication, by Health Condition: T-test across 2013 and 2014
- TABLE E-20: Percentage of Plans with Explicitly Stated Coverage and Exclusions, by Setting/Network Status and Health Condition: T-test across 2013 and 2014
- TABLE E-21: Percentage of Plans with Explicitly Stated Coverage and Exclusions, by Setting/Network Status and Health Condition: T-test across Health Condition Categories
- TABLE E-22: Percentage of Plans with Explicitly Stated Coverage and Exclusions, by Setting/Network Status and Health Condition: T-test across Network
- TABLE E-23: Percentage of Plans with Select NQTLs for Behavioral Health Care in the Inpatient Setting, 2013 and 2014: T-test across Network
- TABLE E-24: Percentage of Plans with Select NQTLs for Behavioral Health Care in Ambulatory Settings, 2013 and 2014: T-test across Network
- TABLE E-25: Average Co-Insurance Rate for Initial Visit, by Setting/Network Status and Health Condition: T-test across 2013 and 2014
- TABLE E-26: Average Co-Insurance Rate for Initial Visit, by Setting/Network Status, 2013 and 2014: T-test across Health Conditions
- TABLE E-27: Average Co-Insurance Rate for Initial Visit, by Setting and Health Condition, 2013 and 2014: T-test across Network
- TABLE E-28: Percentage of Plans in 2013 Explicitly Stating In-Network Coverage for Behavioral Health, by Setting, Behavioral Health Condition, and Type of Exchange: T-test across Marketplace Facilitation
- TABLE E-29: Percentage of Plans in 2014 Explicitly In-Network Stating Coverage for Behavioral Health, by Setting/Network Status, Behavioral Health Condition, and Type of Exchange: T-test across Marketplace Facilitation
- TABLE E-30: Percentage of Plans Explicitly Stating Exclusions for Health Conditions, by Year, Health Condition, and Type of Exchange: T-test across Marketplace Facilitation
- TABLE E-31: Percentage of Plans Explicitly Stating Exclusions for Health Conditions, by Year, Health Condition, and Insurance Market: T-test across Insurance Market Types
ACKNOWLEDGMENTS
RTI International prepared this report under contract to the Office of the Assistant Secretary for Planning and Evaluation (ASPE), U.S. Department of Health and Human Services (HHS) (contract number HHSP23320095651WC, task order number HHSP23337044T). The authors appreciate the guidance of Emily Jones, Kirsten Beronio, and D.E.B. Potter (ASPE) and staff of the Center for Consumer Information and Insurance Oversight. The authors would also like to thank the individuals who participated in the key stakeholder discussions and the individuals from state departments of insurance who provided and helped interpret insurance plan documents.
The views and opinions expressed here are those of the authors and do not necessarily reflect the views, opinions, or policies of ASPE or HHS. The authors are solely responsible for any errors.
ABSTRACT
Summary: In 2014, parity protections were extended to individual and small group plans that offer coverage for behavioral health treatment to have terms of coverage that are no more restrictive than for medical/surgical treatment. For this report, we assessed the degree to which behavioral health coverage and medical/surgical coverage in individual and small group plans changed after federal parity requirements in coverage took effect in 2014. The results focus on changes in scope of coverage (what conditions and services are covered) and level of coverage (quantitative restrictions, such as the co-payment and limits on visits). The findings suggest that parity legislation may have had the intended effect.
Major Findings: The current study suggestions that, on the whole, there was little evidence of differential quantitative restrictions in the 2014 plans. The findings show that there were some differences in scope and level of coverage between behavioral health and medical/surgical coverage in 2013, but these were not apparent in 2014. For example, in 2013, 86 percent of plans covered office visits for behavioral health reasons, but 88 percent covered office visits for medical/surgical reasons. In 2014, the two proportions were equal: 86 percent of plans covered office visits for behavioral health, and the same proportion covered office visits for medical/surgical care. Our findings suggest at least two areas where further understanding is needed on parity in the individual and small group market. First, the results suggest focusing on aspects of coverage other than quantitative restrictions, such as non-quantitative treatment limitations (NQTLs). A second area requiring further scrutiny is whether plans' provider networks sufficiently ensure consumer access to services.
Purpose: The findings in the current study should contribute to the current policy discussions regarding parity in behavioral health care in practice, both in terms of quantitative restrictions and NQTLs.
Method: We created a purposive sample of states and then a sample of individual and small group plans within those states. We obtained documents for 166 plans and then used those documents to compare changes in coverage from 2013 (before the parity requirements took effect) to 2014 (after they took effect). We also convened discussions with key informants to provide context and insight into aspects of coverage -- such as network adequacy -- that were not captured by reviewing plan data.
ACRONYMS
The following acronyms are mentioned in this report and/or appendices.
| ADHD | Attention Deficit/Hyperactivity Disorder |
|---|---|
| AHRQ | HHS Agency for Healthcare Research and Quality |
| AIDS | Acquired Immune Deficiency Syndrome |
| ASPE | HHS Office of the Assistant Secretary for Planning and Evaluation |
| BCBS | Blue Cross Blue Shield |
| CCIIO | Center for Consumer Information and Insurance Oversight |
| CFR | Code of Federal Regulations |
| CMS | HHS Centers for Medicare & Medicaid Services |
| EHB | Essential Health Benefits |
| FFM | Federally Facilitated Marketplace |
| HCl | Hydrochloride |
| HIV | Human Immunodeficiency Virus |
| HHS | U.S. Department of Health and Human Services |
| HPSA | Health Professional Shortage Area |
| HRSA | HHS Health Resources and Services Administration |
| IOT | Intensive Outpatient Treatment |
| MAT | Medication Assisted Treatment |
| MHPAEA | Mental Health Parity and Addiction Equity Act |
| MLR | Medical Loss Ratio |
| NAIC | National Association of Insurance Commissioners |
| NAMHC | National Advisory Mental Health Council |
| NQTL | Non-Quantitative Treatment Limitation |
| PUF | Public Use File |
| QHP | Qualified Health Plan |
| RBIS | CCIIO Rate and Benefit Information System |
| RF | Rate Filings |
| RTI | Research Triangle Institute |
| SAMHSA | HHS Substance Abuse and Mental Health Services Administration |
| SERFF | System for Electronic Rate and Form Filing |
| SHOP | Small Business Health Options Program |
EXECUTIVE SUMMARY
Historically, behavioral health coverage has often been more restricted in individual and small group private plans than in large employer plans. In 2014, parity protections were extended to individual and small group plans, requiring plans that cover behavioral health treatments to have terms of coverage that are no more restrictive than coverage for medical/surgical services. These requirements represent an expansion of parity protections established in prior federal legislation in 2008 and 1996, as well as numerous state legislative actions over at least three decades.
For this report, we assessed the degree to which behavioral health coverage and medical/surgical coverage in individual and small group plans changed after federal parity requirements in coverage took effect. The results focus on changes in scope of coverage (what conditions and services are covered) and level of coverage (quantitative restrictions, such as the co-payment and limits on visits).
We created a purposive sample of states and then a sample of individual and small group plans within those states. We obtained documents for 166 of the 217 plans included in the sample and then used those documents to compare changes in coverage from 2013 (before the parity requirements took effect) to 2014 (after they took effect). We also convened discussions with key informants to provide context and insight into aspects of coverage -- such as network adequacy -- that were not captured by reviewing plan data.
The current study suggestions that, on the whole, there was little evidence of differential quantitative restrictions in the 2014 plans. However, findings suggest that parity legislation may have had some effect. The purpose of parity legislation was to remove differences between behavioral health and medical/surgical coverage in terms of quantitative restrictions. The findings show that there were some differences in scope and level of coverage between behavioral health and medical/surgical coverage in 2013, but these were not apparent in 2014. For example, in 2013, 86 percent of plans covered office visits for behavioral health reasons, but 88 percent covered office visits for medical/surgical reasons. In 2014, the two proportions were equal: 86 percent of plans covered office visits for behavioral health, and the same proportion covered office visits for medical/surgical care. The findings also indicated similar convergence in the level of coverage -- such as co-insurance -- from 2013 to 2014.
Our findings suggest at least two areas where further understanding is needed, and thus where further investigation on parity may be most productively focused. First, the results support the developing guidance for enforcing parity requirements in the individual and small group market toward aspects of coverage other than quantitative restrictions, such as non-quantitative treatment limitations (NQTLs). NQTLs are used by insurers to manage utilization, such as through prior authorization, which typically requires plan administrators or qualified providers to approve reimbursement for a service for a specific patient before it is provided. The data in the current study allowed only a limited assessment of parity in NQTLs between behavioral health and medical/surgical coverage. Thus, although the current study did not find differences in NQTLs with regard to behavioral health and medical/surgical coverage, further study is warranted.
A second area requiring further scrutiny is whether plans' provider networks sufficiently ensure consumer access to services. The data clearly show that, relative to 2013, plans in 2014 had increased incentives for consumers to use care from providers in the plan network. In 2014, for example, only half of the plans covered out-of-network outpatient care. For in-network coverage to help ensure access to services, the provider network must be adequate and the appropriate services must be available in a timely fashion. Even though the current study does not show coverage differences between behavioral health and medical/surgical services, research is needed on the adequacy of networks and the impact of ongoing shortages in specialty behavioral health care providers.
Until the current study, no study to our knowledge used a wide selection of plan data from the individual and small group markets to determine how behavioral health coverage may have improved over time. The findings in the current study should contribute to the current policy discussions regarding behavioral health coverage, both in terms of quantitative restrictions and NQTLs. The results presented here will inform future directions for improving parity in behavioral health coverage specifically and further research on policies to help people with behavioral health needs access treatment and services.
1. INTRODUCTION
In 2014, parity protections were extended to individual and small group plans, requiring plans that cover behavioral health treatments to have terms of coverage that are no more restrictive than coverage for medical/surgical services. These changes represented an expansion of parity protections established in prior federal legislation in 2008 and 1996, as well as numerous state legislative actions over at least three decades.
In 2014, the Office of the Assistant Secretary for Planning and Evaluation (ASPE), U.S. Department of Health and Human Services (HHS) awarded a Task Order contract to RTI International and its subcontractor, the National Academy for State Health Policy, to assess the degree to which the extension of parity requirements to the individual and small group markets were associated with changes in behavioral health coverage and medical/surgical coverage in small group and individual plans. Relevant coverage dimensions are scope (what conditions and services are covered), level (quantitative restrictions), and network adequacy (whether a sufficient number of care providers was available to patients under the plan).
This report documents findings under four research questions:
-
Research Question 1: What was the scope of coverage for mental health and substance use disorder benefits in individual and small group plans in 2013 and 2014, and how does this differ from the scope of coverage for medical/surgical benefits?
-
Research Question 2: What was the level of coverage for mental health and substance use disorder benefits in individual and small group plans in 2013 and 2014, and how does this differ from the level of coverage for medical/surgical benefits?
-
Research Question 3: To what degree are the findings from the research questions attributable to characteristics such as whether that state had a state or federally facilitated exchange?
-
Research Question 4: To what degree were there changes in network adequacy for mental health and substance use disorder treatment through individual and small group plans from 2013 to 2014, compared with medical/surgical treatment?
Under the guidance of ASPE, we created a purposive sample of states and individual and small group plans, obtained plan documents, used those documents to compare changes in coverage from 2013 (before implementing the parity requirements in these markets) to 2014 (after implementing the requirements), and then compared the change over time for behavioral health coverage with the change over time for medical/surgical coverage. We also convened discussions with key informants to provide context and insight into aspects of coverage that were not captured by reviewing plan data.
This report is structured as follows:
-
Section 2 (Background) provides some background to the current policy landscape. The background is important because over the past three decades, several legislative approaches at the federal and state levels have attempted to address the difference between behavioral health coverage and medical/surgical coverage in a piecemeal manner. Understanding the gaps that remain from those legislative actions is key to understanding the potential impact of the application of parity to the individual and small group markets. The summary of the literature to date motivates the research questions that are central to the current study, and these research questions focus on each of the relevant coverage dimensions.
-
Section 3 (Methods) describes the data sources used to create the samples of states and plans within states, and the plan data used for the main analyses; we also describe the key informant discussions in this section.
-
Section 4 (Results) presents quantitative findings from the plan data, and these are supplemented by the key informant discussion findings.
-
Section 5 (Discussion) focuses on implications for policy and recommendations for future work.
2. BACKGROUND
2.1. Overview
Prior to 2008, parity laws between behavioral health coverage and medical/surgical coverage consisted of a patchwork of policies at the state level overlaid with the federal Mental Health Parity Act of 1996. The Mental Health Parity and Addiction Equity Act (MHPAEA) of 2008 helped standardize what parity meant across states and addressed significant gaps in the Mental Health Parity Act. MHPAEA was also particularly significant for the current study, because MHPAEA parity requirements were extended to individual and small group plans, beginning in 2014.[1] Also in that year, health insurance marketplaces were created at the state level for individual and small group plans. Parity legislation affected plans offered both within and outside of those marketplaces.
There is a growing literature on the association between the recent federal health care reforms of 2010 through 2014 and behavioral health care access and use (Berry et al., 2015; Busch et al., 2014; Grazier et al., 2016; Horgan et al., 2016; McGinty et al., 2015). However, gaps and lags in data mean that there is relatively little evidence on the impact of key aspects of legislation, which include parity requirements on individual and small group plans (Barry et al., 2016; French et al., 2016). Moreover, to our knowledge, few studies have used plan coverage documents as data to assess changes in coverage over time and compare behavioral health coverage and medical/surgical coverage.
2.2. Legislation Affecting Behavioral Health Coverage
2.2.1. Legislation Before 2008
The discrepancy in coverage between behavioral and medical/surgical health insurance benefits has been a key health policy concern in the United States for at least the past two decades. In 1996, the Mental Health Parity Act was passed and signed into law (NAMHC, 2000). Before this legislation, insurance coverage for mental health care was notably different from all other medical care in terms of hospital stays, annual or lifetime dollar limits, and the extent of cost-sharing through co-payments and deductibles. The Mental Health Parity Act stated that if a health insurance plan included mental health benefits, the annual and lifetime limits of mental health care and medical care must be the same. However, the Mental Health Parity Act did not require health insurance plans to offer mental health services, require parity in cost-sharing provisions, or specify which, if any, behavioral health services were to be covered. Additionally, the law exempted small employers (defined as a firm having fewer than 50 employees) and employers that could prove that medical costs would increase by 1 percent or more as a result of complying with the Mental Health Parity Act.
Partly as a response to the gaps in this federal legislation, many states proposed more ambitious laws to address behavioral health coverage. In the 1990s and early 2000s, a number of states passed their own parity laws that varied greatly in strength and enforcement. By 2008, parity legislation had been enacted in 45 states (Lang, 2013).
2.2.2. The Mental Health Parity and Addiction Equity Act of 2008
In 2008, the nationwide variation in coverage for behavioral health benefits was addressed by the passage of the federal MHPAEA, which extended full parity in coverage and treatment limitations to large group plans (Beronio et al., 2014). MHPAEA specified six benefit classifications for care in which parity was required: inpatient in-network, inpatient out-of-network, outpatient in-network, outpatient out-of-network, emergency care, and prescription drugs. The law applies to employers and group health insurance plans with more than 50 employees that offer coverage for mental illness and substance use disorders and requires that coverage be no more restrictive than that for other medical and surgical procedures covered by the plan. MHPAEA does not require group health plans to cover behavioral health care, but when they do, that coverage must be comparable to coverage for medical/surgical care.
Parity under MHPAEA is operationalized as mental health and substance use -- or behavioral health -- disorder coverage being no more restrictive than medical/surgical coverage with regard to predominant financial requirements and treatment limits. Generally, behavioral health benefits may not be applied more stringently than the processes, strategies, evidentiary standards, or other factors used in applying limitations to medical/surgical benefits. The only exception to this was where there are differences in recognized clinically appropriate standards of care. Even though behavioral health benefits can be carved out for administration by a separate insurer, plan offerings must have parity in behavioral health benefits. The law also required that plans make available information on medical necessity criteria and reasons for any denials for services.
2.2.3. Expansion of Parity Requirements to the Individual and Small Group Markets
In 2010, the parity requirements in MHPAEA were applied to new individual and small group plans issued in each state to cover behavioral health services at parity (Sarata, 2011). An ASPE analysis projected that this extension of the MHPAEA would lead to an estimated 7.1 million Americans in the individual market and 23.3 million Americans in the small group market seeing their existing behavioral health benefits covered at parity with medical/surgical benefits (Beronio et al., 2013).
In addition to improving parity in coverage for behavioral health benefits whenever such benefits are offered, the 2010 legislation also helped ensure certain types of plans actually offered behavioral health benefits. In 2014 the legislation established private insurance exchanges in each state and these exchanges could be state-run or federally-run. All health plans sold on the exchange must offer coverage in ten "Essential Health Benefit (EHB)" categories, including behavioral health services. Each state selected a benchmark plan that complied with the MHPAEA parity requirement, and that plan was used to define the EHB package for all insurance plans offered through the exchanges (Sarata, 2011).
An ASPE study of EHB's offered by small group plans in 2011 found that 95 percent offered coverage for behavioral health inpatient and outpatient services (Skopec et al., 2011), but the scope and level of coverage for these services in individual plans was unclear. The EHB requirement in 2014 was expected to provide access to behavioral health benefits for almost 4 million people in the individual market and 1.2 million people in the small group market whose plans did not offer such benefits previously (Beronio et al., 2013).
The 2010 legislation also created the Small Business Health Options Program (SHOP) to help small employers provide access to affordable insurance for their employees (Healthcare.gov, 2016a). The program streamlined the payment process for offering a variety of plans to full-time employees through the state marketplaces. Evidence suggests that uptake of SHOP was slow at the outset, with less than 1 percent of people in the small group market using the program as of February 2015 (Curran et al., 2016). Nevertheless, employees whose employers use SHOP to provide insurance are also subject to the EHB requirements and thus will be ensured coverage for behavioral health benefits as well.
In addition to other requirements, exchange plans must meet network adequacy standards, which should have an impact on access to behavioral health services. This requirement is intended for people to receive care without unreasonable delay.[2] Issuers must also submit provider directories to the exchange for publication. States are left to determine how to enforce the rules and may impose stricter requirements than the federal standards. Network adequacy is particularly important for behavioral health care because of well-documented shortages in providers, particularly in rural areas (e.g., SAMHSA, 2013a).
Overall, parity requirements should usher in improvements in parity, provision of benefits, and improved access for behavioral health care. Estimates suggest that the recent legislative changes in behavioral health insurance coverage will have allowed at least 35 million individuals in individual or small group plans to access behavioral health services at full parity (Beronio et al., 2013).
2.3. Literature on Behavioral Health Coverage, Network Adequacy, and Workforce Shortage
Improved and expanded coverage for behavioral health care will only result in increases in access if there is a sufficient supply of providers and if plans' provider networks are adequate. Data lag behind policy events by 1-3 years. Thus, evidence on the degree to which these issues have been addressed since the systemic changes coming in 2014 will likely be available soon after the publication of this report.
The literature has documented behavioral health care workforce shortages for decades (Cummings et al., 2014; SAMHSA, 2013; Thomas et al., 2009). There are few psychiatrists, for example, in rural areas. The potential for variation in specific services covered in benchmark plans across states also suggests that the scope of coverage for behavioral health services may not be despite recent legislation. For example, studies document variation in the coverage of specific services, such as behavioral therapies for autism, among small group plans (Skopec et al., 2011). This variation may be associated with the availability of providers in the health care system. The role that provider capacity will play in realizing the benefits of coverage expansion for behavioral health services across states is not yet known and will require in-depth review as the insurance plans offered on the health exchanges go into effect.
Despite a burgeoning literature on network adequacy (Haeder et al., 2015, 2016; Polsky & Weiner, 2015), few published studies exist on network adequacy specifically for behavioral health provision. Studies have anticipated the potential impact of network adequacy requirements (e.g., Corlette et al., 2014), and yet other studies have addressed how standards should be considered for mental health more specifically (Miller et al., 2014). However, limited evidence on this topic is available using data more recent than 2013.
2.4. Literature on the Impact of Parity
Recent literature on the impact of federal efforts to expand behavioral health coverage focuses on the Federal Employees Health Benefits Program and MHPAEA. Studies on the parity requirements of 2010 are still coming to light at the time of this report. Importantly, the existing studies use utilization of and access to care as outcomes, but few studies examine changes in the availability of benefits from insurance plans.
Findings on parity implementation among plans offered by the FEBHP are encouraging. Goldman et al. (2006) and Northrup Grumman Information Technology, Inc. (2004) found that plans complied with parity by 2011, no plans reported major problems expanding behavioral health coverage to meet the MHPAEA requirements, and no plans stopped offering FEBHP plans to avoid complying with the MHPAEA. Most of these plans chose to carve out behavioral health benefits, and there was no evidence of increased use of non-quantitative treatment limitations (NQTLs) for behavioral health treatment. The expansion of benefits was associated with a significant decrease in out-of-pocket spending on behavioral health for beneficiaries (Azrin et al., 2007). Evidence on changes in utilization was unclear and likely minimal (Azrin et al., 2007). The finding that the legislation was not associated with a significant change in utilization is similar to the finding from analyses on the impact of state mental health parity laws on utilization among children and adolescents (Busch et al., 2013).
A study of several samples of large employer-sponsored health insurance plans following implementation of the MHPAEA showed that health plans had made substantial changes to plan designs to meet the standards in the MHPAEA (Goplerud, 2013). That study suggests inpatient, prescription medication, and emergency department benefits conformed to many MHPAEA standards in 2011. For inpatient benefits, this finding was perhaps particularly significant because consumer cost-sharing had been higher for mental health services than medical/surgical services in 2009. Meeting the standards did not appear to come at the cost of increasing financial requirements for medical/surgical care.
The study of large employer-sponsored plans also raised at least four considerations that are potentially relevant to individual and small group plans in the current study. First, in-network outpatient behavioral health benefits were more likely to be inconsistent with requirements than out-of-network outpatient benefits. Second, approximately one-fifth of the plans used outpatient in-network co-pays that failed to meet MHPAEA standards. Third, plans frequently employ NQTLs -- such as precertification requirements -- for behavioral health conditions that are more restrictive than those used for medical/surgical conditions.
Fourth, by the time the 2014 deadline came into effect, individual and small group markets may have already adjusted to accommodate parity requirements. Evidence in the large group market from a sample of plan designs in 2010 -- 1 year before the MHPAEA took effect for large group plans -- found that most plans that were offered to employees of large businesses provided prescription coverage that met MHPAEA standards for cost-sharing.
One study to date assesses coverage for substance use disorders in EHB benchmark plans used by states (National Center on Addiction and Substance Abuse, 2016); EHBs are the ten benefit categories that most individual and small group market plans must include. The results indicate up to 31 percent of plans were identified as potentially having a parity violation for substance use disorder service coverage. Residential treatment programs and methadone maintenance therapy were particularly unlikely to be covered by EHB plans, while 88 percent of plans lacked the necessary data to evaluate compliance with EHB mandates fully.
3. METHODS
3.1. Overview
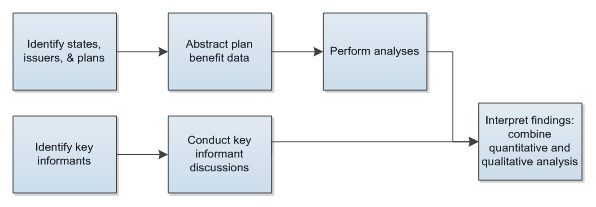
This section describes the methods used to address the research questions. Because no single data source is readily available to answer the research questions directly, we relied on several sources to obtain quantitative and qualitative data. We first identified the states, issuers, and plans to include in the analysis (Figure 3-1). We selected 217 plans, of which 166 had usable data. The sample was based on a number of criteria, including practical considerations, such as data quality and project resources.
After identifying plans and obtaining pertinent documents for each plan -- typically, the contract and summary of benefits and coverage -- we abstracted plan benefit data from plan documents using a standardized template. The template includes the conditions and services covered or excluded, disaggregated by setting (e.g., outpatient) and network status (in-network vs. out-of-network). We also conducted key informant discussions as a separate data source and to contextualize the findings from the quantitative analysis. We then analyzed the quantitative data and reviewed the synthesis of the findings from the key informant discussions.
Quantitative analyses focused on the plan benefit data that we abstracted and were used primarily in three research questions: scope (RQ1), level (RQ2), and these two stratified by type of exchange plan (RQ3). Qualitative analyses focused on the informant discussions.
| FIGURE 3-1. Methods Flow |
|---|
 |
3.2. Identify States, Issuers, and Plans
To identify the plans to include in the study, we first identified a representative sample of 12 states and then determined the most populous health insurance rating areas within those states (Figure 3-2). We chose issuers based on market share and data availability. We then applied standardized selection criteria to identify plans from those issuers. Our final list of plans consisted of on-exchange and off-exchange, individual and small group, and bronze and silver metal tiers.
| FIGURE 3-2. Process of Identifying States and Data Sources |
|---|
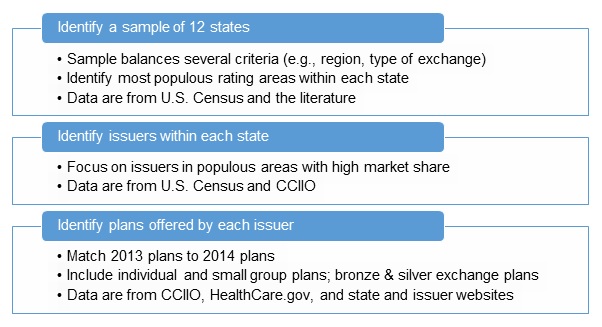 |
3.2.1. Identify a Sample of States and Rating Areas within States
Data Sources
To construct a sample of states, we used information on state characteristics from the Census Bureau, public sources on exchange characteristics, and the Center for Consumer Information and Insurance Oversight (CCIIO). To select the most populous rating areas within each state in 2014, we used CCIIO's Rate and Benefit Information System (RBIS) data and the CCIIO Individual and Small Group Market Geographic Rating Areas by State (CCIIO, 2014). Under the Market Rules and Rate Review Final Rule (45 CFR Part 147), each state has a set number of geographic rating areas that all issuers in the state must uniformly use as part of their rate setting.
Process of Creating a State Sample
We constructed the sample of states using four primary criteria (Table 3-1), which ensured that at least one state was represented within each of the following categories: the four census regions of the country (Northeast, Midwest, South, and West) (Census Bureau, 2015b); three types of exchanges (federal, state, and partnership); whether the Federal Government directly enforces exchange regulation compliance, including rate filing (CCIIO, n.d.); and proportion of population living in a rural area rather than an urban area (Census Bureau, 2010). After ensuring that each of these four primary criteria were met, we applied secondary selection criteria, which gave preference to states with a large population (Census Bureau, 2013) and for which sufficient data were available.
| TABLE 3-1. Sample States and Selection Criteria Information | |||||
|---|---|---|---|---|---|
| State | Census Region | Type of Exchange | Proportion Urban Population (%) |
Direct Federal Enforcement of Requirements |
State Population (millions) |
| California | West | State | 95 | No | 38.3 |
| Connecticut | Northeast | State | 88 | No | 3.6 |
| Florida | South | Federal | 91 | No | 19.6 |
| Idaho | West | State | 71 | No | 1.6 |
| Michigan | Midwest | Partnership | 75 | No | 9.9 |
| Minnesota | Midwest | State | 73 | No | 5.4 |
| New Hampshire | Northeast | Partnership | 60 | No | 1.3 |
| New Jersey | Northeast | Federal | 95 | No | 8.9 |
| New York | Northeast | State | 88 | No | 19.7 |
| Ohio | Midwest | Federal | 78 | No | 11.6 |
| Oklahoma | South | Federal | 66 | Yes | 3.9 |
| Pennsylvania | Northeast | Federal | 79 | No | 12.8 |
| SOURCES: HRSA, 2014; Kaiser Family Foundation, 2016; SAMHSA, 2013; Census Bureau, 2010, 2013, 2014, and 2015b; HHS, 2016. | |||||
The sample excludes five states that implemented major statewide reforms of commercial insurance coverage before 2013: Hawaii, Maryland, Massachusetts, Oregon, Vermont, and Washington. The exclusion helps ensure that the final sample of plans more closely represents typical plan offerings in the individual and small group market across the United States. An initial review of state characteristics considered other factors, such as whether the state had a strong or weak parity law (Lang, 2013). Appendix A documents the initial review of all 50 states across a larger set of criteria.
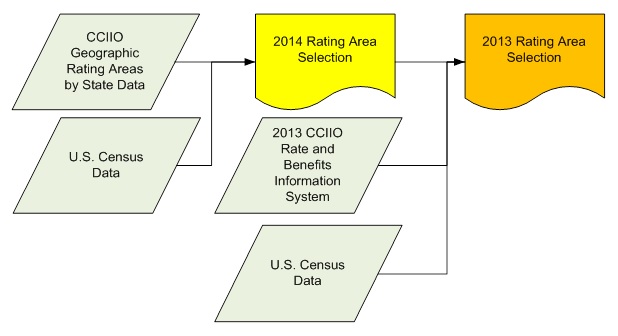
Process of Identifying Most Populous Rating Areas within Each State
Figure 3-3 describes how we combined three data sources to identify the most populous rating areas in each of the sample states. We first selected 2014 rating areas with the highest population according to 2010 census data. We then identified the most populous zip code in those selected 2014 rating areas and selected the 2013 rating areas that contained those most populous 2014 zip codes (Census Bureau, 2015a, 2016). We used Stata 14 and Microsoft Excel 2013 to extract and rank rating areas.
| FIGURE 3-3. Health Insurance Rating Area Selection Process |
|---|
 |
3.2.2. Issuer Selection
Data Sources for Selecting Issuers
We used the CCIIO Medical Loss Ratio (MLR) database to rank issuers by market share in each state and select issuers for the analysis. Insurers are required to submit a report to HHS by June of each year showing how they spent revenues in the past year. Medical loss refers to the amount of the premium spent on medical care and quality improvement; the law requires that 80 percent of insurance premium dollars in the small group insurance plans be spent on medical care or quality improvement and that rebates be provided to customers if the insurer fails to meet this standard. Each insurer's MLR information is provided by state and market (individual, small group, or large group). We decided to focus on determining market share by comparing the issuers with the largest market shares in each state based on: (1) number of covered lives; and (2) total number of policies issued.
Process to Select Issuers
To select issuers within each of the sample states, we first identified the top four issuers with the largest market share for individual and small group markets combined within each state using available information from the MLR database. Market share was defined by: (1) number of covered lives; and (2) total number of policies issued. Of the four identified issuers per state, we then selected at least two issuers based on the availability and completeness of rate and benefit data for those issuers. If the issuer with the highest market share had limited availability of rate and benefit data, the issuer with the next highest market share was selected. Appendix B lists the top four issuers by market share in the sample.
Because we were able to obtain policy documents from only one issuer in California, Blue Cross of California, we deviated from the principle of selecting issuers by largest market share. To identify additional plans due to the lack of data availability in California, we selected two issuers in Oklahoma and Florida that had high market share but were not among the top four issuers already selected. We chose these states and issuers on the basis of available data on insurance plan rate and benefits.
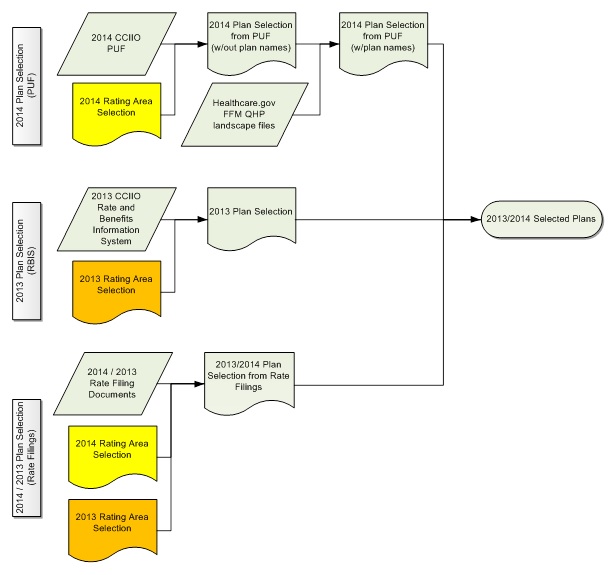
3.2.3. Plan Selection
Data Sources to Select Plans
To identify plans, we used four distinct data sources:
-
CCIIO Health Insurance Marketplace Public Use Files (PUF),
-
CCIIO RBIS data,
-
HealthCare.gov Federal Facilitated Marketplace (FFM) Qualified Health Plan (QHP) Landscape Files, and
-
health insurance rate filings.
The CCIIO Health Insurance Marketplace PUF provided a large portion of 2014 health insurance plan rate data (CCIIO, 2016a). The Marketplace PUF includes plan-level and issuer-level information for certified QHPs and stand-alone dental plans offered to individuals and small businesses through the Health Insurance Marketplace. The Marketplace PUF includes data from states participating in the FFM, which include State Partnership Marketplaces, and states whose state-based Marketplaces rely on the federal information technology platform for QHP eligibility and enrollment functionality.
The CCIIO RBIS data provided the majority of 2013 rate information, because they contain data for the HealthCare.gov inventory of insurance plans, by quarter beginning in 2012 (CCIIO, 2016b). Although RBIS data provide rate information for plans, they have two limitations. First, select issuers in states have redacted rate information from the publicly available data. Therefore, the team requested and received from CCIIO the unredacted 2013 and 2014 rate data to complete this analysis. Second, the 2013 RBIS small group data does not provide rate information for specific small group plans, but rather provides a range of rates for groupings of plans known as products. Therefore, we were unable to use the 2013 RBIS small group data for plan selection.
FFM QHP landscape files provide a succinct and limited set of data available from the Marketplace PUF (HealthCare.gov, 2016b). The FFM QHP landscape files also include plan names, which are not available in the Marketplace PUF. We used this source to link plan names with the plans identified in the Marketplace PUF.
We used health insurance rate filing documents to identify rate information when other previously mentioned data sources did not provide sufficient information. These documents were sourced from required rate filings on state websites, the National Association of Insurance Commissioners' (NAIC's) System for Electronic Rate and Form Filing (SERFF), and by direct request to the states by e-mail and telephone communication. Table 3-2 summarizes the relevant regulatory agencies and the rate filing sources we used, by state.
| TABLE 3-2. Source of Health Insurance Rate Filings, by State | ||||||
|---|---|---|---|---|---|---|
| State | State Regulatory Agency | Federal Marketplace | RBIS | SERFF | State Website | Direct State Contact |
| California | Department of Managed Health Care, California Department of Insurance | X | X | |||
| Connecticut | Connecticut Insurance Department | X | X | X | ||
| Florida | Florida Office of Insurance Regulation | X | X | X | ||
| Idaho | Idaho Department of Insurance | X | X | X | ||
| Michigan | Michigan Department of Insurance and Financial Services | X | X | X | ||
| Minnesota | Minnesota Department of Commerce | X | X | X | ||
| New Hampshire | New Hampshire Insurance Department | X | X | X | ||
| New Jersey | Department of Banking and Insurance | X | ||||
| New York | Department of Financial Services | X | X | |||
| Ohio | Ohio Department of Insurance | X | X | X | ||
| Oklahoma | Oklahoma Insurance Department | X | X | |||
| Pennsylvania | Pennsylvania Insurance Department | X | X | X | ||
Process to Select Plans
To select plans, we followed the process shown in Figure 3-4. We used CCIIO PUF data to select 2014 plans in the selected rating areas, and we used the HealthCare.gov FFM QHP landscape files to identify plan names. We then used CCIIO RBIS data to select 2013 plans in the selected rating areas. For issuers that did not provide plan information in the PUF or RBIS, we completed the process of selecting plans using rate filing documents in the selected rating areas. We completed plan selection using Stata 14, SAS 9.4, and Microsoft Excel 2013.
| FIGURE 3-4. Health Insurance Plan Selection Process |
|---|
 |
For each issuer, we selected 2014 health insurance plans using the following criteria:
-
Within the most populous 2014 rating area for each state, or the next most populous rating area when plans for the selected issuers are not available in the most populous rating area;
-
45 years old;
-
Male;
-
Non-smoker;
-
Coverage for one person only (not a family, no dependents);
-
Not a dental-only plan;
-
Not a grandfathered plan;[3]
-
With an effective date closest to but not before January 1, 2014.
We then selected the lowest priced bronze plan and second highest silver plan per issuer for the individual market and for the small group market, for both on-exchange and off-exchange plans. In cases where only one silver plan was offered, we selected that plan. A maximum of eight plans per issuer could be selected through this process, depending on whether all data were available and the issuer offered both on-exchange and off-exchange plans.
We selected 2013 plans with plan premiums most similar to the premiums of selected 2014 plans. This approach helped reduce confounds when comparing 2013 and 2014 plans. We adjusted 2013 plan premiums for inflation using the Consumer Price Index. Although the annual inflation rate has been low -- at just over 1.5 percent -- we made this adjustment so that for any given 2014 plan we would be able to choose among alternative 2013 comparison plans. Note that it was not possible to use metal category rather than premium to match plans because exchanges were newly created in 2014.
| TABLE 3-3. Plan Selection Data Sources by Issuer and Year/Exchange | |||||||
|---|---|---|---|---|---|---|---|
| State | Issuer | 2014 | 2013 | ||||
| On-Exchange | Off-Exchange | ||||||
| Sourcea | N | Sourcea | N | Sourcea | N | ||
| CA | Blue Cross of California | RF | 2 | RF | 2 | RBIS | 4 |
| CT | Anthem Health Plans | RF | 4 | RF | 4 | RBIS | 7 |
| FL | Aetna Life Insurance Company | PUF | 2 | N/A | N/A | ||
| BCBS of Florida | PUF | 3 | RF | 3 | RBIS | 7 | |
| Coventry Health Care of Florida | PUF | 2 | N/A | RBIS | 2 | ||
| ID | Blue Cross of Idaho | PUF | 2 | RF | 2 | RBIS | 2 |
| PacificSource Health Plans | PUF | 2 | N/A | RBIS | 1 | ||
| SelectHealth | PUF | 2 | N/A | N/A | |||
| MI | BCBS of Michigan | PUF | 2 | N/A | RBIS | 3 | |
| Priority Health | PUF | 2 | N/A | N/A | |||
| MN | BCBS | RF | 4 | RF | 4 | RF | 6 |
| HealthPartners | RF | 2 | RF | 2 | RBIS | 5 | |
| Medica | N/A | 2 | N/A | RBIS | 2 | ||
| NH | Matthew Thornton Health Plan (Anthem BCBS) | PUF | 4 | RF | 4 | RBIS | 6 |
| NJ | AmeriHealth | RF | 2 | RF | 2 | RF | 2 |
| Horizon BCBS | RF | 2 | RF | 2 | RF | 1 | |
| NY | Empire | RF | 2 | N/A | N/A | ||
| Oxford Health Plans | N/A | RF | 2 | N/A | |||
| OH | Community Insurance Company (Anthem BCBS) | PUF | 2 | RF | 2 | RBIS | 4 |
| Humana Health Plan of Ohio | PUF | 1 | N/A | N/A | |||
| OK | BCBS of Oklahoma | PUF | 2 | N/A | RBIS | 1 | |
| CommunityCare | PUF | 2 | N/A | RBIS | 1 | ||
| Coventry Health Care of Kansas | PUF | 2 | N/A | RBIS | 2 | ||
| PA | Aetna | PUF | 2 | N/A | RBIS | 2 | |
| Highmark | PUF | 2 | RF | 2 | RBIS | 2 | |
| Total number of plans | 54 | 31 | 60 | ||||
|
|||||||
To complete 2013 plan selection, we restricted rates for 2013 health insurance plans to the same conditions as those for 2014 plans, with two exceptions. First, we identified the most populous zip code within the most populous 2014 rating area and then selected 2013 plans offered in that zip code. Second, we selected plans with an effective date closest to but not before January 1, 2013. Then, for each selected 2014 plan, we selected a matching 2013 plan from the same state, issuer, and market type by choosing the 2013 plan with the smallest absolute difference in premium from the 2014 plan. We normalized prices using the Consumer Price Index. Because we were interested in obtaining the best match based on premium, some selected 2014 plans with equal or similar premiums from the same state, issuer, and market were matched to identical 2013 plans.
In some cases, selected plans from either year did not have sufficient benefit information to complete benefit abstraction. We therefore removed such plans from the analysis and selected the next most applicable plan.
The original design of the study was to select 2014 plans and then case match to them comparison plans from 2013, potentially with duplication. For the 85 2014 plans we were able to identify 81 2013 group plans as case-matched comparison plans (166 plans in total). These 81 case-matched comparison plans included 16 duplicate plans. Excluding these duplicates, we thus had documents for 145 unique plans, with 85 2014 plans and 60 2013 unique plans. Of the 2014 plans, 66 were individual market plans and 19 were small group, and of the 2013 plans, 47 were individual market and 13 were small group. Table 3-3 lists each of the selected states and issuers, the data sources used to complete plan selection for each, and the number of plans selected for each issuer, by year and exchange type.
3.3. Abstract Plan Benefit Data
After identifying plans, we located and manually reviewed each plan's benefit data. We then systematically abstracted the benefit information using two templates, one for the plan benefit data on scope and coverage and the other for information on prescription drug coverage and formulary design.
3.3.1. Data Sources
We obtained plan benefit data and issuer pharmacy data from health insurance policy documents, including plan policy contracts, certificates of coverage, summaries of benefits and coverage, and other documents that detailed either scope of benefits covered or cost-sharing level (e.g., HealthCare.gov, 2016c). These documents were sourced from required form filings on state websites, NAIC's SERFF, or publicly accessible insurer or insurance broker websites (Table 3-4). If the data were not available online, we requested policy documents directly from states.
| TABLE 3-4. Source of Health Insurance Benefit Information Policy Documents, by State | |||||
|---|---|---|---|---|---|
| State | State Regulatory Agency | SERFF | State Website | Other Website | Direct State Contact |
| California | Department of Managed Health Care, California Department of Insurance | X | |||
| Connecticut | Connecticut Insurance Department | X | X | ||
| Florida | Florida Office of Insurance Regulation | X | X | ||
| Idaho | Idaho Department of Insurance | X | |||
| Michigan | Michigan Department of Insurance and Financial Services | X | X | ||
| Minnesota | Minnesota Department of Commerce | X | X | X | |
| New Hampshire | New Hampshire Insurance Department | X | X | ||
| New Jersey | Department of Banking and Insurance | X | X | ||
| New York | Department of Financial Services | X | |||
| Ohio | Ohio Department of Insurance | X | |||
| Oklahoma | Oklahoma Insurance Department | X | |||
| Pennsylvania | Pennsylvania Insurance Department | X | X | ||
| NOTE: Other Website = insurer, broker, or consumer website. | |||||
3.3.2. Plan Data Abstraction
We developed a data entry template in Microsoft Excel to systematically abstract and store data from plan documents. The template details scope and level information for behavioral health and medical/surgical conditions on parallel benefit classes (e.g., inpatient, outpatient, office visits) and for unique and policy-relevant specific conditions and services (e.g., coverage for autism). Combined across scope and level and across types of conditions, the template included 241 data fields.
Analysts reviewed all documents for each plan for text on each data field and entered the findings into the template. To ensure that the data supported quantitative analysis, we standardized the entry of freeform text by defining keywords and, where applicable, defining common synonyms for keywords. We created a separate reference document that details and distinguishes between the following categories of services in particular: intermediate care, intensive behavioral therapy, intensive outpatient treatment (or therapy), and post-acute or rehabilitative care. Because these services share similar characteristics, it was particularly important to distinguish among the services. Appendix C presents the keywords and discusses guidance on abstracting data on these services.
Many data fields on scope recorded whether coverage for a specific condition or service was evident; the data from the plan text for these fields were entered into four categories:
-
explicitly provides coverage;
-
explicitly excludes coverage;
-
neither explicitly provides nor excludes coverage; and
-
mentions the item, but coverage is unclear.
We reviewed and reconciled instances where data fields had an "unclear" data entry.
3.3.3. Pharmacy Data Abstraction
The main data source for pharmacy data was plan formularies. A formulary lists covered medications by class and sub-class of condition and contains rudimentary information on which cost-sharing tier of coverage the medication falls into and coverage limitations within that tier, such as quantity limits. The tier determines the consumer burden, with the first tier typically covering many generic medications with the lowest level of consumer burden. The number and meaning of tiers varies across formularies.
Importantly, we found that for all the plans we assessed, the formulary was set at the issuer-level and did not vary across plans. We could not find formulary data for all plans or always reliably attribute a formulary to a specific plan that was consistent over time. For these reasons, we sampled five issuer formularies for both 2013 and 2014.
Because the number of all available medications would be unwieldy analytically, we narrowed the formulary analysis to therapy for behavioral health and four classes of chronic medical conditions: asthma, cardiovascular disease, diabetes, and HIV/AIDS. Although the number of medications that this process then included varied by formulary and year, the final data included approximately 270 medications for each formulary.
To develop a template for pharmacy data, we developed a list of medications for behavioral health and medical/surgical conditions using medication guidance from government agencies (e.g., U.S. National Library of Medicine), non-profit interest groups (e.g., American Heart Association), and the appropriate academies (e.g., American Academy of Allergy, Asthma and Immunology). We abstracted for each medication whether the medication was explicitly covered, the tier for medication, and the type of any limitations.
3.4. Perform Analysis
We merged and analyzed abstracted plan benefit and pharmacy benefit data using Stata 14. We converted data on scope of coverage to dichotomous variables in the case of "yes" or "no" responses and to categorical variables in the case of "explicitly covered," "explicitly excluded," or "neither" responses. "Unclear" responses were converted to missing. We used the converted data to create frequency counts and percentages of the various response types by year and exchange type.
We converted data on level of coverage, including deductibles, out-of-pocket limits, co-insurance, and co-pay, to numeric variables. Non-numeric responses (e.g., "n/a," "none," or "not stated") were converted to missing. For plan benefit characteristics that were tiered (e.g., pharmacy cost-sharing), we used only the data for the first tier in the analysis. We treated co-insurance for plans with a 0 percent co-insurance and positive co-payment as having no co-insurance; we treated plans with a zero co-payment and positive co-insurance as having no co-payment. We did not adjust monetized benefit features, such as co-payments, for inflation. We created new dichotomous variables indicating whether plans applied the specified type of cost-sharing (for example, whether a co-insurance rate is applied). We then used the converted data and new variables to create summary statistics by year and exchange type.
For each prescription drug, we assessed its tier (i.e., 1, 2, 3, or missing) and any exceptions noted in the formulary (e.g., step therapy, prior authorization) as categorical variables. We grouped prescription medications by condition type (e.g., attention deficit/hyperactivity disorder [ADHD], anti-anxiety, asthma) and then tabulated frequency distributions for the count of drugs by condition type within each tier and exception type by year. In some instances, matched formularies would list prescription medication information in one year's formulary but not the other. Because of the small sample size, these partially missing data could bias the results. We therefore included medication data only if they were available in matched formularies for both years.
We used t-tests to assess statistically significant differences in scope, level, and prescription drug coverage across years. To the extent possible, we also used t-tests to compare differences in scope and level between behavioral health and medical surgical, and in-network and out-of-network. Finally, we ran t-tests in sub-analyses to compare differences in scope and level between on-exchange and off-exchange plans, plans in Medicaid and non-Medicaid expanded states, and plans in state and federally facilitated marketplaces.
We searched data on measures of NQTLs by reviewing text that had not been systematically captured when applying the pre-designed template. We searched for keywords (e.g., prior authorization) and then thematically categorized and aggregated the results. We followed the guidance for terminology in Appendix D.
A review of plan data confirmed that the plan documents that we reviewed do not contain sufficient information about network size. Research questions on this topic relies on synthesizing the discussion from the key informant discussions.
3.5. Key Informant Discussions: Data and Analysis
3.5.1. Overview
We held discussions with nine key informants representing eight different organizations to get their impressions on the behavioral health benefit coverage changes after the implementation of parity requirements. Information from the key informant discussions addressed the first four research questions. Key informants for this project included representatives from issuers, state health insurance officials, nationally recognized experts who study state health insurance plans more broadly, and benefits consultants with experience in benefit and plan design. In addition to the key informants below, the National Academy for State Health Policy was a partner on this project and also provided their knowledge and expertise.
3.5.2. Key Informant Discussions: Data
The discussions were 1-hour, open-ended, semistructured meetings conducted by telephone. We developed and used a discussion guide for all conversations (Appendix D) that covered the four core areas of the research questions: scope of coverage, level of coverage, network adequacy, and the use of Managed Behavioral Health Organizations. We tailored each guide to fit the background of the informant. For example, for informants with state-specific expertise, the guide included probes on how the state defines and applies network adequacy requirements.
At least two study team members participated in each discussion: a lead, who conducted the conversation, and a note taker. We audio-recorded the conversation with informants' approval. The recording was used to prepare detailed and accurate notes. After summarizing the discussion findings in a report, we deleted the recordings.
3.5.3. Key Informant Discussions: Analysis
We reviewed the notes for each discussion and created thematic statements for each topic that was discussed, including topics that were raised but were not included in the discussion guide. We then created thematic statements by combining topical statements across discussions. This approach to analysis deliberately treated the data from the discussions as qualitative data from a limited set of discussions. Thus, the data did not support quantification -- which was a key step in the plan benefit data, above -- and significant gains were not likely from applying qualitative data analysis tools, such as ATLAS.ti.
We reviewed the qualitative data to identify themes regarding coverage and relevant changes between 2013 and 2014. For example, with regard to network adequacy, we assessed the responses for themes on the types of behavioral health services provided in networks, the extent to which difficulties with accessing behavioral health services are related to geographic dispersion, and whether there was a trend among behavioral health providers in accepting new patients following the coverage expansion. We then compared these themes with those for medical/surgical benefits.
4. RESULTS
4.1. Scope of Coverage
4.1.1. Overview
To assess scope of coverage, analyses focus on coverage exclusions and inclusions, broken out by conditions and treatment services. To ensure that the results are easily interpretable, all main analyses focused on in-network coverage, wherever network status is specified in plan documents. Out-of-network coverage is described in a separate sub-analysis. Also, this section addresses the proportion of plans covering prescription medications; Section 4.3 describes more detailed analyses of formularies and NQTLs for prescription medication.
The tables and figures in this section report the number of observations and estimates of the relevant percentages and counts. For the sake of clarity of presentation, these tables and figures do not present t-values and p-values. The appendix tables (Appendix E) present the estimates of t-values and p-values. The title of each appendix table provides the corresponding table number from the main report. Because we used the estimates from one table or figure to make multiple comparisons (e.g., by year and by setting), a given table in the main body of the text may map to more than one appendix table.
4.1.2. Scope of Coverage by Medical or Behavioral Health Condition
Figure 4-1 shows little change in the proportion of plans with an explicit exclusion for any behavioral health condition between 2013 and 2014 (52 percent and 53 percent), and little change in this proportion for any medical/surgical condition (77 percent and 76 percent). Explicit exclusions were less common for behavioral health than medical/surgical conditions (p = 0.00 in both years).
| FIGURE 4-1. Percentage of Plans with Any Explicitly Stated Exclusion for Behavioral Health and for Medical/Surgical Conditions, 2013 and 2014 |
|---|
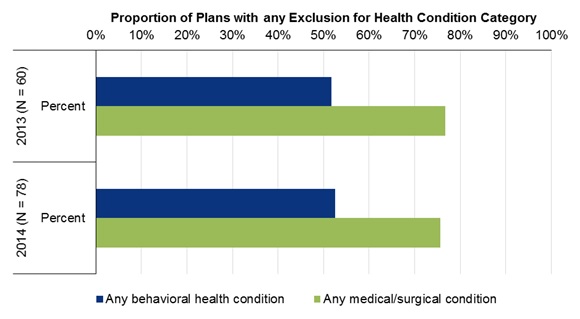 |
Table 4-1 disaggregates the estimates by three specific, policy-relevant conditions. The proportion of plans explicitly covering autism more than doubled from 2013 to 2014, with an increase from 20 percent to 53 percent. The proportions explicitly excluding and omitting the condition from the plan document altogether fell by more than 50 percent over this same period. The estimates of change over time for autism were statistically significant at conventional levels (p < 0.05). The proportion of plans with missing data (approximately 11 percent) regarding autism -- because the document with relevant coverage information was missing -- changed little over time.
The estimates in Table 4-1 also vary considerably across the three conditions. Organic brain disorders and tobacco use were typically not mentioned in plan documents. However, whereas the proportion of plans explicitly covering organic brain disorders did not change over time, the proportion covering tobacco use doubled. The relatively large increase in the proportion of plans covering tobacco use -- from 12 percent to 21 percent -- was not statistically significant. For the purposes of the current study, the plan documents frequently did not sufficiently describe coverage for any of the three conditions. Autism coverage in 2014 was insufficiently described in nearly 25 percent of the plans, for example.
| TABLE 4-1. Percentage of Plans with Explicitly Stated Coverage and Exclusions for Select Health Conditions, 2013 and 2014 | ||||||||
|---|---|---|---|---|---|---|---|---|
| Health Condition | 2013 (N=60) | 2014 (N = 78) | ||||||
| Covered | Excluded | Uncleara | Missingb | Covered | Excluded | Uncleara | Missingb | |
| Autism | 20% | 23% | 45% | 12% | 53% | 9% | 24% | 14% |
| Organic brain disorders | 7% | 0% | 82% | 12% | 8% | 0% | 76% | 17% |
| Tobacco use | 12% | 0% | 77% | 12% | 21% | 0% | 63% | 17% |
|
||||||||
4.1.3. Scope of Coverage by Care Setting
Table 4-2 presents estimates for the five categories of care that map to those specified in parity legislation. For the sake of brevity, the discussion focuses on the proportion of plans explicitly stating coverage. We found that plan documents almost always mentioned setting.
From 2013 to 2014, coverage in the five settings for behavioral health conditions converged with coverage for medical/surgical conditions. Consider, for example, outpatient coverage. In 2013, a lower proportion of plans explicitly covered either mental health (65 percent) or substance use (68 percent) conditions than medical/surgical conditions (88 percent) (p = 0.00 for comparisons to medical/surgical coverage). By 2014, the proportion of plans covering the two sets of behavioral health conditions had increased to equal the proportion covering medical/surgical conditions (approximately 86 percent).
In Table 4-2, we separately assess plan document coverage for mental health care and for substance use disorder care. In both years, we found these two proportions to be similar across all five service settings.
| TABLE 4-2. Percentage of Plans with Explicitly Stated Coverage and Exclusions, for Setting and Health Condition Category, 2013 and 2014 | ||||||||
|---|---|---|---|---|---|---|---|---|
| Setting/Health Condition | 2013 (N=60) | 2014 (N = 78) | ||||||
| Covered | Excluded | Uncleara | Missingb | Covered | Excluded | Uncleara | Missingb | |
| Inpatient | ||||||||
| Mental health | 72% | 17% | 0% | 12% | 86% | 0% | 0% | 14% |
| Substance abuse | 68% | 20% | 0% | 12% | 86% | 0% | 0% | 14% |
| Medical/surgical | 88% | 0% | 0% | 12% | 86% | 0% | 0% | 14% |
| Outpatient (including urgent care) | ||||||||
| Mental health | 65% | 23% | 0% | 12% | 86% | 0% | 0% | 14% |
| Substance abuse | 68% | 20% | 0% | 12% | 86% | 0% | 0% | 14% |
| Medical/surgical | 88% | 0% | 0% | 12% | 86% | 0% | 0% | 14% |
| Office visits | ||||||||
| Mental health | 68% | 20% | 0% | 12% | 86% | 0% | 0% | 14% |
| Substance abuse | 68% | 20% | 0% | 12% | 86% | 0% | 0% | 14% |
| Medical/surgical | 88% | 0% | 0% | 12% | 86% | 0% | 0% | 14% |
| Emergency | ||||||||
| Mental health | 70% | 18% | 0% | 12% | 81% | 0% | 5% | 14% |
| Substance abuse | 68% | 18% | 2% | 12% | 81% | 0% | 5% | 14% |
| Medical/surgical | 88% | 0% | 0% | 12% | 86% | 0% | 0% | 14% |
| Prescription drugs | ||||||||
| Mental health | 75% | 13% | 0% | 12% | 83% | 0% | 3% | 14% |
| Substance abuse | 60% | 22% | 7% | 12% | 83% | 0% | 3% | 14% |
| Medical/surgical | 88% | 0% | 0% | 12% | 86% | 0% | 0% | 14% |
|
||||||||
4.1.4. Scope of Coverage by Service
Table 4-3 describes plan coverage for four types of services that are important for behavioral health care; are resource-intensive yet community-based; and that may have a medical/surgical equivalent: intensive behavioral therapy, intensive outpatient treatment (IOT), intermediate care, and post-acute or rehabilitative treatment. Intensive behavioral therapy is typically used for autism spectrum disorder and requires significant provider time; therapies for dialysis or diabetes management may require similar levels of care. IOT occurs in an outpatient setting but is a higher level of care than outpatient care. Intermediate care is as much defined by its setting as being a specific type of care; it often takes place in the community and often includes care in the home. Post-acute care may include some of the other three forms of therapy in the table and refers to services following an acute event, as opposed to, say, chronic care management (Appendix C further describes the services).
There were four major findings. The first and perhaps most important finding was that the proportion of plans explicitly covering each service for behavioral health conditions increased over time. The increase was statistically significant for each service (p < 0.05). For example, the proportion covering post-acute care or rehabilitative treatment for behavioral health conditions increased from 33 percent to 54 percent (p = 0.00).
A second finding is the proportion of plans with explicit coverage for these services when applied to medical/surgical conditions did not generally change over time. The exception was intensive behavioral therapy, which increased over the 2 years, from 3 percent to 18 percent (p = 0.01). For the other three services, the proportion explicitly stating coverage was relatively high and did not change over time. For example, the proportion of plans explicitly covering post-acute or rehabilitative treatment for medical/surgical conditions was 87 percent in 2013 and 83 percent in 2014.
| TABLE 4-3. Percentage of Plans with Explicitly Stated Coverage and Exclusions for Select Services, by Health Condition Category, 2013 and 2014 | ||||||||
|---|---|---|---|---|---|---|---|---|
| Health Condition | 2013 (N=60) | 2014 (N = 78) | ||||||
| Covered | Excluded | Uncleara | Missingb | Covered | Excluded | Uncleara | Missingb | |
| Intensive behavioral therapy | ||||||||
| Behavioral health | 12% | 30% | 47% | 12% | 32% | 29% | 22% | 17% |
| Medical/surgical | 3% | 18% | 67% | 12% | 18% | 13% | 53% | 17% |
| IOT | ||||||||
| Behavioral health | 38% | 18% | 32% | 12% | 74% | 0% | 9% | 17% |
| Medical/surgical | 78% | 0% | 10% | 12% | 77% | 0% | 6% | 17% |
| Intermediate care settings | ||||||||
| Behavioral health | 15% | 27% | 47% | 12% | 38% | 0% | 45% | 17% |
| Medical/surgical | 60% | 8% | 20% | 12% | 67% | 0% | 17% | 17% |
| Post-acute or rehabilitative treatment | ||||||||
| Behavioral health | 33% | 18% | 37% | 12% | 54% | 0% | 29% | 17% |
| Medical/surgical | 87% | 0% | 2% | 12% | 83% | 0% | 0% | 17% |
|
||||||||
A third finding is that in 2013 many plans had explicit exclusions for these four services for behavioral health conditions, but in 2014 few plans had any such exclusions. Moreover, these services were not excluded for medical/surgical conditions in plans in 2013 or in 2014. For post-acute or rehabilitative treatment, the proportion of plans with explicit exclusions for behavioral health conditions fell from 18 percent to 0 percent (p = 0.00), and there was no plan with exclusions for this service for medical/surgical conditions at any point (p = 1.00).
Fourth, the table shows that the proportion of plan documents with usable data was relatively low. This finding qualifies the above three findings, because there were relatively few plans where we could find the service in plain text, the service was mentioned clearly, or the data were usable. Terms describing coverage for post-acute or rehabilitative treatment for behavioral health care were not documented at all in 37 percent of plans in 2013 and 29 percent of plans in 2014.
In addition to the types of care described in the table, we also assessed changes in three services that likely apply only to behavioral health care: detoxification (increased from 58 percent to 71 percent), integrated treatment (from 0 percent to 5 percent), and residential facility stays (from 45 percent to 51 percent). However, among these services, only the increase for detoxification was statistically significant (p = 0.02).
4.1.5. Scope of Coverage and Non-Quantitative Treatment Limitations by Setting
We searched plan documents for keywords capturing NQTLs and stratified the results by setting. Because of differences in the number and types of NQTLs, the results regarding prescription medication are presented separately in Section 4.3.
Table 4-4 shows the proportion of plans with documented occurrences of select NQTLs by setting. Because the differences between behavioral health and medical/surgical were minimal, we limited the table to coverage for behavioral health care only. We also selected NQTL/setting combinations because specific types of NQTL are designed to apply to certain settings. Additionally, for the sake of brevity, we typically only included NQTLs that we found in at least 5 percent of plans for both in-network and out-of-network status or for more than 1 year.
| TABLE 4-4. Percentage of Plans with Select NQTLs for Behavioral Health Care, 2013 and 2014 | ||||
|---|---|---|---|---|
| NQTL Type | 2013 | 2014 | ||
| N | Percent of Plans | N | Percent of Plans | |
| Inpatient | ||||
| Concurrent review | 60 | 15% | 78 | 4% |
| Preadmission notification | 60 | 17% | 78 | 8% |
| Precertification | 60 | 12% | 78 | 26% |
| Prior authorization | 60 | 45% | 78 | 49% |
| Retrospective review | 60 | 0% | 78 | 9% |
| Outpatient | ||||
| Precertification | 60 | 7% | 78 | 13% |
| Prior authorization | 60 | 25% | 78 | 33% |
| Office visit | ||||
| Prior authorization | 60 | 2% | 78 | 8% |
| Retrospective review | 60 | 0% | 78 | 4% |
| Emergency Department | ||||
| Admission notification | 60 | 23% | 78 | 29% |
| Retrospective review | 60 | 5% | 78 | 3% |
Limited evidence indicated that the proportion of plans with each type of NQTL for behavioral health care in the inpatient setting changed over time; few of the differences were statistically significant. For the inpatient setting, plans used four types of NQTLs: concurrent review, preadmission notification, precertification, and prior authorization. Prior authorization was common, and the proportion of plans using this type of NQTL did not change much across the years. In inpatient settings, 45 percent of plans used prior authorization for behavioral health care in 2013, which rose slightly to 49 percent of plans in 2014, for example. The proportion of plans using concurrent review and preadmission notification fell by half from 2013 to 2014. Finally, the proportion using precertification more than doubled (from 12 percent to 26 percent). The most common NQTL in the emergency department setting was admission notification. We found this requirement in 23 percent and 29 percent of plans (2013 and 2014).
We also assessed other forms of NQTLs. Tiered co-insurance applied to approximately 10 percent of plans over the 2 years. Three other NQTLs were rarely used in inpatient and ambulatory settings: (1) preauthorization specifically for inpatient admission from the emergency department; (2) requiring a treatment plan; and (3) utilization management.
4.2. Level of Coverage
4.2.1. Overview
The majority of plans documented co-payments and co-insurance, and we assessed these measures of level of coverage by setting. In addition to co-payments and co-insurance, we also reviewed deductibles in plans. We did not find differences in deductibles between behavioral health and medical/surgical care and did not further review for changes in deductibles over the 2 years.
4.2.2. Co-Payment
Co-payments were most commonly used for office visits, emergency department, and prescription medication (Table 4-5). The change over time in this proportion varied across these settings, with the proportion falling over time for both office visits and prescription medications, but increasing for emergency department visits.
| TABLE 4-5. Percentage of Plans with Co-Payments for the Initial Visit, by Setting and Health Condition Category, 2013 and 2014 | ||||
|---|---|---|---|---|
| Setting/Health Condition | 2013 | 2014 | ||
| N | % | N | % | |
| Inpatient | ||||
| Behavioral health | 34 | 9% | 58 | 24% |
| Medical/surgical | 45 | 18% | 58 | 38% |
| Outpatient | ||||
| Behavioral health | 34 | 15% | 59 | 27% |
| Medical/surgical | 44 | 16% | 58 | 10% |
| Office visit | ||||
| Behavioral health | 35 | 66% | 57 | 54% |
| Medical/surgical | 49 | 76% | 56 | 68% |
| Emergency department | ||||
| Behavioral health | 38 | 50% | 55 | 62% |
| Medical/surgical | 48 | 50% | 59 | 58% |
| Prescription drug | ||||
| Behavioral health | 39 | 87% | 56 | 57% |
| Medical/surgical | 47 | 87% | 57 | 56% |
The table also shows an increase over time in other settings. The proportion of plans with co-payments for medical/surgical inpatient care doubled from 18 percent in 2013 to 38 percent in 2014 (p = 0.03). Behavioral health coverage increased in inpatient (from 9 percent to 24 percent) and outpatient settings (from 15 percent to 27 percent). However, increases for behavioral health care were not statistically significant at conventional levels.
There were also some differences when comparing the proportion of plans requiring co-payments for behavioral health and the proportion requiring co-payments for medical/surgical care, and this difference varied by setting. For office visits, the proportion of plans with a co-payment for behavioral health care was lower than the medical/surgical proportion in each year. In contrast, for prescription medication, the behavioral health and medical/surgical proportions were essentially the same in each year. None of the comparisons between behavioral health and medical/surgical proportions with a co-payment were statistically significant. Given the low inflation rate in 2013, it is unlikely that adjusting for inflation would alter the statistical significance of findings.
We also assessed the level of co-payments by each of the five setting/network status combinations (Table 4-6). Because few plans required a co-payment in the inpatient and outpatient settings, we caution against interpreting comparisons for these two settings. For the other three settings, we assessed differences between the two health condition categories and between 2013 and 2014. The co-payment in the office visit setting for behavioral health care was higher than the co-payment for medical/surgical care in both years. The difference in 2013 (at $5.06) was only marginally significant (p < 0.1), whereas the difference in 2014 (at $10.89) was statistically significant (p < 0.05). In the emergency department setting and for prescription drugs, the average co-payment difference was zero or relatively small. Although the estimates suggest increases over time in the average co-payment amounts in each setting, the increase was not statistically significant.
| TABLE 4-6. Average Co-Payment Amounts for the Initial Visit, Among Plans with Co-Payments, by Setting and Health Condition Category, 2013 and 2014 | ||||
|---|---|---|---|---|
| Setting/Health Condition | 2013 | 2014 | ||
| N | $ | N | $ | |
| Inpatient | ||||
| Behavioral health | 3 | $516.67 | 14 | $614.29 |
| Medical/surgical | 8 | $481.25 | 22 | $561.36 |
| Outpatient | ||||
| Behavioral health | 5 | $108.00 | 16 | $59.06 |
| Medical/surgical | 7 | $335.71 | 6 | $235.00 |
| Office visit | ||||
| Behavioral health | 23 | $35.87 | 31 | $43.39 |
| Medical/surgical | 37 | $30.81 | 38 | $32.50 |
| Emergency department | ||||
| Behavioral health | 19 | $190.79 | 34 | $238.97 |
| Medical/surgical | 24 | $194.38 | 34 | $238.97 |
| Prescription drug | ||||
| Behavioral health | 34 | $12.56 | 32 | $13.06 |
| Medical/surgical | 41 | $12.68 | 32 | $13.06 |
4.2.3. Co-Insurance
Co-insurance was most commonly used in the inpatient, outpatient, and emergency department settings (Table 4-7). It is important to recognize that some plans use both co-payment and co-insurance, so the proportion of plans that use co-insurance is not necessarily the complement of the proportion of plans that use co-payments. For all settings except prescriptions drugs, co-insurance was used more often in 2013 than in 2014. In 2013, co-insurance was more common for behavioral health than medical/surgical conditions, but none of the differences were statistically significant. To understand this change over time further, we also found that many of the 2014 plans with 0 percent co-insurance were a bronze metal level with a relatively high deductible and no co-payment. Thus, even with no co-insurance, the overall cost to the consumer of accessing services may have been relatively high.
| TABLE 4-7. Percentage of Plans with Co-Insurance for the Initial Visit, by Setting and Health Condition Category, 2013 and 2014 | ||||
|---|---|---|---|---|
| Setting/Health Condition | 2013 | 2014 | ||
| N | % | N | % | |
| Inpatient | ||||
| Behavioral health | 36 | 89% | 64 | 69% |
| Medical/surgical | 47 | 77% | 64 | 72% |
| Outpatient | ||||
| Behavioral health | 36 | 83% | 63 | 56% |
| Medical/surgical | 47 | 77% | 64 | 70% |
| Office visit | ||||
| Behavioral health | 34 | 38% | 59 | 34% |
| Medical/surgical | 47 | 34% | 59 | 25% |
| Emergency department | ||||
| Behavioral health | 38 | 74% | 53 | 47% |
| Medical/surgical | 48 | 65% | 57 | 53% |
| Prescription drug | ||||
| Behavioral health | 35 | 31% | 62 | 37% |
| Medical/surgical | 43 | 28% | 62 | 35% |
Table 4-8 shows the percentage of costs borne by the consumer in the form of co-insurance. The estimates suggest little difference in the co-insurance rates between behavioral health and medical/surgical care and little change from 2013 to 2014. With one exception, the differences between health condition categories and over time were four percentage points or less. The exception was for prescription drugs, where the rate fell over time by 8 percentage points for behavioral health and 6 percentage points for medical/surgical care.
| TABLE 4-8. Consumer Co-Insurance Payment for Initial Visit, by Setting and Health Condition, 2013 and 2014 | ||||
|---|---|---|---|---|
| Setting/Health Condition | 2013 | 2014 | ||
| N | Consumer Co-Insurance Payment for Initial Visit (%) |
N | Consumer Co-Insurance Payment for Initial Visit (%) |
|
| Inpatient | ||||
| Behavioral health | 32 | 25% | 44 | 26% |
| Medical/surgical | 36 | 25% | 46 | 27% |
| Outpatient | ||||
| Behavioral health | 30 | 26% | 35 | 25% |
| Medical/surgical | 36 | 25% | 45 | 26% |
| Office visit | ||||
| Behavioral health | 13 | 29% | 20 | 27% |
| Medical/surgical | 16 | 24% | 15 | 29% |
| Emergency department | ||||
| Behavioral health | 28 | 26% | 25 | 29% |
| Medical/surgical | 31 | 26% | 30 | 30% |
| Prescription drug | ||||
| Behavioral health | 11 | 41% | 23 | 33% |
| Medical/surgical | 12 | 39% | 22 | 33% |
4.2.4. Effective Co-Insurance Rates
In addition to assessing variation in the co-insurance rate, we also computed an effective co-insurance rate, based on a combination of coverage scope and the actual co-insurance rate. For plans that had a co-insurance rate but where the scope data indicated no coverage, we applied a co-insurance rate of 100 percent. In other words, the consumer would pay the cost for those conditions, services, or settings not covered.
In 2013, the effective co-insurance rate for behavioral health conditions was higher than that for medical/surgical conditions in all settings (Table 4-9). The average effective co-insurance rate was higher for office visits by 9 percentage points, for example. However, in 2014, this difference in rate between behavioral health and medical/surgical was negligible.
| TABLE 4-9. Average Percentage of Initial Visit Cost Paid for by Consumer (based on co-insurance and coverage scope), by Setting and Health Condition, 2013 and 2014 | ||||
|---|---|---|---|---|
| Setting/Health Condition | 2013 | 2014 | ||
| N | % | N | % | |
| Inpatient | ||||
| Behavioral health | 43 | 40% | 51 | 27% |
| Medical/surgical | 38 | 25% | 53 | 27% |
| Outpatient | ||||
| Behavioral health | 43 | 45% | 42 | 26% |
| Medical/surgical | 38 | 25% | 52 | 27% |
| Office visit | ||||
| Behavioral health | 26 | 58% | 22 | 26% |
| Medical/surgical | 18 | 23% | 17 | 28% |
| Emergency department | ||||
| Behavioral health | 39 | 39% | 36 | 29% |
| Medical/surgical | 33 | 25% | 37 | 30% |
| Prescription drug | ||||
| Behavioral health | 22 | 63% | 28 | 33% |
| Medical/surgical | 17 | 47% | 27 | 32% |
4.2.5. Other Quantitative Aspects of Level
In addition to co-payments and co-insurance, we also assessed: (a) the number of office visits required before the deductible is applied, by medical condition and year; and (b) any behavioral health quantity limits in general, by network status and year. With regard to the number of office visits required before the deductible is applied, we found that twice as many plans had a minimum office visit requirement for medical/surgical care than for behavioral health care (p < 0.00; results not shown). Conditional on there being such a requirement, there was a minimal difference in the number of visits required for behavioral health and medical/surgical care.
In 2013, we found that behavioral health quantity limits for inpatient settings were common. Forty percent of plans had behavioral health quantity limits for in-network inpatient coverage, and 37 percent had quantity limits for out-of-network inpatient coverage. Among plans with a limit, we found an average of 26 separate limits in network and 23 out-of-network. A lower proportion of plans had behavioral health quantitative limits for outpatient (approximately 17 percent) and office (12 percent) visits, regardless of network status. However, the number of limits was still high, at 22 and 12 limits on average for the two settings, regardless of network status. In 2014, very few plans had any such limits.
4.3. Formulary Coverage and NQTL's for Prescription Medication
To assess changes in prescription medication, we used two sources of data: plan formularies and the documents that describe benefits that were used above. We used plan formularies to assess differences in tiers and in quantitative restrictions. To construct these data, we matched five formularies from 2013 to 2014 and then reviewed coverage across years and across behavioral health conditions and four chronic conditions: asthma, diabetes, cardiovascular disease, and HIV/AIDS. Results describe which medications were covered, the medications in each tier, and the within-tier restrictions. The unit of analysis -- or the item that is counted for the denominator when stating proportions -- is a unique combination of type of medication and formulary. However, to ensure a straightforward description of the findings, the text simply refers to proportions of medications.
We used plan data used elsewhere in the current study to assess: (a) separate deductibles for pharmacy; and (b) NQTLs for prescription drugs. These data provided the only information available on NQTLs because none of the formulary data in the current study mentioned NQTLs.
4.3.1. Analysis of Tiers and Quantitative Limits: Formulary Data
Table 4-10 shows that behavioral health medications were typically categorized as tier 1, the tier with the least restrictions and least cost-sharing. For example, 86 percent and 88 percent of the 28 antidepressant medications assessed in 2013 and 2014, respectively, were in tier 1. The behavioral health medication category with the lowest proportion of medications in tier 1 was ADHD, with 63 percent of 14 medications in tier 1.
We also assessed substance use medications separately for four of the seven medications that may be used as part of medication assisted treatment (MAT) for opioid use disorder -- long-acting injectable naltrexone, which may also be used for alcohol use disorders; buprenorphine HCl; buprenorphine HCl/naloxone; and methadone. We found a similarly high proportion of MAT medications were in tier 1: in 2013 and in 2014, 83 percent and 95 percent of the MAT medications were in tier 1.
| TABLE 4-10. Distribution of Behavioral Health Medications across Formulary Tiers, 2013 and 2014 | |||||
|---|---|---|---|---|---|
| Behavioral Health Medication Category | Number of Drugs in Category |
Year | Tier 1 (%) | Tier 2 (%) | Tier 3 (%) |
| Combination antipsychotic and antidepressant medications | 3 | 2013 | 80% | 10% | 10% |
| 2014 | 90% | 0% | 10% | ||
| Antipsychotic medications | 18 | 2013 | 68% | 12% | 20% |
| 2014 | 71% | 8% | 20% | ||
| Antidepressant medications | 28 | 2013 | 86% | 4% | 10% |
| 2014 | 88% | 1% | 12% | ||
| Mood stabilizing and anticonvulsant | 8 | 2013 | 98% | 3% | 0% |
| 2014 | 98% | 3% | 0% | ||
| Anti-anxiety medications | 8 | 2013 | 100% | 0% | 0% |
| 2014 | 100% | 0% | 0% | ||
| ADHD medications | 14 | 2013 | 63% | 16% | 21% |
| 2014 | 63% | 16% | 21% | ||
| Substance use medications | 7 | 2013 | 85% | 7% | 9% |
| 2014 | 91% | 0% | 9% | ||
| Tobacco cessation medications | 11 | 2013 | 84% | 16% | 0% |
| 2014 | 84% | 16% | 0% | ||
By contrast, with the exception of cardiovascular disease, relatively few of the comparison chronic condition medications were in tier 1 (Table 4-11). For example, 45 percent of 51 asthma medications were in tier 1. In contrast, 85 percent of the 34 cardiovascular disease medications were in tier 1.
| TABLE 4-11. Distribution of Medical/Surgical Medications across Formulary Tiers, 2013 and 2014 | |||||
|---|---|---|---|---|---|
| Behavioral Health Medication Category | Number of Drugs in Category |
Year | Tier 1 (%) | Tier 2 (%) | Tier 3 (%) |
| Diabetes | 60 | 2013 | 34% | 48% | 19% |
| 2014 | 36% | 44% | 20% | ||
| Asthma | 51 | 2013 | 44% | 36% | 21% |
| 2014 | 45% | 33% | 22% | ||
| HIV/AIDS | 25 | 2013 | 13% | 69% | 19% |
| 2014 | 11% | 70% | 20% | ||
| Cardiovascular | 34 | 2013 | 85% | 8% | 7% |
| 2014 | 85% | 9% | 6% | ||
Importantly, data limitations prevented us from conclusively assessing the degree to which differences in tiers across medication categories reflected which medications were available in generic form. Typically, generic medications are in tier 1, so if all medications in a particular category are generic, then all those medications will be in tier 1.
Turning to differences across time, there were few differences in the distribution of medications for 2013 and 2014. Perhaps the only sizeable change was for substance use disorder medications, where the proportion of medications in tier 1 increased from 2013 to 2014 by 7 percentage points (with the reduction coming from tier 2). None of the distributions for the comparison condition medications changed over time.
The proportion of medications for which there were quantity limits varied significantly by type of behavioral health medication (Table 4-12). Only 3 percent of mood stabilizing and anticonvulsant medications had quantity limits, for example, whereas 80 percent of ADHD medications had such limits. Few formulary documents mentioned step therapy, prior authorization, or designated pharmacies. The exception to this was ADHD. For that class, 38 percent of 14 medications had prior authorization requirements in 2013. Moreover, the proportion increased to 62 percent in 2014.
| TABLE 4-12. Percentage of Behavioral Health Medications with Selected Types of Limitations, 2013 and 2014 | ||||||
|---|---|---|---|---|---|---|
| Behavioral Health Medication Category | Number of Drugs in Category |
Year | Quantity | Step Therapy | Prior Authorization | Select Designated Pharmacy |
| Combination antipsychotic and antidepressant medications | 3 | 2013 | 60% | 0% | 0% | 0% |
| 2014 | 60% | 7% | 0% | 0% | ||
| Antipsychotic medications | 18 | 2013 | 53% | 4% | 0% | 0% |
| 2014 | 53% | 2% | 0% | 0% | ||
| Antidepressant medications | 28 | 2013 | 29% | 5% | 0% | 3% |
| 2014 | 29% | 5% | 4% | 3% | ||
| Mood stabilizing and anticonvulsant | 8 | 2013 | 3% | 0% | 0% | 0% |
| 2014 | 3% | 0% | 0% | 0% | ||
| Anti-anxiety medications | 8 | 2013 | 0% | 0% | 0% | 0% |
| 2014 | 0% | 0% | 0% | 0% | ||
| ADHD medications | 14 | 2013 | 78% | 3% | 38% | 0% |
| 2014 | 80% | 8% | 62% | 0% | ||
| Substance use medications | 7 | 2013 | 25% | 0% | 3% | 0% |
| 2014 | 25% | 0% | 6% | 0% | ||
| Tobacco cessation medications | 11 | 2013 | 12% | 0% | 5% | 0% |
| 2014 | 12% | 0% | 5% | 0% | ||
When sub-setting the seven substance use medications to the four MAT medications, we found that, in both years, 42 percent of the MAT medications had quantity limits. Few MAT medications had prior authorization requirements: in 2013 and 2014, 5 percent and 10 percent of MAT medications had this type of restriction, respectively. The relatively high proportion of ADHD and MAT medications with quantity limits likely reflects the fact that these types of medications are controlled. ADHD medications includes stimulants, for example, which have been subject to diversion for illicit use.
The four comparison chronic conditions also varied considerably in terms of formulary exceptions (Table 4-13). The proportion of medications with quantity limits varied from 21 percent for cardiovascular conditions to 64 percent (2013) and 66 percent (2014) for asthma. Fewer than 10 percent of medications for the comparison conditions used any one of four other types of restriction: step therapy, prior authorization, designated pharmacy, and specialty drug program. The proportion of medications for diabetes with step therapy requirements was slightly higher (12 percent and 13 percent of medications in 2013 and 2014, respectively).
| TABLE 4-13. Percentage of Medical/Surgical Medications with Selected Types of Limitations, 2013 and 2014 | |||||||
|---|---|---|---|---|---|---|---|
| Health Condition | Number of Drugs in Category |
Year | Quantity | Step Therapy | Prior Authorization | Select Designated Pharmacy |
Specialty Drug Program |
| Diabetes | 60 | 2013 | 36% | 12% | 4% | 0% | 0% |
| 2014 | 37% | 13% | 7% | 0% | 0% | ||
| Asthma | 51 | 2013 | 64% | 0% | 5% | 4% | 0% |
| 2014 | 66% | 1% | 6% | 4% | 0% | ||
| HIV/AIDS | 25 | 2013 | 36% | 1% | 1% | 0% | 2% |
| 2014 | 36% | 1% | 2% | 0% | 2% | ||
| Cardiovascular | 34 | 2013 | 21% | 2% | 3% | 0% | 0% |
| 2014 | 21% | 2% | 3% | 0% | 0% | ||
4.3.2. Analysis of Separate Deductibles and NQTLs: Plan Data
Using the plan documents, we assessed whether plans had a separate deductible for medications. A separate deductible may differentially affect conditions that rely on pharmaceutical therapy, which will include most chronic health conditions, including mental health conditions. We found that this component of consumer burden fell over time. In 2013, one-third of plans had a separate medication deductible, which fell in 2014 to 10 percent. Moreover, among those plans with a separate deductible, the amount of the average deductible fell from $1,270 in 2013 to $706 in 2014.
Table 4-14 shows the proportion of plans by year for each of seven specific types of NQTLs for prescription medication. Results indicated differences between the two health condition categories and between the 2 years; however, very few of the differences were statistically significant.
| TABLE 4-14. Percentage of Plans with Select NQTLs for Prescription Medication, by Health Condition, 2013 and 2014 | ||||
|---|---|---|---|---|
| Type of NQTL and Health Condition | 2013 | 2014 | ||
| N | Percent of Plans | N | Percent of Plans | |
| Prior authorization | ||||
| Behavioral health | 60 | 50% | 78 | 49% |
| Medical/surgical | 60 | 57% | 78 | 49% |
| Utilization management | ||||
| Behavioral health | 60 | 18% | 78 | 29% |
| Medical/surgical | 60 | 18% | 78 | 29% |
| Step therapy | ||||
| Behavioral health | 60 | 15% | 78 | 46% |
| Medical/surgical | 60 | 22% | 78 | 45% |
| Generic substitution | ||||
| Behavioral health | 60 | 12% | 78 | 15% |
| Medical/surgical | 60 | 12% | 78 | 14% |
| Quantity limit | ||||
| Behavioral health | 60 | 7% | 78 | 14% |
| Medical/surgical | 60 | 10% | 78 | 13% |
| Therapeutic substitution | ||||
| Behavioral health | 60 | 7% | 78 | 3% |
| Medical/surgical | 60 | 5% | 78 | 3% |
| Precertification | ||||
| Behavioral health | 60 | 0% | 78 | 5% |
| Medical/surgical | 60 | 0% | 78 | 5% |
| Retrospective review | ||||
| Behavioral health | 60 | 0% | 78 | 0% |
| Medical/surgical | 60 | 0% | 78 | 0% |
| NOTE: See Appendix D for descriptions of NQTL terms. | ||||
In both years, the proportion of plans with NQTLs for behavioral health was lower than or approximately the same as the proportion for medical/surgical. In 2013, for example, 15 percent of plans required step therapy for behavioral health treatment and 22 percent for medical/surgical. However, this finding was not statistically significant, and, in general, differences by health condition were not statistically significant. Additionally, for certain NQTLs, the proportion increased from 2013 to 2014. The proportion of plans with quantity limits for behavioral health doubled from 7 percent in 2013 to 14 percent in 2014, and the proportion with utilization management for behavioral health in network increased from 18 percent to 29 percent, for example. Despite these changes over time, the proportion with NQTLs in 2014 for behavioral health was lower than or equal to the proportion for medical/surgical. None of the changes over time were statistically significant.
4.4. Sub-Analyses
In the two main sub-analyses, we stratified the plan data to compare in-network and out-of-network coverage, and states according to their marketplace type in 2014 (state facilitated or federally facilitated). Rather than report all of the multiple comparisons, this report includes select findings for brevity. For example, because relatively few plans used co-payments in outpatient settings, we do not describe the results of sub-analyses for co-payments.
4.4.1. Sub-Analysis Comparing In-Network and Out-of-Network
Table 4-15 presents estimates for eight combinations of settings of care and network status for scope of coverage. The estimates reveal that plan coverage moved to incentivizing in-network usage. In the above analyses, we found increases over time in the proportion of plans covering behavioral health. The table shows that, for three settings, these increases were limited to in-network rather than out-of-network care: inpatient, outpatient, and office visits. Out-of-network behavioral health coverage for inpatient, outpatient, and office visits decreased over time, but to a level that is no worse than medical/surgical coverage. For example, the proportion covering mental health care delivered in outpatient, out-of-network facilities fell over the 2 years from 65 percent to 53 percent. (This decrease was not statistically significant, however; p = 0.16). In 2013, the proportion covered was less than the proportion for medical surgical (78 percent; for the comparison, p = 0.05), whereas in 2014, the proportions for mental health care and medical/surgical care were the same (53 percent for medical/surgical; for the comparison, p = 1.00).
| TABLE 4-15. Percentage of Plans with Explicitly Stated Coverage and Exclusions, by Setting/Network Status and Health Condition, 2013 and 2014 | ||||||||
|---|---|---|---|---|---|---|---|---|
| Setting/Network Status | 2013 (N=60) | 2014 (N = 78) | ||||||
| Covered | Excluded | Uncleara | Missingb | Covered | Excluded | Uncleara | Missingb | |
| Inpatient in-network | ||||||||
| Mental health | 72% | 17% | 0% | 12% | 86% | 0% | 0% | 14% |
| Substance abuse | 68% | 20% | 0% | 12% | 86% | 0% | 0% | 14% |
| Medical/surgical | 88% | 0% | 0% | 12% | 86% | 0% | 0% | 14% |
| Inpatient out-of-network | ||||||||
| Mental health | 67% | 22% | 0% | 12% | 53% | 33% | 0% | 14% |
| Substance abuse | 60% | 28% | 0% | 12% | 51% | 35% | 0% | 14% |
| Medical/surgical | 78% | 10% | 0% | 12% | 53% | 33% | 0% | 14% |
| Outpatient in-network (including urgent care) | ||||||||
| Mental health | 65% | 23% | 0% | 12% | 86% | 0% | 0% | 14% |
| Substance abuse | 68% | 20% | 0% | 12% | 86% | 0% | 0% | 14% |
| Medical/surgical | 88% | 0% | 0% | 12% | 86% | 0% | 0% | 14% |
| Outpatient out-of-network | ||||||||
| Mental health | 65% | 23% | 0% | 12% | 53% | 33% | 0% | 14% |
| Substance abuse | 60% | 28% | 0% | 12% | 53% | 33% | 0% | 14% |
| Medical/surgical | 78% | 10% | 0% | 12% | 53% | 33% | 0% | 14% |
| Office visits in-network | ||||||||
| Mental health | 68% | 20% | 0% | 12% | 86% | 0% | 0% | 14% |
| Substance abuse | 68% | 20% | 0% | 12% | 86% | 0% | 0% | 14% |
| Medical/surgical | 88% | 0% | 0% | 12% | 86% | 0% | 0% | 14% |
| Office visits out-of-network | ||||||||
| Mental health | 62% | 27% | 0% | 12% | 50% | 36% | 0% | 14% |
| Substance abuse | 60% | 28% | 0% | 12% | 50% | 36% | 0% | 14% |
| Medical/surgical | 73% | 15% | 0% | 12% | 50% | 36% | 0% | 14% |
|
||||||||
We tested the statistical significance of differences in the proportions between in-network and out-of-network for each combination of the three sets of conditions (mental health, substance use disorder, and medical/surgical) and the three settings to which network status applies (inpatient, outpatient, and office visit). These comparisons confirmed both the trend incentivizing consumers toward in-network coverage and that behavioral health coverage converged with medical/surgical coverage. In 2013, the in-network to out-of-network comparison was not significantly different from zero for either mental health or substance use conditions, but it was statistically significant for medical/surgical conditions. In 2014, every in-network to out-of-network comparison was statistically significant for all three medical condition categories: mental health, substance use, and medical/surgical.
In other analyses of the plan documents, we also assessed differences in network status for NQTLs (estimates not shown). We found that prior authorization was not common in-network but more common out-of-network for both outpatient and office visits. Thirty-three percent of plans used prior authorization for the outpatient setting out-of-network in 2014. In 2013, the use of prior authorization for office visits was low and restricted to out-of-network (15 percent of plans). In 2014, the proportion was also low but was similar across network status (8 percent and 9 percent for in-network and out-of-network).
| TABLE 4-16. Percentage of Plans with Select NQTLs for Behavioral Health Care in the Inpatient Setting, by Network Status, 2013 and 2014 | ||||
|---|---|---|---|---|
| NQTL Type/Network Status | 2013 | 2014 | ||
| N | Percent of Plans | N | Percent of Plans | |
| Concurrent review | ||||
| In-network | 60 | 15% | 78 | 4% |
| Out-of-network | 60 | 8% | 78 | 4% |
| Preadmission notification | ||||
| In-network | 60 | 17% | 78 | 8% |
| Out-of-network | 60 | 17% | 78 | 8% |
| Precertification | ||||
| In-network | 60 | 12% | 78 | 26% |
| Out-of-network | 60 | 18% | 78 | 10% |
| Prior authorization | ||||
| In-network | 60 | 45% | 78 | 49% |
| Out-of-network | 60 | 35% | 78 | 32% |
| Retrospective review | ||||
| In-network | 60 | 0% | 78 | 9% |
| Out-of-network | 60 | 0% | 78 | 9% |
We also assessed in-network versus out-of-network differences with regard to the NQTL aspect of scope (Table 4-16 and Table 4-17). Although there were some differences by network status in 2013, these differences were generally not apparent by 2014. One exception for 2014 was in the outpatient setting (Table 4-17), where prior authorization was more common in-network than out-of-network (33 percent versus 23 percent of plans). This pattern in the data meant that trends over time depended on network status. For example, the proportion using precertification in-network more than doubled (from 12 percent to 26 percent), whereas this proportion decreased out-of-network. In 2014, there was one exception.
| TABLE 4-17. Percentage of Plans with Select NQTLs for Behavioral Health Care in Ambulatory Settings, by Network Status, 2013 and 2014 | ||||
|---|---|---|---|---|
| NQTL/Setting/Network | 2013 | 2014 | ||
| N | Percent of Plans | N | Percent of Plans | |
| Precertification | ||||
| Outpatient in-network | 60 | 7% | 78 | 13% |
| Outpatient out-of-network | 60 | 7% | 78 | 10% |
| Prior authorization | ||||
| Outpatient in-network | 60 | 25% | 78 | 33% |
| Outpatient out-of-network | 60 | 25% | 78 | 23% |
| Retrospective review | ||||
| Outpatient in-network | 60 | 0% | 78 | 9% |
| Outpatient out-of-network | 60 | 0% | 78 | 9% |
| Prior authorization | ||||
| Office visit in-network | 60 | 2% | 78 | 8% |
| Office visit out-of-network | 60 | 15% | 78 | 9% |
| Retrospective review | ||||
| Office visit in-network | 60 | 0% | 78 | 4% |
| Office visit out-of-network | 60 | 0% | 78 | 5% |
| Admission notification | ||||
| Emergency department | 60 | 23% | 78 | 29% |
| Retrospective review | ||||
| Emergency department | 60 | 5% | 78 | 3% |
Turning to level of coverage, Table 4-18 shows that plans use co-insurance as a mechanism to incentivize consumers to seek care in-network rather than out-of-network. In every setting, the majority of plans apply a co-insurance rate rather than a co-payment.
| TABLE 4-18. Percentage of Plans with Co-Insurance for the Initial Visit, by Setting/Network Status, Health Condition, 2013 and 2014 | ||||
|---|---|---|---|---|
| Setting/Network Status and Health Condition | 2013 | 2014 | ||
| N | % | N | % | |
| Inpatient in-network | ||||
| Behavioral health | 36 | 89% | 64 | 69% |
| Medical/surgical | 47 | 77% | 64 | 72% |
| Inpatient out-of-network | ||||
| Behavioral health | 38 | 100% | 38 | 100% |
| Medical/surgical | 45 | 96% | 38 | 100% |
| Outpatient in-network | ||||
| Behavioral health | 36 | 83% | 63 | 56% |
| Medical/surgical | 47 | 77% | 64 | 70% |
| Outpatient out-of-network | ||||
| Behavioral health | 37 | 100% | 38 | 97% |
| Medical/surgical | 45 | 96% | 38 | 97% |
| Office visit in-network | ||||
| Behavioral health | 34 | 38% | 59 | 34% |
| Medical/surgical | 47 | 34% | 59 | 25% |
| Office visit out-of-network | ||||
| Behavioral health | 31 | 100% | 32 | 100% |
| Medical/surgical | 41 | 100% | 34 | 100% |
| Emergency department | ||||
| Behavioral health | 38 | 74% | 53 | 47% |
| Medical/surgical | 48 | 65% | 57 | 53% |
| Prescription drug in-network | ||||
| Behavioral health | 35 | 31% | 62 | 37% |
| Medical/surgical | 43 | 28% | 62 | 35% |
| Prescription drug out-of-network | ||||
| Behavioral health | 26 | 73% | 19 | 79% |
| Medical/surgical | 27 | 74% | 19 | 79% |
Having established that co-insurance was commonly used in plans (with three exceptions of setting/network status combinations, noted above), we then assessed the proportion of the initial visit paid for by the consumer, or the co-insurance rate for the first visit (Table 4-19). There are two main findings. First, co-insurance rates for behavioral health and medical/surgical care were similar to one another, regardless of setting, network status, or year. Typically, the difference in the average co-insurance rates between behavioral health and medical/surgical care was no more than two percentage points.
| TABLE 4-19. Consumer Co-Insurance Payment for Initial Visit, by Setting/Network Status and Health Condition, 2013 and 2014 | ||||
|---|---|---|---|---|
| Setting/Network Status and Health Condition | 2013 | 2014 | ||
| N | Consumer Co-Insurance Payment for Initial Visit (%) |
N | Consumer Co-Insurance Payment for Initial Visit (%) |
|
| Inpatient in-network | ||||
| Behavioral health | 32 | 25% | 44 | 26% |
| Medical/surgical | 36 | 25% | 46 | 27% |
| Inpatient out-of-network | ||||
| Behavioral health | 38 | 48% | 38 | 50% |
| Medical/surgical | 43 | 46% | 38 | 50% |
| Outpatient in-network | ||||
| Behavioral health | 30 | 26% | 35 | 25% |
| Medical/surgical | 36 | 25% | 45 | 26% |
| Outpatient out-of-network | ||||
| Behavioral health | 37 | 45% | 37 | 50% |
| Medical/surgical | 43 | 45% | 37 | 50% |
| Office visit in-network | ||||
| Behavioral health | 13 | 29% | 20 | 27% |
| Medical/surgical | 16 | 24% | 15 | 29% |
| Office visit out-of-network | ||||
| Behavioral health | 31 | 49% | 32 | 50% |
| Medical/surgical | 41 | 46% | 34 | 49% |
| Emergency department | ||||
| Behavioral health | 28 | 26% | 25 | 29% |
| Medical/surgical | 31 | 26% | 30 | 30% |
| Prescription drug in-network | ||||
| Behavioral health | 11 | 41% | 23 | 33% |
| Medical/surgical | 12 | 39% | 22 | 33% |
| Prescription drug out-of-network | ||||
| Behavioral health | 19 | 47% | 15 | 45% |
| Medical/surgical | 20 | 47% | 15 | 45% |
The second finding was that the co-insurance rate for out-of-network was higher than in-network. This was true across all settings and was almost always highly statistically significant. The only exception was for prescription drugs, which on average had higher co-insurance out-of-network but was not statistically significant (p= 0.109).
The focus of the analyses comparing network status for prescription medication was on NQTLs (Table 4-20). Because we found no differences between behavioral health and medical/surgical coverage, we report only the results for behavioral health coverage here. Moreover, the results are limited to the four NQTLs for which plan documents distinguished by network status.
| TABLE 4-20. Percentage of Plans with Select NQTLs for Prescription Medication for Behavioral Health Conditions, by Network Status, 2013 and 2014 | ||||
|---|---|---|---|---|
| Type of NQTL and Network Status | 2013 | 2014 | ||
| N | Percent of Plans | N | Percent of Plans | |
| Precertification | ||||
| In-network | 60 | 0% | 78 | 5% |
| Out-of-network | 60 | 13% | 78 | 3% |
| Prior authorization | ||||
| In-network | 60 | 50% | 78 | 49% |
| Out-of-network | 60 | 15% | 78 | 22% |
| Retrospective review | ||||
| In-network | 60 | 0% | 78 | 0% |
| Out-of-network | 60 | 0% | 78 | 9% |
| Utilization management | ||||
| In-network | 60 | 18% | 78 | 29% |
| Out-of-network | 60 | 2% | 78 | 4% |
The results indicated that prior authorization and utilization management were relatively common and that the proportion of plans using these NQTLs depended on network status. Prior authorization in 2013 plans, for example, was more common in-network (50 percent and 57 percent of plans for behavioral health and medical/surgical treatments respectively) than out-of-network (15 percent and 23 percent for behavioral health and medical/surgical).
4.4.2. Sub-Analysis for States with State Facilitated Marketplaces Compared to Those with Federally Facilitated Marketplaces
In 2013, states that later facilitated their own health insurance marketplaces generally had plans with more generous behavioral health coverage than states that later had federally facilitated marketplaces. Figure 4-2 and Figure 4-3 compare these two groups of states. In 2013, more than 70 percent of plans in state facilitated states explicitly described mental health coverage across settings, whereas in federally facilitated states the proportion of plans exceeded the 70 percent mark for only one setting: prescription medication (see Figure 4-2). These differences were largely statistically significant (p < 0.05).
| FIGURE 4-2. Percentage of Plans in 2013 Explicitly Stating In-Network Coverage for Behavioral Health, by Setting, Behavioral Health Condition, and Type of Marketplace |
|---|
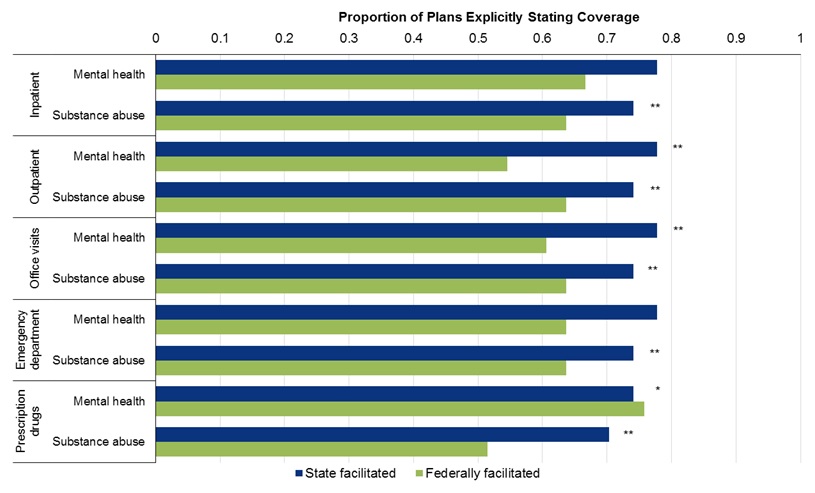 |
| * Statistically significant difference between exchange types at 10% level. ** Statistically significant difference between exchange types at 5% level. |
In 2014, the differential was reversed: compared with federally facilitated states, states in the state facilitated group had a lower proportion explicitly describing coverage for mental health or for substance abuse treatment (see Figure 4-3). However, none of the differences were statistically significant.
| FIGURE 4-3. Percentage of Plans in 2014 Explicitly Stating In-Network Coverage for Behavioral Health, by Setting/Network Status, Behavioral Health Condition, and Type of Marketplace |
|---|
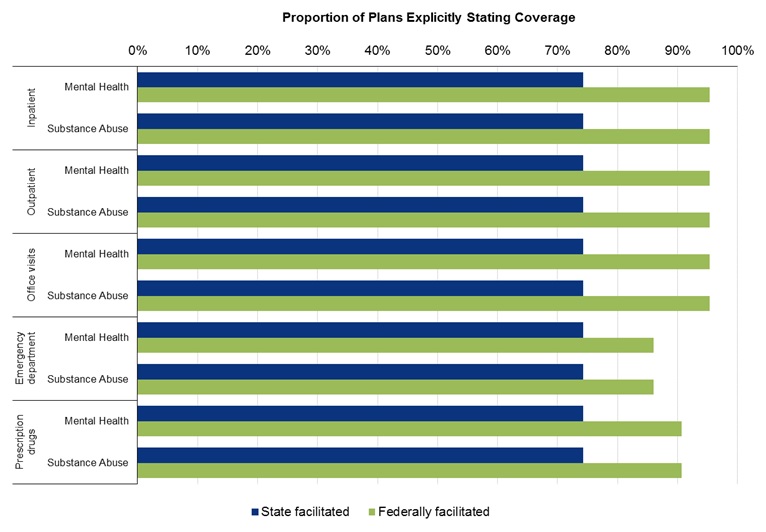 |
We also assessed by exchange type the proportion of plans with any behavioral health exclusions. In both years, states in the state facilitated group had a lower proportion of plans with exclusions than states in the federally facilitated group (Figure 4-4).
| FIGURE 4-4. Percentage of Plans Explicitly Stating Exclusions for Health Conditions, by Year, Health Condition, and Type of Exchange |
|---|
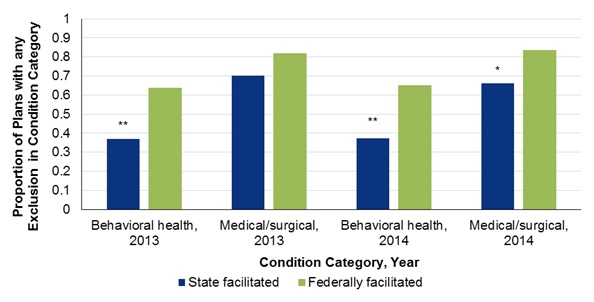 |
| * Statistically significant difference between exchange types at 10% level. ** Statistically significant difference between exchange types at 5% level. |
As described above for the comparison of states by Medicaid expansion status, there was little difference between groups of states in average co-insurance rates. Groups of states did not differ with regard to the proportion of plans for which co-insurance for behavioral health was higher than for medical/surgical care.
4.4.3. Other Sub-Analyses
As a third sub-analysis, we compared individual market plans and small group market plans. The results from this sub-analysis should be interpreted with caution because the number of small group plans with usable data was limited and typically was between 12 and 17. Taken as a whole, the results comparing the type of market could be interpreted as being contradictory or an artefact of individual market plan documents being more explicit than small group in terms of what is covered and what is not covered. We found when disaggregating by setting that individual market plans were more likely to provide explicit coverage for behavioral health care and for medical/surgical care than small group plans. This held for all nine combinations of setting and network status; for all three medical condition categories of mental health, substance abuse, and medical/surgical; and for both years. However, we also found plans with any exclusions were more common in the individual market than small group market (Figure 4-5). We did not find strong patterns of differences by market for scope of service and there were insufficient observations to compare co-insurance rates by market.
| FIGURE 4-5. Percentage of Plans Explicitly Stating Exclusions for Health Conditions, by Year, Health Condition, and Insurance Market |
|---|
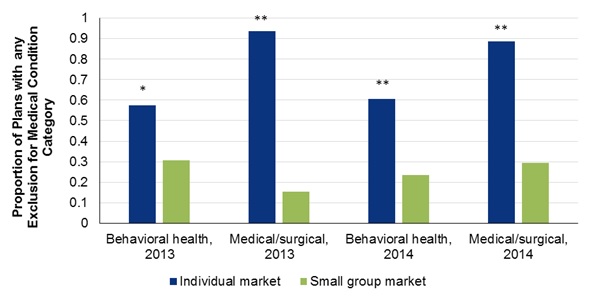 |
| * Statistically significant difference between exchange types at 10% level. ** Statistically significant difference between exchange types at 5% level. |
As a fourth sub-analysis, we also assessed differences between on-exchange and off-exchange plans (for 2014 only). Because parity requirements applied both to on-exchange and off-exchange plans, there should be no difference between these two groups of plans. The results indeed indicated no large or systematic differences in coverage, and none of the differences were statistically significant at conventional levels (p < 0.05).
4.5. Results from Stakeholder Discussions on Network Adequacy
For this research question, we combined stakeholder discussions with a literature review to understand the degree to which access to networks of behavioral health treatment and services changed when comparing 2013 and 2014 and when comparing medical/surgical care. Key informant discussions on network adequacy raised a number of considerations for accessing behavioral health services. In general, informants noted some changes over time, some of which peaked in 2014. Although discussants noted some differences in access between behavioral health and medical/surgical network access, concerns about differences by type of service were largely rooted in ongoing shortages in specialty providers that are neither directly a network adequacy issue nor a consequence of recent legislation.
4.5.1. Background on Defining and Regulating Network Adequacy
Some background on the regulation of network adequacy is important to understanding stakeholder comments. The background comes from discussion points supplemented by the results of a brief environmental scan and literature review on the topic of network adequacy. Although there is literature before (Corlette et al., 2014; Miller et al., 2014) and after (Haeder et al., 2015, 2016; Polsky & Weiner, 2015) the 2014 milestone, gaps remain regarding considerations for behavioral health care.
Network adequacy guidance for QHPs has been established and then further refined by HHS (45 CFR §156.230). A QHP is a health plan that has been certified by the health exchange that it is offered on and confirmed to include EHBs. Two major criteria for example are including sufficient choice of providers (where terms like choice are defined in the Public Health Service Act) and providing information to enrollees and prospective enrollees on the availability of in-network and out-of-network providers. CCIIO certifies QHPs on federally facilitated marketplaces, and its application for certification requires issuers to "maintain a network that is sufficient in number and types of providers, including providers that specialize in mental health and substance use disorder services, to assure that all services will be accessible to enrollees without unreasonable delay" (CCIIO, 2016c, p. 6-1).
In addition, since guidance issued in 2013 (CCIIO, 2013), HHS Centers for Medicare & Medicaid Services (CMS)/CCIIO has proposed broadening the assessment of provider networks of QHPs by using a standard of reasonable access (CCIIO, 2016d). The standard would be based on input from hospital systems, mental health providers, and primary care providers. The criteria CCIIO have been using for network adequacy were created after comment and input from states and allow state considerable flexibility to interpret and apply standards.
NAIC plays an important role in guiding states on network adequacy and has updated guidance in its Health Benefit Plan Network Access and Adequacy Model Act. This model law was finalized in November 2015 and is intended to serve as a standard for state regulations (NAIC, 2016). Most states use NAIC's model regulations in some capacity. Changes to network adequacy from the new model law may not be evident until early 2017 because the finalized model was not available until after open enrollment had begun for 2015 exchange plans.
Stakeholders in the discussions reported that there did not seem to be consensus on a working definition of network adequacy. CMS and CCIIO have a lead role as federal regulators, and the NAIC has a role from the state perspective. Other entities noted that are involved with developing guidelines are the National Committee for Quality Assurance, URAC (known by its acronym and formerly called the Utilization Review Accreditation Commission), and individual state health insurance offices. Standards for adequate networks cover a number of dimensions, including network management practices, geographic dispersion of providers, provider-to-enrollee ratios, and availability of behavioral health providers (McCarty & Ferris, 2013).
4.5.2. Challenges in Regulating Network Adequacy
Key informants pointed to the fact that in 2014 the role that states and the Federal Government had in determining network adequacy greatly changed. Beginning in 2014, networks offered by exchange plans are required to contract with a certain percentage of essential community providers, some of which may provide behavioral health, mental health, and substance abuse coverage.
There was general agreement that contracts with essential community providers will help ensure a sufficient offering of behavioral health and mental health services in network. However, stakeholders noted that contracts with these providers can be difficult to construct and negotiate.
Some states have prescriptive adequacy requirements. Vermont, for example, specifies that travel time for beneficiaries of Managed Care Organizations and QHPs, must be 30 minutes for primary care and mental health/substance abuse services and 60 minutes maximum travel times for outpatient services.[4] Other states only require the carrier plans to have adequate network access.
More than one key informant said that state Departments of Insurance do little to help negotiate contracts between issuers and providers. Although some state Departments of Insurance do get involved in negotiations sometimes, most tend not to directly assist with creating adequate networks. Nevertheless, informants felt that after contracts are established, states monitor network adequacy as closely as state law allows and the data permit.
4.5.3. Network Adequacy Measures
Typical network adequacy measures that states use include calculations of providers per county, ratio of population to providers, distance parameters, and travel times. Some key informants expressed concern that these metrics may not meet the population needs overall because of geographic differences. For example, a requirement of two providers per county may not be sufficient for an urban county but may be sufficient for a rural county. The challenge with these measures is that, although regulators may assess the number of enrollees covered in a market, they may not necessarily know how many providers are participating in another plan or with other networks. It is also not clear how many consumers are accessing care outside of their health plan's network, making measurement of access difficult.
4.5.4. Narrow Networks
Several informants offered that networks of providers have narrowed both for behavioral health and general medical care, with carriers moving to lower cost networks, fewer networks, and fewer providers. These changes were justified as being more efficient, cost-effective, or lower cost. One consequence of this narrowing is that specialty hospitals -- such as children's hospitals, university hospitals, and research hospitals -- may be omitted from networks in many areas. One important point informants made was that networks became narrower in 2013 and 2014, but they were expanding at the time of the discussions in early 2015. This expansion of networks in 2015 was attributed largely to pressure from consumers. For example, Blue Cross and Blue Shield (BCBS) plans in California had very narrow networks in 2013. These plans began expanding their networks again during the year following media attention on the plans having few doctors and hospitals in network. The expansion meant the plans had sufficiently broad networks for offering on the state exchange in 2014.
4.5.5. Provider Shortage
Many of the concerns raised by key informants in the discussions referenced ongoing behavioral health provider shortages. For many years, pre-dating recent health care reform, the literature has documented shortages in behavioral health providers, such as adult and child psychiatrists. The parity requirements in recent health care reforms likely increased the quantity demanded of behavioral health services without a concomitant increase in the number of available providers. The increase in the quantity demanded of services would be both because more people gained insurance where they previously were uninsured and because those who already had insurance may have had improved coverage for some services that were required to meet certain standards. For example, coverage for autism spectrum disorder may have improved since 2014 because mental health services are considered an EHB and should be covered by plans.
The number of providers is insufficient in rural areas and for patients requiring services for autism and child psychiatric conditions. The recent innovation of telehealth services, where a provider delivers a service remotely -- often by telephone or video streaming -- is being used increasingly to address this concern. However, it is not clear how many plans reimburse for behavioral health and counseling services that are not provided face to face. Other solutions in some states include modifying credentialing requirements. For example, New Mexico allows psychologists to prescribe medications because otherwise there are too few providers with prescribing privileges.
Additionally, it was noted that there was limited availability of inpatient care in state psychiatric hospitals. One key informant noted that in one state it takes about 3,000 hours of supervised training for someone to be certified as a substance abuse counselor, which was considered by the informant as being unnecessarily high. Because of the amount of training required and low pay, few providers are certified, which reduces patient access.
4.5.6. Use of Waivers
In most states, regulators balance ensuring networks are adequate with the practical considerations of the available supply of providers. Before a state regulator approves a plan, it reviews the plan's network. If a plan says it is covering a certain condition (such as a behavioral health or mental health condition), states will generally require that there is a provider for a specific condition in a given proximity within that plan's network. If no one is specifically available within the network, then states usually require the plan to cover an out-of-network provider. Such rules exist to ensure that, if a plan covers a given service, there is a provider within a reasonable distance.
To account for the limited supply of providers in some areas, state Departments of Insurance have network adequacy waiver mechanisms in place. A plan may obtain a waiver if it demonstrates that the adequacy standards cannot be achieved or maintained. Insurance companies are typically not expected to hire specialists in a rural area to meet a requirement by the state. One informant mentioned the case of New Hampshire, where it has been difficult to enforce network adequacy requirements on particular specialties, including behavioral health, when no specialists practice in the relevant counties.
4.5.7. Reimbursement for Behavioral Health
One key informant noted that low reimbursement rates for mental health services are causing behavioral health providers to stop practicing or leave the field. This in turn exacerbates provider shortage and makes it more difficult to comply with, enforce, and regulate network adequacy standards. Another informant suggested behavioral health private practices refuse to take new patients because of the reimbursement structure of insurance.
It is challenging to incorporate considerations on acceptable reimbursement rates into network adequacy requirements. One challenge is setting a reasonable benchmark rate, because negotiated and established rates depend in part on relative provider and issuer bargaining power. That bargaining power will vary across provider types depending on the relative scarcity of the type of provider. For example, an issuer may have little negotiating power in setting the reimbursement rate for child psychiatrists because there are relatively few child psychiatrists in the market area, whereas the issuer may have negotiating power with other provider types that are in greater supply, such as social workers.
4.5.8. Differences in Infrastructure between Mental Health Treatment Services and Substance Use Treatment Services
Informants noted differences between the infrastructure for mental health and for substance use that should be accounted for when creating network adequacy standards. The difference comes in part from a legacy of differences in credentialing and reimbursement between mental health and substance use.
Several informants emphasized that a shortage of substance use service providers made it difficult for plans to meet network adequacy requirements. Because mental health care provision has long been part of the health care landscape, relative to substance use care it has a well-developed structure for licensure and certification and a higher level of education requirements. One informant had the opinion that private plans often apply certification standards for mental health providers to substance abuse treatment providers. Anecdotal evidence indicated that staff providing substance use services may not meet the licensing requirements put in place for mental health care provision, and so relatively few substance use care providers would be included in the networks of commercial Managed Care Organizations.
5. DISCUSSION
Starting in 2014, individual and small group plans were required to offer mental health and substance use benefits and to provide behavioral health coverage that is no more restrictive than medical/surgical coverage if they chose to offer behavioral health benefits. For the current study, we collected primary data from individual and small group plan documents to determine the degree to which behavioral health coverage in 2014 differed from coverage in 2013 and then to compare the change over time in behavioral health coverage to the corresponding change over time in medical/surgical coverage. We supplemented the data analyses with discussions with key stakeholders on their perception of the impact that parity and network adequacy requirements have had on behavioral health coverage. We used these data to address research questions on the degree to which changes occurred in terms of scope (what is covered), level (quantitative restrictions, such as the co-payment), and network adequacy.
The current study suggests that, on the whole, there was little evidence of differential quantitative restrictions in the 2014 plans. This finding agrees with the one study to our knowledge that also uses plan documents to assess the impact of parity requirements (Horvath, 2014).
We assessed, for example, quantitative aspects of coverage by setting (meaning inpatient, outpatient, office visits, emergency department, and prescription medication). In 2013 and in some settings, a lower proportion of plans covered behavioral health services than medical/surgical services. However, in 2014, the proportions covering behavioral health and medical/surgical care were approximately the same in every setting. We also found that differences in co-insurance rates over time did not depend on whether the care was for behavioral health or medical/surgical conditions.
These findings on quantitative restrictions suggest that, relative to 2013 and in these insurance markets, coverage of behavioral health services in 2014 may have improved and the consumer cost-share may have fallen. Because the data do not contain information on health care use, however, the impact on access is only speculative. Indeed, evidence from other studies is mixed regarding the impact of parity legislation on use of services. Two studies examining different legislative efforts suggest use of specialty care may increase (McGinty et al., 2015) or not affected (Ettner et al., 2016). But even if specialty care remains unaffected, there is evidence that the consumer cost of care is reduced (Ettner et al., 2016).
Findings from analyses of formularies regarding quantitative restrictions were nuanced. It is particularly important to assess formulary coverage because prescription medication is a standard component of mental health treatment and becoming more common in substance use disorder treatment (e.g., Insel, 2011; SAMHSA, 2016). We used a subsample of plan formularies to assess behavioral health medication coverage in eight categories of medication (e.g., antidepressant medications) relative to four comparison chronic medical condition medication categories -- asthma, cardiovascular, diabetes, and HIV/AIDS. We assessed the differences in the proportion of medication types placed in tiers (determining how much the consumer pays) and limitations on coverage. The results suggest that future efforts to ensure parity laws are enforced could focus on coverage limitations -- particularly quantity limits -- rather than the use of tiers. Typically, there are three tiers, and the higher tiers require a larger payment contribution from the consumer. Whereas a relatively large proportion of plans had quantity limits for behavioral health medications, relatively few placed behavioral health medications in higher tiers. We did not assess whether the frequency and type of quantity limits aligned with clinical best practices, and the data did not allow us to control for which medications were available in generic form.
Our findings suggest at least two areas for further research on parity in the individual and small group market. First, the results support focusing on aspects of coverage other than quantitative restrictions (The Mental Health and Substance Use Disorder Parity Task Force, 2016). A recommendation from the current study is that further assessment of NQTLs is merited. NQTLs are a mechanism used by insurers for managing utilization, such as through prior authorization, which typically requires plan administrators or qualified providers to specifically approve reimbursement for a service for a specific patient before it is provided. By their nature, NQTLs are not consistently defined and applied across insurers; their definition and application may also not be transparent to the consumer, since this information is not included in documents describing coverage. Nevertheless, to the extent to which plan documents do reflect NQTLs, we systematically captured data on this important component of coverage restrictions.
Although the estimates did not reveal large differences in the proportion of plans with NQTLs for behavioral health care and the proportion for medical/surgical care, we did find both that NQTLs were commonly used and from 2013 to 2014 there were changes in plans' choice of which types of NQTLs to apply (e.g., prior authorization versus utilization review). Further research would be needed to understand how the specific type of NQTL that is applied then may affect consumer access to care and how much this effect varies for certain types of care, such as behavioral health services. This research would have to carefully account for requirements in parity legislation to ensure the comparability of processes, strategies, evidentiary standards, or other factors used in applying each NQTL. Data on NQTLs may not be readily forthcoming, and identifying data sources will be a critical step in designing a study of NQTLs.
A second area for further understanding is the degree to which plan networks sufficiently ensure consumer access to services. The findings suggest that over the 1 year time period, plan coverage increased the incentive to use in-network rather than out-of-network providers for both behavioral health and medical/surgical care. For example, for out-of-network office visits, in 2013, the proportion of plans with behavioral health coverage was lower than the proportion with medical/surgical coverage. Both proportions were lower in 2014 than in 2013. But the medical/surgical proportion fell by more, so that in 2014 there was an equal proportion of plans with behavioral health and medical/surgical coverage. Trends in co-insurance rates -- the proportion of every dollar paid by the consumer -- also suggested increased incentives toward using in-network rather than out-of-network care. Moreover, the discussions on network adequacy suggested that networks for behavioral health and medical/surgical care both narrowed from 2013 to 2014 and may have increased in size again since 2014. Understanding network adequacy will be particularly important if other data corroborate the finding that plans over time increasingly incentivize the consumer to seek care in-network.
Although stakeholders did not discuss specific differences in network size for behavioral health and medical/surgical coverage, a number of related comments in those discussions and findings from the literature suggest that developing a better understanding of supply-side issues with regard to access to behavioral health care should be considered a priority. The discussions endorsed findings from the literature that there is a provider shortage for specialty behavioral health care, particularly in rural areas, and a narrowing of networks as well as limitations on covering out-of-network care will exacerbate the impact of this shortage. The shortage may be reinforced by relatively lower reimbursement rates for behavioral health services.
We also performed an analysis that split the sample according to the type of exchange the states used in 2014. States that facilitated their own exchange may have been more likely to have had the regulatory infrastructure in place needed to enforce parity requirements and may have had state insurance laws that were relatively consumer friendly. In 2013, a greater proportion of plans in the state facilitated group explicitly covered behavioral health care than the federally facilitated group, and this difference was statistically significant. However, in 2014, the difference in proportions between groups was eliminated or possibly reversed. The federally facilitated group had a higher proportion of plans with behavioral health coverage than the state-based group, although none of the 2014 differences were statistically significant. The findings thus do not indicate that guidance and technical assistance resources should be targeted toward certain states based on the type of exchange. Further understanding is needed to determine whether such resources would benefit other policy-relevant groups of states.
At least five limitations in the current study qualify the findings. First, because the data are from a purposive sample, the findings do not represent the experience of all states, rating areas, issuers, or plans. Moreover, some plan data could not be used -- in particular for small group plans -- which further reduces the representativeness of plans in these analyses. However, the final sample did reflect the most widely available plans in a geographically and demographically diverse selection of states. Second, plan documents are not a comprehensive data source of NQTLs, and thus conclusions may only be suggestive of how NQTLs have changed over time.
Third, small group data were not as widely available as and the data were less specific than the individual plan data. For this reason, comparisons between individual and small group plan data should be not be interpreted as a clear sign of significant differences. Fourth, our approach to sampling limited the sample size of the 2013 plans. We developed the sample by selecting 2013 plans that would best correspond to 2014 plans in a one-to-one match. That is, we first identified 2014 plans and then found the best matching 2013 plan based on premium, after stratifying for other characteristics such as rating area. Because 2013 plans that matched well were limited in availability, we allowed the same 2013 plan to be the best match for multiple 2014 plans. The drawback of this approach was that it reduced the effective sample size in analyses. Fifth, the plans are for single individuals with particular characteristics (e.g., non-smoker), and thus the findings may not extend to family plans or coverage for people with other characteristics.
Before this study, there had been little evidence from a wide selection of plan data to determine how behavioral health coverage may have improved over time and how that improvement compares to changes in coverage for medical/surgical treatment. These findings should contribute to the current policy discussions regarding access to behavioral health care in practice, both in terms of quantitative and non-quantitative limits. The results presented here will inform future directions for improving parity in behavioral health coverage, and provide a foundation for further research on parity implementation.
REFERENCES
Agency for Healthcare Research & Quality (AHRQ). (2008). Medical Expenditure Panel Survey: Household Component Glossary. https://meps.ahrq.gov/survey_comp/hc_ques_glossary.pdf.
Azrin, S.T., Huskamp, H.A., Azzone, V., Goldman, H.H., Frank, R.G., Burnam, M.A., Normand, S.T., Ridgely, M.S., Young, A.S., Barry C.L., Busch, A.B., & Moran, G. (2007). Impact of full mental health and substance abuse parity for children in the Federal Employees Health Benefits Program. Pediatrics, 119(2), e452-e459. dx.doi.org/10.1542/peds.2006-0673.
Barry, C.L., Goldman, H.H., & Huskamp, H.A. (2016). Federal parity in the evolving mental health and addiction care landscape. Health Affairs (Project Hope), 35(6), 1009-1016. dx.doi.org/10.1377/hlthaff.2015.1653.
Beronio, K., Glied, S., & Frank, R. (2014). How the affordable care act and mental health parity and addiction equity act greatly expand coverage of behavioral health care. Journal of Behavioral Health Services & Research, 41(4), 410-428. dx.doi.org/10.1007/s11414-014-9412-0.
Beronio, K., Po, R., Skopec, L., & Glied, S. (2013). Affordable Care Act Expands Mental Health and Substance Use Disorder Benefits and Federal Parity Protections for 62 million Americans. ASPE Issue Brief. Washington, DC: U.S. Department of Health and Human Services. https://aspe.hhs.gov/report/affordable-care-act-expands-mental-health-and-substance-use-disorder-benefits-and-federal-parity-protections-62-million-americans.
Berry, K.N., Huskamp, H.A., Goldman, H.H., & Barry, C.L. (2015). A tale of two states: Do consumers see mental health insurance parity when shopping on state exchanges? Psychiatric Services, 66(6), 565-567. dx.doi.org/10.1176/appi.ps.201400582.
Busch, A.B., Yoon, F., Barry, C.L., Azzone, V., Normand, S.L.T., Goldman, H.H., & Huskamp, H.A. (2013). The effects of parity on mental health and substance use disorder spending and utilization: Does diagnosis matter? American Journal of Psychiatry, 170(2), 180-187. dx.doi.org/10.1176/appi.ajp.2012.12030392
Busch, S.H., Epstein, A.J., Harhay, M.O., Fiellin, D.A., Un, H., Leader, D. Jr., & Barry, C.L. (2014). The effects of federal parity on substance use disorder treatment.American Journal of Managed Care, 20(1), 76-82.
California Hospital Association. (2016). Hospital Topics/Post-Acute Care. http://www.cops.usdoj.gov/pdf/taskforce/TaskForce_FinalReport.pdf.
Center for Consumer Information & Insurance Oversight (CCIIO). (2013). Affordable Exchanges Guidance: Letter to Issuers on Federally-Facilitated and State Partnership Exchanges. https://www.cms.gov/CCIIO/Resources/Regulations-and-Guidance/Downloads/2014_letter_to_issuers_04052013.pdf.
Center for Consumer Information & Insurance Oversight (CCIIO). (2016a). 2014 Marketplace PUF Datasets. https://www.cms.gov/cciio/resources/data-resources/marketplace-puf.html.
Center for Consumer Information & Insurance Oversight (CCIIO). (2016b). 2013 and 2014 Rate and Benefit Information System (RBIS) Data. https://www.cms.gov/cciio/resources/data-resources/marketplace-puf.html.
Center for Consumer Information & Insurance Oversight (CCIIO). (2016c). Instructions for the Network Adequacy Application Section. 2014 QHP Application Instructions. https://www.cms.gov/CCIIO/Programs-and-Initiatives/Health-Insurance-Mar….
Center for Consumer Information & Insurance Oversight (CCIIO). (2016d). 2017 Letter to Issuers in the Federally-Facilitated Marketplaces. https://www.cms.gov/CCIIO/Resources/Regulations-and-Guidance/Downloads/Final-2017-Letter-to-Issuers-2-29-16.pdf.
Center for Consumer Information & Insurance Oversight (CCIIO). (n.d.). Compliance and Enforcement. https://www.cms.gov/cciio/programs-and-initiatives/health-insurance-market-reforms/compliance.html.
Corlette, S., Volk, J., Berenson, R., & Feder, J. (2014). Narrow Provider Networks in New Health Plans: Balancing Affordability with Access to Quality Care. Washington, DC: Center on Health Insurance Reforms, Georgetown University Health Policy Institute.
Cummings, J.R., Wen, H., Ko, M., & Druss, B.G. (2014). Race/ethnicity and geographic access to Medicaid substance use disorder treatment facilities in the United States. JAMA Psychiatry, 71(2), 190-196.
Curran, E., Corlette, S., & Lucia, K. (2016). State-Run SHOPs: An Update Three Years Post ACA Implementation. http://www.commonwealthfund.org/publications/blog/2016/jul/state-run-shops.
Empire BlueCross BlueShield (Empire BCBS) (2017). Glossary of Prescription Terms. https://www.empireblue.com/wps/portal/ehpfooter?content_path=shared/noapplication/f3/s3/t0/pw_e194713.htm&state=me&rootLevel=2&label=Glossary%20of%20Prescription%20Terms.
Ettner, S.L., Harwood, J.M., Thalmayer, A., Ong, M.K., Xu, H., Bresolin, M.J., Wells, K.B., Tseng, C., & Azocar, F. (2016). The Mental Health Parity and Addiction Equity Act evaluation study: Impact on specialty behavioral health utilization and expenditures among "carve-out" enrollees. Journal of Health Economics, 50, 131-143.
French, M.T., Homer, J., Gumus, G., & Hickling, L. (2016). Key provisions of the patient protection and Affordable Care Act (ACA): A systematic review and presentation of early research findings. Health Services Research, 51(5), 1735-1771. dx.doi.org/10.1111/1475-6773.12511
Frost, A., Herrera, C.N., & Hewitt, P.S. (2014). Selected Trends for Young Adults. Issue Brief #8. Washington, DC: Health Care Cost Institute.
Goldman, H.H., Frank, R.G., Burnam, M.A., Huskamp, H.A., Ridgely, M.S., Normand, S.L., Young, A.S., Barry, C.L., Azzone, V., Busch, A.B., Azrin, S.T., Moran, G., Lichtenstein, C., & Blasinsky, M. (2006). Behavioral health insurance parity for federal employees. New England Journal of Medicine, 354(13), 1378-1386. dx.doi.org/10.1056/NEJMsa053737.
Goplerud, E.N. (2013). Consistency of Large Employer and Group Health Plan Benefits with Requirements of the Paul Wellstone and Pete Domenici Mental Health Parity and Addition Equity Act of 2008. https://aspe.hhs.gov/report/consistency-large-employer-and-group-health-plan-benefits-requirements-paul-wellstone-and-pete-domenici-mental-health-parity-and-addiction-equity-act-2008.
Grazier, K.L., Eisenberg, D., Jedele, J.M., & Smiley, M.L. (2016). Effects of mental health parity on high utilizers of services: Pre-post evidence from a large, self-insured employer. Psychiatric Services, 67(4), 448-451. dx.doi.org/10.1176/appi.ps.201400586.
Haeder, S.F., Weimer, D.L., & Mukamel, D.B. (2015). California hospital networks are narrower in marketplace than in commercial plans, but access and quality are similar. Health Affairs (Project Hope), 34(5), 741-748. dx.doi.org/10.1377/hlthaff.2014.1406.
Haeder, S.F., Weimer, D.L., & Mukamel, D.B. (2016). Secret shoppers find access to providers and network accuracy lacking for those in marketplace and commercial plans. Health Affairs (Millwood), 35(7), 1160-1166. PubMed dx.doi.org/10.1377/hlthaff.2015.1554.
HealthCare.gov. (2016a). Small Businesses: Offer Quality, Affordable Health Insurance to Your Employees. https://www.healthcare.gov/small-businesses/employers/.
HealthCare.gov. (2016b). FFM QHP Landscape Files: Health and Dental Datasets for Researchers and Issuers. https://www.healthcare.gov/health-and-dental-plan-datasets-for-researchers-and-issuers/.
HealthCare.gov. (2016c). 2014 Plan Data. https://www.healthcare.gov/health-and-dental-plan-datasets-for-researchers-and-issuers/.
Health Resources & Services Administration (HRSA). (2014). Designated Health Professional Shortage Areas Statistics. Rockville, MD: U.S Department of Health and Human Services.
Horgan, C.M., Hodgkin, D., Stewart, M.T., Quinn, A., Merrick, E.L., Reif, S., Garnick, D.W., & Creedon, T.B. (2016). Health plans' early response to federal parity legislation for mental health and addiction services. Psychiatric Services, 67(2), 162-168. dx.doi.org/10.1176/appi.ps.201400575.
Horvath, J. (2014). A Review of Behavioral Health Benefits in Newly Reformed Individual Marketplaces--Services and Drug Coverage. Presented at the Mental Health America conference, Washington, DC, September 11, 2014.
Insel, T. (2011). Antidepressants: A Complicated Picture. https://www.nimh.nih.gov/about/directors/thomas-insel/blog/2011/antidepressants-a-complicated-picture.shtml.
Kaiser Family Foundation. (2016). State Health Insurance Marketplace Types, 2017. http://kff.org/health-reform/state-indicator/state-health-insurance-marketplace-types/?currentTimeframe=0.
Lang, M. (2013). The impact of mental health insurance laws on state suicide rates. Health Economics, 22(1), 73-88. dx.doi.org/10.1002/hec.1816.
Levit, K.R., Stranges, E., Coffey, R.M., Kassed, C., Mark, T.L., Buck, J.A., & Vandivort-Warren, R. (2013). Current and future funding sources for specialty mental health and substance abuse treatment providers. Psychiatric Services, 64(6), 512-519. dx.doi.org/10.1176/appi.ps.201200298.
McCarty, S., & Ferris, M. (August 2013). ACA implications for State Network Adequacy Standards. RWJF Issue Brief. http://www.rwjf.org/en/library/research/2013/08/aca-implications-for-state-network-adequacy-standards.html.
McGinty, E.E., Busch, S.H., Stuart, E.A., Huskamp, H.A., Gibson, T.B., Goldman, H.H., & Barry, C.L. (2015). Federal parity law associated with increased probability of using out-of-network substance use disorder treatment services. Health Affairs (Project Hope), 34(8), 1331-1339. dx.doi.org/10.1377/hlthaff.2014.1384.
Mental Health & Substance Use Disorder Parity Task Force. (2016). Final Report. Washington, DC: Executive Office of the President of the United States.
Miller, J.E., Gordon, S.Y., & Glover, R.W. (2014). Striking a Balance: Mental Health Provider Network Adequacy under Health Care Reform. Alexandria, VA: National Association of State Mental Health Program Directors.
National Advisory Mental Health Council (NAMHC). (2000). Parity in Coverage of Mental Health Services in an Era of Managed Care. An Interim Report for Congress. Washington, DC: U.S. Department of Health and Human Services.
National Association of Insurance Commissioners (NAIC). (2016). Network Adequacy. http://www.naic.org/cipr_topics/topic_network_adequacy.htm. Last updated July 14, 2016.
National Center on Addiction & Substance Abuse (2016). Uncovering Coverage Gaps: A Review of Addiction Benefits in ACA Plans. http://www.centeronaddiction.org/addiction-research/reports/uncovering-coverage-gaps-review-of-addiction-benefits-in-aca-plans.
Northrop Grumman Information Technology, Inc. (2004). Evaluation of Parity in the Federal Employees Health Benefits (FEHB) Program: Final Report. Washington, DC: U.S. Department of Health and Human Services. https://aspe.hhs.gov/report/evaluation-parity-federal-employees-health-benefits-fehb-program-final-report.
Polsky, D., & Weiner, J. (2015). The Skinny on Narrow Networks in Health Insurance Marketplace Plans. Philadelphia, PA: University of Pennsylvania LDI; Retrieved from http://ldi.upenn.edu/sites/default/files/pdf/the-skinny-on-narrow-networks.pdf.
Sarata, A.K. (2011). Mental Health Parity and the Patient Protection and Affordable Care Act of 2010. Vol. 7-5700. Washington, DC: Congressional Research Service.
Skopec, L., Henderson, A., Todd, S., & Yong, P.L. (2011). Essential Health Benefits: Comparing Benefits in Small Group Products and State and Federal Employee Plans. ASPE Issue Brief. Washington, DC: U.S. Department of Health and Human Services. https://aspe.hhs.gov/basic-report/essential-health-benefits-comparing-benefits-small-group-products-and-state-and-federal-employee-plans.
Substance Abuse & Mental Health Services Administration (SAMHSA). (2006). Substance Abuse: Clinical Issues in Intensive Outpatient Treatment. HHS Publication No. (SMA) 06-4182. Rockville, MD: U.S. Department of Health and Human Services.
Substance Abuse & Mental Health Services Administration (SAMHSA). (2013a). Report to Congress on the Nation's Substance Abuse and Mental Health Workforce Issues. Rockville, MD: U.S. Department of Health and Human Services.
Substance Abuse & Mental Health Services Administration (SAMHSA). (2013b). Behavioral Health, United States, 2012. Rockville, MD: U.S. Department of Health and Human Services.
Substance Abuse & Mental Health Services Administration (SAMHSA). (2016). Key Substance Use and Mental Health Indicators in the United States: Results from the 2015 National Survey on Drug Use and Health. HHS Publication No. (SMA) 16-4984, NSDUH Series H-51. Rockville, MD: U.S. Department of Health and Human Services. http://www.samhsa.gov/data/.
Thomas, K.C., Ellis, A.R., Konrad, T.R., Holzer, C.E., & Morrissey, J.P. (2009). County-level estimates of mental health professional shortage in the United States. Psychiatric Services, 60(10), 1323-1328.
U.S. Census Bureau. (2010). 2010 Census Urban and Rural Classification and Urban Area Criteria. https://www.census.gov/geo/reference/ua/urban-rural-2010.html.
U.S. Census Bureau. (2013). 2013 Annual Estimates of the Resident Population for the United States, Regions, States, and Puerto Rico: April 1, 2010 to July 1, 2013. NST-EST2013-01. http://www.census.gov/popest/data/state/totals/2013/index.html.
U.S. Census Bureau. (2014). Annual Estimates of the Resident Population for Counties: April 1, 2010 to July 1, 2013. http://www.census.gov/popest/data/counties/totals/2013/CO-EST2013-01.ht….
U.S. Census Bureau. (2015a). 2010 FIPS Codes for Counties and County Equivalent Entities. http://www.census.gov/geo/reference/codes/cou.html.
U.S. Census Bureau. (2015b). Regions and Divisions. http://www.census.gov/econ/census/help/geography/regions_and_divisions.html.
U.S. Census Bureau. (2016). Download 2010 ZIP Code Tabulation Area (ZCTA) Relationship Files. https://www.census.gov/geo/maps-data/data/zcta_rel_download.html.
U.S. Department of Health & Human Services (HHS). (2016). ObamaCare Facts. http://obamacarefacts.com/state-health-insurance-exchange/.
Washington State Department of Labor & Industries. (2017). Utilization Review Definitions. http://www.lni.wa.gov/ClaimsIns/Providers/AuthRef/UtilReview/definitions.asp.
APPENDIX A. CANDIDATE MEASURES FOR SELECTING STATES
| TABLE A-1. Candidate Measures by State and Region | |||||||
|---|---|---|---|---|---|---|---|
| State | Percent Population Facing High Shortage of Mental Health Professionals |
Percent Population Living in Counties with High Shortage of Prescribing Professionals |
Percent Population Mental Health Need Met by Current Supply in the Designated HPSA |
Percent Population Living in Urban Area, 2010 |
Federal/State/ Partnership Exchange |
Population in 2013 (millions) |
Strength of State Parity Law |
| Census Region 1: Northeast | |||||||
| Connecticuta | 0.0 | 0.0 | 34.2 | 88.0 | State | 3.6 | Strong |
| Maine | 6.4 | 20.4 | 35.8 | 38.7 | Federal | 1.3 | Strong |
| Massachusetts | 0.0 | 0.2 | 52.0 | 92.0 | State | 6.7 | Strong |
| New Hampshirea | 4.2 | 3.4 | 94.9 | 60.3 | Partnership | 1.3 | Strong |
| New Jerseya | 1.2 | 5.9 | 74.7 | 94.7 | Federal | 8.9 | Strong |
| New Yorka | 0.0 | 7.1 | 42.4 | 87.9 | State | 19.7 | Strong |
| Pennsylvaniaa | 11.6 | 27.6 | 61.8 | 78.7 | Federal | 12.8 | Weak |
| Rhode Island | 5.0 | 0.0 | 18.7 | 90.7 | State | 1.1 | Strong |
| Vermont | 0.0 | 10.6 | --- | 38.9 | State | 0.6 | Strong |
| Census Region 2: Midwest | |||||||
| Illinois | 20.2 | 27.9 | 68.9 | 88.5 | Partnership | 12.9 | Strong |
| Indiana | 26.1 | 63.4 | 43.3 | 72. 4 | Federal | 6.6 | Weak |
| Iowa | 27.8 | 78.2 | 59.6 | 64.0 | Partnership | 3.1 | Weak |
| Kansas | 24.2 | 52.2 | 56.5 | 74.2 | Federal | 2.9 | Weak |
| Michigana | 21.2 | 48.2 | 49.2 | 74.6 | Partnership | 9.9 | Weak |
| Minnesotaa | 21.0 | 42.9 | 61.4 | 73.3 | State | 5.4 | Strong |
| Missouri | 23.0 | 43.3 | 66.2 | 70.4 | Federal | 6.0 | Weak |
| Nebraska | 27.5 | 51.3 | 76.3 | 73.1 | Federal | 1.9 | Weak |
| North Dakota | 22.4 | 38.6 | 79.1 | 59.9 | Federal | 0.7 | Strong |
| Ohioa | 24.6 | 49.0 | 52.9 | 77.9 | Federal | 11.6 | Weak |
| South Dakota | 28.0 | 54.1 | 15.2 | 56.7 | Federal | 0.8 | Strong |
| Wisconsin | 19.8 | 31.0 | 20.4 | 70.1 | Federal | 5.8 | Weak |
| Census Region 3: South | |||||||
| Alabama | 29.0 | 81.0 | 45.6 | 59.0 | Federal | 4.8 | Strong |
| Arkansas | 28.5 | 67.7 | 63.3 | 56.2 | Partnership | 3.0 | Strong |
| Delaware | 11.4 | 22.2 | 25.6 | 83.3 | Partnership | 1.0 | Strong |
| District of Columbia | 0.0 | 0.0 | 59.8 | 100.0 | State | 0.7 | Weak |
| Floridaa | 25.8 | 73.2 | 45.2 | 91.1 | Federal | 19.6 | Weak |
| Georgia | 24.3 | 50.9 | 44.9 | 75.1 | Federal | 10.0 | Strong |
| Kentucky | 24.0 | 47.8 | 72.4 | 58.9 | State | 4.4 | Weak |
| Louisiana | 21.5 | 64.1 | 41.6 | 73.2 | Federal | 4.6 | Strong |
| Maryland | 0.0 | 10.5 | 63.0 | 87.2 | State | 5.9 | Strong |
| Mississippi | 29.0 | 69.2 | 76.0 | 49.4 | Federal | 3.0 | Weak |
| North Carolina | 20.9 | 58.0 | 50.7 | 66.1 | Federal | 9.9 | Weak |
| Oklahomaa | 26.0 | 51.1 | 25.0 | 66.2 | Federal | 3.9 | Strong |
| South Carolina | 24.6 | 65.0 | 55.0 | 66.3 | Federal | 4.8 | Weak |
| Tennessee | 25.4 | 62.7 | 39.5 | 66.4 | Federal | 6.5 | Weak |
| Texas | 28.5 | 75.1 | 46.0 | 84.7 | Federal | 26.5 | Strong |
| Virginia | 8.9 | 25.7 | 61.0 | 75.5 | Federal | 8.3 | Strong |
| West Virginia | 26.9 | 85.0 | 66.1 | 48.7 | Partnership | 1.9 | Strong |
| Census Region 4: West | |||||||
| Alaska | 17.5 | 39.2 | 24.3 | 66.0 | Federal | 0.7 | Weak |
| Arizona | 25.4 | 82.3 | 24.1 | 89.8 | Federal | 6.6 | Weak |
| Californiaa | 11.1 | 25.2 | 44.1 | 95.0 | State | 38.3 | Strong |
| Colorado | 15.3 | 37.3 | 76.5 | 86.2 | State | 5.3 | Weak |
| Hawaii | 11.3 | 11.3 | 64.0 | 91.9 | State | 1.4 | Strong |
| Idaho | 31.6 | 97.8 | 55.1 | 70.6 | State | 1.6 | Weak |
| Montana | 25.6 | 47.2 | 25.5 | 55.9 | Federal | 1.0 | Strong |
| Nevada | 29.9 | 81.6 | 54.3 | 94.2 | State | 2.8 | Weak |
| New Mexico | 17.2 | 46.4 | 29.2 | 77.4 | State | 2.1 | Strong |
| Oregon | 19.0 | 27.8 | 50.5 | 81.0 | State | 3.9 | Weak |
| Utah | 26.3 | 58.7 | 65.7 | 90.6 | Federal | 2.9 | Strong |
| Washington | 19.1 | 38.2 | 42.4 | 84.0 | State | 7.0 | Weak |
| Wyoming | 29.0 | 73.2 | 73.9 | 64.8 | Federal | 0.6 | Weak |
| SOURCE: HRSA, 2014; Kaiser Family Foundation, 2016; Lang, 2013; SAMHSA, 2013; U.S. Census Bureau, 2010, 2013, 2014, and 2015b; HHS, 2016. NOTES: Final selection criteria used were state: (1) census region; (2) percent population living in counties with high shortage of prescribing professionals; (3) percent population living in urban area, 2010; (4) federal/state/partnership exchange; and (5) population in 2013. Percent population mental health need met by current supply in the designated HPSA is defined as the number of providers available to serve the covered population divided by the number of providers that would be needed based on current regulations (HRSA, 2014). High shortage of prescribing professionals is considered as there being more than 50% with a shortage (SAMHSA, 2013).
|
|||||||
APPENDIX B. TOP FOUR ISSUERS PER STATE BY MARKET SHARE
| TABLE B-1. Top 4 Issuers per State by Market Share | |||
|---|---|---|---|
| State | Issuer | Total Number of Policies/Certificates |
Total Number of Covered Lives |
| AR | Arkansas BCBS | 96,324 | 159,118 |
| United Healthcare | 16,207 | 27,561 | |
| QualChoice | 15,707 | 25,529 | |
| Health Advantage | 11,007 | 19,121 | |
| CA | Anthem Blue Cross | 757,113 | 1,261,509 |
| Kaiser Permanente | 643,620 | 990,505 | |
| Blue Shield of California | 414,028 | 676,610 | |
| Health Net | 223,853 | 343,947 | |
| CT | Anthem Health Plans | 71,105 | 133,315 |
| ConnectiCare | 41,467 | 69,415 | |
| Aetna | 32,201 | 54,821 | |
| Oxford Health Plans | 20,922 | 38,056 | |
| FL | BCBS of Florida, Inc. | 375,316 | 596,550 |
| United Healthcare | 134,958 | 221,951 | |
| Aetna Health | 103,116 | 156,094 | |
| Humana | 78,751 | 143,928 | |
| ID | Blue Cross of Idaho Health Service | 48,528 | 89,500 |
| Regence Blue Shield of Idaho | 31,681 | 51,900 | |
| PacificSource Health Plans | 11,081 | 22,496 | |
| Select Health, Inc. | 2,626 | 5,337 | |
| MI | BCBS of Michigan | 272,278 | 528,348 |
| Priority Health | 64,799 | 119,315 | |
| Golden Rule Insurance Company | 33,376 | 61,019 | |
| Alliance Health and Life Insurance Company | 18,180 | N/A | |
| United Healthcare | N/A | 33,099 | |
| MN | BCBS Minnesota | 155,035 | 258,952 |
| HealthPartners | 66,810 | 131,794 | |
| Medica Group | 34,740 | 116,719 | |
| PreferredOne | 18,411 | 37,743 | |
| NH | Matthew Thornton Health Plan, Inc. | 32,299 | 54,446 |
| Anthem Health Plans of New Hampshire, Inc. | 21,240 | 35,169 | |
| Harvard Pilgrim Health Care | 9,683 | 21,523 | |
| Time Insurance Company | 1,934 | 3,417 | |
| NJ | Horizon BCBS New Jersey | 278,228 | 487,081 |
| United Healthcare (including Oxford Health) | 59,564 | 120,551 | |
| Oxford Health Insurance | 59,337 | 120,005 | |
| AmeriHealth New Jersey | 582,013 | 102,316 | |
| NY | Oxford Health Plans | 393,585 | 729,406 |
| Excellus Health Plan, Inc. | 125,811 | 232,031 | |
| EmblemHealth | 72,746 | 132,616 | |
| Empire HealthChoice | 54,740 | N/A | |
| CDPHP Universal Benefits, Inc. | N/A | 86,907 | |
| OH | Community Insurance Company (Anthem BCBS) | 240,597 | 457,719 |
| Medical Mutual of Ohio | 201,166 | 391,414 | |
| United Healthcare | 48,459 | 97,503 | |
| Humana | 31,407 | 61,817 | |
| PA | Highmark | 192,364 | 315,076 |
| Aetna | 122,641 | 208,029 | |
| Keystone | 95,934 | 164,231 | |
| Capital Advantage | 74,762 | 132,111 | |
| SOURCE: Constructed from publicly available data on issuers' MLR in 2013 (https://www.cms.gov/apps/mlr/mlr-search.aspx). | |||
APPENDIX C. WORKING DEFINITIONS OF BEHAVIORAL HEALTH SERVICES AND TYPES OF CARE USED TO ABSTRACT PLAN DATA
This appendix describes working definitions used to search for terms in the plan documents for: (a) types of care that may span both behavioral health and medical/surgical coverage; and (b) specific services.
Working Definitions on Types of Care for Data Abstraction
To help determine whether coverage applied to types of care, we created working definitions of key concepts. These include acute care, post-acute care, rehabilitative treatment and services, and partial hospitalization or IOT.
Acute Care
Defined as active but short-term treatment for urgent conditions, including severe injury or episode of illness, or during recovery from surgery.
For behavioral health care, acute care is often provided in inpatient or residential settings. Substance use treatment facilities, mental health facilities, and specialized units in hospitals might provide these kind of services. Long-term facilities focus on behavioral change in a highly structured setting. In the nearer term, detoxification and intensive treatment is common.
For medical/surgical care acute care is often in an inpatient setting and broadly aims to stabilize a patient to help the patient return to the community or other, lower-intensity care settings.
Post-Acute Care
Defined as following an acute hospitalization for injury or illness and includes those services provided, either at home or in a specialized facility, that support the individual's continued recovery from illness or management of a chronic illness or disability. This definition comes from commonly used guidance for providers (e.g., California Hospital Association, 2016).
With regard to behavioral health care, post-acute care may be in an outpatient setting or in the community. In community-based settings, short-term residential care prepares the patient for a return to community-based settings. Care in community settings encompasses services provided in a home or settings that offer social supports and low-intensity medical or health services such as intermittent nursing care. Home health services are included in this category. Social supports may include shelter, education or employment support services, self-help, and support groups.
For medical/surgical care, intensive services include rehabilitation programs provided in the hospital setting -- whether inpatient (acute rehabilitation facility) or outpatient (intensive cardiac rehabilitation programs). Care may also be provided in other, traditional post-acute care settings such as skilled nursing facilities and long-term care hospitals. Outpatient hospital services are delivered in this setting because of the capacity for the provider to deliver those services. Care in community settings is as defined for behavioral health care, immediately above.
Rehabilitative Treatment and Services
Rehabilitative treatment covers a range of services to help a person regain functioning -- physical, mental, or cognitive abilities -- that has been impaired as a result of disease, injury, or treatment. By improving functioning, these services help people return to daily life and live in a normal or near-normal way.
Partial Hospitalization and Intensive Outpatient Treatment
Partial hospitalization and IOT are levels of care that bridge between outpatient care and inpatient care. IOT is provided on an outpatient basis and is recommended for a minimum of 90 days, comprising 6-30 hours of patient-provider contact time per week (SAMHSA, 2006). After completing partial hospitalization or IOT, the patient may step down to regular outpatient treatment to help sustain recovery. Although partial hospitalization is a higher level of care than IOT, for the purposes of the current project it is categorized with IOT.
Specific Services
Table C-1 summarizes the operating definitions we applied to specific services and how the definition depended on whether the condition was behavioral or medical/surgical in nature.
| TABLE C-1. Data Abstraction Template Keywords for Select Services | ||
|---|---|---|
| Service | Key Words | Notes |
| Intensive behavioral therapy |
|
|
| IOT (sometimes referred to as intensive outpatient therapy) |
|
|
| Post-acute or rehabilitative treatment services |
|
|
| Intermediate care |
|
|
APPENDIX D. GUIDANCE USED TO IDENTIFY NON-QUANTITATIVE TREATMENT LIMITATIONS
This appendix describes the guidance used to identify NQTLs in plan and formulary documents. An NQTL is designed to manage use of services other than by explicitly stated quantity limits. Although some of the protocols to manage service delivery are likely to be only available upon request by a provider, some of these coverage restrictions are available in plan documents. The descriptions apply to services for either behavioral health or medical/surgical care.
Concurrent review: Review performed while the worker is still hospitalized and services are being provided. Concurrent review also occurs with additional physical medicine (Washington State Department of Labor and Industries, 2017).
Generic substitution: The practice of dispensing a generic equivalent instead of the brand counterpart. Substitutions can only occur when a generic equivalent is available, when the substitution is allowed by law, and when the physician has not marked the prescription "dispense as written" (Empire BCBS, 2017).
Preadmission notification: The insurance company is to be notified before a planned admission.
Precertification: A process used by some managed care companies to review and authorize non-emergency procedures and hospitalizations in advance. When members do not receive precertification, benefits are usually paid at a lower level or are not paid at all. Synonyms include preauthorization, predetermination and prior authorization (AHRQ, 2008).
Prior authorization: A process used by some managed care companies to review and authorize non-emergency procedures and hospitalizations in advance. When members do not receive precertification, benefits are usually paid at a lower level or are not paid at all. Synonyms include preauthorization, predetermination, and precertification (AHRQ, 2008).
Quantity limits: A restriction on prescription medication that places a ceiling on the number of units dispensed for a defined period of time.
Retrospective review: Review to make a benefit coverage determination that is performed after the requested service or procedure has been initiated. Typically, retrospective review only applies if a service did not require prior authorization or precertification and did not receive a predetermination review. Retrospective reviews may be conducted for inpatient or outpatient care (Washington State Department of Labor and Industries, 2017). Some plan documents interchangeably use the term Post Service Clinical Claims Review.
Step therapy: The practice of beginning a course of treatment with an initial drug before using another drug therapy and progressing to more advanced therapy only if necessary. Step therapy may also recommend that two therapies not be used simultaneously to avoid adverse outcomes (Empire BCBS, 2017).
Therapeutic substitution: The practice of substituting one drug for another (with the health plan member's consent) when both are thought to produce the same therapeutic effects (Empire BCBS, 2017).
Utilization management: The process used in managed care to review and authorize services for medical necessity and appropriateness. Utilization management can consist of review at various phases of care -- before services are provided (prospective), at the same time as services are provided (concurrent) and after services are completed (retroactive). Utilization management may also include arrangements for alternative methods of receiving care (e.g., home health, skilled nursing facility) and for discharge planning (AHRQ, 2008).
APPENDIX E. T-TESTS
| TABLE E-1. Percentage of Plans with any Explicitly Stated Exclusion for Behavioral Health and for Medical/Surgical Conditions (Figure 4-1): T-test across 2013 and 2014 | ||
|---|---|---|
| Health Condition | t-value | p-value |
| Any behavioral health conditions explicitly excluded | 0.104 | 0.917 |
| Any medical/surgical conditions explicitly excluded | -0.139 | 0.890 |
| TABLE E-2. Percentage of Plans with any Explicitly Stated Exclusion for Behavioral Health and for Medical/Surgical Conditions (Figure 4-1): T-test across Health Conditions | ||||
|---|---|---|---|---|
| Health Condition | 2013 | 2014 | ||
| t-value | p-value | t-value | p-value | |
| Any conditions explicitly excluded | 2.933 | 0.004 | 3.075 | 0.002 |
| TABLE E-3. Percentage of Plans with Explicitly Stated Coverage and Exclusions for Select Health Conditions (Table 4-1): T-test across 2013 and 2014 | ||||||
|---|---|---|---|---|---|---|
| Health Condition | Covered | Excluded | Unclear | |||
| t-value | p-value | t-value | p-value | t-value | p-value | |
| Autism | 4.539 | 0.000 | -2.318 | 0.022 | -2.575 | 0.011 |
| Organic brain disorders | 0.324 | 0.747 | N/A | N/A | -0.324 | 0.747 |
| Tobacco use | 1.559 | 0.122 | N/A | N/A | -1.559 | 0.122 |
| NOTE: T-test necessarily excludes any plan with missing data. | ||||||
| TABLE E-4. Percentage of Plans with Explicitly Stated Coverage and Exclusions, by Setting and Health Condition (Table 4-2): T-test across 2013 and 2014 | ||||||
|---|---|---|---|---|---|---|
| Setting/Network Status and Health Condition | Covered | Excluded | Unclear | |||
| t-value | p-value | t-value | p-value | t-value | p-value | |
| Inpatient | ||||||
| Mental health | 3.914 | 0.000 | -3.914 | 0.000 | N/A | N/A |
| Substance abuse | 4.391 | 0.000 | -4.391 | 0.000 | N/A | N/A |
| Medical/surgical | N/A | N/A | N/A | N/A | N/A | N/A |
| Outpatient (including urgent care) | ||||||
| Mental health | 4.863 | 0.000 | -4.863 | 0.000 | N/A | N/A |
| Substance abuse | 4.391 | 0.000 | -4.391 | 0.000 | N/A | N/A |
| Medical/surgical | N/A | N/A | N/A | N/A | N/A | N/A |
| Office visits | ||||||
| Mental health | 4.391 | 0.000 | -4.391 | 0.000 | N/A | N/A |
| Substance abuse | 4.391 | 0.000 | -4.391 | 0.000 | N/A | N/A |
| Medical/surgical | N/A | N/A | N/A | N/A | N/A | N/A |
| Emergency | ||||||
| Mental health | 2.473 | 0.015 | -4.154 | 0.000 | 1.819 | 0.071 |
| Substance abuse | 2.728 | 0.007 | -4.154 | 0.000 | 1.108 | 0.270 |
| Medical/surgical | N/A | N/A | N/A | N/A | N/A | N/A |
| Prescription drugs | ||||||
| Mental health | 2.421 | 0.017 | -3.422 | 0.001 | 1.266 | 0.208 |
| Substance abuse | 4.681 | 0.000 | -4.627 | 0.000 | -1.135 | 0.259 |
| Medical/surgical | N/A | N/A | N/A | N/A | N/A | N/A |
| NOTE: T-test necessarily excludes any plan with missing data. | ||||||
| TABLE E-5. Percentage of Plans with Explicitly Stated Coverage and Exclusions, by Setting and Health Condition (Table 4-2): T-test across Health Condition Categories | ||||||||||||
|---|---|---|---|---|---|---|---|---|---|---|---|---|
| Setting/Network Status and Health Condition | 2013 Covered | 2013 Excluded | 2013 Unclear | 2014 Covered | 2014 Excluded | 2014 Unclear | ||||||
| t-value | p-value | t-value | p-value | t-value | p-value | t-value | p-value | t-value | p-value | t-value | p-value | |
| Inpatient | ||||||||||||
| Mental health compared to medical/surgical | 3.478 | 0.001 | -3.478 | 0.001 | N/A | N/A | N/A | N/A | N/A | N/A | N/A | N/A |
| Substance abuse compared to medical/surgical | 3.901 | 0.000 | -3.901 | 0.000 | N/A | N/A | N/A | N/A | N/A | N/A | N/A | N/A |
| Outpatient (including urgent care) | ||||||||||||
| Mental health compared to medical/surgical | 4.320 | 0.000 | -4.320 | 0.000 | N/A | N/A | N/A | N/A | N/A | N/A | N/A | N/A |
| Substance abuse compared to medical/surgical | 4.320 | 0.000 | -4.320 | 0.000 | N/A | N/A | N/A | N/A | N/A | N/A | N/A | N/A |
| Office visits | ||||||||||||
| Mental health compared to medical/surgical | 3.901 | 0.000 | -3.901 | 0.000 | N/A | N/A | N/A | N/A | N/A | N/A | N/A | N/A |
| Substance abuse compared to medical/surgical | 3.901 | 0.000 | -3.901 | 0.000 | N/A | N/A | N/A | N/A | N/A | N/A | N/A | N/A |
| Emergency | ||||||||||||
| Mental health compared to medical/surgical | 3.690 | 0.000 | -3.690 | 0.000 | N/A | N/A | 2.047 | 0.043 | N/A | N/A | -2.047 | 0.043 |
| Substance abuse compared to medical/surgical | 3.690 | 0.000 | -3.690 | 0.000 | N/A | N/A | 2.047 | 0.043 | N/A | N/A | -2.047 | 0.043 |
| Prescription drugs | ||||||||||||
| Mental health compared to medical/surgical | 3.040 | 0.003 | -3.040 | 0.003 | N/A | N/A | 1.425 | 0.157 | N/A | N/A | -1.425 | 0.157 |
| Substance abuse compared to medical/surgical | 3.040 | 0.003 | -3.040 | 0.003 | N/A | N/A | 1.425 | 0.157 | N/A | N/A | -1.425 | 0.157 |
| NOTE: T-test necessarily excludes any plan with missing data. | ||||||||||||
| TABLE E-6. Percentage of Plans with Explicitly Stated Coverage and Exclusions for Selected Services, by 2013 and 2014 (Table 4-3): T-test across Health Conditions | ||||||
|---|---|---|---|---|---|---|
| Health Condition and Services | Covered | Excluded | Unclear | |||
| t-value | p-value | t-value | p-value | t-value | p-value | |
| Intensive behavioral therapy | ||||||
| Behavioral health | 3.172 | 0.002 | 0.160 | 0.873 | -3.059 | 0.003 |
| Medical/surgical | 2.877 | 0.005 | -0.754 | 0.452 | -1.444 | 0.151 |
| IOT | ||||||
| Behavioral health | 6.077 | 0.000 | -4.091 | 0.000 | -3.170 | 0.002 |
| Medical/surgical | 0.670 | 0.504 | N/A | N/A | -1.781 | 0.078 |
| Intermediate care settings | ||||||
| Behavioral health | 3.493 | 0.001 | -5.257 | 0.000 | 0.109 | 0.913 |
| Medical/surgical | 1.500 | 0.136 | -2.580 | 0.011 | -0.346 | 0.730 |
| Post-acute or rehabilitative treatment | ||||||
| Behavioral health | 2.993 | 0.003 | -4.091 | 0.000 | -0.677 | 0.500 |
| Medical/surgical | 1.109 | 0.270 | N/A | N/A | -1.109 | 0.270 |
| NOTE: T-test necessarily excludes any plan with missing data. | ||||||
| TABLE E-7. Percentage of Plans with Explicitly Stated Coverage and Exclusion for Selected Services, by 2013 and 2014 (Table 4-3): T-test across Health Conditions | ||||||||||||
|---|---|---|---|---|---|---|---|---|---|---|---|---|
| Services | 2013 Covered | 2013 Excluded | 2013 Unclear | 2014 Covered | 2014 Excluded | 2014 Unclear | ||||||
| t-value | p-value | t-value | p-value | t-value | p-value | t-value | p-value | t-value | p-value | t-value | p-value | |
| Intensive behavioral therapy | 1.751 | 0.083 | 1.528 | 0.130 | -2.477 | 0.015 | 2.126 | 0.035 | 2.671 | 0.009 | -4.525 | 0.000 |
| IOT | -5.551 | 0.000 | 3.690 | 0.000 | 2.865 | 0.005 | -0.602 | 0.548 | N/A | N/A | 1.734 | 0.085 |
| Intermediate care settings | -6.132 | 0.000 | 2.750 | 0.007 | 3.342 | 0.001 | -4.236 | 0.000 | N/A | N/A | 4.236 | 0.000 |
| Post-acute or rehabilitative treatment | -8.648 | 0.000 | 3.690 | 0.000 | 5.589 | 0.000 | -5.920 | 0.000 | N/A | N/A | 5.920 | 0.000 |
| NOTE: T-test necessarily excludes any plan with missing data. | ||||||||||||
| TABLE E-8. Percentage of Plans with Select NQTLs for Behavioral Health Care, 2013 and 2014 (Table 4-4): T-test across Year | ||
|---|---|---|
| NQTL Type | t-value | p-value |
| Inpatient | ||
| Concurrent review | -2.334 | 0.021 |
| Preadmission notification | -1.636 | 0.104 |
| Precertification | 2.068 | 0.041 |
| Prior authorization | 0.431 | 0.667 |
| Retrospective review | 2.414 | 0.017 |
| Outpatient | ||
| Precertification | 1.184 | 0.238 |
| Prior authorization | 1.059 | 0.292 |
| Office visit | ||
| Prior authorization | 1.602 | 0.111 |
| Retrospective review | 1.538 | 0.126 |
| Emergency Department | ||
| Admission notification | 0.805 | 0.422 |
| Retrospective review | 0.755 | 0.451 |
| TABLE E-9. Percentage of Plans with Co-Payments for the Initial Visit, by Setting and Health Condition (Table 4-5): T-test across 2013 and 2014 | ||
|---|---|---|
| Setting and Health Condition | t-value | p-value |
| Inpatient | ||
| Behavioral health | 1.841 | 0.069 |
| Medical/surgical | 2.267 | 0.026 |
| Outpatient | ||
| Behavioral health | 1.378 | 0.172 |
| Medical/surgical | -0.829 | 0.409 |
| Office visit | ||
| Behavioral health | -1.066 | 0.289 |
| Medical/surgical | -0.861 | 0.391 |
| Emergency department | ||
| Behavioral health | 1.127 | 0.263 |
| Medical/surgical | 0.782 | 0.436 |
| Prescription drug | ||
| Behavioral health | -3.267 | 0.002 |
| Medical/surgical | -3.631 | 0.000 |
| TABLE E-10. Percentage of Plans with Co-Payments for the Initial Visit, by Setting, 2013 and 2014 (Table 4-5): T-test across Health Conditions | ||||
|---|---|---|---|---|
| Setting | 2013 | 2014 | ||
| t-value | p-value | t-value | p-value | |
| Inpatient | -1.133 | 0.261 | -1.610 | 0.110 |
| Outpatient | -0.144 | 0.886 | 2.357 | 0.020 |
| Office visit | -0.974 | 0.333 | -1.469 | 0.145 |
| Emergency department | 0.000 | 1.000 | 0.452 | 0.652 |
| Prescription drug | -0.007 | 0.994 | 0.107 | 0.915 |
| TABLE E-11. Average Co-Payment Amounts for the Initial Visit, Among Plans with Co-Payments, by Setting and Health Condition (Table 4-6): T-test across 2013 and 2014 | ||
|---|---|---|
| Setting and Health Condition | t-value | p-value |
| Inpatient | ||
| Behavioral health | 0.466 | 0.648 |
| Medical/surgical | 0.747 | 0.461 |
| Outpatient | ||
| Behavioral health | -1.434 | 0.168 |
| Medical/surgical | -0.976 | 0.350 |
| Office visit | ||
| Behavioral health | 1.724 | 0.091 |
| Medical/surgical | 0.694 | 0.490 |
| Emergency department | ||
| Behavioral health | 1.391 | 0.170 |
| Medical/surgical | 1.337 | 0.187 |
| Prescription drug | ||
| Behavioral health | 0.480 | 0.633 |
| Medical/surgical | 0.389 | 0.699 |
| TABLE E-12. Average Co-Payment Amounts for the Initial Visit, Among Plans with Co-Payments, by Setting, 2013 and 2014 (Table 4-6): T-test across Health Conditions | ||||
|---|---|---|---|---|
| Setting | 2013 | 2014 | ||
| t-value | p-value | t-value | p-value | |
| Inpatient | 0.248 | 0.810 | 0.511 | 0.612 |
| Outpatient | -2.430 | 0.035 | -3.617 | 0.002 |
| Office visit | 1.805 | 0.076 | 3.036 | 0.003 |
| Emergency department | -0.107 | 0.915 | 0.000 | 1.000 |
| Prescription drug | -0.199 | 0.843 | 0.000 | 1.000 |
| TABLE E-13. Percentage of Plans with Co-Insurance for the Initial Visit, by Setting and Health Condition (Table 4-7): T-test across 2013 and 2014 | ||
|---|---|---|
| Setting/Network Status and Health Conditions | t-value | p-value |
| Inpatient | ||
| Behavioral health | -2.300 | 0.024 |
| Medical/surgical | -0.555 | 0.580 |
| Outpatient | ||
| Behavioral health | -2.888 | 0.005 |
| Medical/surgical | -0.732 | 0.466 |
| Office visit | ||
| Behavioral health | -0.417 | 0.678 |
| Medical/surgical | -0.964 | 0.337 |
| Emergency department | ||
| Behavioral health | -2.594 | 0.011 |
| Medical/surgical | -1.234 | 0.220 |
| Prescription drug | ||
| Behavioral health | 0.557 | 0.579 |
| Medical/surgical | 0.811 | 0.419 |
| TABLE E-14. Percentage of Plans with Co-Insurance for the Initial Visit, by Setting, 2013 and 2014 (Table 4-7): T-test across Health Conditions | ||||
|---|---|---|---|---|
| Setting/Network Status | 2013 | 2014 | ||
| t-value | p-value | t-value | p-value | |
| Inpatient | 1.433 | 0.153 | -0.384 | 0.702 |
| Outpatient | 0.747 | 0.457 | -1.729 | 0.086 |
| Office visit | 0.384 | 0.702 | 1.003 | 0.318 |
| Emergency department | 0.897 | 0.372 | -0.568 | 0.571 |
| Prescription drug | 0.335 | 0.738 | 0.185 | 0.853 |
| TABLE E-15. Consumer Co-Insurance Payment for Initial Visit, by Setting and Health Condition (Table 4-8): T-test across 2013 and 2014 | ||
|---|---|---|
| Setting/Network Status and Health Condition | t-value | p-value |
| Inpatient | ||
| Behavioral health | 0.523 | 0.603 |
| Medical/surgical | 0.663 | 0.509 |
| Outpatient | ||
| Behavioral health | -0.418 | 0.677 |
| Medical/surgical | 0.292 | 0.771 |
| Office visit | ||
| Behavioral health | -0.520 | 0.607 |
| Medical/surgical | 1.075 | 0.291 |
| Emergency department | ||
| Behavioral health | 0.777 | 0.441 |
| Medical/surgical | 1.199 | 0.235 |
| Prescription drug | ||
| Behavioral health | -1.517 | 0.139 |
| Medical/surgical | -1.330 | 0.193 |
| TABLE E-16. Consumer Co-Insurance Payment for Initial Visit, by Setting, 2013 and 2014 (Table 4-8): T-test across Health Conditions | ||||
|---|---|---|---|---|
| Setting/Network Status | 2013 | 2014 | ||
| t-value | p-value | t-value | p-value | |
| Inpatient | -0.104 | 0.918 | -0.242 | 0.810 |
| Outpatient | 0.279 | 0.781 | -0.452 | 0.653 |
| Office visit | 1.032 | 0.311 | -0.471 | 0.641 |
| Emergency department | 0.095 | 0.924 | -0.219 | 0.827 |
| Prescription drug | 0.350 | 0.730 | 0.179 | 0.859 |
| TABLE E-17. Average Percentage of Initial Visit Cost Paid for by Consumer, by Setting and Health Condition (Table 4-9): T-test across 2013 and 2014 | ||
|---|---|---|
| Setting/Network Status and Health Condition | t-value | p-value |
| Inpatient | ||
| Behavioral health | -2.812 | 0.006 |
| Medical/surgical | 1.068 | 0.288 |
| Outpatient | ||
| Behavioral health | -3.410 | 0.001 |
| Medical/surgical | 0.744 | 0.459 |
| Office visit | ||
| Behavioral health | -3.723 | 0.001 |
| Medical/surgical | 1.263 | 0.216 |
| Emergency department | ||
| Behavioral health | -1.712 | 0.091 |
| Medical/surgical | 1.543 | 0.128 |
| Prescription drug | ||
| Behavioral health | -4.372 | 0.000 |
| Medical/surgical | -2.408 | 0.020 |
| TABLE E-18. Average Percentage of Initial Visit Cost Paid for by Consumer, by Setting, 2013 and 2014 (Table 4-9): T-test across Health Conditions | ||||
|---|---|---|---|---|
| Setting/Network Status | 2013 | 2014 | ||
| t-value | p-value | t-value | p-value | |
| Inpatient | 2.829 | 0.006 | -0.229 | 0.819 |
| Outpatient | 3.404 | 0.001 | -0.372 | 0.711 |
| Office visit | 3.769 | 0.001 | -0.451 | 0.654 |
| Emergency department | 2.353 | 0.021 | -0.190 | 0.850 |
| Prescription drug | 1.555 | 0.129 | 0.180 | 0.858 |
| TABLE E-19. Percentage of Plans with Select NQTLs for Prescription Medication, by Health Condition (Table 4-14): T-test across 2013 and 2014 | ||
|---|---|---|
| Health Condition and Service | t-value | p-value |
| Precertification | ||
| Behavioral health | 1.788 | 0.076 |
| Medical/surgical | 1.788 | 0.076 |
| Prior authorization | ||
| Behavioral health | 0.148 | 0.882 |
| Medical/surgical | 0.923 | 0.358 |
| Retrospective review | ||
| Behavioral health | N/A | N/A |
| Medical/surgical | N/A | N/A |
| Utilization management | ||
| Behavioral health | 1.509 | 0.134 |
| Medical/surgical | 1.509 | 0.134 |
| Generic substitution | ||
| Behavioral health | 0.625 | 0.533 |
| Medical/surgical | 0.418 | 0.676 |
| Step therapy | ||
| Behavioral health | 4.069 | 0.000 |
| Medical/surgical | 2.903 | 0.004 |
| Quantity limit | ||
| Behavioral health | 1.391 | 0.167 |
| Medical/surgical | 0.510 | 0.611 |
| Therapeutic substitution | ||
| Behavioral health | 1.169 | 0.245 |
| Medical/surgical | 0.755 | 0.451 |
| NOTE: T-test necessarily excludes any plan with missing data. | ||
| TABLE E-20. Percentage of Plans with Explicitly Stated Coverage and Exclusions, by Setting/Network Status and Health Condition (Table 4-15): T-test across 2013 and 2014 | ||||||
|---|---|---|---|---|---|---|
| Setting/Network Status and Health Condition | Covered | Excluded | Unclear | |||
| t-value | p-value | t-value | p-value | t-value | p-value | |
| Inpatient in-network | ||||||
| Mental health | 3.914 | 0.000 | -3.914 | 0.000 | N/A | N/A |
| Substance abuse | 4.391 | 0.000 | -4.391 | 0.000 | N/A | N/A |
| Medical/surgical | N/A | N/A | N/A | N/A | N/A | N/A |
| Inpatient out-of-network | ||||||
| Mental health | -1.664 | 0.099 | 1.664 | 0.099 | N/A | N/A |
| Substance abuse | -0.924 | 0.357 | 0.924 | 0.357 | N/A | N/A |
| Medical/surgical | -3.525 | 0.001 | 3.525 | 0.001 | N/A | N/A |
| Outpatient in-network (including urgent care) | ||||||
| Mental health | 4.863 | 0.000 | -4.863 | 0.000 | N/A | N/A |
| Substance abuse | 4.391 | 0.000 | -4.391 | 0.000 | N/A | N/A |
| Medical/surgical | N/A | N/A | N/A | N/A | N/A | N/A |
| Outpatient out-of-network | ||||||
| Mental health | -1.430 | 0.155 | 1.430 | 0.155 | N/A | N/A |
| Substance abuse | -0.759 | 0.449 | 0.759 | 0.449 | N/A | N/A |
| Medical/surgical | -3.525 | 0.001 | 3.525 | 0.001 | N/A | N/A |
| Office visits in-network | ||||||
| Mental health | 4.391 | 0.000 | -4.391 | 0.000 | N/A | N/A |
| Substance abuse | 4.391 | 0.000 | -4.391 | 0.000 | N/A | N/A |
| Medical/surgical | N/A | N/A | N/A | N/A | N/A | N/A |
| Office visits out-of-network | ||||||
| Mental health | -1.308 | 0.193 | 1.308 | 0.193 | N/A | N/A |
| Substance abuse | -1.088 | 0.279 | 1.088 | 0.279 | N/A | N/A |
| Medical/surgical | -3.007 | 0.003 | 3.007 | 0.003 | N/A | N/A |
| NOTE: T-test necessarily excludes any plan with missing data. | ||||||
| TABLE E-21. Percentage of Plans with Explicitly Stated Coverage and Exclusions, by Setting/Network Status and Health Condition (Table 4-15): T-test across Health Condition Categories | ||||||||||||
|---|---|---|---|---|---|---|---|---|---|---|---|---|
| Setting/Network Status and Health Condition | 2013 Covered | 2013 Excluded | 2013 Unclear | 2014 Covered | 2014 Excluded | 2014 Unclear | ||||||
| t-value | p-value | t-value | p-value | t-value | p-value | t-value | p-value | t-value | p-value | t-value | p-value | |
| Inpatient in-network | ||||||||||||
| Mental health compared to medical/surgical | 3.478 | 0.001 | -3.478 | 0.001 | N/A | N/A | N/A | N/A | N/A | N/A | N/A | N/A |
| Substance abuse compared to medical/surgical | 3.901 | 0.000 | -3.901 | 0.000 | N/A | N/A | N/A | N/A | N/A | N/A | N/A | N/A |
| Inpatient out-of-network | ||||||||||||
| Mental health compared to medical/surgical | 1.782 | 0.078 | -1.782 | 0.078 | N/A | N/A | 0.000 | 1.000 | 0.000 | 1.000 | N/A | N/A |
| Substance abuse compared to medical/surgical | 1.782 | 0.078 | -1.782 | 0.078 | N/A | N/A | 0.000 | 1.000 | 0.000 | 1.000 | N/A | N/A |
| Outpatient in-network (including urgent care) | ||||||||||||
| Mental health compared to medical/surgical | 4.320 | 0.000 | -4.320 | 0.000 | N/A | N/A | N/A | N/A | N/A | N/A | N/A | N/A |
| Substance abuse compared to medical/surgical | 4.320 | 0.000 | -4.320 | 0.000 | N/A | N/A | N/A | N/A | N/A | N/A | N/A | N/A |
| Outpatient out-of-network | ||||||||||||
| Mental health compared to medical/surgical | 2.005 | 0.048 | -2.005 | 0.048 | N/A | N/A | 0.000 | 1.000 | 0.000 | 1.000 | N/A | N/A |
| Substance abuse compared to medical/surgical | 2.005 | 0.048 | -2.005 | 0.048 | N/A | N/A | 0.000 | 1.000 | 0.000 | 1.000 | N/A | N/A |
| Office visits in-network | ||||||||||||
| Mental health compared to medical/surgical | 3.901 | 0.000 | -3.901 | 0.000 | N/A | N/A | N/A | N/A | N/A | N/A | N/A | N/A |
| Substance abuse compared to medical/surgical | 3.901 | 0.000 | -3.901 | 0.000 | N/A | N/A | N/A | N/A | N/A | N/A | N/A | N/A |
| Office visits out-of-network | ||||||||||||
| Mental health compared to medical/surgical | 1.606 | 0.111 | -1.606 | 0.111 | N/A | N/A | 0.000 | 1.000 | 0.000 | 1.000 | N/A | N/A |
| Substance abuse compared to medical/surgical | 1.606 | 0.111 | -1.606 | 0.111 | N/A | N/A | 0.000 | 1.000 | 0.000 | 1.000 | N/A | N/A |
| NOTE: T-test necessarily excludes any plan with missing data. | ||||||||||||
| TABLE E-22. Percentage of Plans with Explicitly Stated Coverage and Exclusions, by Setting/Network Status and Health Condition (Table 4-15): T-test across Network | ||||||||||||
|---|---|---|---|---|---|---|---|---|---|---|---|---|
| Setting/Network Status and Health Condition | 2013 Covered | 2013 Excluded | 2013 Unclear | 2014 Covered | 2014 Excluded | 2014 Unclear | ||||||
| t-value | p-value | t-value | p-value | t-value | p-value | t-value | p-value | t-value | p-value | t-value | p-value | |
| Inpatient | ||||||||||||
| Mental health | 0.702 | 0.484 | -0.702 | 0.484 | N/A | N/A | 6.469 | 0.000 | -6.469 | 0.000 | N/A | N/A |
| Substance abuse | 1.085 | 0.280 | -1.085 | 0.280 | N/A | N/A | 6.675 | 0.000 | -6.675 | 0.000 | N/A | N/A |
| Medical/surgical | 2.576 | 0.011 | -2.576 | 0.011 | N/A | N/A | 6.469 | 0.000 | -6.469 | 0.000 | N/A | N/A |
| Outpatient | ||||||||||||
| Mental health | 0.000 | 1.000 | 0.000 | 1.000 | N/A | N/A | 6.469 | 0.000 | -6.469 | 0.000 | N/A | N/A |
| Substance abuse | 1.085 | 0.280 | -1.085 | 0.280 | N/A | N/A | 6.469 | 0.000 | -6.469 | 0.000 | N/A | N/A |
| Medical/surgical | 2.576 | 0.011 | -2.576 | 0.011 | N/A | N/A | 6.469 | 0.000 | -6.469 | 0.000 | N/A | N/A |
| Office visits | ||||||||||||
| Mental health | 0.876 | 0.383 | -0.876 | 0.383 | N/A | N/A | 6.884 | 0.000 | -6.884 | 0.000 | N/A | N/A |
| Substance abuse | 1.085 | 0.280 | -1.085 | 0.280 | N/A | N/A | 6.884 | 0.000 | -6.884 | 0.000 | N/A | N/A |
| Medical/surgical | 3.261 | 0.001 | -3.261 | 0.001 | N/A | N/A | 6.884 | 0.000 | -6.884 | 0.000 | N/A | N/A |
| NOTE: T-test necessarily excludes any plan with missing data. | ||||||||||||
| TABLE E-23. Percentage of Plans with Select NQTLs for Behavioral Health Care in the Inpatient Setting, 2013 and 2014 (Table 4-17): T-test across Network | ||||
|---|---|---|---|---|
| Setting | 2013 | 2014 | ||
| t-value | p-value | t-value | p-value | |
| Concurrent review | 1.134 | 0.259 | 0.000 | 1.000 |
| Preadmission notification | 0.000 | 1.000 | 0.000 | 1.000 |
| Precertification | -1.019 | 0.311 | 2.539 | 0.012 |
| Prior authorization | 1.114 | 0.267 | 2.139 | 0.034 |
| Retrospective review | N/A | N/A | 0.000 | 1.000 |
| TABLE E-24. Percentage of Plans with Select NQTLs for Behavioral Health Care in Ambulatory Settings, 2013 and 2014 (Table 4-17): T-test across Network | |||||
|---|---|---|---|---|---|
| Setting | NQTL Type | Covered | Excluded | ||
| N | Percent of Plans | N | Percent of Plans | ||
| Outpatient | Precertification | 0.000 | 1.000 | 0.498 | 0.619 |
| Outpatient | Prior authorization | 0.000 | 1.000 | 1.423 | 0.157 |
| Outpatient | Retrospective review | N/A | N/A | 0.000 | 1.000 |
| Office visit | Prior authorization | -2.700 | 0.008 | -0.288 | 0.774 |
| Office visit | Retrospective review | N/A | N/A | -0.384 | 0.701 |
| TABLE E-25. Average Co-Insurance Rate for Initial Visit, by Setting/Network Status and Health Condition (Table 4-19): T-test across 2013 and 2014 | ||
|---|---|---|
| Setting/Network Status/Health Condition | t-value | p-value |
| Inpatient in-network | ||
| Behavioral health | 0.523 | 0.603 |
| Medical/surgical | 0.663 | 0.509 |
| Inpatient out-of-network | ||
| Behavioral health | 1.082 | 0.283 |
| Medical/surgical | 1.881 | 0.064 |
| Outpatient in-network | ||
| Behavioral health | -0.418 | 0.677 |
| Medical/surgical | 0.292 | 0.771 |
| Outpatient out-of-network | ||
| Behavioral health | 1.757 | 0.083 |
| Medical/surgical | 1.881 | 0.064 |
| Office visit in-network | ||
| Behavioral health | -0.520 | 0.607 |
| Medical/surgical | 1.075 | 0.291 |
| Office visit out-of-network | ||
| Behavioral health | 0.508 | 0.613 |
| Medical/surgical | 1.563 | 0.122 |
| Emergency department | ||
| Behavioral health | 0.777 | 0.441 |
| Medical/surgical | 1.199 | 0.235 |
| Prescription drug in-network | ||
| Behavioral health | -1.517 | 0.139 |
| Medical/surgical | -1.330 | 0.193 |
| Prescription drug out-of-network | ||
| Behavioral health | -0.413 | 0.683 |
| Medical/surgical | -0.468 | 0.643 |
| TABLE E-26. Average Co-Insurance Rate for Initial Visit, by Setting/Network Status, 2013 and 2014 (Table 4-19): T-test across Health Conditions | ||||
|---|---|---|---|---|
| Setting/Network Status | 2013 | 2014 | ||
| t-value | p-value | t-value | p-value | |
| Inpatient in-network | -0.104 | 0.918 | -0.242 | 0.810 |
| Inpatient out-of-network | 0.898 | 0.372 | 0.000 | 1.000 |
| Outpatient in-network | 0.279 | 0.781 | -0.452 | 0.653 |
| Outpatient out-of-network | 0.024 | 0.981 | 0.000 | 1.000 |
| Office visit in-network | 1.032 | 0.311 | -0.471 | 0.641 |
| Office visit out-of-network | 1.389 | 0.169 | 0.277 | 0.783 |
| Emergency department | 0.095 | 0.924 | -0.219 | 0.827 |
| Prescription drug in-network | 0.350 | 0.730 | 0.179 | 0.859 |
| Prescription drug out-of-network | -0.061 | 0.952 | 0.000 | 1.000 |
| TABLE E-27. Average Co-Insurance Rate for Initial Visit, by Setting and Health Condition, 2013 and 2014 (Table 4-19): T-test across Network | ||||
|---|---|---|---|---|
| Setting/Health Condition | 2013 | 2014 | ||
| t-value | p-value | t-value | p-value | |
| Inpatient | ||||
| Behavioral health | -10.090 | 0.000 | -9.682 | 0.000 |
| Medical/surgical | -9.020 | 0.000 | -9.390 | 0.000 |
| Outpatient | ||||
| Behavioral health | -7.147 | 0.000 | -9.692 | 0.000 |
| Medical/surgical | -8.479 | 0.000 | -10.039 | 0.000 |
| Office visits | ||||
| Behavioral health | -5.087 | 0.000 | -6.821 | 0.000 |
| Medical/surgical | -7.109 | 0.000 | -5.819 | 0.000 |
| Prescription drug | ||||
| Behavioral health | -1.657 | 0.109 | -2.600 | 0.013 |
| Medical/surgical | -2.178 | 0.037 | -2.761 | 0.009 |
| TABLE E-28. Percentage of Plans in 2013 Explicitly Stating In-Network Coverage for Behavioral Health, by Setting, Behavioral Health Condition, and Type of Exchange (Figure 4-2): T-test across Marketplace Facilitation | ||||||
|---|---|---|---|---|---|---|
| Setting/Health Condition | Covered | Excluded | Unclear | |||
| t-value | p-value | t-value | p-value | t-value | p-value | |
| Inpatient | ||||||
| Mental health | -3.031 | 0.004 | 3.031 | 0.004 | N/A | N/A |
| Substance abuse | -2.634 | 0.011 | 2.634 | 0.011 | N/A | N/A |
| Medical/surgical | N/A | N/A | N/A | N/A | N/A | N/A |
| Outpatient (including urgent care) | ||||||
| Mental health | -3.964 | 0.000 | 3.964 | 0.000 | N/A | N/A |
| Substance abuse | -2.634 | 0.011 | 2.634 | 0.011 | N/A | N/A |
| Medical/surgical | N/A | N/A | N/A | N/A | N/A | N/A |
| Office visits | ||||||
| Mental health | -3.482 | 0.001 | 3.482 | 0.001 | N/A | N/A |
| Substance abuse | -2.634 | 0.011 | 2.634 | 0.011 | N/A | N/A |
| Medical/surgical | N/A | N/A | N/A | N/A | N/A | N/A |
| Emergency | ||||||
| Mental health | -3.253 | 0.002 | 3.253 | 0.002 | N/A | N/A |
| Substance abuse | -2.634 | 0.011 | 3.253 | 0.002 | -1.241 | 0.220 |
| Medical/surgical | N/A | N/A | N/A | N/A | N/A | N/A |
| Prescription drugs | ||||||
| Mental health | -1.717 | 0.092 | 1.717 | 0.092 | N/A | N/A |
| Substance abuse | -3.037 | 0.004 | 2.103 | 0.040 | 1.699 | 0.095 |
| Medical/surgical | N/A | N/A | N/A | N/A | N/A | N/A |
| NOTE: T-test necessarily excludes any plan with missing data. | ||||||
| TABLE E-29. Percentage of Plans in 2014 Explicitly In-Network Stating Coverage for Behavioral Health, by Setting/Network Status, Behavioral Health Condition, and Type of Exchange (Figure 4-3): T-test across Marketplace Facilitation | ||||||
|---|---|---|---|---|---|---|
| Setting/Health Condition | Covered | Excluded | Unclear | |||
| t-value | p-value | t-value | p-value | t-value | p-value | |
| Inpatient | ||||||
| Mental health | N/A | N/A | N/A | N/A | N/A | N/A |
| Substance abuse | N/A | N/A | N/A | N/A | N/A | N/A |
| Medical/surgical | N/A | N/A | N/A | N/A | N/A | N/A |
| Outpatient (including urgent care) | ||||||
| Mental health | N/A | N/A | N/A | N/A | N/A | N/A |
| Substance abuse | N/A | N/A | N/A | N/A | N/A | N/A |
| Medical/surgical | N/A | N/A | N/A | N/A | N/A | N/A |
| Office visits | ||||||
| Mental health | N/A | N/A | N/A | N/A | N/A | N/A |
| Substance abuse | N/A | N/A | N/A | N/A | N/A | N/A |
| Medical/surgical | N/A | N/A | N/A | N/A | N/A | N/A |
| Emergency | ||||||
| Mental health | -1.651 | 0.103 | N/A | N/A | 1.651 | 0.103 |
| Substance abuse | -1.651 | 0.103 | N/A | N/A | 1.651 | 0.103 |
| Medical/surgical | N/A | N/A | N/A | N/A | N/A | N/A |
| Prescription drugs | ||||||
| Mental health | -1.137 | 0.260 | N/A | N/A | 1.137 | 0.260 |
| Substance abuse | -1.137 | 0.260 | N/A | N/A | 1.137 | 0.260 |
| Medical/surgical | N/A | N/A | N/A | N/A | N/A | N/A |
| NOTE: T-test necessarily excludes any plan with missing data. | ||||||
| TABLE E-30. Percentage of Plans Explicitly Stating Exclusions for Health Conditions, by Year, Health Condition, and Type of Exchange (Figure 4-4): T-test across Marketplace Facilitation | ||||
|---|---|---|---|---|
| Health Condition | 2013 | 2014 | ||
| t-value | p-value | t-value | p-value | |
| Any behavioral health conditions explicitly excluded | 2.091 | 0.041 | 2.529 | 0.014 |
| Any medical/surgical conditions explicitly excluded | 1.035 | 0.305 | 1.860 | 0.067 |
| TABLE E-31. Percentage of Plans Explicitly Stating Exclusions for Health Conditions, by Year, Health Condition, and Insurance Market (Figure 4-5): T-test across Insurance Market Types | ||||
|---|---|---|---|---|
| Health Condition | 2013 | 2014 | ||
| t-value | p-value | t-value | p-value | |
| Any behavioral health conditions explicitly excluded | 1.717 | 0.091 | 2.812 | 0.006 |
| Any medical/surgical conditions explicitly excluded | 8.962 | 0.000 | 6.025 | 0.000 |
NOTES
-
See Public Law 111--148 and Public Law 111--152.
-
45 CFR §156.230.
-
Grandfathered plans are those created on or before March 23, 2010, and were exempt from a number of legislative requirements, including covering individuals with pre-existing conditions and meeting the EHB provision.
-
Vermont Department of Financial Regulation, Insurance Division Rule H-2009-03.
This report was prepared under contract #HHSP23320095651WC between the U.S. Department of Health and Human Services (HHS), Office of Disability, Aging and Long-Term Care Policy (DALTCP) and the Research Triangle Institute. For additional information about this subject, you can visit the DALTCP home page at http://aspe.hhs.gov/office-disability-aging-and-long-term-care-policy-daltcp or contact the ASPE Project Officers, Laurel Fuller and D.E.B. Potter, at HHS/ASPE/DALTCP, Room 424E, H.H. Humphrey Building, 200 Independence Avenue, S.W., Washington, D.C. 20201; Laurel.Fuller@hhs.gov.
To obtain a printed copy of these reports, send the full report title and your mailing information to:
U.S. Department of Health and Human Services
Office of Disability, Aging and Long-Term Care Policy
Room 424E, H.H. Humphrey Building
200 Independence Avenue, S.W.
Washington, D.C. 20201
FAX: 202-401-7733
Email: webmaster.DALTCP@hhs.gov