
Christopher M. Murtaugh, Ph.D., Timothy R. Peng, Ph.D., Gil A. Maduro, Ph.D., Elisabeth Simantov, Ph.D., and Thomas E. Bow, M.A., M.S.W.
Center for Home Care Policy and Research, Visiting Nurse Service of New York
"This report was prepared under contract #HHS-100-03-0011 between the U.S. Department of Health and Human Services (HHS), Office of Disability, Aging and Long-Term Care Policy (DALTCP) and the Urban Institute. For additional information about this subject, you can visit the DALTCP home page at http://aspe.hhs.gov/_/office_specific/daltcp.cfm or contact the ASPE Project Officers, William Marton and Hakan Aykan, at HHS/ASPE/DALTCP, Room 424E, H.H. Humphrey Building, 200 Independence Avenue, S.W., Washington, D.C. 20201. Their e-mail addresses are: William.Marton@hhs.gov and Hakan.Aykan@hhs.gov.
The opinions and views expressed in this report are those of the authors. They do not necessarily reflect the views of the Department of Health and Human Services, the contractor or any other funding organization.
ABSTRACT
Background and Purpose. The Outcome-Based Quality Improvement (OBQI) program provides reports to all Medicare-certified home health agencies so that they can identify potential quality problems and devise appropriate strategies to address them. There are 41 OBQI quality measures. A data-driven stepwise approach currently is used to risk adjust the OBQI indicators with a separate set of risk factors included in the risk-adjustment model for each outcome. The purpose of this project was to use a theory and evidence-based approach to develop and test alternative risk-adjustment models for the OBQI quality indicators within the frame of the existing Outcome and Assessment Information Set (OASIS) instrument.
Methods. The data analyzed in this project were obtained from the Centers for Medicare and Medicaid Services (CMS) contractor at the University of Colorado. They drew the data from the OASIS National Repository at CMS to create discrete episodes of home health care during calendar year 2001. In this project, alternative models were estimated sequentially after replicating the current risk-adjustment models. The first model was limited to the admission (or baseline) value of the outcome indicator and a core set of risk-adjusters. Subsequent models included a small number of outcome-specific risk-adjusters. Following development of a final set of alternative risk-adjustment models, an agency-level analysis was conducted to determine the impact on agencies quality ratings.
Results. The alternative models that include outcome-specific risk-adjusters typically have slightly lower explanatory power than the current models. This finding is not surprising since the stepwise approach used to develop current models is likely to result in models with close to the best explanatory power possible for the data set analyzed. The number of OASIS data items required to risk-adjust all outcomes, on the other hand, is considerably higher for the current compared with the alternative models. The agency-level analysis examined how the alternative approaches to risk-adjustment of the OBQI indicators affect an agencys quality ratings as calculated by CMS for public reporting. For most agencies and most outcomes, the adjusted proportion of patients with an outcome and the agencys ranking relative to other agencies is similar regardless of whether the current or alternative model is used to risk-adjust outcomes.
Conclusions. The results suggest that the relatively small reduction in explanatory power of most of the alternative risk-adjustment models for the OBQI indicators is unlikely to have a substantial effect on the quality ratings of the majority of agencies. A theory and evidence-based modeling approach, then, has the potential to simplify risk-adjustment and provide a consistent and stable basis for risk-adjustment relative to the current approach. This should make it more understandable to providers and encourage individual agencies to risk-adjust their own outcomes. The reliance on a smaller number of OASIS data elements, in addition, would contribute to the Departments efforts to streamline the OASIS instrument and potentially facilitate the identification of a parsimonious set of clinical measures appropriate for data exchange in an electronic health record environment.
INTRODUCTION
One of the central goals of the U.S. Department of Health and Human Services is to improve the quality of health care received by all Americans. In the home health care area, the Department has two key initiatives developed and implemented by the Centers for Medicare and Medicaid Services (CMS) to assess, improve, and report quality. The Outcome-Based Quality Improvement (OBQI) program provides reports to all Medicare-certified home health agencies so that they can identify potential quality problems and devise appropriate strategies to address them. The Home Health Quality Initiative (HHQI) uses a subset of the OBQI quality measures for public reporting. The purpose of HHQI is to provide useful information for potential home health consumers to make informed decisions when choosing a home health agency, and to provide an incentive for home health providers to improve the quality of care they provide.
The source of the data used in OBQI and HHQI is the Outcome and Assessment Information Set (OASIS). Since July 1999, home health agencies participating in the Medicare or Medicaid programs have been required to collect OASIS on all patients age 18 or older admitted to Certified Home Health Agencies. The two exceptions are persons receiving pre or postpartum maternity services and those receiving only personal care, chore or housekeeping services. OASIS data subsequently are submitted to State Survey Agencies which in turn send the data to CMS where they become part of a National Repository. The Medicare Prescription Drug, Improvement and Modernization Act of 2003 suspended OASIS requirements, beginning December 2003, for patients who are not covered by Medicare or Medicaid.
There are 41 home health quality measures in the context of the OBQI framework. They include functional, physiologic, emotional/behavioral, cognitive, and health care utilization (e.g., hospitalization) outcomes (Table 1). Currently, 30 of the 41 OBQI quality indicators are risk-adjusted when comparing outcomes for patients from one agency with outcomes for patients from all agencies in OBQI reports.1 One of the OBQI patient outcome indicators (Improvement in Pain Interfering with Activity) is risk-adjusted for public reporting in HHQI but not in OBQI reports sent to agencies.
The quality indicators are risk-adjusted so that agencies serving different types of patients can be compared. The statistical modeling approach currently used to risk-adjust these measures is a data-driven stepwise approach with a separate set of risk factors used for each OBQI measure. One potential drawback of using a stepwise approach to risk-adjustment is finding a set of adjustors that are specific to the particular data set being modeled. Since the decision to retain a variable as a predictor in a given model is driven by the data being analyzed, there is a risk of an overfit of the data. The resulting model may predict the analytic data set well, but be a poor fit when applied to future data. To at least partially address this problem, the risk-adjustment models developed by the CMS contractor at the University of Colorado were estimated on a randomly selected subsample of the overall dataset, referred to as the developmental sample. The developmental sample models then were validated by applying them to data that were set aside for this purpose. In those cases where there was a substantial discrepancy in the explanatory power of the model between the developmental and validation samples, the model was re-estimated using the developmental sample.
The purpose of this project was to develop and test alternative risk-adjustment approaches to assessing the quality of home health care. A theory and evidence-based approach was used to develop risk-adjustment models for the OBQI quality indicators. Specifically, instead of using a separate set of risk-adjusters for each OBQI quality indicator where risk-adjusters are primarily determined based on their statistical fit to the model, this project used a core set of risk-adjusters in all models that theory and prior research suggest are important determinants of home health quality. Advantages of a theory and evidence-based approach include simplicity, understandability, stability of the risk-adjustment models over time, conceptual meaningfulness, and the potential for greater parsimony in data elements when a large number of outcome indicators are being risk-adjusted, as is the case in the OBQI program.
The alternative models were developed within the framework of the uniform data collection system (OASIS) at the time of the study. A project goal was to develop alternative models that could be implemented using existing data sources and project resources limited analyses to OASIS data elements. Within this framework, clinically relevant measures that may be included in future electronic record systems were distinguished from other measures in the model-building process. We identified the relative contribution of OASIS items supplementing the core set of risk-adjusters to inform efforts to determine whether OASIS items can be excluded from the instrument without jeopardizing the explanatory power of the risk-adjustment models.
Findings from this project will contribute to CMSs future plans for continued refinement of risk-adjustment and outcome measures. They also will provide home health care providers with a better understanding of current and alternative modeling approaches for risk-adjustment of home health quality indicators. Finally, the results will support the Departments efforts to reduce regulatory burden by streamlining OASIS.
RISK-ADJUSTMENT OF HEALTH CARE QUALITY MEASURES
Risk-adjustment is a critical tool in the evaluation of health care quality. Its aim is to level the playing field so that providers serving different patients can be meaningfully compared (Johnson, 2003). Many of the risk-adjustment methods developed and implemented to date are designed to account for differences in patients health status when determining payment rates in public programs. The limited diffusion of risk-adjustment methods for assessing the quality of health care may be due to the multiple dimensions of quality, cost of appropriate data, and technical complexity of risk-adjustment methods. Blumenthal and colleagues (2005) argue that greater attention needs to be paid to simplicity, practicality and the intuitive appeal of risk-adjustment methods to increase diffusion and the effective use of this tool.
Theoretical and Conceptual Models
The most widely employed theoretical model in health services research is Andersen and Newmans conceptual framework (1973) for examining the determinants of medical care utilization. It describes the use of individual health services as a function of societal determinants (technology, norms), health system determinants (resources, organization) and individual determinants (predisposing, enabling and health status). The development of theoretical models of patient health outcomes has lagged behind although the Anderson and Newman framework can serve as a starting point for thinking about the contributors to patient outcomes.
Iezzoni (2003) recently outlined the concepts underpinning the risk-adjustment of health care outcomes, highlighting the importance of the medical meaningfulness of risk-adjusters. She lists 26 potential risk factors in the following five broad categories (page 35):
- Demographic characteristics;
- Clinical factors;
- Socioeconomic factors;
- Health-related behaviors and activities;
- Attitudes and perceptions.
Iezzoni points out that data limitations will constrain the range of potential risk-adjusters and that an a priori conceptual model of which risk factors should be in a risk-adjustment method for a given outcome is necessary to evaluate the credibility of risk-adjusted findings (page 33).
Current Approach to Risk-Adjustment of OBQI Quality Indicators
There is relatively little empirical research on the quality of home health care (Institute of Medicine, 2001). Important exceptions include the work of the team at the University of Colorado responsible for developing OBQI under contract to CMS. The method used by CMS to risk-adjust patient outcomes is logistic regression.2 The initial modeling approach involved conceptually and clinically specifying all possible risk factors that might influence the OBQI outcome from a large number of candidate risk factors derived from the OASIS instrument. The grouping of the potential risk-adjusters by OASIS content area represents a framework for thinking about contributors to patient outcomes. All but the length of stay (LOS) category fit within the five broad categories identified by Iezzoni.
A stepwise logistic regression approach is used to assess the relationship between each candidate risk factor and the outcome measure under consideration. Separate logistic regression models are used for each outcome measure and, in some cases, submodels are estimated for patients with different baseline values of the outcome indicator. For example, three sub-models are estimated when assessing Improvement in Transferring: one for patients who can transfer with minimal human assistance; one for patients who are unable to transfer by themselves but able to bear weight and pivot during the transfer process; and one for patients with higher levels of disability in transferring. Details of the risk-adjustment methodology are provided in Shaughnessy and Hittle (2002) Overview of Risk Adjustment and Outcome Measures for Home Health Agency OBQI Reports available for direct download at http://www.cms.hhs.gov/apps/hha/RiskAdj1.pdf with the risk-adjustment models for the 30 outcomes risk-adjusted in OBQI at http://www.cms.hhs.gov/apps/hha/riskadj1appa.pdf. The risk-adjustment model for Improvement in Pain Interfering with Activity (risk-adjusted in HHQI but not in OBQI reports) is at http://www.cms.hhs.gov/apps/hha/RiskModels.pdf. Risk-adjusted outcomes are reported in a recent analysis of whether home health quality changed following the introduction of the Medicare prospective payment system (Schlenker, Powell and Goodrich, 2005).
Other Empirical Research on Home Health Outcomes Using OASIS
Mathematica Policy Research (Cheh and Black, 2002), as part of Laguna Research Associates analysis of the impact of the Medicare home health interim payment system, also has analyzed home health outcomes using OASIS (or slightly modified OASIS) data. The investigators grouped OASIS items in their risk-adjusted models into the following broad categories:
- Demographic measures;
- Availability of informal care at home health admission;
- Medical conditions, symptoms and needs at home health admission;
- Prognosis at home health admission.
They also included in their models Measures of Patients Prior Service Use Before Home Health Admission derived from Medicare claims data.
Fortinsky and Madigan (1997) analyzed home health outcomes using standardized items from the transition and full OASIS data system. They used Andersen and Newmans conceptual framework for organizing their explanatory variables although only bivariate analyses were conducted.
Prior work by the project team at the Center for Home Care Policy and Research at the Visiting Nurse Service of New York includes a study conducted by Peng, Navaie-Waliser and Feldman (2003) that examined physical functioning (activities of daily living (ADLs) and instrumental activities of daily living (IADLs)), psychological functioning (anxiety and depression) and discharge outcomes among home health care patients using OASIS data. They used a subset of OASIS items as case-mix adjusters, based on Andersen and Newmans conceptual framework, with a focus on differences among patients across OASIS-derived race and ethnic categories.
Other prior work at the Center for Home Care Policy and Research has focused on the outcomes of heart failure patients. We relied on OASIS data for baseline patient measures and survey data at a uniform point in time after home health admission for outcome measures (Murtaugh et al., 2005; Feldman et al., 2005). In these studies, OASIS data at baseline were grouped into broad domains similar to those described above with key variables from each domain included as risk-adjusters in our models.
Empirical Research on Nursing Home Outcomes
There is a growing literature on risk-adjustment of nursing home quality measures. Mukamel and colleagues (2003), for example, used Minimum Data Set (MDS) information on over 45,000 residents in 671 nursing homes in New York State to develop a risk-adjusted urinary incontinence outcome measure. A large number of potential risk-adjusters was examined and goodness of fit statistics improved substantially when separate models were estimated for each of three age categories (i.e., 65-74, 75-84, and 85 and older). In earlier work, Mukamel and Brower (1998) examined the influence of three different risk-adjustment methods on conclusions about nursing home quality of care. The three methods examined were: (1) no risk-adjustment; (2) risk-adjustment using only items needed to determine nursing home payment (Resource Utilization Group, or RUGs, items); and (3) comprehensive adjustment based on patient-level risk factors. The investigators found substantial disagreement in quality ratings depending on the risk-adjustment method employed.
Reliability of OASIS Data
Item reliability is an important issue when selecting risk-adjusters. The testing of OASIS items by the team that developed OBQI at the University of Colorado is an important source of information on reliability. In addition, inter-rater reliability of the full range of OASIS items has been examined by the Center for Home Care Policy and Research of the Visiting Nurse Service of New York (Kinatukara, Rosati and Huang, 2005), and selected items have been examined by Madigan and Fortinsky (2000).
There is considerable variation among OASIS items in their inter-rater reliability as measured by the percent agreement and Cohens kappa (a measure of agreement that adjusts for the extent to which the observed agreement is due to chance). This is particularly true when reliability statistics are reported for specific categories of multi-category items rather than the average over all categories. The results from these analyses can be used to identify potential risk-adjusters that are more (or less) reliable than others as well as content areas within domains that more (or less) reliable than others.
Project Framework
The framework for selecting the core set of risk-adjusters is based on an integration of Iezzonis conceptual model, prior empirical research, and the input of a Technical Advisory Group (TAG) (see below). It is limited to patient measures although the context in which care is provided theoretically may influence patient outcomes. The specific domains and sub-domains of potential risk-adjusters are listed below and refer to patient status at the time of home health admission (or at the time of a subsequent baseline assessment) unless otherwise indicated:
- Demographic characteristics.
- Socioeconomic factors:
- Health insurance coverage;
- Housing and neighborhood characteristics;
- Familial characteristics, household composition and support/assistance in the home;
- Educational attainment and health literacy;
- Economic resources;
- Employment and occupation;
- Cultural beliefs and behaviors.
- Clinical factors:
- Clinical status before and leading up to home care admission:
- Historical use of health services,
- Prior medical conditions,
- Prior physical functioning;
- Clinical status at home care admission:
- Physiologic measures,
- Primary diagnosis and comorbidities,
- Physical functioning,
- Cognitive status,
- Mental health;
- Clinical therapies at home care admission.
- Clinical status before and leading up to home care admission:
- Health-related behaviors and activities.
- Attitudes and perceptions.
METHODS
Source of Data
OASIS, as noted above, is the source of the data used in OBQI. Agencies are required to collect OASIS at different points in time over a patients stay. The reason for an assessment is recorded on the OASIS instrument from among the following categories:
| 01 | = | Start of Care (SOC)--further visits planned |
| 02 | = | Start of Care (SOC)--no further visits planned (discontinued 12/2002) |
| 03 | = | Resumption of Care (ROC) (after inpatient stay) |
| 04 | = | Recertification (Follow-Up) assessment (every 60 days) |
| 05 | = | Other Follow-Up (when there is a significant change in patient condition) |
| 06 | = | Transferred to an Inpatient Provider--patient not discharged from agency |
| 07 | = | Transferred to an Inpatient Provider--patient discharged from agency |
| 08 | = | Death at Home |
| 09 | = | Discharged from Agency to the Community |
| 10 | = | Discharged from Agency--no visits completed after SOC/ROC assessment (discontinued 12/2002) |
There is some variation in the data items collected depending on the reason for the assessment. Baseline data for risk-adjustment and the health status quality indicators are from SOC, ROC and Other Follow-Up assessments. Data from assessment types 06-09 are used to determine changes in health status as well as utilization outcomes. OASIS is described in detail at http://www.cms.hhs.gov/oasis.
The data analyzed in this project were obtained from the CMS contractor at the University of Colorado. They drew the data from the OASIS National Repository at CMS to create discrete episodes of home health care during calendar year 2001. The file includes all episodes of care beginning and ending within the calendar year. Approximately 1,500,000 OASIS episodes are present in the overall data set. The University of Colorado randomly assigned about a third of the episodes to the developmental sample for initial estimation of risk-adjustment models for most outcomes. The remaining 1,000,000 were used to validate the final models derived from analysis of the developmental sample.
The data set contains the OBQI outcome indicators and 143 potential risk-adjusters derived from OASIS. The University of Colorado replaced any missing values for the risk-adjusters with mean values from the sample used to develop their risk-adjustment models. A technical memo documenting the creation and coding of risk factors in the current models has been written by staff at the University of Colorado and can be downloaded from http://www.cms.hhs.gov/apps/hha/riskadjappb.pdf. All of the data needed to replicate the risk-adjustment models employed in OBQI and HHQI at the time of the study were included on the files.
The project estimated preliminary models using the 143 candidate risk-adjusters developed by the University of Colorado. Following the TAG meeting (see below), a small number of potentially important risk-adjusters available on raw data files edited by the CMS contractor were requested by the project team and provided by the University of Colorado.
Analytic Methods
Analyses were conducted in two major phases (i.e., preliminary data analyses and final data analyses). Preliminary data analyses included replication of the CMS risk-adjustment models for the first set of 11 outcomes reported in HHQI and development of alternative models for these outcomes. A TAG meeting then was conducted with experts in home health care and risk-adjustment as well as policymakers and provider representatives. The TAG provided input on our initial approach based on the results of the preliminary data analyses. Following the TAG, a final set of alternative risk-adjustment models was developed for all 41 OBQI quality indicators and the impact of alternative risk-adjustment models on agency quality ratings was examined.
Logistic regression is the statistical method currently used to risk-adjust OBQI outcomes. We also used logistic regression when estimating risk-adjustment models since the purpose of the project was to replicate the existing approach and compare it with a theory and evidence-based approach to selecting risk-adjusters. An R-squared statistic and c statistic were estimated to assess the explanatory power and fit of current and alternative models.
The R-squared statistic is the squared correlation between the observed and predicted value of the dependent variable. This pseudo R-squared measure is the one estimated by the CMS contractor at the University of Colorado and included in publicly released reports describing current risk-adjustment models. While it is not equivalent to the R-squared statistic estimated in ordinary least squares regression, throughout this report we refer to increases and decreases in the R-squared statistics as changes in the explanatory power of a model. The change technically represents an increase or decrease in the extent of the agreement between observed and predicted values.
Preliminary Data Analyses
Preliminary analyses were conducted on the first set of OBQI outcomes publicly reported as part of HHQI.3 The 11 measures are:
- Improvement in ambulation/locomotion;
- Improvement in transferring;
- Improvement in toileting;
- Improvement in pain interfering with activity;
- Improvement in bathing;
- Improvement in management of oral medications;
- Improvement in upper body dressing;
- Improvement in confusion frequency;
- Stabilization in bathing;
- Admitted to an acute care hospital;
- Any emergent care provided.
Current risk-adjustment models first were replicated to ensure that the samples for each model and specifications for independent and dependent variables in initial models exactly corresponded to those used by CMS when reporting the first set of HHQI outcomes. After replicating the risk-adjustment models for the 11 outcomes (a total of 15 models since three sub-models are estimated to risk-adjust Improvement in Transferring and Improvement in Pain Interfering with Activity) a theory and evidence-based approach was used to estimate alternative models for these outcomes.
Estimation of the theory and evidence-based models proceeded sequentially. A total of six models was estimated for each outcome. We began with a model limited to a core set of clinically relevant risk-adjusters, which included the baseline value of the outcome measure if it was not already among the core variables. We then added risk-adjusters at each subsequent step in the model building process.
-
Model 1: Clinical Core. Clinically relevant core variables plus the baseline value of the outcome measure if it is not among the core variables.
-
Model 2: Outcome Specific. Addition of other clinically relevant variables plausibly influencing the specific outcome except measures of health status prior to admission.
-
Model 3: OASIS Prior Items. Addition of prior health status variables (e.g., physical functioning 14 days prior to admission). The rationale for examining prior health status variables separately is because of questions regarding their reliability and possible elimination from the OASIS instrument.
-
Model 4: Clinical Therapies. Addition of indicators of whether the patient was receiving specific therapies at baseline (i.e., oxygen therapy, IV/infusion therapy, enteral/parenteral nutrition, and ventilator). The rationale for examining therapies separately from other clinically relevant risk-adjusters is that they are qualitatively different from the demographic and clinical characteristics of individuals. In addition, these therapies are used to determine the case-mix adjusted Medicare home health payment rate and might seem to be subject to home health agency gaming. Clinical and industry experts agree, however, that these services are invasive and would not be initiated without very clear clinical indications and medical orders.
-
Model 5: Full Model including Social Support. Addition of the living arrangement and social support indicators as risk-adjusters. We refer to this model as the full model since it includes all core variables available in the data set employed in the preliminary analyses, as well as risk-adjusters specific to the individual outcomes.
-
Model 6: Length of Stay (LOS). We added to the full models a home care episode LOS measure grouped into the categories employed by the University of Colorado. The sole purpose for including the LOS categories was to allow comparison of model statistics and parameter estimates with the University of Colorado risk-adjustment models.
The statistics below were estimated for the current and each of the alternative risk-adjustment models:
-
Number of OASIS items (i.e., the number of OASIS items that are the basis for the risk-adjusters included in the model).
-
Number of OASIS elements (some OASIS items include multiple elements with each element separately assessed and marked; e.g., M0290, High Risk Factors, for which smoking, obesity, alcohol, and drug dependency are all individual indicators--or elements--within the single OASIS item).
-
R-squared statistic (technically, a pseudo R-squared statistic that measures the extent of the agreement between observed and predicted values).
-
c statistic (a measure of how well the risk-adjusters in the model correctly classify the outcome examined; a completely inaccurate model would have a c statistic of 0.5, while a completely accurate model would have a c statistic of 1.0).
Technical Advisory Group Review of Preliminary Results
A one-day TAG meeting was convened with members, including industry representatives, having expertise in home health care quality, risk-adjustment, and home health care policy. The methodology and results of the preliminary analyses were summarized and provided to the TAG in a technical memorandum prior to the meeting. TAG members also received a technical memo reviewing the current CMS method for risk-adjusting OBQI outcome measures and other relevant literature on risk-adjustment of home health care outcomes. These documents served as the starting point for discussions at the TAG meeting.
The role of the TAG was to advise the project team on the development of the alternative risk-adjustment models, in particular, to provide advice on:
- The selection of clinically and statistically sound variables from OASIS for the core set of risk factors;
- The selection of risk-adjusters specific to an outcome indicator;
- The sequential approach to model building employed in preliminary analyses;
- OASIS items to eliminate as potential risk-adjusters.
Final Data Analyses: Risk-Adjustment Models
The analytic methods for estimating a final set of alternative risk-adjustment models were very similar to those used to estimate preliminary models. First, the remaining outcomes of the current risk-adjustment models were replicated. Following refinement of the core and supplementary risk-adjusters, three sequential models were estimated for all 31 home health quality indicators currently risk-adjusted in OBQI or HHQI.
-
Model 1: Clinical Core. Clinically relevant core variables plus the baseline value of the outcome measure if it is not among the core variables.
-
Model 2: Outcome Specific. Addition of other clinically relevant variables plausibly influencing the specific outcome except measures of health status prior to admission.
-
Model 3: OASIS Prior Items. Addition of prior health status variables (e.g., physical functioning 14 days prior to admission). The rationale for examining prior health status variables separately is because of questions regarding their reliability and possible elimination from the OASIS instrument.
The decision to estimate only three sequential models (as opposed to the six estimated in the preliminary analyses) was based on the advice of the TAG and further analysis of the social support risk-adjusters following the TAG meeting. The analysis confirmed that these factors contributed relatively little to the explanatory power of risk-adjustment models (see below).
Ten of the 41 OBQI quality indicators are not currently risk-adjusted. Only a model with the clinical core (i.e., Model 1) was estimated for each of these outcomes. The model statistics listed above in the Preliminary Data Analyses section were estimated for all risk-adjustment models developed in the Final Data Analyses.
Final Data Analyses: Agency Impacts
An agency-level analysis was conducted to examine how alternative approaches to risk-adjustment of the OBQI quality indicators affect an agencys quality ratings. The agency-level analysis employed the validation data set provided by the University of Colorado with approximately 5,000 agencies included on the calendar year 2001 files. Two adjusted agency outcome rates were calculated for each of the 31 outcomes currently risk-adjusted in OBQI or HHQI. For example, an agencys adjusted rate for Improvement in Bathing (see formula below) first was estimated using the current CMS risk-adjustment model. The adjusted rate then was re-estimated using the full alternative model developed to risk-adjust Improvement in Bathing in this project (i.e., the final version of Model 3). Not all agencies have estimates for all outcomes. If an agency has fewer than 20 patients with the potential to have an outcome, that outcome is not included in agency OBQI reports or in HHQI. We followed this approach and did not estimate the adjusted outcome for an agency when there were fewer than 20 patients with the potential to have the outcome.
There were five steps in the calculation of the adjusted agency outcome rate:
-
Identify the patients at an agency with the potential to have an outcome.
-
Determine the observed percent with the outcome at each agency where at least 20 patients have the potential to have the outcome.
-
Estimate the predicted probability of the outcome at the individual level using: (1) the current risk-adjustment model, and (2) the final alternative model.
-
Calculate the average predicted probability of the outcome at each agency when the current risk-adjustment model is used, and then when the alternative model is used.
-
Adjust the agency mean so that agencies can be compared to the national average for an outcome using the formula published by the University of Colorado:
Adjusted Agency Outcome Rate = Observed Agency Outcome Rate +
(Observed National Outcome Rate - Agency Predicted Outcome Rate)
The following statistics then were estimated for each of the 31 outcomes:
-
Number and percent of agencies with the outcome (i.e., agencies with 20 or more episodes where the patient had the potential to have an outcome).
-
Mean and standard deviation of the absolute difference in the adjusted percent of patients at each agency with the outcome.
-
Percentage point difference at the 5th percentile of the distribution of differences in the adjusted percent of patients at each agency with the outcome.
-
Percentage point difference at the 95th percentile of the distribution of differences in the adjusted percent of patients at each agency with the outcome.
-
Rank of an agency based on the current risk-adjustment model (an integer number with 1 representing the best rank among all agencies).
-
Rank of an agency based on the alternative risk-adjustment model.
-
Percent of agencies with rankings that differ by two or more deciles (e.g., an agency is in the eighth decile using the current risk-adjustment method and in the sixth decile using the alternative model).
-
Simple t-test of the statistical significance of the absolute difference in the adjusted proportion of patients with the outcome.
-
Spearmans rank correlation test of the association between the two rankings of agency performance as calculated using the current versus alternative risk-adjustment models.
A sensitivity analysis subsequently was conducted to better understand the impact on agency quality ratings of the inclusion of outcome-specific and OASIS prior items in the alternative risk-adjustment models of the OBQI quality indicators. Specifically, the agency-level analysis was repeated with only the core risk-adjusters included in the alternative risk-adjustment model for each of the 31 OBQI outcomes (i.e., the final version of Model 1). The results with and without the outcome-specific and OASIS prior items as risk-adjusters then were compared.
DEVELOPMENT OF ALTERNATIVE MODELS AND RESULTS OF ANALYSES
The preliminary set of theory and evidence-based core risk-adjusters in the first phase of the project, where we focused on the original 11 HHQI outcomes, was drawn from a number of domains covered by the OASIS instrument. In selecting the core set as well as supplemental risk factors, special attention was paid to variables that are clinically relevant and suitable for inclusion in electronic health records. The preliminary set of core risk-adjusters is listed in Table 2. The only risk-adjusters that are not clinical or patient characteristics likely to be included in an electronic health record in this preliminary set are those under the Informal Support/Assistance and Living Situation sub-domains.
Preliminary Analyses
Currently, different subsets of home care patients are assessed when determining an agencys performance on each OBQI quality indicator. The three utilization outcomes are computed for all episodes except those ending in death (i.e., approximately 98% of episodes are included). For all other outcomes, two additional criteria are used to determine whether or not a given episode will be included. First, the episode must end in discharge to the community (approximately 70% of episodes), because the endpoint measures used to calculate improvement or stabilization on the non-utilization outcomes are collected only on the more comprehensive assessment made for those patients discharged to the community. Second, the start of care (SOC) assessment item for the outcome must permit the patient to have the potential to have the outcome. OBQI health status improvement measures are binary indicators of whether the patients status at discharge is better than at baseline. Individuals who cannot improve because they do not have any deficit in the quality indicator at baseline are excluded from estimates of improvement. OBQI health status stabilization measures are binary indicators of whether the patients status at discharge is the same or better than at baseline. Individuals who cannot deteriorate because they are in the worst category of the quality indicator at baseline are excluded from stabilization estimates.
The initial developmental sample from which the University of Colorado identified individuals with the potential to have an outcome is 125,000 episodes. However, the developmental sample was supplemented by the University of Colorado for four of the 11 HHQI outcomes due to low numbers of episodes where patients had the potential to have the outcome. The developmental sample was 250,000 episodes for Improvement in Upper Body Dressing, Improvement in Transferring, and Improvement in Oral Medications, and approximately 350,000 episodes for Improvement in Confusion.
Respecification of Core Risk-Adjustors
After replicating the risk-adjustment models developed by the University of Colorado, alternative models were estimated using exactly the same coding of risk-adjusters as in current models with two exceptions where theory or prior evidence suggested other codings were likely to be more meaningful. Instead of a continuous measure of the age of the home care patient, four categories were specified: <65; 65 to <75 (reference category); 75 to < 85; 85 or older. The other change was the creation of a single numeric scale from the individual OASIS ADL and IADL measures at baseline. Spector and Fleishman (1998) examined the psychometric properties of ADLs and IADLs and concluded that they represent a single construct. We approximated the scale developed by Spector and Fleishman by classifying persons as either independent or dependent on human help to complete each ADL and IADL. The scale is a simple count of the number of ADLs and IADLs that the patient needs human help to complete. It ranges from 0 to 14.
After initial models were estimated, we examined the direction and consistency of the effect of the core risk-adjusters across the 11 HHQI quality indicator outcome models. A number of the original risk-adjusters were integer scales that did not appear to be linearly related to the HHQI quality indicators and/or the effect on the outcome measures was the opposite of what would be expected.
-
Hearing impairment was dropped from the core set of measures because of inconsistent effects and limited conceptual importance.
-
Vision impairment was respecified into two dummy variables with a reference category of no impairment.
-
Speech impairment was grouped into four categories with no speech impairment as the reference category and a top category that combined levels 3, 4 and 5.
-
The original depression measure is a count of depressive symptoms, ranging from 0 to 5, which is highly skewed toward no symptoms; it was respecified as two dummy variables (i.e., 1 symptom only, 2 or more symptoms) with a reference category of no symptoms.
-
A set of mutually exclusive indicators was created to measure frequency of urinary incontinence (during the night, during the day, night and day, and urinary catheter present) with a reference category of no incontinence.
-
A set of mutually exclusive categorical variables was created for bowel incontinence similar to those created for urinary incontinence.
-
A set of mutually exclusive categorical variables was created to indicate the type of help provided by the primary caregiver (i.e., the primary caregiver provides help with ADLs (with or without providing help with IADLs), help with IADLs only, or some other type of help) with a reference category of no primary caregiver.
We also categorized dyspnea which was included in the risk-adjustment models of the ADL outcomes. The original integer scale was not linearly related to these outcomes. In some models of ADL outcomes, the direction of the effect of dyspnea was positive, suggesting improvement in ADL outcomes as the level of impairment increased (although generally decreasing in magnitude as impairment level increased). In other models the effect of higher levels of impairment on ADL outcomes was negative although never statistically significant. Despite its unexpected and inconsistent effects, we left dyspnea in the preliminary alternative risk-adjustment models for ADLs because of its conceptual importance. Dyspnea did have the expected effect on the utilization outcomes, with the probability of Emergent Care and Acute Care Hospitalization rising as the severity of dyspnea increased.
Respecification of Baseline and Prior Values of Outcome Indicators
The baseline and prior values of the outcome indicators were treated as continuous variables, following the approach of the University of Colorado, in our initial analyses. Higher values always represent a sicker state. Subsequently, these indicators were respecified as categorical variables to test the assumption that baseline and prior variables are linearly related to the outcome indicators. The respecification improved the explanatory power of the risk-adjustment models--in a few cases, substantially.
Summary of Preliminary Modeling Results
Six models were estimated for each outcome. We began with a model limited to the core set of clinical, demographic and payment risk-adjusters, including the baseline value of the outcome measure if it was not already among the core variables. Outcome-specific risk-adjusters were added at subsequent steps: Model 2 included other clinical characteristics at baseline that might plausibly affect the outcome, and Model 3 included measures of clinical status prior to home health admission. Four clinical therapies at baseline (i.e., oxygen therapy, IV/infusion therapy, enteral/parenteral nutrition, and ventilator) then were added to the risk-adjustment models for all 11 outcomes (Model 4). The living arrangements and social support indicators subsequently were added to all models (Model 5). Finally, LOS was added solely to allow comparison of current and alternative model statistics and parameter estimates.
By Model 3 (i.e., after the addition of the prior health status measures) the risk-adjustment models developed in the preliminary analyses generally approached but did not exceed the explanatory power of the HHQI risk-adjustment models developed by the University of Colorado. The effect of the measures of health status prior to admission on the explanatory power of the risk-adjustment models varied depending on the outcome indicator. They had a modest effect in the improvement in ADL models as well as the one improvement in an IADL model (i.e., Improvement in Management of Oral Medication). Prior health status risk-adjusters had virtually no effect in the remaining models of health status outcomes and were not included in the risk-adjustment models of the two utilization outcomes.
The social support indicators, while conceptually important, added almost nothing to the explanatory power of risk-adjustment models that already included clinically relevant variables. The one exception was the Improvement in Oral Medication risk-adjustment model where there was a one percentage point increase in the R-squared statistic after the addition of the core social support measures and a statistically significantly improvement in the fit of the model (p < 0.001).
The generally lower explanatory power of the preliminary alternative models is not surprising since the stepwise logistic regression technique used to develop the current models is likely to result in models with close to the best explanatory power possible for the data set analyzed. In addition, the exclusion of LOS from the alternative models, because it can be affected by the quality of care provided and therefore is not an appropriate risk-adjuster, results in a reduced R-squared value for the alternative utilization outcome models relative to the current models.
Whether the alternative models are more parsimonious than the University of Colorado models depends on whether the models are considered individually or all 11 are considered together. Only two of the preliminary risk-adjustment models were more parsimonious than the corresponding models developed by the University of Colorado to risk-adjust the 11 initial HHQI outcome indicators. The total number of OASIS items and elements used to risk-adjust all 11 HHQI outcome indicators, however, was smaller.
Technical Advisory Group (TAG) Meeting
A TAG meeting was conducted in Washington, DC, on August 20, 2004. Members of the TAG, which included industry representatives, were experts in home health care quality, risk-adjustment, and home health policy. The TAG made a number of comments and recommendations based on a review of preliminary analysis results and other background documents.
Strong support was expressed for identifying a core set of risk-adjusters (for statistical reasons as well as for face validity and interpretation of risk-adjustment models). TAG members agreed that the original file of risk-adjusters obtained from the University of Colorado had some limitations and that additional OASIS data should be requested to allow further development of three types of risk-adjusters: diagnoses, social support, and payer. Diagnoses were aggregated into broad body system categories on the original file. With the specific diagnosis information collected on OASIS, it will be possible to specify diagnoses that occur frequently in the home care population (e.g., diabetes) as well as conceptually important medical conditions. It was pointed out that some important diagnoses typically are recorded as secondary, not primary, diagnoses (e.g., multiple sclerosis) and that diagnosis risk-adjusters should take OASIS secondary diagnoses into account.
The TAG also recommended further examination of living arrangement and social support risk-adjusters after the original OASIS variables are obtained because of their high face validity for clinicians. There was a discussion about more detailed living arrangement data and whether knowing that the patient lives with his or her spouse, as opposed to other family members, is likely to perform better as a risk-adjuster. TAG members pointed out that it is possible that too much assistance could delay improvement in some activities. Also, it was suggested that the project team think about whether it is possible to identify spouses who can help with care versus those who cannot or who may require their own care.
There was a discussion of the original payer data (M0150) as well. Medicaid as a payer is to some extent an indicator of economic status. It also is likely to be an indicator of more permanent disability and/or chronic disease. One of the industry experts also suggested that agency staff completing OASIS assessments tend to check Medicare as a payer if there is any chance that the episode might be billed to Medicare. A very large share of episodes (greater than 94%) on the file obtained from the University of Colorado report Medicare as a payer. In addition to home health agency coding practices, this is partly due to the way episodes of home health care are selected for OBQI outcome analysis. All episodes must start and finish in the calendar year. This eliminates many long episodes that are more likely to have Medicaid as the payer including episodes where home health was provided the entire year but admission and discharge are outside the calendar year.
The rationale for examining the baseline therapy measures (i.e., oxygen therapy, IV/infusion therapy, enteral/parenteral nutrition, and ventilator) separately from other clinically relevant risk-adjusters was discussed by the TAG. The risk-adjustment experts agreed that it generally is a bad idea to include actual services in payment or outcome risk-adjustment models since it may encourage inappropriate use of the services. The clinical and industry experts, however, pointed out that these services were invasive and would not be initiated without very clear clinical indications and medical orders. These measures generally had little impact on the explanatory power of the 11 HHQI risk-adjustment models but may be appropriate as outcome-specific risk-adjusters in some cases.
One TAG member indicated that sensory measures (e.g., vision, speech) tend to vary in their relationship with outcomes and that the project team may want to consider dropping them from the core set of risk-adjusters and including them as outcome-specific risk-adjusters when appropriate. It also was suggested that Life Expectancy be dropped from consideration since agencies questioned its reliability and it is unclear whether it will be included in future versions of OASIS.
Overall, there was agreement that the sequential model building approach used by the project team was logical. There also was agreement that LOS should not be included as a risk-adjuster. Members of the TAG also agreed that agency-level analyses are an important part of the assessment of differences between current and alternative risk-adjustment models.
Final Data Analyses: Risk-Adjustment Models
Development of Final Set of Core and Supplemental Risk-Adjusters
The selection of the final set of core risk-adjusters was based on findings from the preliminary analyses, comments of TAG members, and examination of a small number of additional OASIS items provided by the University of Colorado following the TAG meeting. The analyses conducted after receipt of additional OASIS data included respecification of the Living Situation and Informal Support/Assistance risk-adjusters. Specifically, alternative specifications were explored utilizing the more detailed data on living arrangements (with the lives with spouse/family category in initial models separated into two categories) and the person providing assistance.
The additional data and respecification, however, did not substantially affect the contribution of the living situation and informal support/assistance measures to the explanatory power of the HHQI risk-adjustment models that already included demographic, payer and clinical measures. The one exception is the risk-adjustment model for Improvement in Medication Management. When the living arrangement and social support measures were added to a model with demographic, payer and clinical measures (i.e., added to Model 3), the R-squared statistic increased from 15.7% to 16.7%. These conceptually important measures were excluded from the alternative models because of the limited contribution to the explanatory power of the risk-adjustment models.
Table 3 lists the final set of core risk-adjusters in the alternative models along with their specification. A total of 43 OASIS items were used to construct the core risk-adjusters. The demographic and insurance measures clearly are likely to be included in electronic health records and the remaining items are all clinically relevant. The one core risk-adjuster that varies from model to model is the baseline value of the outcome indicator. The baseline value, specified as a categorical variable, tends to make a relatively large contribution to the explanatory power of risk-adjustment models. It appears to be adjusting for differences in the probability of improving (or stabilizing) related to the number of levels of the OASIS item.
Risk-adjusters specific to each outcome, other than measures of health status prior to admission, are listed in Tables 4a-4d. They are reported by domain of the outcome indicator (e.g., Table 4a lists the risk-adjusters specific to ADL outcome models). Some items are common to all risk-adjustment models within a domain. For example, obesity is included in the risk-adjustment models of all ADL outcomes. Other items are specific to a single outcome. For example, whether a patient smokes is specific to the Improvement in Dyspnea risk-adjustment model. Generally, 2-3 outcome-specific items were added to each risk-adjustment model. All of these items are clinical factors.
Tables 5a-5d list the measures of clinical status prior to home health admission that were added to the risk-adjustment models of selected OBQI outcomes. As noted above, these OASIS items were examined separately from other outcome-specific risk-adjusters because of questions about their reliability and possible elimination from the OASIS instrument. There were no directly related, conceptually important prior health status risk-adjusters used for four OBQI outcomes (i.e., Improvement in Dyspnea and the three utilization outcomes).
Comparison of Current and Alternative Models
The OBQI quality indicators are grouped into six broad domains by the University of Colorado: (1) ADLs, (2) IADLs, (3) Physiologic indicators, (4) Emotional/Behavioral measures, (5) Cognitive measures, and (6) Utilization Outcomes (see Table 1). We first present results from all models and then by domain. The models developed by the University of Colorado are referred to as the current models; the two final alternative models are referred to as the core alternative model (which includes only core risk-adjusters) and the full alternative model (i.e., Model 3 which includes outcome specific and prior OASIS items, or Model 2 where there are no relevant prior items).
The full alternative models typically have slightly lower explanatory power than the current risk-adjustment models. Specifically, the R-squared statistic for the full model tends to be within 1-2 percentage points of the R-squared statistic for the model developed by the University of Colorado. There is a similar pattern for the c statistic. While the number of OASIS items and elements is sometimes larger and sometimes smaller for the alternative models compared with current models, the overall number of OASIS items and elements employed when risk-adjusting all 31 OBQI outcome indicators is considerably smaller for the full alternative models (64 versus 88 OASIS items, and 93 versus 135 OASIS elements).
ADL and IADL Outcomes. The ADL and IADL outcomes represent 23 of the 41 OBQI quality indicators and over two-thirds of the 31 outcome indicators currently risk-adjusted by the University of Colorado. The performance (i.e., explanatory power as measured by the R-squared statistic) of the alternative and current risk-adjustment models for ADL and IADL outcomes is presented graphically in Figure 1 and Figure 2. Table 6a and Table 7a summarize the model statistics for all ADL and IADL outcome models, respectively, and Table 6b and Table 7b present the detailed regression results for the full alternative models estimated for the 23 ADL and IADL outcomes.4
As previously discussed, most of the full alternative ADL and IADL models have slightly lower explanatory power than the current models. This is not surprising since a stepwise approach was used to develop the current models. An exception is the alternative risk-adjustment model for the Improvement in Ambulation outcome where the R-squared statistic is more than six percentage points greater than the R-squared statistic for the current model. The ADL and IADL stabilization outcomes, it should be noted, are highly skewed (i.e., a very high proportion of those potentially able to stabilize do stabilize). This may explain the relatively low R-squared and relatively high c statistics for both current and alternative models.
The outcome-specific risk-adjusters generally contribute very little to the explanatory power of the ADL and IADL risk-adjustment models that already include the core risk-adjusters. In contrast, the prior OASIS items contribute substantially to the explanatory power (roughly two percentage points to the R-squared statistic) of almost all of the risk-adjustment models of improvement in ADLs and IADLs, but not stabilization in ADLs and IADLs. There is a similar pattern for c statistics.
Physiologic Outcomes. Figure 3 graphically presents the performance of the alternative and current risk-adjustment models for the five physiologic outcomes currently risk-adjusted in OBQI. Table 8a summarizes the model statistics for all physiologic outcome models and Table 8b presents the detailed regression results for the full alternative models estimated for the five physiologic outcomes that are currently risk-adjusted, and the alternative models with only core risk-adjusters for the four that are not currently risk-adjusted in OBQI.
The outcome-specific risk-adjusters tend to make a slightly greater contribution to the explanatory power of the physiologic outcome models compared to ADL and IADL outcome models. The effect of the prior OASIS items, on the other hand, is modest. Among the physiologic outcomes, the full alternative risk-adjustment model for Improvement in UTI performs considerably worse than the current UTI risk-adjustment model. The R-squared statistic for Model 3 is 5.9% compared to 12.1% for the current model, and corresponding c statistics are 0.665 and 0.740 (see Table 8a). The main reason for this difference is the exclusion of home health episode LOS from the alternative model.
Emotional/Behavioral Outcomes. None of the emotional/behavioral outcomes currently is risk-adjusted in OBQI. Only Model 1 (i.e., the model including only the core risk-adjusters) was estimated for outcomes that are not currently risk-adjusted. The model statistics for the alternative models for the three emotional/behavioral outcomes are reported in Table 9a. The detailed regression results for the final alternative models estimated for the emotional/behavioral outcomes are presented in Table 9b. The R-squared and c statistics for all three models are low.
Cognitive Outcomes. There are three cognitive outcomes in OBQI but currently only Improvement in Confusion Frequency is risk-adjusted. The right-most bar in Figure 3 graphically presents the performance of the alternative and current risk-adjustment models for Improvement in Confusion Frequency. Neither the outcome-specific nor the prior OASIS items contribute substantially to the explanatory power of the Improvement in Confusion Frequency model that already includes the core risk-adjusters. Table 10a summarizes the model statistics for all cognitive outcome models. Table 10b presents the detailed regression results for the full alternative model estimated for Improvement in Confusion Frequency as well as the alternative models with only core risk-adjusters for the two cognitive outcomes that are not currently risk-adjusted in OBQI. The R-squared and c statistics for all models are relatively low although the c statistic for the Stabilization in Cognitive Functioning risk-adjustment model that includes only the core risk-adjusters is 0.738 indicating adequate ability to predict what is a highly skewed outcome (i.e., over 90% of individuals who could stabilize did stabilize).
Utilization Outcomes. Figure 4 graphically presents the performance of the alternative and current risk-adjustment models for the three utilization outcomes (all three are risk-adjusted in OBQI). Table 11a summarizes the model statistics for all current and alternative utilization outcome models and Table 11b presents the detailed regression results for the full alternative models estimated for the utilization outcomes.
Two of the three outcome-specific variables at baseline (Dyspnea and IV/Infusion therapy) are highly statistically significant in the final, full risk-adjustment models for all three utilization outcomes (p < 0.001). Nevertheless, the outcome-specific variables as a group have only a very small effect on the explanatory power of the risk-adjustment models for the utilization outcomes. When added to models already including the core risk-adjusters, the R-squared and c statistics increase by at most roughly half a percentage point or 0.005, respectively. No prior OASIS items were included in the alternative models for these outcomes. As noted previously, the exclusion of LOS reduces the explanatory power of the alternative models for the utilization outcomes.
Comparison of Overall Number of OASIS Items and Elements Used in Risk-Adjustment
The overall number of OASIS items used in current and alternative risk-adjustment models (out of a total of 95 M0 items) is graphically presented in Figure 5. The core OASIS items in the alternative models are in the lower left-hand corner shaded in the darkest color. On the diagonal (in the next darkest shade) are the OASIS outcome specific and prior items included in the full alternative models (i.e., Model 3 for the outcomes with prior OASIS items and Model 2 where there are no relevant prior items). The OASIS items for the additional variables used in one or more of the current risk-adjustment models but not in the alternative models are in the next darkest shade. Sixty-four OASIS items were used to construct the risk-adjusters included in one or more of the full alternative models, compared to 88 for the current models developed by the University of Colorado. There are seven OASIS items that are not used in either the current or alternative models (unshaded in the upper-right-hand corner of Figure 5). The M0 items used for case-mix classification in the Medicare prospective payment system are in bold with an asterisk.
Some OASIS items include multiple elements with each element separately assessed and marked (i.e., the OASIS items with instructions to mark all categories that apply). The OASIS elements used in current and alternative risk-adjustment models are graphically presented in Figure 6 in the same manner as the OASIS items in Figure 5. There are a total of 180 OASIS elements with 93 used to construct the risk-adjusters in the full alternative models compared to 135 in the models developed by the University of Colorado. All OASIS elements in the alternative risk-adjustment models also are used in current models with two exceptions: the Current Payer elements Medicaid traditional fee-for-service (M0150_3) and Medicaid HMO/managed care (M0150_4), both of which are highlighted on the left side of Figure 6. The M0 elements used for case-mix classification in the Medicare prospective payment system are in bold with an asterisk.
Final Data Analyses: Agency Impacts
The results of the agency analyses are reported by outcome domain in Tables 12-16. Overall, the results suggest that the quality ratings for most agencies and most outcomes are similar regardless of whether the current or alternative full model is used to risk-adjust outcomes. The difference tends to be minimal (no more than one to two percentage points) between the current and alternative risk-adjusted percent of an agencys patients with each outcome (see Figure 7). For a small share of agencies (i.e., those below the 5th or above the 95th percentile of the distribution), however, differences exceed four percentage points for Improvement in Ambulation, Improvement in Light Meal Preparation, Improvement in UTI, Acute Care Hospitalization, and Discharge to the Community (see columns 3 and 4 of Tables 12-16).
The average of the differences at each agency is greatest for Discharge to the Community (0.374 percentage points) followed by Improvement in UTI (0.287 percentage points). In the case of the UTI outcome, the average percent of patients improving at each agency was 83.7% when estimated using the current risk-adjustment model and 83.9% when estimated using the alternative full model. Despite the very small size of average differences, they often are statistically significant because sample sizes tend to be large, ranging from a low of 771 agencies when comparing the risk-adjusted Improvement in UTI outcomes, to 4,798 agencies in analyses of the percent of patients with an Acute Care Hospitalization.
While the magnitude of the difference between outcome estimates using the two risk-adjustment approaches is important, it is the ranking of each agency relative to others that is likely to be of most concern to providers. The next-to-the-last column in Tables 12-16 reports estimates of Spearmans rank correlation coefficient. These correlation coefficients are presented graphically in Figure 8. A value of one would indicate that rankings are exactly the same. For most outcomes, in fact, the correlation coefficient is close to one (i.e., it is above 0.950). The two lowest correlation coefficients are 0.912 for Improvement in UTI and 0.925 for Improvement in Ambulation.
The final column of each of the agency-level analysis tables reports the number and percent of agencies that change two or more deciles in rank when the risk-adjustment method is changed. (An agency, for example, would have to decline from the top decile--or top 10% in ranking--to the third decile or lower to be identified as changing two or more deciles.) The outcomes with the greatest number of agencies shifting at least two deciles in rank, not surprisingly, are those with the lowest Spearmans rank correlation coefficient. Among the agencies analyzed, 20.1% shifted two or more deciles in their Improvement in UTI ranking while 17.3% changed two or more deciles in their Improvement in Ambulation ranking.
Agency quality rankings differ the most where the difference in the explanatory power of the current and alternative risk-adjustment models is substantial. In the case of Improvement in Ambulation, the alternative risk-adjustment model explains considerably more of the variation in the outcome than the current model. It is the reverse for the Improvement in UTI outcome where the current model includes LOS among the risk-adjusters. Agency quality rankings for the utilization outcomes do not differ as much as might be expected given the exclusion of LOS from the alternative models and, as a result, the lower explanatory power of alternative versus current risk-adjustment models.
A sensitivity analysis then was conducted to better understand the impact on agency quality ratings of the inclusion of outcome-specific and OASIS prior items in the alternative risk-adjustment models of the OBQI quality indicators. Specifically, agency-level analyses were repeated with only the core risk-adjusters included in the alternative risk-adjustment models (i.e., the final version of Model 1 for each of the 31 currently risk-adjusted OBQI outcomes). The results of the sensitivity analysis are presented graphically in Figure 9 and Figure 10. The basic pattern of impacts is the same but, as expected, the difference in risk-adjusted outcomes using the current and alternative approaches increases (to between one and three percentage points for most agencies on almost all outcomes). For almost a third of the outcomes the Spearman rank correlation coefficient now is in the 0.900-0.950 range with the correlation coefficient for Improvement in Ambulation falling slightly below 0.900.
Finally, it is important to note that for many OBQI outcomes a relatively large number of agencies had fewer than 20 patients in the analytic sample with the potential to have the outcome. These agencies, therefore, were excluded when examining the impact of the alternative approaches to risk-adjustment on the percent of patients with the outcome. The number of agencies excluded is particularly large for two outcomes. All but 14.7% of agencies were excluded when examining the impact of alternative risk-adjustment approaches on estimates of Improvement in UTI and all but 19.5% were excluded when examining the impact on estimates of Improvement in Bowel Incontinence.
CONCLUSIONS AND IMPLICATIONS
The purpose of this project was to develop and test alternative risk-adjustment approaches to assessing the quality of home health care. A data-driven stepwise approach currently is used to risk-adjust OBQI quality indicators with a separate set of risk-adjusters in each outcome model. In this project, a theory and evidence-based approach was used to develop alternative risk-adjustment models for the OBQI quality indicators. Advantages of a theory and evidence-based approach include simplicity, understandability, stability of the risk-adjustment models over time, conceptual meaningfulness, and the potential for greater parsimony in data elements when a large number of outcome indicators are being risk-adjusted as is the case in the OBQI program.
The alternative models were developed within the framework of the uniform data collection system (OASIS) in place at the time of the study. A project goal was to develop alternative models that could be implemented using existing data sources and project resources limited analyses to OASIS data elements. The examination of alternative risk-adjusters developed from other data sources (e.g., Medicare claims) is an important area of future research.
Based on theory and prior empirical research, a core set of risk-adjusters was identified from among the content areas covered by OASIS. These core items were included in the risk-adjustment models for all outcomes. A small number of outcome-specific risk-adjusters then was added to each model. The outcome-specific risk-adjusters are OASIS measures of patient status on admission, as well as status prior to admission, plausibly related to a specific outcome or outcome domain.
At the time of this study, 31 of the 41 OBQI quality indicators were risk-adjusted in either OBQI or HHQI. The analysis focused on a comparison of the current and alternative models for these 31 outcomes. In particular, it focused on statistics that measure how well a model predicts an outcome, as well as the number of OASIS items and elements needed to construct the risk-adjusters. While the OBQI quality indicators represent six broad health and functional domains, 22 of the 31 risk-adjusted outcomes (over 70%) are ADL or IADL outcomes.
There are important tradeoffs and differences between the current and alternative approaches to risk-adjusting OBQI quality indicators. The first is the generally higher explanatory power of the current models versus the simplicity of the alternative models and their overall reliance on a smaller number of OASIS items and elements. That current models generally have marginally better explanatory power than the alternative models is not surprising since the stepwise approach is likely to result in models with close to the best explanatory power possible for the data set analyzed. At the same time, however, it leads to the selection of a large number of risk factors when all outcome measures are considered. In addition, because the stepwise approach fits models to the data on which they are developed, the explanatory power of these models is likely to decline when they are applied to new data sets.
A second tradeoff is between the full alternative models that include the outcome-specific risk-adjusters and alternative models with only the core set of risk-adjusters. The latter tend not to predict outcomes as well as the full models. Measures of physical functioning prior to home health admission are particularly significant in the risk-adjustment models of ADL and IADL improvement. The prior OASIS items, however, are more difficult than many other items for home health agencies to collect and are thought to be less reliable than other clinical measures. Should they be dropped from the OASIS instrument, the explanatory power of the risk-adjustment models for most ADL and IADL improvement models would be reduced roughly two percentage points.
The decision to exclude home health LOS from the alternative models, in addition, has a significant impact on the risk-adjustment models for the small but important subset of utilization outcomes. LOS was excluded because it can be affected by problems in the care process that also affect outcomes (i.e., low quality care can cause a longer stay as well as worse outcomes). If LOS is included in risk-adjustment models, conclusions about the quality of agency care could be erroneous due to quality problems being risk-adjusted away. The TAG convened to review preliminary models developed by the project team strongly supported the decision to exclude LOS from risk-adjustment models. The consequence, however, is reduced explanatory power for a small number of outcomes. A possible methodological solution, which has data burden and simplicity implications, is to collect information on the timing of all of the utilization outcomes (e.g., hospitalization) and estimate hazard models that take into account the time to the outcome of interest.
Our agency-level analysis examined how the alternative approaches to risk-adjustment of the OBQI indicators affect an agencys quality ratings as currently calculated by CMS. For most agencies and most outcomes the adjusted proportion of patients with an outcome is similar regardless of whether the current or the full alternative model is used to risk-adjust outcomes. Of greater potential concern to providers, however, is the ranking of each agency relative to others, irrespective of the size of the difference in risk-adjusted outcomes. Our analysis found that the ranking of agencies using current risk-adjustment models and the ranking using the full alternative risk-adjustment models are in close agreement for most outcomes.
The agency-level analyses were repeated using only the core risk-adjusters in the alternative risk-adjustment models. This was done in order to better understand the contribution of the outcome-specific and OASIS prior items to the finding of similar quality ratings regardless of risk-adjustment approach. The basic results hold. However, as would be expected, the quality ratings are not as close when outcome-specific and OASIS prior items are dropped from the alternative risk-adjustment models of the OBQI indicators.
One limitation of the agency analysis is that for some outcomes a relatively large share of agencies was excluded because they had too few patients with the potential to have the outcome (i.e., less than 20). Nevertheless, the results suggest that the relatively small reduction in explanatory power of most of the alternative risk-adjustment models is unlikely to have an effect on the ranking of the majority of agencies on OBQI quality indicators.
Overall, a theory and evidence-based modeling approach has the potential to simplify risk-adjustment and provide a consistent and stable basis for risk-adjustment relative to the current approach. This should make it more understandable to providers and encourage individual agencies to risk-adjust their own outcomes. The reliance on a smaller number of OASIS data elements, in addition, would contribute to the Departments efforts to streamline the OASIS instrument and potentially facilitate the identification of a parsimonious set of clinical measures appropriate for data exchange in an electronic health record environment.
REFERENCES
Andersen, R. & Newman, J.F. (1973). Societal and individual determinants of medical care utilization in the United States. The Milbank Quarterly, 51, 95-124.
Blumenthal, D., Weissman, J.S., Wachterman, M., Weil, E., Stafford, R.S., Perrin, J.M., Ferris, T.G., Kuhlthau, K., Kaushal, R., & Iezzoni, L.I. (2005). The who, what, and why of risk adjustment: A technology on the cusp of adoption. Journal of Health Politics, Policy and Law, 30(3), 453-473.
Cheh, V., & Black, W. (2002). Did the balanced budget agreement of 1997 affect the quality of Medicare home health services? Final report (MPR Reference No. 8635-500). Princeton, NJ: Mathematica Policy Research, Inc.
Feldman, P.H., Murtaugh, C.M., Pezzin, L.E., McDonald, M.V., & Peng, T.R. (2005). Just-in-time evidence-based e-mail "reminders" in home health care: Impact on patient outcomes. Health Services Research, 40(3), 865-885.
Fortinsky, R.H., & Madigan, E.A. (1997). Home care resource consumption and patient outcomes: What are the relationships? Home Health Care Services Quarterly, 16(3), 55-73.
Iezzoni, L.I. (Ed.). (2003). Risk adjustment for measuring health care outcomes (3rd ed.). Chicago, IL: Health Administration Press.
Institute of Medicine. (2001). Improving the quality of long-term care (G.S. Wunderlich, & P. Kohler, Eds.). Washington, DC: National Academy Press.
Johnson, M.L. (2003). Risk assessment and adjustment: Adjustment for sick patients or a sick system? Medical Care, 41(1), 4-7.
Kinatukara, S., Rosati, R.J., & Huang, L. (2005). Assessment of OASIS reliability and validity using several methodological approaches. Home Health Care Services Quarterly, 24(3), 23-38.
Kramer, A.M., Shaughnessy, P.W., Bauman, M.K., & Crisler, K.S. (1990). Assessing and assuring the quality of home health care: A conceptual framework. The Milbank Quarterly, 68(3), 413-443.
Madigan, E.A., & Fortinsky, R.H. (2000). Additional psychometric evaluation of the outcomes and assessment information set (OASIS). Home Health Care Services Quarterly, 18(4), 49-62.
Mukamel, D.B., & Brower, C.A. (1998). The influence of risk adjustment methods on conclusions about quality of care in nursing homes based on outcome measures. The Gerontologist, 38(6), 695-703.
Mukamel, D.B., Watson, N.M., Meng, H., & Spector, W.D. (2003). Development of a risk-adjusted urinary incontinence outcome measure of quality for nursing homes. Medical Care, 41(4), 467-478.
Murtaugh, C.M., Pezzin, L.E., McDonald, M.V., Feldman, P.H., & Peng, T.R. (2005). Just-in-time evidence-based e-mail "reminders" in home health care: Impact on nurse practices. Health Services Research, 40(3), 849-864.
Peng, T.R., Navaie-Waliser, M., & Feldman, P.H. (2003). Social support, home health service use, and outcomes among four racial/ethnic groups. The Gerontologist, 43(4), 503-513.
Schlenker, R.E., Powell, M.C., & Goodrich, G.K. (2005). Initial home health outcomes under prospective payment. Health Services Research, 40(1), 177-193.
Spector, W.D., & Fleishman, J.A. (1998). Combining activities of daily living with instrumental activities of daily living to measure functional disability. Journal of Gerontology: Social Sciences, 53B(1), S46-S57.
NOTES
-
Because of data constraints and methodological issues, 11 outcomes are not risk-adjusted. CMS is planning to address these constraints and issues so that these outcomes will be either risk-adjusted or modified so risk-adjustment is possible.
-
CMS has tested several other risk-adjustment methods (e.g., multivariate standardization, discriminant function analysis, the classification and regression tree methodology). Logistic regression was determined to have several advantages over these methods, and thus, adopted for use.
-
As of September 1, 2005, four of the initial 11 HHQI indicators were dropped from public reporting (i.e., Improvement in Toileting, Improvement in Upper Body Dressing, Improvement in Confusion Frequency, and Stabilization in Bathing). They were replaced by Improvement in Dyspnea, Improvement in Urinary Incontinence, and Discharge to the Community.
-
Regression results for the core model (Model 1) and Model 2 are available from the project team upon request.
LIST OF FIGURES
FIGURE 1: Performance of Alternative and Current Risk-Adjustment Models for Improvement in ADL Outcomes
| FIGURE 1. Performance of Alternative and Current Risk-Adjustment Models for Improvement in ADL Outcomes |
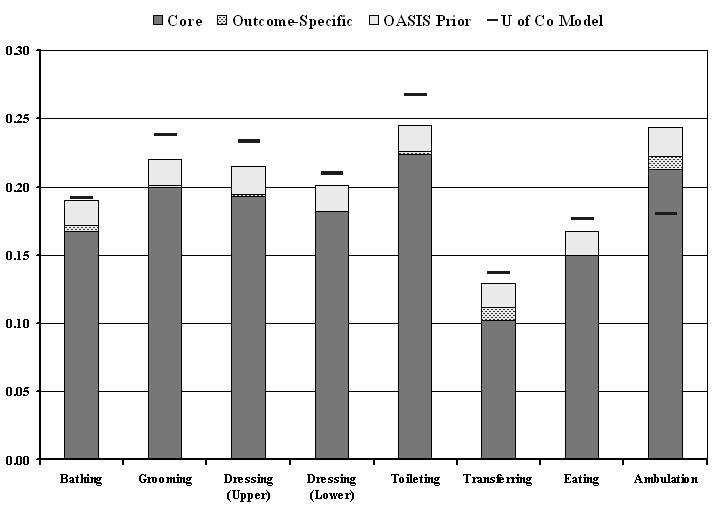 |
| Performance of Alternative and Current Risk-Adjustment Models for Stabilization in ADL Outcomes |
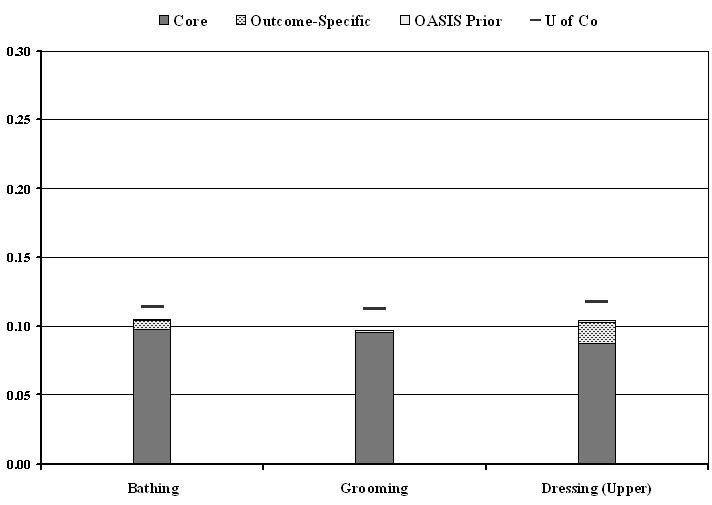 |
| NOTE: Vertical height (the y-axis) indicates the explanatory power of the alternative risk-adjustment models with: (1) only the core risk factors (the dark shade at the bottom of the column), (2) the addition of the outcome specific risk-adjusters (the speckled section), and (3) the addition of relevant “prior” OASIS items (the light shade at the top of the column). The short, solid line above or within the column indicates the explanatory power of the current (“U of CO”) risk-adjustment model. See methods section for the definition of the pseudo-R-squared measure of explanatory power. |
FIGURE 2: Performance of Alternative and Current Risk-Adjustment Models for Improvement in IADL Outcomes
| FIGURE 2. Performance of Alternative and Current Risk-Adjustment Models for Improvement in IADL Outcomes |
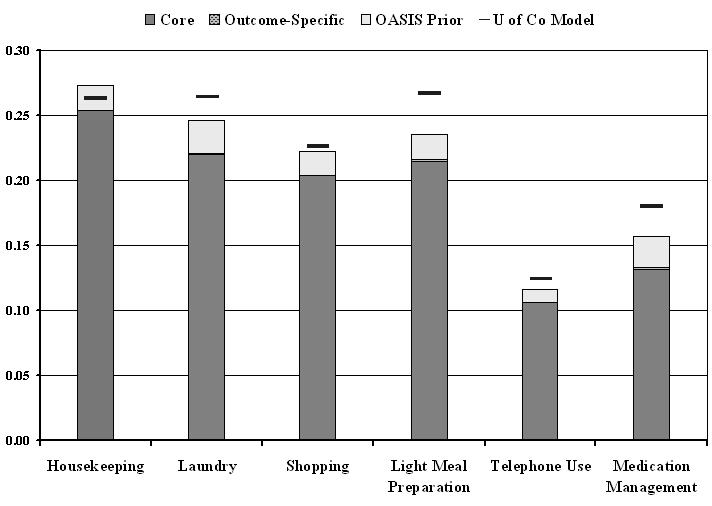 |
| Performance of Alternative and Current Risk-Adjustment Models for Stabilization in IADL Outcomes |
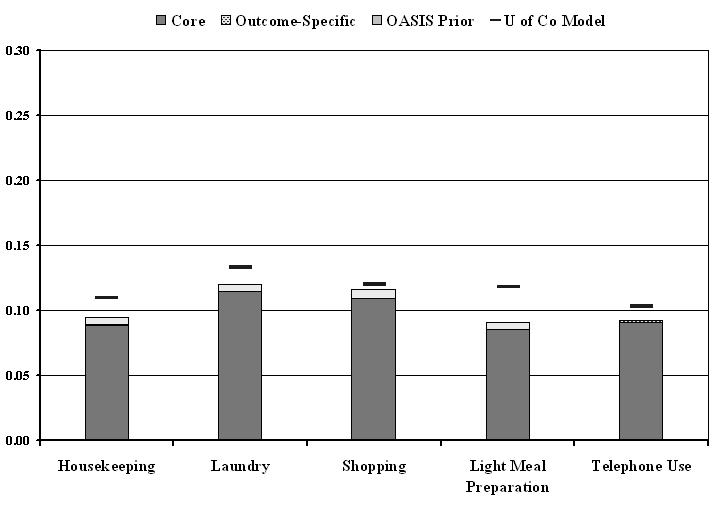 |
| NOTE: Vertical height (the y-axis) indicates the explanatory power of the alternative risk-adjustment models with: (1) only the core risk factors (the dark shade at the bottom of the column), (2) the addition of the outcome specific risk-adjusters (the speckled section), and (3) the addition of relevant “prior” OASIS items (the light shade at the top of the column). The short, solid line above or within the column indicates the explanatory power of the current (“U of CO”) risk-adjustment model. See methods section for the definition of the pseudo-R-squared measure of explanatory power. |
FIGURE 3: Performance of Alternative and Current Risk-Adjustment Models for Improvement in Physiologic and Cognitive Outcomes
| FIGURE 3. Performance of Alternative and Current Risk-Adjustment Models for Improvement in Physiologic and Cognitive Outcomes |
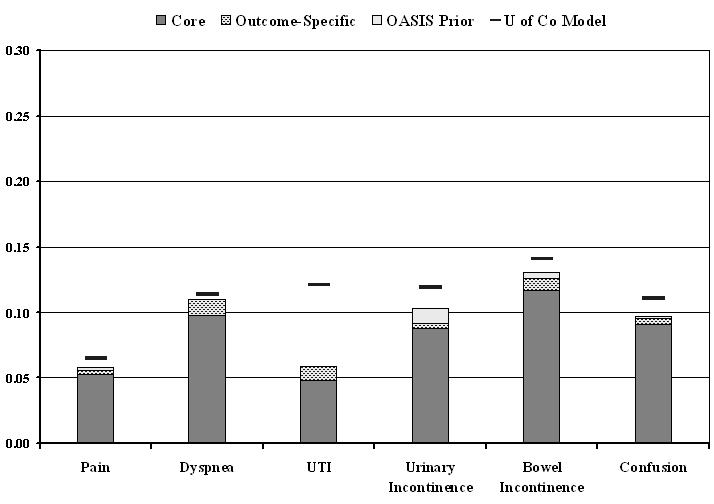 |
| NOTE: Vertical height (the y-axis) indicates the explanatory power of the alternative risk-adjustment models with: (1) only the core risk factors (the dark shade at the bottom of the column), (2) the addition of the outcome specific risk-adjusters (the speckled section), and (3) the addition of relevant “prior” OASIS items (the light shade at the top of the column). The short, solid line above or within the column indicates the explanatory power of the current (“U of CO”) risk-adjustment model. See methods section for the definition of the pseudo-R-squared measure of explanatory power. |
FIGURE 4: Performance of Alternative and Current Risk-Adjustment Models for Utilization Outcomes
| FIGURE 3. Performance of Alternative and Current Risk-Adjustment Models for Improvement in Physiologic and Cognitive Outcomes |
|
| NOTE: Vertical height (the y-axis) indicates the explanatory power of the alternative risk-adjustment models with: (1) only the core risk factors (the dark shade at the bottom of the column), (2) the addition of the outcome specific risk-adjusters (the speckled section), and (3) the addition of relevant “prior” OASIS items (the light shade at the top of the column). The short, solid line above or within the column indicates the explanatory power of the current (“U of CO”) risk-adjustment model. See methods section for the definition of the pseudo-R-squared measure of explanatory power. |
FIGURE 5: Inclusion of OASIS-B1 Items in Risk-Adjustment Models
| FIGURE 5. Inclusion of OASIS-B1 Items in Risk-Adjustment Models | |||||||||
|---|---|---|---|---|---|---|---|---|---|
| M0200 | M0220 | M0100 | M0190 | M0210 | M0280 | ||||
| M0066 | M0250* | M0290 | M0300 | M0340 | M0350 | M0360 | M0140 | M0180 | |
| M0069 | M0150 | M0430 | M0500 | M0370 | M0380 | M0400 | M0450* | M0474 | M0486 |
| M0175* | M0230* | M0510 | M0640P | M0650P | M0464 | M0470 | M0484 | M0810 | M0820 |
| M0230S* | M0240* | M0240S* | M0260 | M0660P | M0670P | M0488* | M0550* | M0620 | M0825* |
| M0270 | M0390* | M0410 | M0420* | M0440* | M0680P | M0690P | M0630 | M0730P | M0790 |
| M0445 | M0460* | M0468 | M0476* | M0482 | M0700P | M0710P | M0720P | M0790P | M0800 |
| M0490* | M0520 | M0530* | M0540* | M0560 | M0570 | M0580 | M0740P | M0750P | M0800P |
| M0590 | M0610* | M0640 | M0650* | M0660* | M0670* | M0680* | M0690* | M0760P | M0770P |
| M0700* | M0710 | M0720 | M0730 | M0740 | M0750 | M0760 | M0770 | M0780 | M0780P |
| LEGEND | |||||||||
| Items used in: | Core (43) |
Full (64) |
U of Co Models (88) |
Not Used (7) |
|||||
| OASIS ITEM | X | ||||||||
| OASIS ITEM | X | ||||||||
| OASIS ITEM | X | X | |||||||
| OASIS ITEM | X | X | X | ||||||
| NOTE: There is a total of 95 OASIS items for risk-adjustment. * Item used in home health resource group case-mix classification for Medicare payment. |
|||||||||
FIGURE 6: Inclusion of OASIS-B1 Elements in Risk-Adjustment Models
| FIGURE 6. Inclusion of OASIS-B1 Elements in Risk-Adjustment Models | ||||||||||||
|---|---|---|---|---|---|---|---|---|---|---|---|---|
| M0175_NA* | M0100 | M0150_1 | M0190_A | M0140_1 | M0140_2 | M0140_3 | M0140_4 | M0140_5 | M0140_6 | M0140_UK | ||
| M0200 | M0220_1 | M0190_B | M0210_A | M0210_B | M0150_0 | M0150_5 | M0150_6 | M0150_7 | M0150_8 | M0150_9 | M0150_10 | M0150_11 |
| M0220_2 | M0220_3 | M0220_4 | M0210_C | M0210_D | M0220_UK | M0150_UK | M0175_5* | M0180 | M0220_7 | M0220_NA | M0250_3* | M0250_4* |
| M0066 | M0220_5 | M0220_6 | M0250_1* | M0250_2* | M0280 | M0290_4 | M0290_3 | M0340_4 | M0340_5 | M0340_6 | M0825 | M0350_3 |
| M0069 | M0150_2 | M0290_1 | M0290_2 | M0290_3 | M0300 | M0340_1 | M0340_2 | M0380_3 | M0380_4 | M0380_5 | M0380_6 | M0380_7 |
| M0150_3 | M0150_4 | M0175_1* | M0290_UK | M0430 | M0340_3 | M0350_1 | M0350_2 | M0350_4 | M0380_UK | M0450_E* | M0474 | M0486 |
| M0175_2* | M0175_3* | M0175_4* | M0230_A* | M0300_2 | M0510 | M0350_UK | M0360 | M0370 | M0380_1 | M0500_3 | M0500_4 | M0550* |
| M0230S_A* | M0240_B* | M0240_C* | M0240_D* | M0610_1* | M0610_2* | M0610_5* | M0380_2 | M0400 | M0450_A* | M0450_B* | M0610_7* | M0810 |
| M0240_E* | M0240_F* | M0240S_B* | M0240S_C_D* | M0240S_D* | M0640P | M0650P | M0660P | M0450_C* | M0450_D* | M0464 | M0470 | M0820 |
| M0240S_E* | M0240S_F* | M0260 | M0270 | M0390* | M0410 | M0670P | M0680P | M0690P | M0484 | M0488* | M0500_1 | M0610_4* |
| M0420* | M0440* | M0445 | M0460* | M0468 | M0476* | M0482 | M0700P | M0710P | M0720P | M0610_6* | M0620 | M0630 |
| M0490* | M0520 | M0530* | M0540* | M0560 | M0570 | M0580 | M0590_1 | M0590_2 | M0740P | M0750P | M0730P | M0790 |
| M0590_3 | M0590_4 | M0590_5 | M0590_6 | M0610_3* | M0640 | M0650* | M0660* | M0670* | M0680* | M0760P | M0790P | M0800 |
| M0690* | M0700* | M0710 | M0720 | M0730 | M0740 | M0750 | M0760 | M0770 | M0780 | M0770P | M0780P | M0800P |
| LEGEND | ||||||||||||
| Elements Used In: | Core (61) |
Full (93) |
U of Co (135) |
Not Used (43) |
||||||||
| OASIS Element | X | |||||||||||
| OASIS Element | X | |||||||||||
| OASIS Element | X | X | ||||||||||
| OASIS Element | X | X | X | |||||||||
| OASIS Element | X | X | ||||||||||
| NOTE: There is a total of 180 OASIS elements for risk-adjustment. * Item used in home health resource group case-mix classification for Medicare payment. |
||||||||||||
FIGURE 7: Mean Percentage Point Difference in Agency Performance Using Current versus Full Alternative Models
| FIGURE 7. Mean Percentage Point Difference in Agency Performance Using Current versus Full Alternative Models |
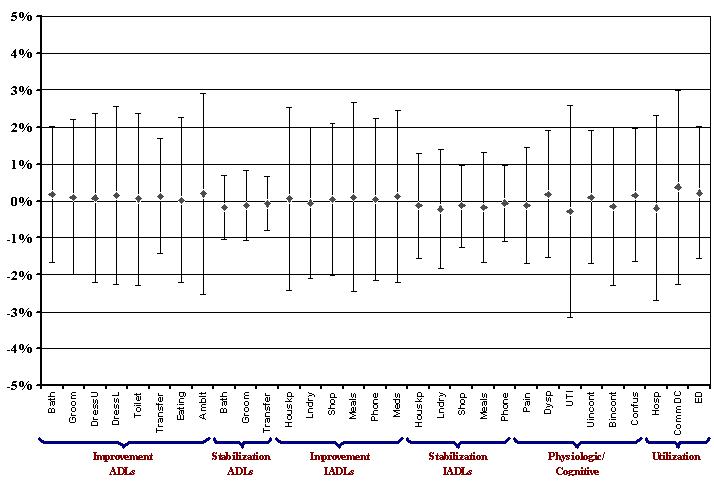 |
| NOTE: Each point represents the average agency percentage point difference between patient outcomes predicted by the current model and the patient outcomes predicted by the full alternative model. Above and below each point is a set of bars representing a two standard deviation span for each outcome, centered on the mean. |
FIGURE 8: Spearman’s Rank Correlation Coefficient for Agency Outcomes Using Current versus Full Alternative Models
| FIGURE 8. Spearman’s Rank Correlation Coefficient for Agency Outcomes Using Current versus Full Alternative Models |
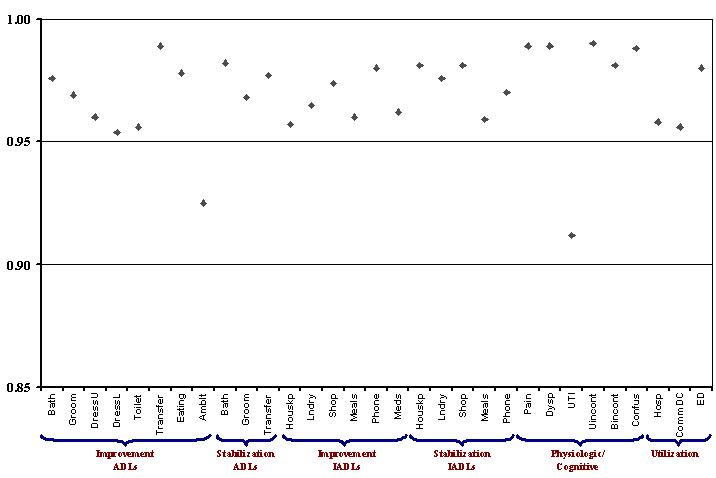 |
| NOTE: Each point represents the value of Spearman’s rank correlation coefficient for the ordinal ranking of agencies on their patient outcomes using the current model compared to rankings using the full alternative risk-adjustment model. It is a standard correlation coefficient, ranging from -1 to 1. In this figure, a value of 0 represents no relationship between the rankings, -1 represents perfectly opposite rankings, and 1 represents perfectly matching ranks produced by the models being compared. For purposes of presentation, only the range from 0.85 to 1 on the vertical (y) axis is shown in this figure. |
FIGURE 9: Mean Percentage Point Difference in Agency Performance Using Current versus Core Alternative Models
| FIGURE 9. Mean Percentage Point Difference in Agency Performance Using Current versus Core Alternative Models |
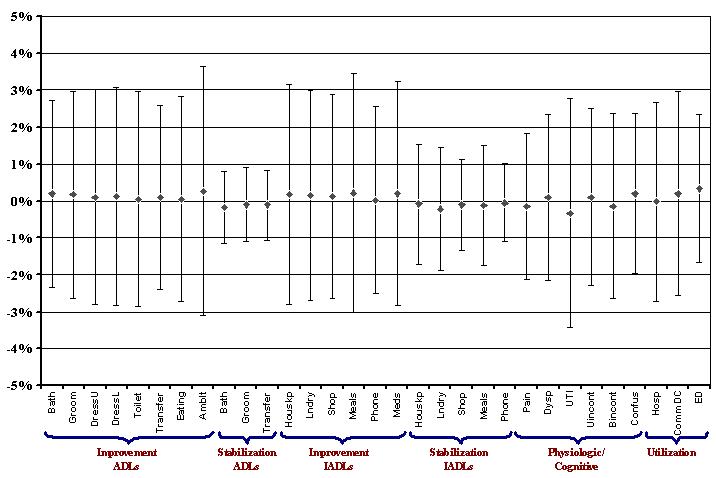 |
| NOTE: Each point represents the average agency percentage point difference between patient outcomes predicted by the current model and the patient outcomes predicted by the core alternative model. Above and below each point is a set of bars representing a two standard deviation span for each outcome, centered on the mean. |
FIGURE 10: Spearman’s Rank Correlation Coefficient for Agency Outcomes Using Current versus Core Alternative Models
| FIGURE 10. Spearman’s Rank Correlation Coefficient for Agency Outcomes Using Current versus Core logic and Cognitive Outcomes |
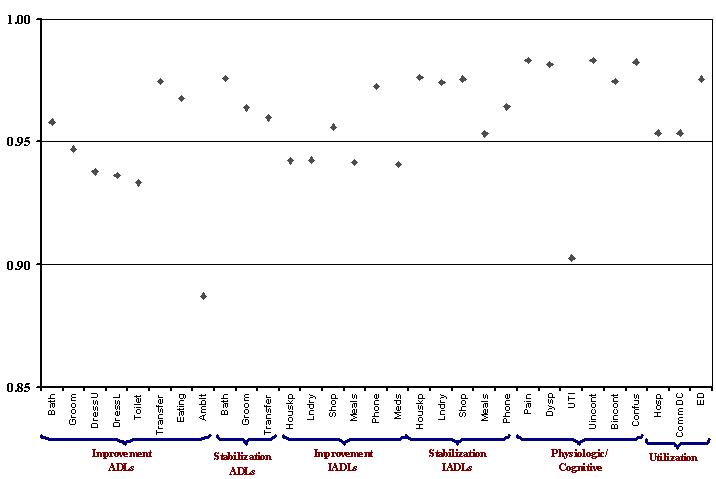 |
| NOTE: Each point represents the value of Spearman’s rank correlation coefficient for the ordinal ranking of agencies on their patient outcomes using the current model compared to rankings using the core alternative risk-adjustment model. It is a standard correlation coefficient, ranging from -1 to 1. In this figure, a value of 0 represents no relationship between the rankings, -1 represents perfectly opposite rankings, and 1 represents perfectly matching ranks produced by the models being compared. For purposes of presentation, only the range from 0-85 to 1 on the vertical (y) axis is shown in this figure. |
LIST OF TABLES
TABLE 1: Outcome Measures Used in OBQI
| TABLE 1. Outcome Measures Used in OBQI | |
|---|---|
| HEALTH STATUS OUTCOME MEASURES | |
| Functional: Activities of Daily Living Improved in: Ambulation/locomotion Dressing upper body Dressing lower body Grooming Bathing Eating Toileting Transferring Stabilized in: Grooming Bathing Transferring |
Functional: Instrumental Activities of Daily Living Improved in: Management of oral medications Light meal preparation Laundry Housekeeping Shopping Telephone use Stabilized in: Management of oral medications Light meal preparation Laundry Housekeeping Shopping Telephone use |
| Physiologic Improved in: Pain interfering with activity Number of surgical wounds Status of surgical wounds Dyspnea Urinary tract infection Urinary incontinence Bowel incontinence Speech or language Stabilized in: Speech or language |
Emotional Behavioral Improved in: Anxiety level Behavioral problem frequency Stabilized in: Anxiety level |
| Cognitive Improved in: Confusion frequency Cognitive functioning Stabilized in: Cognitive functioning |
|
| UTILIZATION OUTCOME MEASURES | |
| Acute care hospitalization Discharge to community Emergent care |
|
| NOTES: Adapted from Shaughnessy, P.W. and Hittle, D.F. 2002. “Overview of Risk Adjustment and Otucome Measures for Home Health Agency OBQI Reports” (available at http://www.cms.gov/providers/hha/RiskAdj1.pdf). Outcomes labeled as “Improved in” are binary indicators of whether status at discharge is better than at start of the episode on that outcome. Episodes that start at the ceiling of the outcome measure (i.e., those that could not improve because they are already at the top) are excluded from the denominator for “Improvement” outcomes. Outcomes labeled as “Stabilized in” are binary indicators of whether status at discharge is the same or better at discharge as compared to the start of the episode for that outcome. Episodes that start at the floor of the outcome measure (i.e., those that could not get worse because they start at the worst level), are excluded from the denominator for “Stabilization” outcomes. |
|
TABLE 2: Preliminary Set of Core Risk Factors Used in Initial Analyses
| TABLE 2. Preliminary Set of Core Risk Factors Used in Initial Analyses | ||
|---|---|---|
| Preliminary Core Risk Factors | OASIS Items | Specification |
| DEMOGRAPHICS | ||
| Age | M0066 | <65 65-74 (reference category) 75-84 85+ |
| Sex | M0069 | Female Male (reference category) |
| SOCIOECONOMIC FACTORS | ||
| Insurance/Payment: | ||
| Any Medicare | M0150 | Yes No (reference category) |
| Informal Support/Assistance: | ||
| ADL assistance provided by caregiver | M0350, M0360, M0380 | Yes No (reference category) |
| Frequency of assistance | M0350, M0360, M0370 | Scale 0-6 (0 = no caregiver) |
| Living Situation: | ||
| Lives alone | M0340 | Yes No (reference category) |
| Lives with spouse/family | M0340 | Yes No (reference category) |
| PRIOR SERVICE USE | ||
| Discharge Past 14 Days: | ||
| Discharge from hospital | M0175 | Yes No (reference category) |
| Discharge from nursing home | ||
| Discharge from rehabilitation facility | ||
| CLINICAL FACTORS | ||
| Prognoses: | ||
| Overall prognosis | M0260 | Poor (reference category) Good/fair |
| Rehab prognosis | M0270 | Guarded (reference category) Good |
| Life expectancy | M0280 | Greater than 6 mo. (reference category) Less than 6 months |
| Diagnoses: | ||
| Infectious/parasitic diseases | M0190, M0210, M0230, M0240 | For each major diagnosis category: Yes No (reference category) (Note: diagnoses are not mutually exclusive) |
| Neoplasms | ||
| Endocrine/metabolic | ||
| Blood diseases | ||
| Mental diseases | ||
| Nervous system | ||
| Circulatory system | ||
| Respiratory system | ||
| Digestive system | ||
| Genitourinary | ||
| Skin/subcutaneous | ||
| Musculoskeletal system | ||
| Ill-defined conditions | ||
| Fractures | ||
| Other injury | ||
| Iatrogenic conditions | ||
| Diagnosis Severity: | ||
| Number of severity ratings >2 | M0230_S, M0240S | Integer count (range 0 to 6) |
| Sensory Status: | ||
| Hearing impairment | M0400 | No impairment (reference category) Minimal difficulty Moderate difficulty Severe difficulty (categories 3-4) |
| Vision impairment | M0390 | Normal (reference category) Partially impaired Severely impaired |
| Speech/language impairment | M0410 | No impairment (reference category) Minimal difficulty Moderate difficulty Severe difficulty (categories 3-5) |
| Integumentary Status: | ||
| Surgical wound present | M0480 | Yes No (reference category) |
| Stage of most problematic pressure ulcer | M0440, M0445, M0460 | Scale 0-4 (0 = No pressure ulcer) |
| Status of most problematic stasis ulcer | M0440, M0468, M0476 | Scale 0-3 (0 = No stasis ulcer) |
| Physical Functioning: | ||
| ADL/IADL summary score | M0640 through M0780 | Integer count 0-14 (0 = No dependencies) |
| Elimination Status: | ||
| Urinary incontinence severity | M0520, M0530 | No incontinence (reference category) Timed voiding deters incontinence Night only Day and Night |
| Urinary catheter | M0520 | Yes No (reference category) |
| Bowel incontinence | M0540 | Rarely or Never (reference category) Less than once weekly 1-3 times weekly 4-6 times weekly Daily or more often (categories 4-5) |
| Ostomy for bowel elimination | M0550 | Yes (categories 1-2) No (reference category) |
| Neuro/Emotional/Behavioral Status: | ||
| Cognitive functioning | M0560 | No impairments (reference category) Requires prompting Requires assistance and some direction Requires considerable assistance Totally dependent |
| Confusion frequency | M0570 | Never (reference category) New or complex situations only On awakening or at night Day and evening, not constantly Constantly |
| Anxiety frequency | M0580 | None (reference category) Less often than daily Daily, but not constantly All of the time |
| Verbal disruption | M0610_3 | Yes No (reference category) |
| Number of symptoms of depression | M0590 | None (reference category) One symptom only More than one symptom |
TABLE 3: Final Set of Core Items Included as Risk-Adjusters in All Alternative Models
| TABLE 3. Final Set of Core Items Included as Risk-Adjusters in All Alternative Models | ||
|---|---|---|
| Core Variables | OASIS Items | Specification |
| DEMOGRAPHICS | ||
| Age | M0066 | <65 65-74 (reference category) 75-84 85+ |
| Sex | M0069 | Female Male (reference category) |
| SOCIOECONOMIC FACTORS | ||
| Current payer | M0150 | Any Medicaid Medicare HMO Medicare FFS and Other (reference category) |
| PRIOR SERVICE USE | ||
| Discharge Past 14 Days: | ||
| Discharge from hospital | M0175 | Yes No (reference category) |
| Discharge from rehabilitation facility | ||
| Discharge from nursing home | ||
| CLINICAL FACTORS | ||
| Baseline value of outcome indicator | Varies depending on outcome indicator | |
| Prognoses: | ||
| Overall prognosis | M0260 | Poor (reference category) Good/fair |
| Rehabilitation prognosis | M0270 | Guarded (reference category) Good |
| Diagnoses: | ||
| Diabetes (PPS group) | M0230, M0240 | Yes No (reference category) (Note: diagnoses are not mutually exclusive) |
| Neurological (PPS group) | ||
| Orthopedic (PPS group) | ||
| Wound/Burn (PPS group) | ||
| Dementia | ||
| Hypertension | ||
| Ischemia | ||
| Arrhythmia | ||
| Heart failure | ||
| COPD | ||
| Skin ulcer | ||
| Orthopedic (other than PPS) | ||
| Incontinence | ||
| Cancer | ||
| Mental condition | ||
| Signs, symptoms, and Ill-defined conditions | ||
| Diagnosis Severity: | ||
| Number of severity ratings >2 | M0230S, M0240S | Integer count (range 0 to 6) |
| Sensory Status: | ||
| Vision | M0390 | Normal (reference category) Partially impaired Severely impaired |
| Speech/language | M0410 | No impairment (reference category) Minimal difficulty Moderate difficulty Severe difficulty (categories 3-5) |
| Integumentary Status: | ||
| Surgical wound present | M0482 | Yes No (reference category) |
| Stage of most problematic pressure ulcer | M0440, M0445, M0460 | Scale 0-4 (0 = No pressure ulcer) |
| Status of most problematic stasis ulcer | M0440, M0468, M0476 | Scale 0-3 (0 = No stasis ulcer) |
| Physical Functioning: | ||
| ADL/IADL summary score | M0640 through M0780 | Integer count 0-14 (0 = No impairment) |
| Elimination Status: | ||
| Urinary incontinence severity | M0520, M0530 | No incontinence (reference category) Timed voiding deters incontinence Night only Day and Night |
| Urinary catheter | M0520 | Yes No (reference category) |
| Bowel incontinence | M0540 | Rarely or Never (reference category) Less than once weekly 1-3 times weekly 4-6 times weekly Daily or more often (categories 4-5) |
| Ostomy for bowel elimination | M0550 | Yes (categories 1-2) No (reference category) |
| Neuro/Emotional/Behavioral Status: | ||
| Cognitive functioning | M0560 | No impairments (reference category) Requires prompting Requires assistance and some direction Requires considerable assistance Totally dependent |
| Confusion frequency | M0570 | Never (reference category) New or complex situations only On awakening or at night Day and evening, not constantly Constantly |
| Anxiety frequency | M0580 | None (reference category) Less often than daily Daily, but not constantly All of the time |
| Verbal disruption at least once weekly | M0610_3 | Yes No (reference category) |
| Symptoms of depression | M0590 | None (reference category) Depressed mood Any other symptoms |
TABLE 4a: Risk-Adjusters Specific to ADL Outcome Models
| TABLE 4a. Risk-Adjusters Specific to ADL Outcome Models | ||
|---|---|---|
| Variables | OASIS Items | Specification |
| ALL ACTIVITY OF DAILY LIVING OUTCOME MODELS1 | ||
| Clinical Factors: | ||
| Obesity | M0290_2 | Yes No (reference category) |
| Frequency of pain interfering with activity | M0420 | No pain, or does not interfere with activity (reference category) Less often than daily Daily but not constantly All of the time |
| ADDITIONAL ITEM IN TRANSFERRING MODELS2 | ||
| Clinical Factors: | ||
| Current ambulation | M0700 | Walks independently (reference category) Requires use of device Able to walk only with supervision Chairfast, able to wheel self Chairfast, unable to wheel self Bedfast, unable to ambulate |
| ADDITIONAL ITEM IN IMPROVEMENT IN AMBULATION MODEL | ||
| Clinical Factors: | ||
| Current transferring | M0700 | Transfers independently (reference category) Transfers with minimal assistance or device Unable to transfer; can bear weight Unable to transfer; unable to bear weight Bedfast, able to turn and position self |
|
||
TABLE 4b: Risk-Adjusters Specific to IADL Outcome Models
| TABLE 4b. Risk-Adjusters Specific to IADL Outcome Models | ||
|---|---|---|
| Variables | OASIS Items | Specification |
| ALL INSTRUMENTAL ACTIVITY OF DAILY LIVING OUTCOME MODELS1 | ||
| Clinical Factors: | ||
| Behaviors demonstrated at least once a week: | ||
| Memory deficit | M0610_1 | Yes No (reference category) |
| Impaired decision-making | M0610_2 | Yes No (reference category) |
| ADDITIONAL ITEM IN HOUSKEEPING, LAUNDRY, AND SHOPPING MODELS2 | ||
| Clinical Factors: | ||
| Obesity | M0290_2 | Yes No (reference category) |
| Pain frequency | M0420 | No pain (reference category) Less than daily Daily, but not constantly All the time |
|
||
TABLE 4c: Risk-Adjusters Specific to Physiologic Outcome Models
| TABLE 4c. Risk-Adjusters Specific to Physiologic Outcome Models | ||
|---|---|---|
| Variables | OASIS Items | Specification |
| ALL PSYCIOLOGIC OUTCOME MODELS EXCEPT PAIN1 | ||
| Clinical Factors: | ||
| Obesity | M0290_2 | Yes No (reference category) |
| ADDITIONAL ITEMS IN DYSPNEA IMPROVEMENT MODEL | ||
| Clinical Factors: | ||
| Smoking | M0290_1 | Yes No (reference category) |
| Respiratory treatments: | ||
| Oxygen | M0500_1 | Yes No (reference category) |
| Ventilator | M0500_2 | Yes No (reference category) |
| ADDITIONAL ITEMS IN UTI IMPROVEMENT MODEL | ||
| Clinical Factors: | ||
| Current ambulation | M0700 | Walks independently (reference category) Requires use of device Able to walk only with supervision Chairfast, able to wheel self Chairfast, unable to wheel self Bedfast, unable to ambulate |
| Therapy received in home: | ||
| IV/Infusion | M0250_1 | Yes No (reference category) |
| ADDITIONAL ITEM IN INCONTINENCE MODELS2 | ||
| Clinical Factors: | ||
| Current toileting | M0680 | Able to get to and from the toilet independently (reference category) Able to get to and from toilet when reminded, assisted, or supervised Unable to get to toilet, but can use bedside commode Unable to get to toilet or use bedside commode, but can use bedpan T otally dependent in toileting |
| Treated for UTI in past 14 days | M0510 | Yes No (reference category) |
| ONLY OUTCOME-SPECIFIC ITEM IN IMPROVEMENT IN PAIN MODEL | ||
| Clinical Factors: | ||
| Intractable pain | M0430 | Yes No (reference category) |
|
||
TABLE 4d: Risk-Adjusters Specific to Cognitive and Utilization Outcomes
| TABLE 4d. Risk-Adjusters Specific to Cognitive and Utilization Outcomes | ||
|---|---|---|
| Variables | OASIS Items | Specification |
| ITEMS IN IMPROVEMENT IN CONFUSION FREQUENCY MODEL | ||
| Clinical Factors: | ||
| Behaviors demonstrated at least once a week: | ||
| Memory deficit | M0610_1 | Yes No (reference category) |
| Impaired decision-making | M0610_2 | Yes No (reference category) |
| ITEMS IN ALL UTILIZATION OUTCOME MODELS1 | ||
| Clinical Factors: | ||
| Dyspnea | M0490 | Never, patient is not short of breath (reference category) Walking more than 20 feet, or on stairs With moderate exertion With minimal exertion At rest |
| Therapy received in home: | ||
| IV/Infusion | M0250_1 | Yes No (reference category) |
| Respiratory treatments: | ||
| Ventilator | M0500_2 | Yes No (reference category) |
|
||
TABLE 5a: "Prior" Risk-Adjusters Specific to ADL Outcomes
| TABLE 5a. “Prior” Risk-Adjusters Specific to ADL Outcomes | ||
| Variables | OASIS Items | Specification |
| ITEM USED IN BATHING MODELS1 | ||
|---|---|---|
| Clinical Factors: | ||
| Bathing prior to admission | M0670_P | Independent (reference category) Able with use of devices Able with partial assistance Requires assistance Unable, bathed in bed/chair Totally dependent |
| ITEM USED IN GROOMING MODELS2 | ||
| Clinical Factors: | ||
| Grooming prior to admission | M0640_P | Independent (reference category) Able if utensils placed within reach Able with assistance Totally dependent |
| ITEM USED IN IMPROVEMENT IN UPPER BODY DRESSING MODEL | ||
| Clinical Factors: | ||
| Dressing upper body prior to admission | M0650_P | Independent (reference category) Able if clothing laid out or given Needs some help Totally dependent |
| ITEM USED IN IMPROVEMENT IN LOWER BODY DRESSING MODEL | ||
| Clinical Factors: | ||
| Dressing lower body prior to admission | M0660_P | Independent (reference category) Able if clothing laid out or given Needs some help Totally dependent |
| ITEM USED IN IMPROVEMENT IN TOILETING MODEL | ||
| Clinical Factors: | ||
| Toileting prior to admission | M0680_P | Independent (reference category) Able when assisted or supervised Uses bedside commode Uses bedpan independently Totally dependent |
| ITEM USED IN TRANSFERRING MODELS3 | ||
| Clinical Factors: | ||
| Transferring prior to admission | M0690_P | Independent (reference category) Able with minimal assistance Unable but can pivot self Needs assistance Bedfast |
| ITEM USED IN IMPROVEMENT IN EATING MODEL | ||
| Clinical Factors: | ||
| Eating prior to admission | M0710_P | Independent (reference category) Able with intermittent assistance Needs mechanical/personal assistance (levels 2-5) |
| ITEM USED IN IMPROVEMENT IN AMBULATION MODEL | ||
| Clinical Factors: | ||
| Ambulation prior to admission | M0700_P | Independent (reference category) Needs device to walk Needs assistance to walk Chairfast, able to wheel self Chairfast, unable to wheel self Bedfast |
|
||
TABLE 5b: "Prior" Risk-Adjusters Specific to IADL Outcomes
| TABLE 5b. “Prior” Risk-Adjusters Specific to IADL Outcomes | ||
|---|---|---|
| Variables | OASIS Items | Specification |
| ALL INSTRUMENTAL ACTIVITY OF DAILY LIVING OUTCOME MODELS1 | ||
| Clinical Factors: | ||
| Conditions Prior to Medical Regiment: | ||
| Impaired decision-making | M0220_4 | Yes No (reference category) |
| Memory loss requiring supervision | M0220_6 | Yes No (reference category) |
| ADDITIONAL ITEM IN HOUSEKEEPING MODELS2 | ||
| Clinical Factors: | ||
| Housekeeping prior to admission | M0750_P | Independent (reference category) Light tasks only Intermittent assistance Usually requires assistance Totally dependent |
| ADDITIONAL ITEM IN LAUNDRY MODELS3 | ||
| Clinical Factors: | ||
| Laundry prior to admission | M0740_P | Independent (reference category) Light laundry only Totally dependent |
| ADDITIONAL ITEM IN SHOPPING MODELS4 | ||
| Clinical Factors: | ||
| Shopping prior to admission | M0760_P | Independent (reference category) Needs some assistance Only if delivered Totally dependent |
| ADDITIONAL ITEM IN LIGHT MEAL PREPARATION MODELS5 | ||
| Clinical Factors: | ||
| Meal preparation prior to admission | M0720_P | Independent (reference category) Able, but not regularly Totally dependent |
| ADDITIONAL ITEM IN TELEPHONE USE MODELS6 | ||
| Clinical Factors: | ||
| Telephone use prior to admission | M0770_P | Independent (reference category) Able, with adapted phone Answers, but has trouble calling Sometimes answers, limited conversation Can listen with assistive device Totally dependent |
| ADDITIONAL ITEM IN MANAGEMENT OF MEDICATIONS MODELS7 | ||
| Clinical Factors: | ||
| Medication management prior to admission | M0780_P | Independent (reference category) Able if prepared by another person Totally dependent |
|
||
TABLE 5c: "Prior" Risk-Adjusters Specific to Physiologic Outcomes
| TABLE 5c. “Prior” Risk-Adjusters Specific to Physiologic Outcomes | ||
|---|---|---|
| Variables | OASIS Items | Specification |
| ITEM USED IN IMPROVEMENT IN PLAN | ||
| Clinical Factors: | ||
| Conditions Prior to Medical Regimen Change or Inpatient Stay: | ||
| Intractable pain | M0220_3 | Yes No (reference category) |
| ITEMS USED IN IMPROVEMENT IN UTI, URINARY INCONTINENCE, AND BOWEL INCONTINENCE | ||
| Clinical Factors: | ||
| Conditions Prior to Medical Regimen Change or Inpatient Stay: | ||
| Urinary incontinence | M0220_1 | Yes No (reference category) |
| Intradwelling/suprapubic catheter | M0220_2 | Yes No (reference category) |
| ADDITIONAL ITEMS IN INCONTINENCE MODELS1 | ||
| Clinical Factors: | ||
| Conditions Prior to Medical Regimen Change or Inpatient Stay: | ||
| Impaired decision-making | M0220_4 | Yes No (reference category) |
| Memory loss requiring supervision | M0220_6 | Yes No (reference category) |
| Toileting | M0680_P | Independent (reference category) Able when supervised Uses bedside commode Uses bedpan independently/totally dependent (levels 3, 4) |
|
||
TABLE 5d: "Prior" Risk-Adjusters Specific to Emotional/Behavioral/Cognitive Outcomes
| TABLE 5d. “Prior” Risk-Adjusters Specific to Emotional/Behavioral/Cognitive Outcomes | ||
|---|---|---|
| Variables | OASIS Items | Specification |
| ITEMS USED IN IMPROVEMENT IN CONFUSION FREQUENCY | ||
| Clinical Factors: | ||
| Conditions Prior to Medical Regimen Change or Inpatient Stay: | ||
| Impaired decision-making | M0220_2 | Yes No (reference category) |
| Disruptive or socially inappropriate behavior | M0220_5 | Yes No (reference category) |
| Memory loss requiring supervision | M0220_6 | Yes No (reference category) |
TABLE 6a: Summary of Regression Models: Activities of Daily Living
| TABLE 6a. Summary of Regression Models: Activities of Daily Living | |||||
|---|---|---|---|---|---|
| Risk-Adjusted in OBQI or HHQI | University of Colorado Model | Model 1 Clinical Core (Baseline Model) | Model 2 Adds Outcome-Specific | Model 3 Adds OASIS “Prior” Items | |
| IMPROVEMENT IN BATHING | Yes | ||||
| Percent Who Could Improve: 62.2% | |||||
| Percent Improving Among Those Who Could: 57.0% | |||||
| Number of OASIS Items | 52 | 41 | 43 | 44a | |
| Number of OASIS Elements | 72 | 59 | 63 | 64 | |
| R2 statistic | 0.192 | 0.167 | 0.172 | 0.190 | |
| c statistic | 0.755 | 0.738 | 0.741 | 0.753 | |
| IMPROVEMENT IN GROOMING | Yes | ||||
| Percent Who Could Improve: 34.6% | |||||
| Percent Improving Among Those Who Could: 61.4% | |||||
| Number of OASIS Items | 68 | 41 | 43 | 44b | |
| Number of OASIS Elements | 95 | 59 | 63 | 64 | |
| R2 statistic | 0.238 | 0.200 | 0.201 | 0.220 | |
| c statistic | 0.784 | 0.760 | 0.761 | 0.774 | |
| IMPROVEMENT IN DRESSING UPPER BODY | Yes | ||||
| Percent Who Could Improve: 40.1% | |||||
| Percent Improving Among Those Who Could: 61.4% | |||||
| Number of OASIS Items | 69 | 41 | 43 | 44c | |
| Number of OASIS Elements | 98 | 59 | 63 | 64 | |
| R2 statistic | 0.233 | 0.193 | 0.194 | 0.215 | |
| c statistic | 0.780 | 0.755 | 0.756 | 0.770 | |
| IMPROVEMENT IN DRESSING LOWER BODY | Yes | ||||
| Percent Who Could Improve: 46.6% | |||||
| Percent Improving Among Those Who Could: 60.1% | |||||
| Number of OASIS Items | 54 | 41 | 43 | 44d | |
| Number of OASIS Elements | 71 | 59 | 63 | 64 | |
| R2 statistic | 0.210 | 0.182 | 0.182 | 0.201 | |
| c statistic | 0.763 | 0.744 | 0.745 | 0.758 | |
| IMPROVEMENT IN TOILETING | Yes | ||||
| Percent Who Could Improve: 24.5% | |||||
| Percent Improving Among Those Who Could: 59.7% | |||||
| Number of OASIS Items | 43 | 41 | 43 | 44e | |
| Number of OASIS Elements | 59 | 59 | 63 | 64 | |
| R2 statistic | 0.267 | 0.224 | 0.226 | 0.245 | |
| c statistic | 0.800 | 0.775 | 0.775 | 0.787 | |
| IMPROVEMENT IN TRANSFERRING | Yes | ||||
| Percent Who Could Improve: 46.3% | |||||
| Percent Improving Among Those Who Could: 49.8% | |||||
| Number of OASIS Items | 60 | 41 | 43 | 44f | |
| Number of OASIS Elements | 87 | 59 | 63 | 64 | |
| R2 statistic | 0.137 | 0.102 | 0.112 | 0.129 | |
| c statistic | 0.711 | 0.681 | 0.690 | 0.705 | |
| IMPROVEMENT IN EATING | Yes | ||||
| Percent Who Could Improve: 21.6% | |||||
| Percent Improving Among Those Who Could: 53.3% | |||||
| Number of OASIS Items | 42 | 41 | 43 | 44g | |
| Number of OASIS Elements | 60 | 59 | 63 | 64 | |
| R2 statistic | 0.176 | 0.150 | 0.150 | 0.167 | |
| c statistic | 0.742 | 0.723 | 0.724 | 0.737 | |
| IMPROVEMENT IN AMBULATION | Yes | ||||
| Percent Who Could Improve: 59.9% | |||||
| Percent Improving Among Those Who Could: 34.1% | |||||
| Number of OASIS Items | 38 | 41 | 43 | 44h | |
| Number of OASIS Elements | 53 | 59 | 63 | 64 | |
| R2 statistic | 0.180 | 0.213 | 0.222 | 0.244 | |
| c statistic | 0.755 | 0.768 | 0.775 | 0.788 | |
| STABILIZATION IN BATHING | Yes | ||||
| Percent Who Could Stabilize: 66.4% | |||||
| Percent Stabilized Among Those Who Could: 90.4% | |||||
| Number of OASIS Items | 42 | 41 | 43 | 44a | |
| Number of OASIS Elements | 55 | 59 | 63 | 64 | |
| R2 statistic | 0.114 | 0.098 | 0.104 | 0.105 | |
| c statistic | 0.786 | 0.772 | 0.776 | 0.778 | |
| STABILIZATION IN GROOMING | Yes | ||||
| Percent Who Could Stabilize: 65.4% | |||||
| Percent Stabilized Among Those Who Could: 93.2% | |||||
| Number of OASIS Items | 44 | 41 | 43 | 44b | |
| Number of OASIS Elements | 64 | 59 | 63 | 64 | |
| R2 statistic | 0.113 | 0.096 | 0.096 | 0.097 | |
| c statistic | 0.804 | 0.784 | 0.784 | 0.786 | |
| STABILIZATION IN TRANSFERRING | Yes | ||||
| Percent Who Could Stabilize: 69.2% | |||||
| Percent Stabilized Among Those Who Could: 93.7% | |||||
| Number of OASIS Items | 48 | 41 | 43 | 44f | |
| Number of OASIS Elements | 70 | 59 | 63 | 64 | |
| R2 statistic | 0.118 | 0.088 | 0.103 | 0.104 | |
| c statistic | 0.846 | 0.815 | 0.836 | 0.836 | |
NOTES: “Percent Who Could Improve” calculated using all home health episodes, not just those discharged to the community. The smallest sample size for the ADL risk-adjustment models is 54,030. Shading indicates that U of CO model statistics are for multiple sub-models; we report the number of unique OASIS items and elements across all sub-models.
|
|||||
TABLE 6b: Final Alternative Risk-Adjustment Models for Activities of Daily Living Outcomes
| TABLE 6b. Final Alternative Risk-Adjustment Models for Activities of Daily Living Outcomes (Part I) | ||||||||||||
|---|---|---|---|---|---|---|---|---|---|---|---|---|
| Risk Factor Measured at SOC/ROC | Improvement in: | |||||||||||
| Bathing | Grooming | Dressing Upper Body | Dressing Lower Body | Toileting | Transferring | |||||||
| Full Model | Full Model | Full Model | Full Model | Full Model | Full Model | |||||||
| Coef. | p | Coef. | p | Coef. | p | Coef. | p | Coef. | p | Coef. | p | |
| DEMOGRAPHICS | ||||||||||||
| Age lt 65 | -0.031 | 0.337 | -0.117 | 0.000 | -0.146 | 0.000 | -0.051 | 0.170 | -0.125 | 0.025 | -0.026 | 0.310 |
| Age 75-84 | -0.062 | 0.004 | 0.014 | 0.516 | 0.008 | 0.695 | 0.047 | 0.063 | 0.059 | 0.118 | -0.059 | 0.000 |
| Age 85+ | -0.302 | 0.000 | -0.178 | 0.000 | -0.161 | 0.000 | -0.112 | 0.000 | -0.110 | 0.008 | -0.252 | 0.000 |
| Gender: female | -0.116 | 0.000 | -0.004 | 0.800 | 0.001 | 0.969 | 0.083 | 0.000 | -0.106 | 0.000 | -0.030 | 0.035 |
| SOCIOECONOMIC FACTORS | ||||||||||||
| Any Medicaid | -0.170 | 0.000 | -0.221 | 0.000 | -0.173 | 0.000 | -0.151 | 0.000 | -0.220 | 0.000 | -0.169 | 0.000 |
| Medicare HMO | -0.110 | 0.000 | -0.051 | 0.062 | -0.072 | 0.004 | -0.132 | 0.000 | -0.072 | 0.107 | -0.097 | 0.000 |
| PRIOR SERVICE USE | ||||||||||||
| Discharged past 14 days: | ||||||||||||
| Discharge from hospital | 0.348 | 0.000 | 0.419 | 0.000 | 0.436 | 0.000 | 0.391 | 0.000 | 0.444 | 0.000 | 0.310 | 0.000 |
| Discharge from rehab facility | 0.331 | 0.000 | 0.538 | 0.000 | 0.518 | 0.000 | 0.437 | 0.000 | 0.452 | 0.000 | 0.256 | 0.000 |
| Discharge from nursing home | 0.309 | 0.000 | 0.495 | 0.000 | 0.482 | 0.000 | 0.412 | 0.000 | 0.281 | 0.000 | 0.161 | 0.000 |
| CLINICAL FACTORS | ||||||||||||
| Prognoses | ||||||||||||
| Overall prognosis good/fair | 0.280 | 0.000 | 0.306 | 0.000 | 0.312 | 0.000 | 0.353 | 0.000 | 0.333 | 0.000 | 0.279 | 0.000 |
| Rehabilitation prognosis good | 0.313 | 0.000 | 0.330 | 0.000 | 0.334 | 0.000 | 0.296 | 0.000 | 0.307 | 0.000 | 0.261 | 0.000 |
| Diagnoses | ||||||||||||
| Diabetes (PPS Group) | -0.069 | 0.001 | -0.041 | 0.052 | -0.052 | 0.008 | -0.076 | 0.003 | -0.048 | 0.187 | -0.073 | 0.000 |
| Orthopedic (PPS Group) | -0.003 | 0.865 | 0.210 | 0.000 | 0.140 | 0.000 | 0.070 | 0.001 | 0.135 | 0.000 | 0.077 | 0.000 |
| Neurological (PPS Group) | -0.148 | 0.000 | -0.142 | 0.000 | -0.192 | 0.000 | -0.187 | 0.000 | -0.214 | 0.000 | -0.096 | 0.000 |
| Wound/Burn (PPS Group) | -0.133 | 0.001 | -0.220 | 0.000 | -0.172 | 0.000 | -0.123 | 0.010 | -0.200 | 0.004 | -0.115 | 0.000 |
| Cancer | -0.120 | 0.000 | -0.201 | 0.000 | -0.227 | 0.000 | -0.123 | 0.001 | -0.233 | 0.000 | -0.076 | 0.005 |
| Mental condition | 0.006 | 0.888 | 0.011 | 0.778 | 0.039 | 0.316 | 0.080 | 0.122 | -0.008 | 0.911 | 0.099 | 0.006 |
| Dementia | -0.169 | 0.001 | -0.126 | 0.002 | -0.160 | 0.000 | -0.126 | 0.018 | -0.142 | 0.024 | 0.021 | 0.583 |
| Hypertension | 0.081 | 0.000 | 0.050 | 0.008 | 0.054 | 0.002 | 0.072 | 0.001 | 0.005 | 0.888 | -0.029 | 0.052 |
| Ischemia | 0.127 | 0.000 | 0.162 | 0.000 | 0.182 | 0.000 | 0.142 | 0.000 | 0.108 | 0.032 | 0.167 | 0.000 |
| Arrhythmia | 0.068 | 0.022 | 0.079 | 0.008 | 0.049 | 0.072 | 0.047 | 0.194 | 0.035 | 0.505 | -0.033 | 0.165 |
| Heart failure | -0.092 | 0.000 | -0.080 | 0.001 | -0.037 | 0.104 | -0.073 | 0.014 | 0.027 | 0.523 | -0.090 | 0.000 |
| COPD | -0.099 | 0.000 | -0.016 | 0.548 | -0.005 | 0.857 | -0.017 | 0.606 | 0.081 | 0.101 | 0.031 | 0.172 |
| Skin ulcer | -0.153 | 0.000 | -0.172 | 0.000 | -0.139 | 0.000 | -0.120 | 0.011 | -0.178 | 0.006 | -0.192 | 0.000 |
| Orthopedic (other than PPS) | 0.043 | 0.042 | 0.194 | 0.000 | 0.214 | 0.000 | 0.024 | 0.336 | 0.178 | 0.000 | -0.056 | 0.000 |
| Incontinence | -0.279 | 0.000 | -0.185 | 0.000 | -0.168 | 0.000 | -0.181 | 0.003 | -0.171 | 0.016 | -0.200 | 0.000 |
| Symptoms, signs, & ill-defined conditions | -0.068 | 0.016 | -0.024 | 0.357 | 0.003 | 0.896 | -0.003 | 0.926 | -0.153 | 0.000 | -0.024 | 0.283 |
| Diagnosis Severity | ||||||||||||
| Number of severity ratings >2 | 0.038 | 0.000 | 0.006 | 0.338 | 0.031 | 0.000 | 0.048 | 0.000 | 0.031 | 0.004 | 0.014 | 0.006 |
| Sensory Status | ||||||||||||
| Partially vision impaired | -0.053 | 0.007 | -0.135 | 0.000 | -0.085 | 0.000 | -0.056 | 0.012 | -0.083 | 0.005 | -0.102 | 0.000 |
| Severely vision impaired | -0.140 | 0.008 | -0.392 | 0.000 | -0.307 | 0.000 | -0.143 | 0.013 | -0.166 | 0.019 | -0.116 | 0.005 |
| Speech: Minimum difficulty | -0.038 | 0.109 | -0.110 | 0.000 | -0.069 | 0.001 | -0.035 | 0.203 | -0.048 | 0.195 | -0.064 | 0.001 |
| Speech: Moderate difficulty | -0.093 | 0.025 | -0.214 | 0.000 | -0.170 | 0.000 | -0.144 | 0.001 | -0.079 | 0.143 | -0.102 | 0.002 |
| Speech: Severe difficulty | -0.381 | 0.000 | -0.620 | 0.000 | -0.539 | 0.000 | -0.476 | 0.000 | -0.373 | 0.000 | -0.308 | 0.000 |
| Integumentary Status | ||||||||||||
| Surgical wound present | 0.312 | 0.000 | 0.361 | 0.000 | 0.385 | 0.000 | 0.188 | 0.000 | 0.341 | 0.000 | 0.202 | 0.000 |
| Stage of most problematic pressure ulcer | -0.141 | 0.000 | -0.158 | 0.000 | -0.162 | 0.000 | -0.182 | 0.000 | -0.159 | 0.000 | -0.128 | 0.000 |
| Status of most problematic stasis ulcer | -0.155 | 0.000 | -0.066 | 0.007 | -0.111 | 0.000 | -0.170 | 0.000 | -0.139 | 0.002 | -0.077 | 0.000 |
| Functional Status/Physical Functioning | ||||||||||||
| ADL/IADL index | -0.125 | 0.000 | -0.236 | 0.000 | -0.247 | 0.000 | -0.239 | 0.000 | -0.300 | 0.000 | -0.090 | 0.000 |
| Bath: Able 2/use of devices | ||||||||||||
| Bath: Able w/partial assistance | 1.087 | 0.000 | ||||||||||
| Bath: Requires assistance | 2.217 | 0.000 | ||||||||||
| Bath: Unable, Bathed in bed/chair | 2.355 | 0.000 | ||||||||||
| Bath: Totally dependent | 3.538 | 0.000 | ||||||||||
| Groom: Utensils within reach | ||||||||||||
| Groom: With assistance | 1.111 | 0.000 | ||||||||||
| Groom: Totally dependent | 2.105 | 0.000 | ||||||||||
| Dress UB: Needs some help | 0.925 | 0.000 | ||||||||||
| Dress UB: Totally dependent | 2.068 | 0.000 | ||||||||||
| Dress LB: Needs some help | 0.644 | 0.000 | ||||||||||
| Dress LB: Totally dependent | 1.979 | 0.000 | ||||||||||
| Toilet: Uses bedside commode | 0.727 | 0.000 | ||||||||||
| Toilet: Uses bedpan independently | 1.027 | 0.000 | ||||||||||
| Toilet: Totally dependent | 1.260 | 0.000 | ||||||||||
| Transfer: Able w/minimal assistance | -0.030 | 0.180 | ||||||||||
| Transfer: Unable buy pivots | -0.309 | 0.000 | 2.208 | 0.000 | ||||||||
| Transfer: Needs assistance | -0.687 | 0.000 | 2.708 | 0.000 | ||||||||
| Transfer: Needs assistance/bedfast, able to turn self | ||||||||||||
| Transfer: Bedfact (Levels 4, 5) | -1.114 | 0.000 | 3.061 | 0.000 | ||||||||
| Eat: Unable to feed self | ||||||||||||
| Eat: Food tube/unable to take in nutrients (Levels 3-5) | ||||||||||||
| Amb: Needs device to walk | -0.691 | 0.000 | ||||||||||
| Amb: Needs assistance to walk | -0.816 | 0.000 | ||||||||||
| Amb: Chairfast, Able to wheel | -1.456 | 0.000 | ||||||||||
| Amb: Chairfast, Unable to wheel | -1.717 | 0.000 | ||||||||||
| Amb: Bedfast | -2.148 | 0.000 | ||||||||||
| Elimination Status | ||||||||||||
| Urinary incontinence during the night | -0.097 | 0.002 | -0.094 | 0.001 | -0.108 | 0.000 | -0.094 | 0.009 | -0.127 | 0.009 | -0.132 | 0.000 |
| Urinary incontinence during the day | -0.152 | 0.006 | -0.132 | 0.006 | -0.169 | 0.000 | -0.134 | 0.028 | -0.208 | 0.006 | -0.218 | 0.000 |
| Urinary incontinence during the night & day | -0.212 | 0.000 | -0.213 | 0.000 | -0.216 | 0.000 | -0.219 | 0.000 | -0.224 | 0.000 | -0.222 | 0.000 |
| Urinary catheter present | -0.258 | 0.000 | -0.441 | 0.000 | -0.430 | 0.000 | -0.479 | 0.000 | -0.754 | 0.000 | -0.386 | 0.000 |
| Bowel incontinent less than weekly | -0.053 | 0.306 | -0.060 | 0.164 | -0.037 | 0.373 | -0.115 | 0.042 | -0.050 | 0.456 | -0.123 | 0.002 |
| Bowel incontinent 1-3 times/week | -0.175 | 0.000 | -0.236 | 0.000 | -0.210 | 0.000 | -0.316 | 0.000 | -0.279 | 0.000 | -0.166 | 0.000 |
| Bowel incontinent 4-6 times/week | -0.266 | 0.000 | -0.384 | 0.000 | -0.350 | 0.000 | -0.399 | 0.000 | -0.462 | 0.000 | -0.327 | 0.000 |
| c statistic | -0.259 | 0.000 | -0.487 | 0.000 | -0.485 | 0.000 | -0.514 | 0.000 | -0.499 | 0.000 | -0.234 | 0.000 |
| Ostomy | 0.015 | 0.809 | -0.092 | 0.124 | -0.025 | 0.651 | 0.048 | 0.501 | -0.270 | 0.007 | 0.061 | 0.223 |
| Neuro/Emotional/Behavioral Status | ||||||||||||
| Cog Func: Requires prompting | -0.080 | 0.002 | -0.065 | 0.008 | -0.067 | 0.003 | -0.048 | 0.112 | -0.096 | 0.021 | -0.074 | 0.000 |
| Cog Func: Requires assistance & some direction | -0.130 | 0.001 | -0.161 | 0.000 | -0.118 | 0.000 | -0.096 | 0.032 | -0.179 | 0.002 | -0.082 | 0.011 |
| Cog Func: Requires considerable assistance | -0.177 | 0.007 | -0.215 | 0.000 | -0.121 | 0.016 | -0.164 | 0.019 | -0.142 | 0.075 | -0.083 | 0.097 |
| Cog Func: Totally dependent | -0.572 | 0.000 | -0.514 | 0.000 | -0.497 | 0.000 | -0.688 | 0.000 | -0.360 | 0.014 | -0.300 | 0.001 |
| Conf Freq: In new situations | -0.035 | 0.122 | -0.065 | 0.004 | -0.038 | 0.062 | -0.003 | 0.921 | -0.024 | 0.525 | -0.048 | 0.008 |
| Conf Freq: Awakening at night | -0.077 | 0.225 | -0.038 | 0.482 | -0.103 | 0.041 | -0.147 | 0.034 | -0.004 | 0.960 | -0.014 | 0.777 |
| Conf Freq: Day/evenings, not constant | -0.127 | 0.001 | -0.215 | 0.000 | -0.180 | 0.000 | -0.106 | 0.016 | -0.054 | 0.331 | -0.009 | 0.769 |
| Conf Freq: Constantly | -0.178 | 0.018 | -0.376 | 0.000 | -0.350 | 0.000 | -0.219 | 0.007 | -0.119 | 0.185 | 0.051 | 0.369 |
| Anx Freq: Less than daily | -0.016 | 0.437 | -0.006 | 0.774 | -0.005 | 0.803 | -0.047 | 0.053 | 0.052 | 0.132 | -0.005 | 0.750 |
| Anx Freq: Daily but not constantly | 0.018 | 0.466 | 0.022 | 0.344 | 0.031 | 0.152 | 0.034 | 0.244 | 0.130 | 0.001 | 0.029 | 0.139 |
| Anx Freq: All the time | 0.135 | 0.048 | 0.066 | 0.296 | 0.142 | 0.018 | 0.070 | 0.379 | 0.132 | 0.229 | 0.161 | 0.003 |
| Verbal disruption | -0.232 | 0.003 | -0.263 | 0.000 | -0.255 | 0.000 | -0.256 | 0.002 | -0.215 | 0.019 | -0.133 | 0.023 |
| Depressive Feelings: Depressed mood | -0.062 | 0.004 | -0.030 | 0.141 | -0.026 | 0.168 | -0.035 | 0.168 | -0.101 | 0.003 | -0.023 | 0.182 |
| Depressive Feelings: Any other elements (2-6) | -0.037 | 0.493 | 0.018 | 0.691 | 0.003 | 0.937 | -0.027 | 0.648 | -0.097 | 0.204 | -0.087 | 0.037 |
| OUTCOME SPECIFIC RISK-ADJUSTERS | ||||||||||||
| Obesity | -0.082 | 0.001 | 0.004 | 0.865 | -0.038 | 0.092 | -0.166 | 0.000 | -0.039 | 0.353 | -0.133 | 0.000 |
| Pain less often daily | -0.032 | 0.237 | 0.022 | 0.404 | 0.024 | 0.314 | -0.014 | 0.673 | -0.014 | 0.756 | -0.009 | 0.665 |
| Pain daily but not constantly | 0.060 | 0.002 | 0.106 | 0.000 | 0.068 | 0.000 | 0.021 | 0.360 | 0.112 | 0.001 | -0.013 | 0.393 |
| Pain all the time | 0.070 | 0.032 | 0.095 | 0.003 | 0.054 | 0.069 | -0.013 | 0.740 | 0.229 | 0.000 | 0.010 | 0.698 |
| Status Prior to Admission | ||||||||||||
| Bath: Able w/use of devices | -0.270 | 0.000 | ||||||||||
| Bath: Able w/partial assistance | -0.721 | 0.000 | ||||||||||
| Bath: Requires assistance | -0.861 | 0.000 | ||||||||||
| Bath: Unable, Bathed in bed/chair | -0.877 | 0.000 | ||||||||||
| Bath: Totally dependent | -0.925 | 0.000 | ||||||||||
| Groom: If utensils placed within reach | -0.688 | 0.000 | ||||||||||
| Groom: With assistance | -0.890 | 0.000 | ||||||||||
| Groom: Totally dependent | -1.086 | 0.000 | ||||||||||
| Dress UB: Able if clothing out | -0.667 | 0.000 | ||||||||||
| Dress UB: Needs some help | -0.897 | 0.000 | ||||||||||
| Dress UB: Totally dependent | -1.084 | 0.000 | ||||||||||
| Dress LB: Able if laid out or given | -0.501 | 0.000 | ||||||||||
| Dress LB: Needs some help | -0.793 | 0.000 | ||||||||||
| Dress LB: Totally dependent | -0.974 | 0.000 | ||||||||||
| Toilet: Able when supervised | -0.756 | 0.000 | ||||||||||
| Toilet: Uses bedside commode | -0.818 | 0.000 | ||||||||||
| Toilet: Uses bedpan independently | -0.670 | 0.000 | ||||||||||
| Toilet: Totally dependent | -1.164 | 0.000 | ||||||||||
| Transfer: Able w/minimal assistance | -0.600 | 0.000 | ||||||||||
| Transfer: Unable but pivots | -0.888 | 0.000 | ||||||||||
| Transfer: Needs assistance | -1.056 | 0.000 | ||||||||||
| Transfer: Needs assistance/bedfast (Levels 3,4) | ||||||||||||
| Transfer: Bedfast (Levels 4,5) | -0.946 | 0.000 | ||||||||||
| Eat: Able with intermittent assistance | ||||||||||||
| Eat: Needs mechanical/personal assistance | ||||||||||||
| Amb: Needs device to walk | ||||||||||||
| Amb: Needs assistance to walk | ||||||||||||
| Amb: Chairfast, Able to wheel | ||||||||||||
| Amb: Chairfast, Unable wheel | ||||||||||||
| Amb: Bedfast | ||||||||||||
| Intercept | -0.414 | 0.000 | 1.839 | 0.000 | 1.746 | 0.000 | 1.387 | 0.000 | 3.079 | 0.000 | 1.189 | 0.000 |
| R2 statistic | 0.190 | 0.220 | 0.215 | 0.201 | 0.245 | 0.129 | ||||||
| c statistic | 0.753 | 0.774 | 0.770 | 0.758 | 0.787 | 0.705 | ||||||
| TABLE 6b. Final Alternative Risk-Adjustment Models for Activities of Daily Living Outcomes (Part II) | ||||||||||
|---|---|---|---|---|---|---|---|---|---|---|
| Risk Factor Measured at SOC/ROC | Improvement in: | Stabilization in: | ||||||||
| Eating | Ambulation | Bathing | Grooming | Transferring | ||||||
| Full Model | Full Model | Full Model | Full Model | Full Model | ||||||
| Coef. | p | Coef. | p | Coef. | p | Coef. | p | Coef. | p | |
| DEMOGRAPHICS | ||||||||||
| Age lt 65 | 0.038 | 0.469 | -0.061 | 0.081 | 0.223 | 0.000 | 0.069 | 0.253 | 0.152 | 0.011 |
| Age 75-84 | 0.078 | 0.033 | -0.101 | 0.000 | -0.111 | 0.001 | 0.033 | 0.411 | -0.045 | 0.261 |
| Age 85+ | -0.097 | 0.018 | -0.363 | 0.000 | -0.306 | 0.000 | -0.231 | 0.000 | -0.206 | 0.000 |
| Gender: female | 0.037 | 0.198 | -0.127 | 0.000 | -0.140 | 0.000 | -0.029 | 0.360 | -0.101 | 0.002 |
| SOCIOECONOMIC FACTORS | ||||||||||
| Any Medicaid | -0.264 | 0.000 | -0.040 | 0.231 | 0.038 | 0.417 | -0.072 | 0.191 | -0.038 | 0.485 |
| Medicare HMO | -0.055 | 0.235 | -0.167 | 0.000 | -0.127 | 0.001 | -0.136 | 0.004 | -0.110 | 0.024 |
| PRIOR SERVICE USE | ||||||||||
| Discharged past 14 days: | ||||||||||
| Discharge from hospital | 0.365 | 0.000 | 0.249 | 0.000 | 0.094 | 0.002 | 0.220 | 0.000 | 0.174 | 0.000 |
| Discharge from rehab facility | 0.522 | 0.000 | -0.107 | 0.000 | 0.046 | 0.305 | 0.293 | 0.000 | -0.072 | 0.182 |
| Discharge from nursing home | 0.372 | 0.000 | -0.103 | 0.003 | 0.060 | 0.235 | 0.303 | 0.000 | 0.169 | 0.007 |
| CLINICAL FACTORS | ||||||||||
| Prognoses | ||||||||||
| Overall prognosis good/fair | 0.155 | 0.003 | 0.285 | 0.000 | 0.422 | 0.000 | 0.329 | 0.000 | 0.368 | 0.000 |
| Rehabilitation prognosis good | 0.149 | 0.000 | 0.379 | 0.000 | 0.272 | 0.000 | 0.368 | 0.000 | 0.333 | 0.000 |
| Diagnoses | ||||||||||
| Diabetes (PPS Group) | 0.047 | 0.188 | -0.118 | 0.000 | -0.089 | 0.007 | -0.084 | 0.032 | -0.048 | 0.231 |
| Orthopedic (PPS Group) | 0.227 | 0.000 | -0.183 | 0.000 | -0.008 | 0.794 | 0.134 | 0.000 | 0.083 | 0.023 |
| Neurological (PPS Group) | -0.099 | 0.004 | -0.272 | 0.000 | -0.082 | 0.021 | -0.120 | 0.003 | -0.051 | 0.237 |
| Wound/Burn (PPS Group) | -0.096 | 0.146 | -0.021 | 0.630 | -0.214 | 0.000 | -0.233 | 0.001 | -0.119 | 0.092 |
| Cancer | -0.295 | 0.000 | 0.144 | 0.000 | -0.360 | 0.000 | -0.512 | 0.000 | -0.318 | 0.000 |
| Mental condition | -0.015 | 0.828 | 0.101 | 0.039 | 0.053 | 0.407 | -0.095 | 0.189 | 0.157 | 0.043 |
| Dementia | -0.025 | 0.700 | 0.000 | 0.993 | -0.089 | 0.198 | -0.158 | 0.034 | 0.072 | 0.369 |
| Hypertension | -0.006 | 0.841 | 0.016 | 0.432 | 0.085 | 0.004 | 0.131 | 0.000 | 0.003 | 0.925 |
| Ischemia | 0.034 | 0.463 | 0.294 | 0.000 | 0.121 | 0.004 | 0.251 | 0.000 | 0.219 | 0.000 |
| Arrhythmia | 0.000 | 0.995 | 0.035 | 0.285 | 0.031 | 0.497 | -0.006 | 0.918 | 0.039 | 0.476 |
| Heart failure | -0.047 | 0.256 | -0.103 | 0.000 | -0.129 | 0.001 | -0.040 | 0.367 | -0.046 | 0.318 |
| COPD | 0.094 | 0.043 | 0.012 | 0.698 | -0.081 | 0.053 | -0.107 | 0.027 | 0.006 | 0.907 |
| Skin ulcer | -0.021 | 0.746 | -0.170 | 0.000 | -0.230 | 0.000 | -0.165 | 0.015 | -0.222 | 0.001 |
| Orthopedic (other than PPS) | 0.067 | 0.065 | -0.398 | 0.000 | 0.026 | 0.449 | 0.290 | 0.000 | 0.022 | 0.605 |
| Incontinence | -0.076 | 0.312 | -0.154 | 0.017 | -0.172 | 0.045 | -0.149 | 0.107 | -0.126 | 0.173 |
| Symptoms, signs, & ill-defined conditions | -0.026 | 0.568 | -0.102 | 0.001 | -0.010 | 0.827 | 0.032 | 0.521 | -0.055 | 0.296 |
| Diagnosis Severity | ||||||||||
| Number of severity ratings >2 | 0.004 | 0.731 | 0.084 | 0.000 | 0.009 | 0.360 | -0.023 | 0.053 | -0.010 | 0.395 |
| Sensory Status | ||||||||||
| Partially vision impaired | -0.217 | 0.000 | -0.063 | 0.005 | 0.059 | 0.052 | -0.088 | 0.011 | -0.084 | 0.021 |
| Severely vision impaired | -0.300 | 0.000 | -0.285 | 0.000 | -0.006 | 0.937 | -0.452 | 0.000 | -0.173 | 0.048 |
| Speech: Minimum difficulty | -0.173 | 0.000 | -0.034 | 0.213 | 0.025 | 0.497 | -0.085 | 0.042 | -0.052 | 0.252 |
| Speech: Moderate difficulty | -0.261 | 0.000 | -0.064 | 0.178 | -0.131 | 0.036 | -0.343 | 0.000 | -0.276 | 0.000 |
| Speech: Severe difficulty | -0.572 | 0.000 | -0.285 | 0.000 | -0.365 | 0.000 | -0.576 | 0.000 | -0.229 | 0.011 |
| Integumentary Status | ||||||||||
| Surgical wound present | 0.278 | 0.000 | 0.194 | 0.000 | 0.329 | 0.000 | 0.484 | 0.000 | 0.401 | 0.000 |
| Stage of most problematic pressure ulcer | -0.127 | 0.000 | -0.204 | 0.000 | -0.151 | 0.000 | -0.156 | 0.000 | -0.178 | 0.000 |
| Status of most problematic stasis ulcer | -0.035 | 0.400 | -0.079 | 0.006 | -0.094 | 0.004 | -0.093 | 0.016 | -0.081 | 0.040 |
| Functional Status/Physical Functioning | ||||||||||
| ADL/IADL index | -0.142 | 0.000 | -0.093 | 0.000 | -0.228 | 0.000 | -0.349 | 0.000 | -0.185 | 0.000 |
| Bath: Able 2/use of devices | 1.066 | 0.000 | ||||||||
| Bath: Able w/partial assistance | 2.328 | 0.000 | ||||||||
| Bath: Requires assistance | 3.595 | 0.000 | ||||||||
| Bath: Unable, Bathed in bed/chair | 4.679 | 0.000 | ||||||||
| Bath: Totally dependent | ||||||||||
| Groom: Utensils within reach | 1.185 | 0.000 | ||||||||
| Groom: With assistance | 2.994 | 0.000 | ||||||||
| Groom: Totally dependent | ||||||||||
| Dress UB: Needs some help | ||||||||||
| Dress UB: Totally dependent | ||||||||||
| Dress LB: Needs some help | ||||||||||
| Dress LB: Totally dependent | ||||||||||
| Toilet: Uses bedside commode | ||||||||||
| Toilet: Uses bedpan independently | ||||||||||
| Toilet: Totally dependent | ||||||||||
| Transfer: Able w/minimal assistance | -0.498 | 0.000 | -0.085 | 0.014 | 3.513 | 0.000 | ||||
| Transfer: Unable buy pivots | -0.866 | 0.000 | -0.619 | 0.000 | 4.090 | 0.000 | ||||
| Transfer: Needs assistance | -1.203 | 0.000 | -1.078 | 0.000 | ||||||
| Transfer: Needs assistance/bedfast, able to turn self | 4.337 | 0.000 | ||||||||
| Transfer: Bedfact (Levels 4, 5) | -1.654 | 0.000 | -1.736 | 0.000 | ||||||
| Eat: Unable to feed self | 1.392 | 0.000 | ||||||||
| Eat: Food tube/unable to take in nutrients (Levels 3-5) | 0.642 | 0.000 | ||||||||
| Amb: Needs device to walk | -1.086 | 0.000 | ||||||||
| Amb: Needs assistance to walk | 3.397 | 0.000 | -1.463 | 0.000 | ||||||
| Amb: Chairfast, Able to wheel | 2.884 | 0.000 | -2.074 | 0.000 | ||||||
| Amb: Chairfast, Unable to wheel | 4.133 | 0.000 | -2.706 | 0.000 | ||||||
| Amb: Bedfast | 4.841 | 0.000 | -2.681 | 0.000 | ||||||
| Elimination Status | ||||||||||
| Urinary incontinence during the night | 0.034 | 0.495 | -0.173 | 0.000 | 0.010 | 0.839 | -0.092 | 0.088 | -0.127 | 0.029 |
| Urinary incontinence during the day | -0.176 | 0.029 | -0.224 | 0.001 | -0.009 | 0.918 | -0.128 | 0.169 | -0.060 | 0.579 |
| Urinary incontinence during the night & day | -0.087 | 0.025 | -0.235 | 0.000 | -0.026 | 0.516 | -0.159 | 0.000 | -0.192 | 0.000 |
| Urinary catheter present | -0.257 | 0.000 | -0.380 | 0.000 | -0.243 | 0.000 | -0.366 | 0.000 | -0.383 | 0.000 |
| Bowel incontinent less than weekly | -0.201 | 0.006 | -0.099 | 0.104 | -0.204 | 0.008 | -0.028 | 0.746 | -0.210 | 0.022 |
| Bowel incontinent 1-3 times/week | -0.198 | 0.001 | -0.114 | 0.031 | -0.148 | 0.046 | -0.135 | 0.082 | -0.194 | 0.016 |
| Bowel incontinent 4-6 times/week | -0.385 | 0.000 | -0.277 | 0.000 | -0.392 | 0.000 | -0.488 | 0.000 | -0.184 | 0.095 |
| c statistic | -0.267 | 0.000 | -0.324 | 0.000 | -0.446 | 0.000 | -0.535 | 0.000 | -0.200 | 0.018 |
| Ostomy | 0.043 | 0.675 | 0.323 | 0.000 | -0.234 | 0.008 | -0.118 | 0.261 | 0.038 | 0.729 |
| Neuro/Emotional/Behavioral Status | ||||||||||
| Cog Func: Requires prompting | -0.080 | 0.053 | -0.056 | 0.062 | 0.019 | 0.634 | -0.077 | 0.089 | 0.031 | 0.540 |
| Cog Func: Requires assistance & some direction | -0.121 | 0.035 | -0.068 | 0.151 | 0.057 | 0.365 | -0.168 | 0.012 | 0.045 | 0.542 |
| Cog Func: Requires considerable assistance | -0.146 | 0.077 | -0.103 | 0.164 | 0.114 | 0.259 | -0.140 | 0.198 | 0.001 | 0.995 |
| Cog Func: Totally dependent | -0.395 | 0.007 | -0.298 | 0.028 | -0.404 | 0.051 | -0.818 | 0.003 | -0.240 | 0.191 |
| Conf Freq: In new situations | -0.007 | 0.846 | 0.018 | 0.488 | -0.108 | 0.002 | -0.076 | 0.062 | 0.028 | 0.526 |
| Conf Freq: Awakening at night | -0.065 | 0.467 | 0.036 | 0.627 | -0.273 | 0.005 | -0.201 | 0.056 | 0.003 | 0.980 |
| Conf Freq: Day/evenings, not constant | -0.074 | 0.199 | -0.014 | 0.766 | -0.233 | 0.000 | -0.336 | 0.000 | 0.019 | 0.793 |
| Conf Freq: Constantly | -0.211 | 0.024 | 0.034 | 0.690 | -0.332 | 0.003 | -0.525 | 0.000 | 0.186 | 0.132 |
| Anx Freq: Less than daily | -0.019 | 0.580 | 0.011 | 0.648 | 0.007 | 0.817 | 0.025 | 0.499 | 0.043 | 0.271 |
| Anx Freq: Daily but not constantly | -0.053 | 0.175 | 0.106 | 0.000 | 0.024 | 0.538 | 0.062 | 0.167 | 0.145 | 0.002 |
| Anx Freq: All the time | 0.054 | 0.606 | 0.166 | 0.028 | 0.019 | 0.856 | 0.059 | 0.619 | -0.080 | 0.475 |
| Verbal disruption | -0.153 | 0.108 | -0.001 | 0.987 | -0.154 | 0.166 | -0.412 | 0.000 | -0.176 | 0.124 |
| Depressive Feelings: Depressed mood | 0.031 | 0.375 | -0.045 | 0.064 | -0.033 | 0.337 | -0.068 | 0.072 | -0.102 | 0.010 |
| Depressive Feelings: Any other elements (2-6) | -0.079 | 0.296 | -0.067 | 0.269 | 0.086 | 0.299 | 0.044 | 0.625 | -0.062 | 0.514 |
| OUTCOME SPECIFIC RISK-ADJUSTERS | ||||||||||
| Obesity | 0.058 | 0.175 | -0.126 | 0.000 | -0.094 | 0.015 | -0.006 | 0.901 | -0.109 | 0.018 |
| Pain less often daily | 0.041 | 0.342 | -0.086 | 0.005 | 0.023 | 0.560 | 0.046 | 0.339 | -0.119 | 0.015 |
| Pain daily but not constantly | 0.013 | 0.698 | -0.052 | 0.016 | 0.090 | 0.003 | 0.121 | 0.001 | -0.053 | 0.139 |
| Pain all the time | 0.078 | 0.159 | -0.022 | 0.535 | 0.111 | 0.038 | 0.158 | 0.010 | -0.052 | 0.399 |
| Status Prior to Admission | ||||||||||
| Bath: Able w/use of devices | -0.151 | 0.001 | ||||||||
| Bath: Able w/partial assistance | -0.452 | 0.000 | ||||||||
| Bath: Requires assistance | -0.259 | 0.000 | ||||||||
| Bath: Unable, Bathed in bed/chair | -0.559 | 0.000 | ||||||||
| Bath: Totally dependent | -0.065 | 0.740 | ||||||||
| Groom: If utensils placed within reach | -0.452 | 0.000 | ||||||||
| Groom: With assistance | -0.424 | 0.000 | ||||||||
| Groom: Totally dependent | -0.410 | 0.011 | ||||||||
| Dress UB: Able if clothing out | ||||||||||
| Dress UB: Needs some help | ||||||||||
| Dress UB: Totally dependent | ||||||||||
| Dress LB: Able if laid out or given | ||||||||||
| Dress LB: Needs some help | ||||||||||
| Dress LB: Totally dependent | ||||||||||
| Toilet: Able when supervised | ||||||||||
| Toilet: Uses bedside commode | ||||||||||
| Toilet: Uses bedpan independently | ||||||||||
| Toilet: Totally dependent | ||||||||||
| Transfer: Able w/minimal assistance | -0.352 | 0.000 | ||||||||
| Transfer: Unable but pivots | -0.510 | 0.000 | ||||||||
| Transfer: Needs assistance | ||||||||||
| Transfer: Needs assistance/bedfast (Levels 3,4) | -0.457 | 0.000 | ||||||||
| Transfer: Bedfast (Levels 4,5) | ||||||||||
| Eat: Able with intermittent assistance | -0.658 | 0.000 | ||||||||
| Eat: Needs mechanical/personal assistance | -0.921 | 0.000 | ||||||||
| Amb: Needs device to walk | -0.674 | 0.000 | ||||||||
| Amb: Needs assistance to walk | -1.048 | 0.000 | ||||||||
| Amb: Chairfast, Able to wheel | -1.881 | 0.000 | ||||||||
| Amb: Chairfast, Unable wheel | -1.654 | 0.000 | ||||||||
| Amb: Bedfast | -1.074 | 0.000 | ||||||||
| Intercept | 1.472 | 0.000 | -0.389 | 0.000 | 1.307 | 0.000 | 3.774 | 0.000 | 3.019 | 0.000 |
| R2 statistic | 0.167 | 0.244 | 0.105 | 0.097 | 0.104 | |||||
| c statistic | 0.737 | 0.788 | 0.778 | 0.786 | 0.836 | |||||
TABLE 7a: Summary of Regression Models: Instruments Activities of Daily Living
| TABLE 7a. Summary of Regression Models: Instrumental Activities of Daily Living | |||||
|---|---|---|---|---|---|
| Risk-Adjusted in OBQI or HHQI | University of Colorado Model | Model 1 Clinical Core (Baseline Model) | Model 2 Adds Outcome-Specific | Model 3 Adds OASIS “Prior” Items | |
| IMPROVEMENT IN HOUSINGKEEPING | Yes | ||||
| Percent Who Could Improve: 68.6% | |||||
| Percent Improving Among Those Who Could: 44.2% | |||||
| Number of OASIS Items | 48 | 41 | 43 | 46a | |
| Number of OASIS Elements | 74 | 59 | 65 | 70 | |
| R2 statistic | 0.263 | 0.254 | 0.254 | 0.273 | |
| c statistic | 0.798 | 0.792 | 0.793 | 0.803 | |
| IMPROVEMENT IN LAUNDRY | Yes | ||||
| Percent Who Could Improve: 67.6% | |||||
| Percent Improving Among Those Who Could: 37.1% | |||||
| Number of OASIS Items | 47 | 41 | 43 | 46b | |
| Number of OASIS Elements | 76 | 59 | 65 | 70 | |
| R2 statistic | 0.264 | 0.220 | 0.221 | 0.246 | |
| c statistic | 0.805 | 0.779 | 0.779 | 0.794 | |
| IMPROVEMENT IN SHOPPING | Yes | ||||
| Percent Who Could Improve: 69.3% | |||||
| Percent Improving Among Those Who Could: 47.1% | |||||
| Number of OASIS Items | 46 | 41 | 43 | 46c | |
| Number of OASIS Elements | 64 | 59 | 65 | 70 | |
| R2 statistic | 0.226 | 0.204 | 0.204 | 0.222 | |
| c statistic | 0.775 | 0.759 | 0.760 | 0.772 | |
| IMPROVEMENT IN LIGHT MEAL PREPARATION | Yes | ||||
| Percent Who Could Improve: 50.9% | |||||
| Percent Improving Among Those Who Could: 52.4% | |||||
| Number of OASIS Items | 51 | 41 | 41 | 44d | |
| Number of OASIS Elements | 79 | 59 | 61 | 66 | |
| R2 statistic | 0.267 | 0.215 | 0.216 | 0.236 | |
| c statistic | 0.797 | 0.766 | 0.767 | 0.779 | |
| IMPROVEMENT IN TELEPHONE USE | Yes | ||||
| Percent Who Could Improve: 18.1% | |||||
| Percent Improving Among Those Who Could: 47.1% | |||||
| Number of OASIS Items | 70 | 41 | 41 | 44e | |
| Number of OASIS Elements | 97 | 59 | 61 | 66 | |
| R2 statistic | 0.124 | 0.106 | 0.106 | 0.116 | |
| c statistic | 0.702 | 0.686 | 0.687 | 0.695 | |
| IMPROVEMENT IN MEDICATION MANAGEMENT | Yes | ||||
| Percent Who Could Improve: 38.7% | |||||
| Percent Improving Among Those Who Could: 34.8% | |||||
| Number of OASIS Items | 48 | 41 | 41 | 44f | |
| Number of OASIS Elements | 76 | 59 | 61 | 66 | |
| R2 statistic | 0.180 | 0.132 | 0.133 | 0.157 | |
| c statistic | 0.754 | 0.718 | 0.720 | 0.737 | |
| STABILIZATION IN HOUSEKEEPING | Yes | ||||
| Percent Who Could Stabilize: 31.3% | |||||
| Percent Stabilized Among Those Who Could: 82.3% | |||||
| Number of OASIS Items | 50 | 41 | 43 | 46a | |
| Number of OASIS Elements | 71 | 59 | 65 | 70 | |
| R2 statistic | 0.110 | 0.088 | 0.089 | 0.095 | |
| c statistic | 0.721 | 0.699 | 0.699 | 0.706 | |
| STABILIZATION IN LAUNDRY | Yes | ||||
| Percent Who Could Stabilize: 17.2% | |||||
| Percent Stabilized Among Those Who Could: 83.1% | |||||
| Number of OASIS Items | 46 | 41 | 43 | 46b | |
| Number of OASIS Elements | 68 | 59 | 65 | 70 | |
| R2 statistic | 0.133 | 0.114 | 0.115 | 0.120 | |
| c statistic | 0.752 | 0.732 | 0.732 | 0.739 | |
| STABILIZATION IN SHOPPING | Yes | ||||
| Percent Who Could Stabilize: 44.1% | |||||
| Percent Stabilized Among Those Who Could: 89.2% | |||||
| Number of OASIS Items | 41 | 41 | 43 | 46c | |
| Number of OASIS Elements | 56 | 59 | 65 | 70 | |
| R2 statistic | 0.120 | 0.109 | 0.109 | 0.116 | |
| c statistic | 0.776 | 0.761 | 0.762 | 0.771 | |
| STABILIZATION IN LIGHT MEAL PREPARATION | Yes | ||||
| Percent Who Could Stabilize: 44.3% | |||||
| Percent Stabilized Among Those Who Could: 90.1% | |||||
| Number of OASIS Items | 43 | 41 | 41 | 44d | |
| Number of OASIS Elements | 69 | 59 | 61 | 66 | |
| R2 statistic | 0.118 | 0.086 | 0.086 | 0.091 | |
| c statistic | 0.777 | 0.735 | 0.736 | 0.742 | |
| STABILIZATION IN TELEPHONE USE | Yes | ||||
| Percent Who Could Stabilize: 66.7% | |||||
| Percent Stabilized Among Those Who Could: 92.6% | |||||
| Number of OASIS Items | 45 | 41 | 41 | 44e | |
| Number of OASIS Elements | 66 | 59 | 61 | 66 | |
| R2 statistic | 0.103 | 0.091 | 0.092 | 0.092 | |
| c statistic | 0.803 | 0.788 | 0.788 | 0.789 | |
| STABILIZATION IN MEDICATION MANAGEMENT | No | ||||
| Percent Who Could Stabilize: 54.8% | |||||
| Percent Stabilized Among Those Who Could: 91.7% | |||||
| Number of OASIS Items | N/A | 41 | 41 | 44f | |
| Number of OASIS Elements | 59 | 61 | 66 | ||
| R2 statistic | 0.064 | 0.064 | 0.066 | ||
| c statistic | 0.728 | 0.728 | 0.732 | ||
NOTES: “Percent Who Could Improve” calculated using all home health episodes, not just those discharged to the community. The smallest sample size for the IADL risk-adjustment models is 42,946. Shading indicates that CO model statistics are for multiple sub-models; we report the number of unique OASIS items and elements across all sub-models.
|
|||||
TABLE 7b: Final Alternative Risk-Adjustment Models for Instrumental Activities of Daily Living Outcomes
| TABLE 7b. Final Alternative Risk-Adjustment Models for Instrumental Activities of Daily Living Outcomes (Part I) | ||||||||||||
|---|---|---|---|---|---|---|---|---|---|---|---|---|
| Risk Factor Measured at SOC/ROC | Improvement in: | |||||||||||
| Housekeeping | Laundry | Shopping | Light Meal Prep. | Telephone Use | Medication Mgmt. | |||||||
| Full Model | Full Model | Full Model | Full Model | Full Model | Full Model | |||||||
| Coef. | p | Coef. | p | Coef. | p | Coef. | p | Coef. | p | Coef. | p | |
| DEMOGRAPHICS | ||||||||||||
| Age lt 65 | 0.052 | 0.018 | 0.075 | 0.016 | 0.124 | 0.000 | -0.113 | 0.002 | -0.120 | 0.000 | 0.014 | 0.660 |
| Age 75-84 | -0.024 | 0.111 | -0.019 | 0.368 | -0.105 | 0.000 | -0.055 | 0.022 | -0.053 | 0.017 | -0.182 | 0.000 |
| Age 85+ | -0.294 | 0.000 | -0.362 | 0.000 | -0.357 | 0.000 | -0.328 | 0.000 | -0.244 | 0.000 | -0.501 | 0.000 |
| Gender: female | 0.207 | 0.000 | 0.239 | 0.000 | -0.073 | 0.000 | 0.199 | 0.000 | 0.060 | 0.000 | 0.089 | 0.000 |
| SOCIOECONOMIC FACTORS | ||||||||||||
| Any Medicaid | -0.136 | 0.000 | -0.173 | 0.000 | -0.104 | 0.000 | -0.171 | 0.000 | -0.211 | 0.000 | -0.127 | 0.000 |
| Medicare HMO | -0.196 | 0.000 | -0.314 | 0.000 | -0.207 | 0.000 | -0.174 | 0.000 | 0.084 | 0.001 | -0.038 | 0.129 |
| PRIOR SERVICE USE | ||||||||||||
| Discharged past 14 days: | ||||||||||||
| Discharge from hospital | 0.319 | 0.000 | 0.304 | 0.000 | 0.281 | 0.000 | 0.381 | 0.000 | 0.351 | 0.000 | 0.317 | 0.000 |
| Discharge from rehab facility | 0.405 | 0.000 | 0.336 | 0.000 | 0.328 | 0.000 | 0.517 | 0.000 | 0.500 | 0.000 | 0.409 | 0.000 |
| Discharge from nursing home | 0.308 | 0.000 | 0.260 | 0.000 | 0.218 | 0.000 | 0.395 | 0.000 | 0.297 | 0.000 | 0.203 | 0.000 |
| CLINICAL FACTORS | ||||||||||||
| Prognoses | ||||||||||||
| Overall prognosis good/fair | 0.319 | 0.000 | 0.275 | 0.000 | 0.337 | 0.000 | 0.268 | 0.000 | 0.213 | 0.000 | 0.271 | 0.000 |
| Rehabilitation prognosis good | 0.285 | 0.000 | 0.341 | 0.000 | 0.282 | 0.000 | 0.225 | 0.000 | 0.086 | 0.000 | 0.150 | 0.000 |
| Diagnoses | ||||||||||||
| Diabetes (PPS Group) | -0.067 | 0.000 | -0.041 | 0.064 | 0.017 | 0.419 | -0.053 | 0.029 | 0.031 | 0.107 | -0.080 | 0.000 |
| Orthopedic (PPS Group) | 0.067 | 0.000 | -0.017 | 0.373 | 0.025 | 0.164 | 0.129 | 0.000 | 0.137 | 0.000 | 0.062 | 0.000 |
| Neurological (PPS Group) | -0.096 | 0.000 | -0.155 | 0.000 | -0.016 | 0.483 | -0.132 | 0.000 | -0.088 | 0.000 | -0.255 | 0.000 |
| Wound/Burn (PPS Group) | -0.051 | 0.063 | 0.015 | 0.703 | -0.032 | 0.404 | -0.133 | 0.003 | -0.062 | 0.097 | -0.080 | 0.041 |
| Cancer | -0.219 | 0.000 | -0.242 | 0.000 | -0.185 | 0.000 | -0.304 | 0.000 | -0.182 | 0.000 | -0.123 | 0.000 |
| Mental condition | 0.012 | 0.710 | 0.092 | 0.041 | 0.095 | 0.024 | -0.022 | 0.653 | 0.015 | 0.665 | -0.244 | 0.000 |
| Dementia | -0.115 | 0.004 | -0.256 | 0.000 | -0.252 | 0.000 | -0.300 | 0.000 | -0.149 | 0.000 | -0.441 | 0.000 |
| Hypertension | 0.032 | 0.016 | 0.055 | 0.004 | 0.030 | 0.099 | 0.056 | 0.009 | 0.009 | 0.599 | 0.085 | 0.000 |
| Ischemia | 0.024 | 0.199 | -0.025 | 0.339 | 0.052 | 0.038 | 0.048 | 0.114 | 0.004 | 0.888 | 0.039 | 0.088 |
| Arrhythmia | 0.073 | 0.000 | 0.028 | 0.361 | 0.050 | 0.076 | 0.078 | 0.020 | 0.022 | 0.416 | -0.055 | 0.031 |
| Heart failure | -0.094 | 0.000 | -0.123 | 0.000 | -0.059 | 0.018 | -0.024 | 0.404 | 0.012 | 0.585 | -0.083 | 0.000 |
| COPD | -0.165 | 0.000 | -0.148 | 0.000 | -0.118 | 0.000 | -0.038 | 0.220 | 0.084 | 0.001 | 0.067 | 0.005 |
| Skin ulcer | -0.069 | 0.015 | -0.032 | 0.433 | -0.055 | 0.154 | -0.162 | 0.000 | -0.062 | 0.095 | -0.089 | 0.021 |
| Orthopedic (other than PPS) | 0.133 | 0.000 | 0.154 | 0.000 | 0.070 | 0.001 | 0.171 | 0.000 | 0.106 | 0.000 | 0.149 | 0.000 |
| Incontinence | -0.125 | 0.006 | -0.040 | 0.575 | -0.067 | 0.272 | -0.110 | 0.095 | -0.159 | 0.000 | -0.078 | 0.134 |
| Symptoms, signs, & ill-defined conditions | 0.008 | 0.684 | -0.014 | 0.654 | -0.009 | 0.744 | -0.002 | 0.948 | -0.025 | 0.277 | -0.133 | 0.000 |
| Diagnosis Severity | ||||||||||||
| Number of severity ratings >2 | 0.036 | 0.000 | 0.048 | 0.000 | 0.036 | 0.000 | 0.034 | 0.000 | 0.046 | 0.000 | 0.049 | 0.000 |
| Sensory Status | ||||||||||||
| Partially vision impaired | -0.103 | 0.000 | -0.086 | 0.000 | -0.091 | 0.000 | -0.138 | 0.000 | -0.096 | 0.000 | -0.070 | 0.000 |
| Severely vision impaired | -0.440 | 0.000 | -0.442 | 0.000 | -0.423 | 0.000 | -0.332 | 0.000 | -0.450 | 0.000 | -0.518 | 0.000 |
| Speech: Minimum difficulty | -0.022 | 0.203 | 0.004 | 0.864 | 0.015 | 0.520 | -0.085 | 0.001 | -0.167 | 0.000 | -0.093 | 0.000 |
| Speech: Moderate difficulty | -0.123 | 0.000 | -0.124 | 0.021 | -0.205 | 0.000 | -0.230 | 0.000 | -0.416 | 0.000 | -0.240 | 0.000 |
| Speech: Severe difficulty | -0.403 | 0.000 | -0.387 | 0.000 | -0.676 | 0.000 | -0.593 | 0.000 | -1.004 | 0.000 | -0.687 | 0.000 |
| Integumentary Status | ||||||||||||
| Surgical wound present | 0.269 | 0.000 | 0.270 | 0.000 | 0.267 | 0.000 | 0.457 | 0.000 | 0.209 | 0.000 | 0.421 | 0.000 |
| Stage of most problematic pressure ulcer | -0.129 | 0.000 | -0.167 | 0.000 | -0.125 | 0.000 | -0.133 | 0.000 | -0.076 | 0.000 | -0.093 | 0.000 |
| Status of most problematic stasis ulcer | -0.084 | 0.000 | -0.073 | 0.006 | -0.085 | 0.000 | -0.070 | 0.018 | -0.004 | 0.846 | 0.029 | 0.225 |
| Functional Status/Physical Functioning | ||||||||||||
| ADL/IADL index | -0.232 | 0.000 | -0.258 | 0.000 | -0.184 | 0.000 | -0.214 | 0.000 | -0.070 | 0.000 | -0.094 | 0.000 |
| Hous: Light tasks only | ||||||||||||
| Hous: Intermittent assistance | 2.962 | 0.000 | ||||||||||
| Hous: Usually requires assistance | 3.273 | 0.000 | ||||||||||
| Hous: Totally dependent | 3.558 | 0.000 | ||||||||||
| Laun: Light laundry only | ||||||||||||
| Laun: Totally dependent | 2.612 | 0.000 | ||||||||||
| Shop: Needs some assistance | ||||||||||||
| Shop: Only if delivered | 2.539 | 0.000 | ||||||||||
| Shop: Totally dependent | 3.674 | 0.000 | ||||||||||
| Lt Meal: Able, but not regularly | ||||||||||||
| Lt Meal: Totally dependent | 1.108 | 0.000 | ||||||||||
| Phon: Able, with adapted phone | ||||||||||||
| Phon: Answers, but has trouble calling | 0.283 | 0.000 | ||||||||||
| Phon: Sometimes answers/limited conversation | 0.698 | 0.000 | ||||||||||
| Phon: Can listen with assistive device | 0.906 | 0.000 | ||||||||||
| Phon: Totally dependent | 1.386 | 0.000 | ||||||||||
| Oral Med: Able if prepared | ||||||||||||
| Oral Med: Totally dependent | 1.260 | 0.000 | ||||||||||
| Elimination Status | ||||||||||||
| Urinary incontinence during the night | -0.007 | 0.752 | -0.091 | 0.007 | -0.027 | 0.377 | -0.046 | 0.195 | -0.087 | 0.001 | -0.060 | 0.032 |
| Urinary incontinence during the day | -0.128 | 0.002 | -0.192 | 0.003 | -0.226 | 0.000 | -0.129 | 0.040 | -0.244 | 0.000 | -0.157 | 0.001 |
| Urinary incontinence during the night & day | -0.141 | 0.000 | -0.212 | 0.000 | -0.166 | 0.000 | -0.172 | 0.000 | -0.170 | 0.000 | -0.151 | 0.000 |
| Urinary catheter present | -0.182 | 0.000 | -0.135 | 0.005 | -0.148 | 0.001 | -0.267 | 0.000 | -0.238 | 0.000 | -0.176 | 0.000 |
| Bowel incontinent less than weekly | -0.065 | 0.102 | 0.007 | 0.910 | -0.016 | 0.772 | -0.038 | 0.522 | -0.032 | 0.373 | -0.052 | 0.254 |
| Bowel incontinent 1-3 times/week | -0.208 | 0.000 | -0.059 | 0.359 | -0.104 | 0.047 | -0.112 | 0.043 | -0.165 | 0.000 | -0.212 | 0.000 |
| Bowel incontinent 4-6 times/week | -0.383 | 0.000 | -0.295 | 0.009 | -0.346 | 0.000 | -0.338 | 0.000 | -0.247 | 0.000 | -0.351 | 0.000 |
| Bowel incontinent daily or more often | -0.379 | 0.000 | -0.347 | 0.000 | -0.386 | 0.000 | -0.388 | 0.000 | -0.351 | 0.000 | -0.436 | 0.000 |
| Ostomy | 0.063 | 0.126 | 0.065 | 0.275 | 0.008 | 0.887 | -0.093 | 0.167 | 0.030 | 0.618 | 0.045 | 0.430 |
| Neuro/Emotional/Behavioral Status | ||||||||||||
| Cog Func: Requires prompting | -0.011 | 0.546 | -0.022 | 0.425 | -0.047 | 0.067 | -0.059 | 0.038 | -0.100 | 0.000 | -0.189 | 0.000 |
| Cog Func: Requires assistance & some direction | -0.066 | 0.038 | -0.078 | 0.125 | -0.162 | 0.000 | -0.172 | 0.000 | -0.146 | 0.000 | -0.310 | 0.000 |
| Cog Func: Requires considerable assistance | -0.106 | 0.066 | -0.432 | 0.000 | -0.558 | 0.000 | -0.158 | 0.048 | -0.167 | 0.000 | -0.458 | 0.000 |
| Cog Func: Totally dependent | -0.498 | 0.002 | -1.030 | 0.019 | -1.173 | 0.000 | -0.627 | 0.004 | -0.479 | 0.000 | -0.961 | 0.000 |
| Conf Freq: In new situations | 0.003 | 0.834 | -0.020 | 0.395 | -0.029 | 0.185 | -0.127 | 0.000 | -0.063 | 0.003 | -0.193 | 0.000 |
| Conf Freq: Awakening at night | -0.022 | 0.647 | -0.246 | 0.002 | -0.205 | 0.002 | -0.178 | 0.012 | -0.137 | 0.002 | -0.304 | 0.000 |
| c statistic | -0.115 | 0.000 | -0.248 | 0.000 | -0.177 | 0.000 | -0.301 | 0.000 | -0.215 | 0.000 | -0.360 | 0.000 |
| Conf Freq: Constantly | -0.283 | 0.000 | -0.573 | 0.000 | -0.366 | 0.000 | -0.471 | 0.000 | -0.422 | 0.000 | -0.593 | 0.000 |
| Anx Freq: Less than daily | 0.030 | 0.041 | 0.059 | 0.006 | 0.058 | 0.004 | 0.056 | 0.017 | 0.046 | 0.012 | 0.073 | 0.000 |
| Anx Freq: Daily but not constantly | 0.039 | 0.030 | 0.110 | 0.000 | 0.061 | 0.012 | 0.127 | 0.000 | 0.136 | 0.000 | 0.165 | 0.000 |
| Anx Freq: All the time | 0.043 | 0.388 | 0.121 | 0.094 | 0.120 | 0.076 | 0.083 | 0.283 | 0.283 | 0.000 | 0.211 | 0.000 |
| Verbal disruption | -0.242 | 0.000 | -0.148 | 0.181 | -0.336 | 0.000 | -0.317 | 0.001 | -0.243 | 0.000 | -0.289 | 0.000 |
| Depressive Feelings: Depressed mood | -0.054 | 0.001 | -0.078 | 0.001 | -0.057 | 0.008 | -0.065 | 0.007 | 0.011 | 0.562 | -0.075 | 0.000 |
| Depressive Feelings: Any other elements (2-6) | -0.040 | 0.299 | -0.058 | 0.334 | -0.001 | 0.985 | -0.016 | 0.785 | 0.201 | 0.000 | -0.058 | 0.205 |
| OUTCOME SPECIFIC RISK-ADJUSTERS | ||||||||||||
| Obesity | -0.011 | 0.515 | -0.046 | 0.064 | -0.015 | 0.515 | ||||||
| Pain less often daily | 0.004 | 0.827 | 0.056 | 0.051 | 0.056 | 0.033 | ||||||
| Pain daily but not constantly | 0.056 | 0.000 | 0.080 | 0.000 | 0.041 | 0.031 | ||||||
| Pain all the time | 0.003 | 0.894 | 0.032 | 0.327 | -0.011 | 0.736 | ||||||
| Memory deficit | -0.092 | 0.000 | -0.137 | 0.001 | -0.115 | 0.001 | -0.156 | 0.000 | -0.059 | 0.004 | -0.227 | 0.000 |
| Impaired decision making | -0.022 | 0.401 | -0.060 | 0.166 | -0.024 | 0.515 | -0.056 | 0.134 | -0.050 | 0.016 | -0.013 | 0.638 |
| Status Prior to Admission | ||||||||||||
| Hous: Light tasks only | -0.288 | 0.000 | ||||||||||
| Hous: Intermittent assistance | -0.466 | 0.000 | ||||||||||
| Hous: Usually requires assistance | -0.774 | 0.000 | ||||||||||
| Hous: Totally dependent | -0.979 | 0.000 | ||||||||||
| Laun: Light laundry only | -0.318 | 0.000 | ||||||||||
| Laun: Totally dependent | -1.008 | 0.000 | ||||||||||
| Shop: Needs some assistance | -0.225 | 0.000 | ||||||||||
| Shop: Only if delivered | -0.744 | 0.000 | ||||||||||
| Shop: Totally dependent | -0.905 | 0.000 | ||||||||||
| Lt Meal: Able, but not regularly | -0.671 | 0.000 | ||||||||||
| Lt Meal: Totally dependent | -0.933 | 0.000 | ||||||||||
| Phon: Able, with adapted phone | -0.429 | 0.000 | ||||||||||
| Phon: Answers, but has trouble calling | -0.578 | 0.000 | ||||||||||
| Phon: Sometimes answers/limited conversation | -0.623 | 0.000 | ||||||||||
| Phon: Can listen with assistive device | -0.729 | 0.000 | ||||||||||
| Phon: Totally dependent | -0.952 | 0.000 | ||||||||||
| Oral Med: Able if prepared | -0.756 | 0.000 | ||||||||||
| Oral Med: Totally dependent | -0.995 | 0.000 | ||||||||||
| Impaired decision making prior 2 weeks | -0.040 | 0.106 | -0.191 | 0.022 | -0.085 | 0.013 | -0101 | 0.005 | -0.057 | 0.007 | -0.171 | 0.000 |
| Memory loss prior 2 weeks | -0.199 | 0.000 | -0.175 | 0.000 | -0.184 | 0.000 | -0.136 | 0.001 | -0.098 | 0.000 | -0.190 | 0.000 |
| Intercept | -1.803 | 0.000 | -1.238 | 0.000 | -1.728 | 0.000 | 1.132 | 0.000 | 0.619 | 0.000 | 0.206 | 0.000 |
| R2 statistic | 0.273 | 0.246 | 0.222 | 0.236 | 0.116 | 0.157 | ||||||
| c statistic | 0.803 | 0.794 | 0.772 | 0.779 | 0.695 | 0.737 | ||||||
| TABLE 7b. Final Alternative Risk-Adjustment Models for Instrumental Activities of Daily Living Outcomes (Part II) | ||||||||||||
|---|---|---|---|---|---|---|---|---|---|---|---|---|
| Risk Factor Measured at SOC/ROC | Stabilization in: | |||||||||||
| Housekeeping | Laundry | Shopping | Light Meal Prep. | Telephone Use | Medication Mgmt. | |||||||
| Full Model | Full Model | Full Model | Full Model | Full Model | Full Model | |||||||
| Coef. | p | Coef. | p | Coef. | p | Coef. | p | Coef. | p | Coef. | p | |
| DEMOGRAPHICS | ||||||||||||
| Age lt 65 | 0.124 | 0.001 | 0.124 | 0.018 | 0.339 | 0.000 | 0.088 | 0.003 | 0.170 | 0.000 | 0.294 | 0.000 |
| Age 75-84 | -0.080 | 0.002 | -0.086 | 0.017 | -0.043 | 0.260 | -0.066 | 0.001 | -0.194 | 0.000 | -0.290 | 0.000 |
| Age 85+ | -0.205 | 0.000 | -0.271 | 0.000 | -0.314 | 0.000 | -0.321 | 0.000 | -0.599 | 0.000 | -0.662 | 0.000 |
| Gender: female | 0.277 | 0.000 | 0.318 | 0.000 | 0.083 | 0.010 | 0.368 | 0.000 | 0.162 | 0.000 | 0.270 | 0.000 |
| SOCIOECONOMIC FACTORS | ||||||||||||
| Any Medicaid | 0.016 | 0.662 | 0.026 | 0.602 | 0.067 | 0.206 | -0.170 | 0.000 | -0.127 | 0.001 | -0.050 | 0.203 |
| Medicare HMO | -0.192 | 0.000 | -0.278 | 0.000 | -0.191 | 0.000 | -0.211 | 0.000 | -0.010 | 0.756 | -0.153 | 0.000 |
| PRIOR SERVICE USE | ||||||||||||
| Discharged past 14 days: | ||||||||||||
| Discharge from hospital | 0.036 | 0.132 | -0.057 | 0.081 | 0.005 | 0.883 | 0.161 | 0.000 | 0.207 | 0.000 | 0.159 | 0.000 |
| Discharge from rehab facility | 0.085 | 0.016 | -0.082 | 0.114 | -0.079 | 0.117 | 0.201 | 0.000 | 0.178 | 0.000 | 0.102 | 0.004 |
| Discharge from nursing home | 0.101 | 0.011 | -0.047 | 0.422 | 0.057 | 0.329 | 0.228 | 0.000 | 0.103 | 0.006 | 0.043 | 0.283 |
| CLINICAL FACTORS | ||||||||||||
| Prognoses | ||||||||||||
| Overall prognosis good/fair | 0.207 | 0.000 | 0.223 | 0.004 | 0.319 | 0.000 | 0.262 | 0.000 | 0.335 | 0.000 | 0.360 | 0.000 |
| Rehabilitation prognosis good | 0.258 | 0.000 | 0.268 | 0.000 | 0.118 | 0.008 | 0.224 | 0.000 | 0.143 | 0.000 | 0.157 | 0.000 |
| Diagnoses | ||||||||||||
| Diabetes (PPS Group) | -0.075 | 0.003 | -0.023 | 0.523 | -0.035 | 0.361 | -0.034 | 0.081 | -0.035 | 0.183 | -0.136 | 0.000 |
| Orthopedic (PPS Group) | 0.028 | 0.237 | -0.072 | 0.033 | 0.064 | 0.066 | 0.074 | 0.000 | 0.168 | 0.000 | 0.139 | 0.000 |
| Neurological (PPS Group) | -0.079 | 0.008 | -0.101 | 0.025 | -0.0056 | 0.195 | -0.177 | 0.000 | -0.192 | 0.000 | -0.337 | 0.000 |
| Wound/Burn (PPS Group) | -0.051 | 0.279 | -0.006 | 0.919 | -0.101 | 0.145 | -0.121 | 0.001 | -0.096 | 0.055 | -0.045 | 0.374 |
| Cancer | -0.293 | 0.000 | -0.302 | 0.00 | -0.428 | 0.000 | -0.410 | 0.000 | -0.396 | 0.000 | -0.290 | 0.000 |
| Mental condition | 0.095 | 0.060 | 0.081 | 0.249 | 0.132 | 0.091 | -0.128 | 0.001 | -0.051 | 0.308 | -0.258 | 0.000 |
| Dementia | -0.068 | 0.316 | -0.400 | 0.000 | -0.058 | 0.573 | -0.327 | 0.000 | -0.441 | 0.000 | -0.645 | 0.000 |
| Hypertension | 0.058 | 0.012 | -0.026 | 0.408 | 0.011 | 0.754 | 0.109 | 0.000 | 0.037 | 0.116 | 0.097 | 0.000 |
| Ischemia | 0.070 | 0.032 | -0.017 | 0.703 | 0.042 | 0.391 | 0.101 | 0.000 | 0.199 | 0.000 | 0.003 | 0.934 |
| Arrhythmia | 0.054 | 0.137 | 0.033 | 0.515 | 0.100 | 0.073 | 0.110 | 0.000 | -0.018 | 0.604 | -0.079 | 0.033 |
| Heart failure | -0.046 | 0.140 | -0.098 | 0.028 | -0.051 | 0.259 | -0.046 | 0.042 | -0.046 | 0.123 | -0.059 | 0.060 |
| COPD | -0.156 | 0.000 | -0.185 | 0.000 | -0.050 | 0.317 | -0.008 | 0.735 | 0.111 | 0.001 | 0.100 | 0.004 |
| Skin ulcer | -0.036 | 0.437 | 0.032 | 0.598 | -0.047 | 0.499 | -0.060 | 0.087 | -0.084 | 0.085 | -0.074 | 0.135 |
| Orthopedic (other than PPS) | 0.159 | 0.000 | 0.112 | 0.003 | 0.159 | 0.000 | 0.220 | 0.000 | 0.306 | 0.000 | 0.329 | 0.000 |
| Incontinence | -0.018 | 0.838 | 0.162 | 0.226 | -0.035 | 0.756 | -0.079 | 0.178 | -0.124 | 0.035 | -0.143 | 0.055 |
| Symptoms, signs, & ill-defined conditions | 0.033 | 0.354 | 0.005 | 0.930 | 0.083 | 0.117 | -0.002 | 0.930 | -0.053 | 0.105 | -0.089 | 0.012 |
| Diagnosis Severity | ||||||||||||
| Number of severity ratings >2 | 0.003 | 0.669 | 0.026 | 0.026 | -0.010 | 0.383 | 0.012 | 0.045 | 0.003 | 0.675 | 0.008 | 0.324 |
| Sensory Status | ||||||||||||
| Partially vision impaired | -0.057 | 0.022 | -0.040 | 0.272 | -0.012 | 0.746 | -0.096 | 0.000 | -0.173 | 0.000 | -0.011 | 0.956 |
| Severely vision impaired | -0.346 | 0.000 | -0.273 | 0.013 | -0.462 | 0.000 | -0.411 | 0.000 | -0.801 | 0.000 | -0.444 | 0.000 |
| Speech: Minimum difficulty | -0.031 | 0.297 | -0.015 | 0.732 | -0.059 | 0.167 | -0.093 | 0.000 | -0.294 | 0.000 | -0.131 | 0.000 |
| Speech: Moderate difficulty | -0.095 | 0.116 | -0.098 | 0.340 | -0.315 | 0.000 | -0.167 | 0.000 | -0.551 | 0.000 | -0.275 | 0.000 |
| Speech: Severe difficulty | -0.169 | 0.077 | -0.154 | 0.383 | -0.490 | 0.000 | -0.459 | 0.000 | -1.254 | 0.000 | -0.791 | 0.000 |
| Integumentary Status | ||||||||||||
| Surgical wound present | 0.236 | 0.000 | 0.140 | 0.000 | 0.335 | 0.000 | 0.400 | 0.000 | 0.552 | 0.000 | 0.598 | 0.000 |
| Stage of most problematic pressure ulcer | -0.159 | 0.000 | -0.103 | 0.004 | -0.112 | 0.001 | -0.106 | 0.000 | -0.079 | 0.000 | -0.102 | 0.000 |
| Status of most problematic stasis ulcer | -0.041 | 0.125 | 0.016 | 0.645 | -0.016 | 0.695 | -0.014 | 0.472 | 0.028 | 0.345 | 0.044 | 0.132 |
| Functional Status/Physical Functioning | ||||||||||||
| ADL/IADL index | -0.227 | 0.000 | -0.269 | 0.000 | -0.226 | 0.000 | -0.274 | 0.000 | -0.201 | 0.000 | -0.190 | 0.000 |
| Hous: Light tasks only | 2.000 | 0.000 | ||||||||||
| Hous: Intermittent assistance | 2.354 | 0.000 | ||||||||||
| Hous: Usually requires assistance | 2.960 | 0.000 | ||||||||||
| Hous: Totally dependent | ||||||||||||
| Laun: Light laundry only | 2.181 | 0.000 | ||||||||||
| Laun: Totally dependent | ||||||||||||
| Shop: Needs some assistance | 2.142 | 0.000 | ||||||||||
| Shop: Only if delivered | 4.017 | 0.000 | ||||||||||
| Shop: Totally dependent | ||||||||||||
| Lt Meal: Able, but not regularly | 1.738 | 0.000 | ||||||||||
| Lt Meal: Totally dependent | ||||||||||||
| Phon: Able, with adapted phone | -0.006 | 0.932 | ||||||||||
| Phon: Answers, but has trouble calling | 0.538 | 0.000 | ||||||||||
| Phon: Sometimes answers/limited conversation | 1.133 | 0.000 | ||||||||||
| Phon: Can listen with assistive device | 1.434 | 0.000 | ||||||||||
| Phon: Totally dependent | ||||||||||||
| Oral Med: Able if prepared | 1.438 | 0.000 | ||||||||||
| Oral Med: Totally dependent | ||||||||||||
| Elimination Status | ||||||||||||
| Urinary incontinence during the night | 0.030 | 0.456 | 0.035 | 0.552 | -0.080 | 0.157 | 0.017 | 0.557 | -0.079 | 0.029 | -0.065 | 0.102 |
| Urinary incontinence during the day | 0.058 | 0.440 | -0.176 | 0.120 | -0.166 | 0.095 | -0.091 | 0.080 | -0.168 | 0.004 | -0.093 | 0.200 |
| Urinary incontinence during the night & day | -0.042 | 0.205 | 0.067 | 0.177 | -0.055 | 0.235 | 0.022 | 0.351 | -0.047 | 0.101 | -0.026 | 0.417 |
| Urinary catheter present | -0.081 | 0.154 | -0.045 | 0.572 | -0.003 | 0.966 | -0.039 | 0.343 | -0.094 | 0.061 | 0.126 | 0.028 |
| Bowel incontinent less than weekly | -0.291 | 0.000 | -0.193 | 0.085 | -0.169 | 0.074 | -0.073 | 0.154 | -0.004 | 0.946 | -0.099 | 0.150 |
| Bowel incontinent 1-3 times/week | -0.097 | 0.205 | -0.104 | 0.397 | -0.129 | 0.186 | -0.049 | 0.349 | -0.056 | 0.257 | -0.110 | 0.108 |
| Bowel incontinent 4-6 times/week | -0.351 | 0.009 | -0.521 | 0.019 | -0.254 | 0.114 | -0.345 | 0.000 | -0.184 | 0.014 | -0.184 | 0.113 |
| Bowel incontinent daily or more often | -0.302 | 0.002 | -0.287 | 0.067 | -0.304 | 0.010 | -0.268 | 0.000 | -0.422 | 0.000 | -0.339 | 0.000 |
| Ostomy | 0.034 | 0.641 | -0.018 | 0.859 | -0.035 | 0.738 | 0.017 | 0.761 | 0.019 | 0.806 | 0.087 | 0.261 |
| Neuro/Emotional/Behavioral Status | ||||||||||||
| Cog Func: Requires prompting | 0.004 | 0.907 | 0.059 | 0.223 | -0.053 | 0.254 | -0.032 | 0.179 | -0.285 | 0.000 | -0.179 | 0.000 |
| Cog Func: Requires assistance & some direction | -0.029 | 0.606 | 0.163 | 0.077 | -0.134 | 0.109 | -0.042 | 0.300 | -0.319 | 0.000 | -0.201 | 0.001 |
| Cog Func: Requires considerable assistance | 0.277 | 0.021 | -0.089 | 0.708 | 0.036 | 0.846 | 0.038 | 0.654 | -0.293 | 0.000 | -0.008 | 0.952 |
| Cog Func: Totally dependent | -0.637 | 0.127 | -10.843 | 0.897 | -0.585 | 0.501 | -0.488 | 0.141 | -0.249 | 0.199 | -0.073 | 0.864 |
| Conf Freq: In new situations | 0.004 | 0.888 | 0.009 | 0.818 | -0.030 | 0.456 | -0.110 | 0.000 | -0.265 | 0.000 | -0.213 | 0.000 |
| Conf Freq: Awakening at night | -0.124 | 0.166 | 0.063 | 0.673 | -0.247 | 0.034 | -0.217 | 0.001 | -0.414 | 0.000 | -0.466 | 0.000 |
| c statistic | -0.213 | 0.000 | -0.212 | 0.021 | -0.350 | 0.000 | -0.345 | 0.000 | -0.498 | 0.000 | -0.651 | 0.000 |
| Conf Freq: Constantly | -0.294 | 0.033 | -0.071 | 0.801 | -0.740 | 0.001 | -0.735 | 0.000 | -0.636 | 0.000 | -0.794 | 0.000 |
| Anx Freq: Less than daily | 0.044 | 0.084 | 0.059 | 0.105 | 0.013 | 0.739 | 0.090 | 0.000 | 0.137 | 0.000 | 0.057 | 0.032 |
| Anx Freq: Daily but not constantly | 0.050 | 0.128 | 0.049 | 0.291 | 0.068 | 0.155 | 0.146 | 0.000 | 0.165 | 0.000 | 0.113 | 0.001 |
| Anx Freq: All the time | 0.038 | 0.669 | 0.163 | 0.206 | -0.012 | 0.925 | 0.221 | 0.001 | 0.153 | 0.063 | 0.109 | 0.236 |
| Verbal disruption | -0.034 | 0.770 | 0.093 | 0.637 | -0.061 | 0.717 | 0.060 | 0.487 | -0.162 | 0.035 | -0.267 | 0.031 |
| Depressive Feelings: Depressed mood | -0.044 | 0.113 | -0.037 | 0.352 | -0.085 | 0.032 | -0.033 | 0.107 | 0.008 | 0.756 | -0.057 | 0.043 |
| Depressive Feelings: Any other elements (2-6) | 0.040 | 0.567 | 0.266 | 0.011 | 0.099 | 0.315 | 0.056 | 0.268 | 0.136 | 0.023 | 0.095 | 0.181 |
| OUTCOME SPECIFIC RISK-ADJUSTERS | ||||||||||||
| Obesity | 0.032 | 0.304 | -0.017 | 0.685 | 0.061 | 0.173 | ||||||
| Pain less often daily | 0.085 | 0.009 | 0.147 | 0.001 | -0.017 | 0.721 | ||||||
| Pain daily but not constantly | 0.084 | 0.000 | 0.077 | 0.019 | 0.103 | 0.004 | ||||||
| Pain all the time | 0.027 | 0.522 | -0.020 | 0.727 | -0.002 | 0.969 | ||||||
| Memory deficit | -0.107 | 0.025 | -0.087 | 0.281 | -0.032 | 0.641 | -0.196 | 0.000 | -0.122 | 0.000 | -0.031 | 0.558 |
| Impaired decision making | 0.023 | 0.652 | -0.138 | 0.114 | -0.056 | 0.427 | 0.040 | 0.265 | 0.040 | 0.253 | 0.027 | 0.607 |
| Status Prior to Admission | ||||||||||||
| Hous: Light tasks only | -0.360 | 0.000 | ||||||||||
| Hous: Intermittent assistance | -0.464 | 0.000 | ||||||||||
| Hous: Usually requires assistance | -0.634 | 0.000 | ||||||||||
| Hous: Totally dependent | -0.244 | 0.000 | ||||||||||
| Laun: Light laundry only | -0.505 | 0.000 | ||||||||||
| Laun: Totally dependent | -0.184 | 0.009 | ||||||||||
| Shop: Needs some assistance | -0.312 | 0.000 | ||||||||||
| Shop: Only if delivered | -0.810 | 0.000 | ||||||||||
| Shop: Totally dependent | -0.325 | 0.001 | ||||||||||
| Lt Meal: Able, but not regularly | -0.549 | 0.000 | ||||||||||
| Lt Meal: Totally dependent | -0.101 | 0.025 | ||||||||||
| Phon: Able, with adapted phone | 0.109 | 0.134 | ||||||||||
| Phon: Answers, but has trouble calling | -0.172 | 0.004 | ||||||||||
| Phon: Sometimes answers/limited conversation | -0.112 | 0.129 | ||||||||||
| Phon: Can listen with assistive device | -0.165 | 0.094 | ||||||||||
| Phon: Totally dependent | -0.140 | 0.430 | ||||||||||
| Oral Med: Able if prepared | -0.406 | 0.000 | ||||||||||
| Oral Med: Totally dependent | -0.088 | 0.188 | ||||||||||
| Impaired decision making prior 2 weeks | -0.084 | 0.062 | -0.002 | 0.975 | -0.067 | 0.301 | -0.113 | 0.000 | -0.078 | 0.021 | -0.238 | 0.000 |
| Memory loss prior 2 weeks | -0.255 | 0.000 | -0.403 | 0.000 | -0.145 | 0.045 | -0.264 | 0.000 | -0.196 | 0.000 | -0.360 | 0.000 |
| Intercept | 0.022 | 0.746 | 0.347 | 0.000 | -0.027 | 0.796 | 2.236 | 0.000 | 3.729 | 0.000 | 2.628 | 0.000 |
| R2 statistic | 0.095 | 0.120 | 0.116 | 0.091 | 0.092 | 0.066 | ||||||
| c statistic | 0.706 | 0.739 | 0.771 | 0.742 | 0.789 | 0.732 | ||||||
TABLE 8a: Summary of Regression Models: Physiologic Measures
| TABLE 8a. Summary of Regression Models: Physiologic Measures | |||||
|---|---|---|---|---|---|
| Risk-Adjusted in OBQI or HHQI | University of Colorado Model | Model 1 Clinical Core (Baseline Model) | Model 2 Adds Outcome-Specific | Model 3 Adds OASIS “Prior” Items | |
| IMPROVEMENT IN PAIN | Yes | ||||
| Percent Who Could Improve: 44.4% | |||||
| Percent Improving Among Those Who Could: 56.2% | |||||
| Number of OASIS Items | 40 | 42 | 43 | 45a | |
| Number of OASIS Elements | 65 | 60 | 61 | 64 | |
| R2 statistic | 0.065 | 0.053 | 0.056 | 0.058 | |
| c statistic | 0.643 | 0.630 | 0.633 | 0.635 | |
| IMPROVEMENT IN NUMBER OF SURGICAL WOUNDS | No | ||||
| Percent Who Could Improve: 21.9% | |||||
| Percent Improving Among Those Who Could: 59.3% | |||||
| Number of OASIS Items | N/A | 42 | |||
| Number of OASIS Elements | 60 | ||||
| R2 statistic | 0.047 | ||||
| c statistic | 0.627 | ||||
| IMPROVEMENT IN STATUS OF SUGICAL WOUNDS | No | ||||
| Percent Who Could Improve: 22.9% | |||||
| Percent Improving Among Those Who Could: 75.0% | |||||
| Number of OASIS Items | N/A | 42 | |||
| Number of OASIS Elements | 60 | ||||
| R2 statistic | 0.065 | ||||
| c statistic | 0.670 | ||||
| IMPROVEMENT IN DYSPNEA | Yes | ||||
| Percent Who Could Improve: 44.2% | |||||
| Percent Improving Among Those Who Could: 53.3% | |||||
| Number of OASIS Items | 57 | 42 | 44 | b | |
| Number of OASIS Elements | 85 | 60 | 66 | ||
| R2 statistic | 0.114 | 0.098 | 0.110 | ||
| c statistic | 0.695 | 0.680 | 0.690 | ||
| IMPROVEMENT IN URINARY TRACT INFECTION | Yes | ||||
| Percent Who Could Improve: 6.0% | |||||
| Percent Improving Among Those Who Could: 83.7% | |||||
| Number of OASIS Items | 18 | 41 | 43 | 45c | |
| Number of OASIS Elements | 32 | 59 | 63 | 67 | |
| R2 statistic | 0.121 | 0.048 | 0.059 | 0.059 | |
| c statistic | 0.740 | 0.658 | 0.665 | 0.665 | |
| IMPROVEMENT IN URINARY INCONTINENCE | Yes | ||||
| Percent Who Could Improve: 20.7% | |||||
| Percent Improving Among Those Who Could: 49.0% | |||||
| Number of OASIS Items | 53 | 41 | 43 | 46d | |
| Number of OASIS Elements | 55 | 59 | 65 | 72 | |
| R2 statistic | 0.119 | 0.088 | 0.092 | 0.103 | |
| c statistic | 0.696 | 0.667 | 0.670 | 0.682 | |
| IMPROVEMENT IN BOWEL INCONTINENCE | Yes | ||||
| Percent Who Could Improve: 7.0% | |||||
| Percent Improving Among Those Who Could: 59.1% | |||||
| Number of OASIS Items | 37 | 41 | 43 | 46d | |
| Number of OASIS Elements | 55 | 59 | 65 | 72 | |
| R2 statistic | 0.141 | 0.117 | 0.126 | 0.131 | |
| c statistic | 0.719 | 0.700 | 0.707 | 0.711 | |
| IMPROVEMENT IN SPEECH | No | ||||
| Percent Who Could Improve: 21.2$ | |||||
| Percent Improving Among Those Who Could: 43.3% | |||||
| Number of OASIS Items | N/A | 41 | |||
| Number of OASIS Elements | 59 | ||||
| R2 statistic | 0.080 | ||||
| c statistic | 0.665 | ||||
| STABILIZATION IN SPEECH | No | ||||
| Percent Who Could Stabilize: 70.0% | |||||
| Percent Stabilized Among Those Who Could: 91.0% | |||||
| Number of OASIS Items | N/A | 41 | |||
| Number of OASIS Elements | 59 | ||||
| R2 statistic | 0.085 | ||||
| c statistic | 0.742 | ||||
NOTES: “Percent Who Could Improve” calculated using all home health episodes, not just those discharged to the community. The smallest sample size for the Physiologic risk-adjustment models is 27,248. Shading indicates that U of CO model statistics are for multiple sub-models; we report the number of unique OASIS items and elements across all sub-models.
|
|||||
TABLE 8b: Final Alternative Risk-Adjustment Models for Physiologic Outcomes
| TABLE 8b. Final Alternative Risk-Adjustment Models for Physiologic Outcomes (Part I) | ||||||||||||
|---|---|---|---|---|---|---|---|---|---|---|---|---|
| Risk Factor Measured at SOC/ROC | Improvement in: | |||||||||||
| Pain | No. of Surg. Wounds | Status of Surg. Wonds | Dyspnea | Urinary Tract Infection | Urinary Incontinence | |||||||
| Full Model | Core Only | Core Only | Full Model | Full Model | Full Model | |||||||
| Coef. | p | Coef. | p | Coef. | p | Coef. | p | Coef. | p | Coef. | p | |
| DEMOGRAPHICS | ||||||||||||
| Age lt 65 | -0.182 | 0.000 | -0.095 | 0.002 | -0.202 | 0.000 | -0.014 | 0.417 | -0.069 | 0.319 | -0.204 | 0.000 |
| Age 75-84 | 0.095 | 0.000 | 0.110 | 0.000 | 0.139 | 0.000 | -0.022 | 0.068 | 0.018 | 0.703 | -0.015 | 0.418 |
| Age 85+ | 0.141 | 0.000 | 0.285 | 0.000 | 0.340 | 0.000 | -0.066 | 0.000 | -0.045 | 0.399 | -0.106 | 0.000 |
| Gender: female | -0.114 | 0.000 | 0.084 | 0.000 | 0.137 | 0.000 | 0.038 | 0.000 | 0.055 | 0.167 | -0.059 | 0.000 |
| SOCIOECONOMIC FACTORS | ||||||||||||
| Any Medicaid | -0.077 | 0.001 | -0.036 | 0.292 | 0.004 | 0.913 | -0.101 | 0.000 | -0.041 | 0.506 | -0.109 | 0.000 |
| Medicare HMO | -0.132 | 0.000 | -0.240 | 0.000 | -0.268 | 0.000 | 0.128 | 0.000 | -0.171 | 0.002 | 0.138 | 0.000 |
| PRIOR SERVICE USE | ||||||||||||
| Discharged past 14 days: | ||||||||||||
| Discharge from hospital | 0.117 | 0.000 | -0.042 | 0.133 | 0.071 | 0.029 | 0.286 | 0.000 | 0.350 | 0.000 | 0.310 | 0.000 |
| Discharge from rehab facility | 0.091 | 0.000 | 0.165 | 0.000 | 0.117 | 0.002 | 0.423 | 0.000 | 0.674 | 0.000 | 0.396 | 0.000 |
| Discharge from nursing home | -0.061 | 0.012 | -0.080 | 0.040 | -0.110 | 0.013 | 0.266 | 0.000 | 0.545 | 0.000 | 0.221 | 0.000 |
| CLINICAL FACTORS | ||||||||||||
| Prognoses | ||||||||||||
| Overall prognosis good/fair | 0.286 | 0.000 | 0.073 | 0.264 | 0.256 | 0.000 | 0.251 | 0.000 | 0.147 | 0.034 | 0.091 | 0.001 |
| Rehabilitation prognosis good | 0.289 | 0.000 | -0.110 | 0.005 | -0.045 | 0.317 | 0.256 | 0.000 | 0.054 | 0.263 | 0.164 | 0.000 |
| Diagnoses | ||||||||||||
| Diabetes (PPS Group) | 0.023 | 0.180 | 0.038 | 0.133 | -0.082 | 0.004 | -0.050 | 0.000 | 0.053 | 0.238 | -0.036 | 0.042 |
| Orthopedic (PPS Group) | -0.215 | 0.000 | 0.126 | 0.000 | 0.168 | 0.000 | 0.257 | 0.000 | 0.353 | 0.000 | 0.089 | 0.000 |
| Neurological (PPS Group) | 0.034 | 0.092 | 0.089 | 0.017 | 0.102 | 0.017 | 0.139 | 0.000 | 0.250 | 0.000 | -0.086 | 0.000 |
| Wound/Burn (PPS Group) | 0.088 | 0.002 | -0.027 | 0.422 | -0.107 | 0.005 | -0.191 | 0.000 | 0.304 | 0.006 | -0.151 | 0.000 |
| Cancer | -0.086 | 0.000 | -0.061 | 0.037 | -0.151 | 0.000 | -0.163 | 0.000 | 0.006 | 0.924 | -0.056 | 0.040 |
| Mental condition | 0.067 | 0.055 | 0.031 | 0.618 | 0.093 | 0.186 | 0.032 | 0.181 | 0.058 | 0.527 | 0.000 | 0.993 |
| Dementia | 0.167 | 0.000 | -0.004 | 0.968 | -0.017 | 0.895 | 0.109 | 0.000 | -0.050 | 0.563 | -0.024 | 0.436 |
| Hypertension | 0.085 | 0.000 | 0.074 | 0.001 | 0.111 | 0.000 | 0.004 | 0.691 | 0.161 | 0.000 | 0.010 | 0.519 |
| Ischemia | 0.093 | 0.000 | -0.205 | 0.000 | -0.048 | 0.110 | -0.017 | 0.210 | 0.147 | 0.022 | 0.040 | 0.089 |
| Arrhythmia | 0.090 | 0.000 | 0.141 | 0.000 | 0.169 | 0.000 | -0.020 | 0.199 | 0.050 | 0.441 | 0.033 | 0.182 |
| Heart failure | -0.056 | 0.010 | 0.266 | 0.000 | 0.209 | 0.000 | -0.156 | 0.000 | 0.257 | 0.000 | -0.022 | 0.268 |
| COPD | -0.004 | 0.873 | 0.156 | 0.000 | 0.164 | 0.000 | -0.327 | 0.000 | 0.282 | 0.000 | 0.015 | 0.517 |
| Skin ulcer | 0.083 | 0.006 | -0.092 | 0.020 | -0.236 | 0.000 | -0.140 | 0.000 | 0.185 | 0.053 | -0.100 | 0.002 |
| Orthopedic (other than PPS) | -0.293 | 0.000 | 0.047 | 0.038 | 0.238 | 0.000 | 0.195 | 0.000 | 0.177 | 0.000 | 0.005 | 0.783 |
| Incontinence | -0.072 | 0.109 | 0.111 | 0.261 | 0.276 | 0.023 | -0.194 | 0.000 | -0.050 | 0.544 | -0.234 | 0.000 |
| Symptoms, signs, & ill-defined conditions | -0.047 | 0.047 | 0.149 | 0.001 | 0.111 | 0.031 | 0.045 | 0.005 | 0.044 | 0.435 | -0.016 | 0.473 |
| Diagnosis Severity | ||||||||||||
| Number of severity ratings >2 | 0.011 | 0.031 | 0.049 | 0.000 | 0.025 | 0.004 | -0.037 | 0.000 | 0.033 | 0.012 | -0.003 | 0.584 |
| Sensory Status | ||||||||||||
| Partially vision impaired | 0.028 | 0.072 | 0.204 | 0.000 | 0.166 | 0.000 | -0.189 | 0.000 | -0.080 | 0.049 | -0.055 | 0.000 |
| Severely vision impaired | 0.046 | 0.302 | 0.189 | 0.033 | 0.259 | 0.015 | -0.157 | 0.000 | -0.025 | 0.803 | -0.020 | 0.600 |
| Speech: Minimum difficulty | 0.040 | 0.046 | 0.154 | 0.000 | 0.112 | 0.006 | -0.056 | 0.000 | 0.053 | 0.292 | -0.048 | 0.011 |
| Speech: Moderate difficulty | 0.194 | 0.000 | 0.144 | 0.065 | 0.244 | 0.009 | -0.005 | 0.843 | 0.089 | 0.266 | -0.092 | 0.001 |
| Speech: Severe difficulty | 0.317 | 0.000 | 0.236 | 0.015 | 0.113 | 0.302 | -0.034 | 0.322 | 0.051 | 0.604 | -0.167 | 0.000 |
| Speech: Severe difficulty/unable (Levels 3, 4) | ||||||||||||
| Speech: Severe difficulty/unable/non-responsive (Levels 3-5) | ||||||||||||
| Integumentary Status | ||||||||||||
| Surgical wound present | 0.155 | 0.000 | 0.276 | 0.000 | 0.214 | 0.000 | 0.140 | 0.000 | ||||
| Stage of most problematic pressure ulcer | -0.073 | 0.000 | 0.116 | 0.000 | 0.089 | 0.002 | -0.023 | 0.044 | 0.045 | 0.259 | -0.107 | 0.000 |
| Status of most problematic stasis ulcer | -0.075 | 0.000 | 0.102 | 0.016 | -0.023 | 0.613 | -0.052 | 0.000 | 0.304 | 0.001 | -0.009 | 0.662 |
| 2 surgical wounds | 0.662 | 0.000 | ||||||||||
| 3 surgical wounds | 0.881 | 0.000 | ||||||||||
| 4 surgical wounds | 0.542 | 0.000 | ||||||||||
| Surg Wnd Status: Early/partial granulation | 0.972 | 0.000 | ||||||||||
| Surg Wnd Status: Not healing | 1.889 | 0.000 | ||||||||||
| Functional Status/Physical Functioning | ||||||||||||
| ADL/IADL index | -0.012 | 0.000 | 0.042 | 0.000 | 0.041 | 0.000 | 0.004 | 0.041 | 0.061 | 0.000 | -0.016 | 0.000 |
| Toilet: Able when supervised | 0.146 | 0.000 | ||||||||||
| Toilet: Uses bedside commode | 0.164 | 0.000 | ||||||||||
| Toilet: Uses bedpan independently | ||||||||||||
| Toilet: Totally dependent | ||||||||||||
| Toilet: Uses bedpan indep/totally dependent | -0.058 | 0.165 | ||||||||||
| Amb: Needs device to walk | -0.048 | 0.431 | ||||||||||
| Amb: Needs assistance to walk | -0.164 | 0.050 | ||||||||||
| Amb: Chairfast or Bedfast (Levels 3-5) | -0.336 | 0.000 | ||||||||||
| Elimination Status | ||||||||||||
| Urinary incontinence during the night | -0.072 | 0.003 | -0.016 | 0.710 | -0.025 | 0.615 | -0.057 | 0.001 | -0.116 | 0.088 | ||
| Urinary incontinence during the day | 0.081 | 0.073 | 0.015 | 0.868 | -0.071 | 0.494 | -0.070 | 0.027 | 0.004 | 0.977 | 0.257 | 0.000 |
| Urinary incontinence during the night & day | -0.049 | 0.013 | 0.052 | 0.149 | 0.015 | 0.731 | -0.181 | 0.000 | -0.137 | 0.016 | 0.087 | 0.000 |
| Urinary catheter present | -0.019 | 0.586 | 0.103 | 0.039 | 0.025 | 0.662 | -0.168 | 0.000 | -0.703 | 0.000 | 0.284 | 0.000 |
| Bowel incontinent less than weekly | -0.039 | 0.352 | 0.081 | 0.360 | -0.069 | 0.493 | 0.007 | 0.810 | 0.118 | 0.210 | -0.110 | 0.000 |
| Bowel incontinent 1-3 times/week | -0.057 | 0.147 | 0.062 | 0.476 | -0.019 | 0.847 | -0.071 | 0.007 | -0.094 | 0.213 | -0.285 | 0.000 |
| Bowel incontinent 4-6 times/week | -0.006 | 0.920 | 0.141 | 0.286 | 0.124 | 0.427 | -0.071 | 0.078 | -0.014 | 0.888 | -0.410 | 0.000 |
| Bowel incontinent daily or more often | 0.097 | 0.028 | 0.047 | 0.591 | 0.085 | 0.405 | -0.032 | 0.302 | -0.108 | 0.166 | -0.384 | 0.000 |
| Ostomy | 0.213 | 0.000 | 0.330 | 0.000 | 0.134 | 0.023 | 0.059 | 0.089 | -0.005 | 0.965 | -0.305 | 0.000 |
| Neuro/Emotional/Behavioral Status | ||||||||||||
| Cog Func: Requires prompting | 0.016 | 0.465 | 0.010 | 0.788 | 0.024 | 0.577 | -0.050 | 0.001 | -0.033 | 0.546 | -0.067 | 0.001 |
| Cog Func: Requires assistance & some direction | 0.102 | 0.004 | -0.061 | 0.397 | -0.084 | 0.313 | 0.034 | 0.149 | -0.066 | 0.420 | -0.099 | 0.001 |
| Cog Func: Requires considerable assistance | -0.013 | 0.830 | -0.072 | 0.600 | -0.087 | 0.585 | 0.045 | 0.256 | -0.264 | 0.020 | -0.165 | 0.000 |
| Cog Func: Totally dependent | -0.183 | 0.124 | -0.168 | 0.553 | -0.182 | 0.585 | -0.150 | 0.061 | 0.120 | 0.525 | -0.176 | 0.019 |
| Conf Freq: In new situations | -0.009 | 0.633 | 0.074 | 0.011 | 0.093 | 0.006 | -0.101 | 0.000 | -0.047 | 0.328 | -0.071 | 0.000 |
| Conf Freq: Awakening at night | -0.024 | 0.652 | 0.069 | 0.540 | 0.005 | 0.972 | -0.038 | 0.288 | 0.000 | 0.998 | -0.108 | 0.014 |
| Conf Freq: Day/evenings, not constant | 0.084 | 0.014 | 0.059 | 0.399 | -0.006 | 0.945 | -0.067 | 0.003 | 0.025 | 0.747 | -0.112 | 0.000 |
| Conf Freq: Constantly | 0.301 | 0.000 | -0.038 | 0.816 | -0.042 | 0.825 | 0.076 | 0.093 | -0.130 | 0.285 | -0.241 | 0.000 |
| Anx Freq: Less than daily | -0.071 | 0.000 | 0.025 | 0.312 | 0.005 | 0.866 | -0.124 | 0.000 | 0.015 | 0.725 | -0.057 | 0.001 |
| c statistic | -0.169 | 0.000 | -0.041 | 0.171 | -0.052 | 0.134 | -0.131 | 0.000 | -0.087 | 0.081 | 0.006 | 0.750 |
| Anx Freq: All the time | -0.153 | 0.003 | -0.166 | 0.069 | -0.063 | 0.548 | -0.091 | 0.010 | -0.235 | 0.055 | 0.020 | 0.686 |
| Verbal disruption | -0.007 | 0.917 | -0.010 | 0.941 | -0.089 | 0.571 | -0.071 | 0.095 | -0.081 | 0.514 | -0.065 | 0.155 |
| Depressive Feelings: Depressed mood | -0.108 | 0.000 | -0.013 | 0.639 | -0.031 | 0.315 | -0.029 | 0.013 | 0.052 | 0.241 | -0.019 | 0.256 |
| Depressive Feelings: Any other elements (2-6) | -0.215 | 0.000 | -0.031 | 0.711 | -0.169 | 0.069 | -0.089 | 0.001 | 0.206 | 0.058 | 0.045 | 0.219 |
| OUTCOME SPECIFIC RISK-ADJUSTERS | ||||||||||||
| Smoking | -0.101 | 0.000 | ||||||||||
| Obesity | -0.204 | 0.000 | -0.049 | 0.334 | -0.074 | 0.000 | ||||||
| Pain daily but not constantly | 0.229 | 0.000 | ||||||||||
| Pain all the time | 1.701 | 0.000 | ||||||||||
| Dyspnea when moderate exertion | 1.022 | 0.000 | ||||||||||
| Dyspnea with minimum exertion | 1.619 | 0.000 | ||||||||||
| Dyspnea when at rest | 2.187 | 0.000 | ||||||||||
| Intractable pain | -0.256 | 0.000 | ||||||||||
| Memory deficit | -0.083 | 0.000 | ||||||||||
| Impaired decision making | -0.034 | 0.121 | ||||||||||
| Status Prior to Admission | ||||||||||||
| Toilet: Able when supervised | -0.223 | 0.000 | ||||||||||
| Toilet: Uses bedside commode | -0.338 | 0.000 | ||||||||||
| Toilet: Uses bedpan indep/totally dependent (Levels 3, 4) | -0.511 | 0.000 | ||||||||||
| Urinary incontinence prior 2 weeks | -0.097 | 0.045 | -0.358 | 0.000 | ||||||||
| Indwelling/suprapubic catheter prior 2 weeks | -0.113 | 0.107 | -0.629 | 0.000 | ||||||||
| Intractable pain prior 2 weeks | -0.262 | 0.000 | ||||||||||
| Impaired decision making prior 2 weeks | -0.052 | 0.018 | ||||||||||
| Memory loss prior 2 weeks | 0.011 | 0.630 | ||||||||||
| Clinical Factors: Therapies | ||||||||||||
| Oxygen therapy | -0.719 | 0.000 | ||||||||||
| IV/Infusion therapy | -1.098 | 0.000 | ||||||||||
| Ventilator | -1.203 | 0.000 | ||||||||||
| Urinary Tract Infection | -0.082 | 0.000 | ||||||||||
| Intercept | -0.381 | 0.000 | -0.396 | 0.000 | -0.406 | 0.000 | -0.901 | 0.000 | 0.609 | 0.000 | 0.360 | 0.000 |
| R2 statistic | 0.058 | 0.047 | 0.065 | 0.110 | 0.059 | 0.103 | ||||||
| c statistic | 0.635 | 0.626 | 0.670 | 0.690 | 0.665 | 0.682 | ||||||
| TABLE 8b. Final Alternative Risk-Adjustment Models for Physiologic Outcomes (Part II) | ||||||
|---|---|---|---|---|---|---|
| Risk Factor Measured at SOC/ROC | Improvement in: | Stabilization in: | ||||
| Bowel Incontinence | Speech | Speech | ||||
| Full Model | Core Only | Core Only | ||||
| Coef. | p | Coef. | p | Coef. | p | |
| DEMOGRAPHICS | ||||||
| Age lt 65 | -0.209 | 0.000 | -0.174 | 0.000 | 0.030 | 0.417 |
| Age 75-84 | 0.042 | 0.229 | 0.054 | 0.037 | -0.112 | 0.000 |
| Age 85+ | -0.012 | 0.748 | 0.015 | 0.604 | -0.349 | 0.000 |
| Gender: female | -0.010 | 0.684 | 0.107 | 0.000 | 0.100 | 0.000 |
| SOCIOECONOMIC FACTORS | ||||||
| Any Medicaid | -0.141 | 0.000 | -0.226 | 0.000 | -0.155 | 0.000 |
| Medicare HMO | 0.084 | 0.049 | 0.099 | 0.003 | -0.024 | 0.417 |
| PRIOR SERVICE USE | ||||||
| Discharged past 14 days: | ||||||
| Discharge from hospital | 0.231 | 0.000 | 0.398 | 0.000 | 0.227 | 0.000 |
| Discharge from rehab facility | 0.335 | 0.000 | 0.488 | 0.000 | 0.203 | 0.000 |
| Discharge from nursing home | 0.275 | 0.000 | 0.265 | 0.000 | 0.063 | 0.057 |
| CLINICAL FACTORS | ||||||
| Prognoses | ||||||
| Overall prognosis good/fair | 0.040 | 0.273 | 0.089 | 0.010 | 0.214 | 0.000 |
| Rehabilitation prognosis good | 0.125 | 0.000 | 0.075 | 0.002 | 0.187 | 0.000 |
| Diagnoses | ||||||
| Diabetes (PPS Group) | 0.009 | 0.774 | 0.047 | 0.050 | -0.014 | 0.538 |
| Orthopedic (PPS Group) | 0.126 | 0.000 | 0.163 | 0.000 | 0.248 | 0.000 |
| Neurological (PPS Group) | -0.073 | 0.007 | -0.202 | 0.000 | -0.347 | 0.000 |
| Wound/Burn (PPS Group) | -0.007 | 0.900 | -0.043 | 0.338 | -0.041 | 0.340 |
| Cancer | -0.069 | 0.198 | 0.019 | 0.618 | -0.148 | 0.000 |
| Mental condition | 0.056 | 0.312 | -0.139 | 0.000 | -0.318 | 0.000 |
| Dementia | -0.054 | 0.198 | -0.321 | 0.000 | -0.416 | 0.000 |
| Hypertension | 0.058 | 0.045 | -0.008 | 0.719 | 0.021 | 0.314 |
| Ischemia | -0.020 | 0.669 | 0.042 | 0.175 | 0.171 | 0.000 |
| Arrhythmia | 0.022 | 0.646 | 0.042 | 0.208 | 0.022 | 0.496 |
| Heart failure | 0.053 | 0.162 | 0.047 | 0.090 | -0.024 | 0.0363 |
| COPD | 0.034 | 0.468 | 0.1113 | 0.000 | 0.110 | 0.000 |
| Skin ulcer | -0.065 | 0.192 | -0.039 | 0.389 | -0.047 | 0.261 |
| Orthopedic (other than PPS) | 0.017 | 0.627 | 0.090 | 0.000 | 0.360 | 0.000 |
| Incontinence | -0.219 | 0.000 | -0.036 | 0.480 | 0.014 | 0.787 |
| Symptoms, signs, & ill-defined conditions | -0.042 | 0.261 | -0.018 | 0.539 | -0.036 | 0.222 |
| Diagnosis Severity | ||||||
| Number of severity ratings >2 | 0.024 | 0.012 | 0.013 | 0.081 | -0.024 | 0.001 |
| Sensory Status | ||||||
| Partially vision impaired | -0.015 | 0.571 | -0.072 | 0.000 | -0.070 | 0.001 |
| Severely vision impaired | -0.001 | 0.983 | 0.040 | 0.432 | -0.090 | 0.081 |
| Speech: Minimum difficulty | 0.049 | 0.177 | 1.480 | 0.000 | ||
| Speech: Moderate difficulty | -0.024 | 0.592 | 0.936 | 0.000 | 2.115 | 0.000 |
| Speech: Severe difficulty | -0.169 | 0.001 | ||||
| Speech: Severe difficulty/unable (Levels 3, 4) | 2.770 | 0.000 | ||||
| Speech: Severe difficulty/unable/non-responsive (Levels 3-5) | 1.054 | 0.000 | ||||
| Integumentary Status | ||||||
| Surgical wound present | 0.103 | 0.006 | 0.222 | 0.000 | 0.468 | 0.000 |
| Stage of most problematic pressure ulcer | -0.094 | 0.000 | -0.025 | 0.246 | -0.007 | 0.709 |
| Status of most problematic stasis ulcer | -0.017 | 0.637 | -0.046 | 0.095 | 0.035 | 0.181 |
| 2 surgical wounds | ||||||
| 3 surgical wounds | ||||||
| 4 surgical wounds | ||||||
| Surg Wnd Status: Early/partial granulation | ||||||
| Surg Wnd Status: Not healing | ||||||
| Functional Status/Physical Functioning | ||||||
| ADL/IADL index | -0.087 | 0.000 | -0.048 | 0.000 | -0.113 | 0.000 |
| Toilet: Able when supervised | 0.256 | 0.000 | ||||
| Toilet: Uses bedside commode | 0.285 | 0.000 | ||||
| Toilet: Uses bedpan independently | 0.211 | 0.027 | ||||
| Toilet: Totally dependent | -0.066 | 0.361 | ||||
| Toilet: Uses bedpan indep/totally dependent | ||||||
| Amb: Needs device to walk | ||||||
| Amb: Needs assistance to walk | ||||||
| Amb: Chairfast or Bedfast (Levels 3-5) | ||||||
| Elimination Status | ||||||
| Urinary incontinence during the night | -0.192 | 0.000 | -0.093 | 0.004 | -0.081 | 0.015 |
| Urinary incontinence during the day | -0.208 | 0.007 | -0.221 | 0.000 | -0.141 | 0.012 |
| Urinary incontinence during the night & day | -0.398 | 0.000 | -0.189 | 0.000 | -0.125 | 0.000 |
| Urinary catheter present | -0.496 | 0.000 | -0.176 | 0.000 | 0.000 | 0.993 |
| Bowel incontinent less than weekly | -0.084 | 0.075 | -0.060 | 0.242 | ||
| Bowel incontinent 1-3 times/week | -0.098 | 0.003 | -0.104 | 0.011 | -0.165 | 0.000 |
| Bowel incontinent 4-6 times/week | 0.230 | 0.000 | -0.234 | 0.000 | -0.283 | 0.000 |
| Bowel incontinent daily or more often | 0.468 | 0.000 | -0.181 | 0.000 | -0.340 | 0.000 |
| Ostomy | 0.028 | 0.723 | 0.062 | 0.356 | ||
| Neuro/Emotional/Behavioral Status | ||||||
| Cog Func: Requires prompting | 0.017 | 0.680 | -0.366 | 0.000 | -0.544 | 0.000 |
| Cog Func: Requires assistance & some direction | -0.045 | 0.365 | -0.661 | 0.000 | -0.963 | 0.000 |
| Cog Func: Requires considerable assistance | -0.020 | 0.739 | -0.774 | 0.000 | -1.104 | 0.000 |
| Cog Func: Totally dependent | 0.009 | 0.915 | -0.815 | 0.000 | -0.936 | 0.000 |
| Conf Freq: In new situations | -0.128 | 0.001 | -0.158 | 0.000 | -0.486 | 0.000 |
| Conf Freq: Awakening at night | -0.084 | 0.247 | -0.084 | 0.144 | -0.586 | 0.000 |
| Conf Freq: Day/evenings, not constant | -0.147 | 0.003 | -0.350 | 0.000 | -0.762 | 0.000 |
| Conf Freq: Constantly | -0.274 | 0.000 | -0.473 | 0.000 | -0.993 | 0.000 |
| Anx Freq: Less than daily | -0.009 | 0.763 | 0.000 | 0.991 | 0.004 | 0.875 |
| c statistic | 0.045 | 0.170 | 0.042 | 0.101 | 0.038 | 0.151 |
| Anx Freq: All the time | 0.072 | 0.360 | 0.092 | 0.158 | 0.013 | 0.851 |
| Verbal disruption | -0.152 | 0.006 | -0.131 | 0.023 | -0.196 | 0.002 |
| Depressive Feelings: Depressed mood | -0.028 | 0.338 | 0.021 | 0.356 | -0.046 | 0.045 |
| Depressive Feelings: Any other elements (2-6) | 0.070 | 0.240 | 0.138 | 0.004 | 0.023 | 0.663 |
| OUTCOME SPECIFIC RISK ADJUSTERS | ||||||
| Smoking | ||||||
| Obesity | -0.004 | 0.915 | ||||
| Pain daily but not constantly | ||||||
| Pain all the time | ||||||
| Dyspnea when moderate exertion | ||||||
| Dyspnea with minimum exertion | ||||||
| Dyspnea when at rest | ||||||
| Intractable pain | ||||||
| Memory deficit | -0.088 | 0.007 | ||||
| Impaired decision making | -0.007 | 0.837 | ||||
| Status Prior to Admission | ||||||
| Toilet: Able when supervised | -0.309 | 0.000 | ||||
| Toilet: Uses bedside commode | -0.330 | 0.000 | ||||
| Toilet: Uses bedpan indep/totally dependent (Levels 3, 4) | -0.574 | 0.000 | ||||
| Urinary incontinence prior 2 weeks | -0.138 | 0.000 | ||||
| Indwelling/suprapubic catheter prior 2 weeks | -0.161 | 0.014 | ||||
| Intractable pain prior 2 weeks | ||||||
| Impaired decision making prior 2 weeks | -0.126 | 0.000 | ||||
| Memory loss prior 2 weeks | 0.086 | 0.015 | ||||
| Clinical Factors: Therapies | ||||||
| Oxygen therapy | ||||||
| IV/Infusion therapy | ||||||
| Ventilator | ||||||
| Urinary Tract Infection | 0.017 | 0.619 | ||||
| Intercept | 1.685 | 0.000 | -0.030 | 0.586 | 2.719 | 0.000 |
| R2 statistic | 0.131 | 0.080 | 0.085 | |||
| c statistic | 0.711 | 0.665 | 0.742 | |||
TABLE 9a: Summary of Regression Models: Emotional/Behavioral Measures
| TABLE 9a. Summary of Regression Models: Emotional/Behavioral Measures | |||||
|---|---|---|---|---|---|
| Risk-Adjusted in OBQI or HHQI | University of Colorado Model | Model 1 Clinical Core (Baseline Model) | Model 2 Adds Outcome-Specific | Model 3 Adds OASIS “Prior” Items | |
| IMPROVEMENT IN ANXIETY | No | ||||
| Percent Who Could Improve: 27.5% | |||||
| Percent Improving Among Those Who Could: 51.8% | |||||
| Number of OASIS Items | N/A | 41 | |||
| Number of OASIS Elements | 59 | ||||
| R2 statistic | 0.058 | ||||
| c statistic | 0.637 | ||||
| IMPROVEMENT IN BEHAVIORAL PROBLEM FREQUENCY | No | ||||
| Percent Who Could Improve: 4.8% | |||||
| Percent Improving Among Those Who Could: 61.8% | |||||
| Number of OASIS Items | N/A | 41 | |||
| Number of OASIS Elements | 59 | ||||
| R2 statistic | 0.057 | ||||
| c statistic | 0.639 | ||||
| STABILIZATION IN ANXIETY | No | ||||
| Percent Who Could Stabilize: 69.1% | |||||
| Percent Stabilizing Among Those Who Could: 87.6% | |||||
| Number of OASIS Items | N/A | 41 | |||
| Number of OASIS Elements | 59 | ||||
| R2 statistic | 0.045 | ||||
| c statistic | 0.684 | ||||
| NOTES: “Percent Who Could Improve” calculated using all home health episodes, not just those discharged to the community. The smallest sample size for the Emotional/Behavioral risk-adjustment models is 12,054. | |||||
TABLE 9b: Final Alternative Risk-Adjustment Models for Emotional/Behavioral Outcomes
| TABLE 9b. Final Alternative Risk-Adjustment Models for Emotional/Behavioral Outcomes | ||||||
|---|---|---|---|---|---|---|
| Risk Factor Measured at SOC/ROC | Improvement in: | Stabilization in: | ||||
| Anxiety | Behavioral Problem Frequency | Anxiety | ||||
| Core Only | Core Only | Core Only | ||||
| Coef. | p | Coef. | p | Coef. | p | |
| DEMOGRAPHICS | ||||||
| Age lt 65 | -0.158 | 0.000 | -0.292 | 0.000 | -0.136 | 0.000 |
| Age 75-84 | 0.057 | 0.006 | -0.124 | 0.031 | 0.005 | 0.817 |
| Age 85+ | 0.079 | 0.001 | -0.191 | 0.002 | 0.071 | 0.002 |
| Gender: female | -0.205 | 0.000 | 0.055 | 0.187 | -0.359 | 0.000 |
| SOCIOECONOMIC FACTORS | ||||||
| Any Medicaid | -0.014 | 0.610 | -0.117 | 0.079 | 0.116 | 0.000 |
| Medicare HMO | 0.122 | 0.000 | 0.089 | 0.217 | 0.065 | 0.009 |
| PRIOR SERVICE USE | ||||||
| Discharged past 14 days: | ||||||
| Discharge from hospital | 0.165 | 0.000 | 0.276 | 0.000 | 0.044 | 0.014 |
| Discharge from rehab facility | 0.317 | 0.000 | 0.458 | 0.000 | 0.041 | 0.118 |
| Discharge from nursing home | 0.141 | 0.000 | 0.202 | 0.006 | -0.011 | 0.714 |
| CLINICAL FACTORS | ||||||
| Prognoses | ||||||
| Overall prognosis good/fair | 0.108 | 0.001 | 0.050 | 0.433 | 0.110 | 0.001 |
| Rehabilitation prognosis good | 0.180 | 0.000 | 0.036 | 0.466 | 0.153 | 0.000 |
| Diagnoses | ||||||
| Diabetes (PPS Group) | 0.042 | 0.043 | -0.062 | 0.239 | 0.065 | 0.001 |
| Orthopedic (PPS Group) | 0.082 | 0.000 | -0.027 | 0.550 | 0.155 | 0.000 |
| Neurological (PPS Group) | 0.010 | 0.670 | -0.027 | 0.563 | -0.025 | 0.243 |
| Wound/Burn (PPS Group) | -0.070 | 0.061 | -0.029 | 0.756 | -0.058 | 0.098 |
| Cancer | -0.118 | 0.000 | 0.080 | 0.400 | -0.195 | 0.000 |
| Mental condition | -0.293 | 0.000 | -0.152 | 0.013 | -0.515 | 0.000 |
| Dementia | -0.044 | 0.298 | -0.064 | 0.262 | -0.120 | 0.006 |
| Hypertension | 0.038 | 0.036 | 0.062 | 0.187 | 0.072 | 0.000 |
| Ischemia | -0.002 | 0.934 | -0.013 | 0.854 | 0.000 | 0.993 |
| Arrhythmia | 0.022 | 0.443 | 0.115 | 0.135 | -0.040 | 0.145 |
| Heart failure | -0.032 | 0.187 | 0.008 | 0.897 | -0.022 | 0.348 |
| COPD | -0.181 | 0.000 | -0.057 | 0.434 | -0.210 | 0.000 |
| Skin ulcer | 0.057 | 0.144 | -0.071 | 0.457 | 0.062 | 0.087 |
| Orthopedic (other than PPS) | 0.078 | 0.000 | 0.008 | 0.884 | 0.200 | 0.000 |
| Incontinence | 0.017 | 0.731 | -0.260 | 0.004 | 0.100 | 0.060 |
| Symptoms, signs, & ill-defined conditions | -0.016 | 0.559 | 0.002 | 0.969 | 0.075 | 0.005 |
| Diagnosis Severity | ||||||
| Number of severity ratings >2 | -0.020 | 0.001 | -0.004 | 0.794 | -0.062 | 0.000 |
| Sensory Status | ||||||
| Partially vision impaired | -0.065 | 0.000 | -0.050 | 0.232 | -0.014 | 0.466 |
| Severely vision impaired | -0.111 | 0.027 | 0.083 | 0.396 | -0.014 | 0.775 |
| Speech: Minimum difficulty | -0.059 | 0.008 | -0.123 | 0.031 | -0.065 | 0.005 |
| Speech: Moderate difficulty | -0.086 | 0.021 | -0.041 | 0.557 | -0.167 | 0.000 |
| Speech: Severe difficulty | -0.111 | 0.025 | 0.009 | 0.916 | -0.210 | 0.000 |
| Integumentary Status | ||||||
| Surgical wound present | 0.097 | 0.000 | -0.033 | 0.590 | 0.169 | 0.000 |
| Stage of most problematic pressure ulcer | -0.027 | 0.152 | -0.010 | 0.811 | -0.040 | 0.026 |
| Status of most problematic stasis ulcer | -0.024 | 0.318 | 0.011 | 0.855 | -0.039 | 0.071 |
| Functional Status/ Physical Functioning | ||||||
| ADL/IADL index | 0.021 | 0.000 | -0.021 | 0.014 | -0.014 | 0.000 |
| Elimination Status | ||||||
| Urinary incontinence during the night | -0.066 | 0.021 | -0.056 | 0.427 | -0.053 | 0.075 |
| Urinary incontinence during the day | -0.078 | 0.141 | -0.030 | 0.775 | 0.039 | 0.472 |
| Urinary incontinence during the night & day | -0.149 | 0.000 | -0.121 | 0.023 | -0.013 | 0.592 |
| Urinary catheter present | -0.184 | 0.000 | -0.077 | 0.466 | -0.070 | 0.079 |
| Bowel incontinent less than weekly | -0.003 | 0.951 | -0.048 | 0.585 | -0.106 | 0.030 |
| Bowel incontinent 1-3 times/week | 0.010 | 0.808 | -0.079 | 0.273 | -0.027 | 0.540 |
| Bowel incontinent 4-6 times/week | -0.026 | 0.672 | -0.045 | 0.634 | 0.018 | 0.782 |
| Bowel incontinent daily or more often | 0.015 | 0.757 | 0.022 | 0.770 | 0.053 | 0.261 |
| Ostomy | -0.011 | 0.850 | 0.055 | 0.742 | -0.223 | 0.000 |
| Neuro/Emotional/Behavioral Status | ||||||
| Cog Func: Requires prompting | -0.122 | 0.000 | -0.236 | 0.001 | -0.053 | 0.035 |
| Cog Func: Requires assistance & some direction | -0.241 | 0.000 | -0.352 | 0.000 | -0.071 | 0.072 |
| Cog Func: Requires considerable assistance | -0.339 | 0.000 | -0.535 | 0.000 | -0.049 | 0.422 |
| Cog Func: Totally dependent | -0.465 | 0.000 | -0.648 | 0.000 | -0.004 | 0.970 |
| Conf Freq: In new situations | -0.165 | 0.000 | 0.014 | 0.847 | -0.158 | 0.000 |
| Conf Freq: Awakening at night | -0.153 | 0.005 | -0.023 | 0.854 | -0.293 | 0.000 |
| Conf Freq: Day/evenings, not constant | -0.122 | 0.001 | -0.153 | 0.063 | -0.177 | 0.000 |
| Conf Freq: Constantly | -0.118 | 0.065 | -0.449 | 0.000 | -0.209 | 0.003 |
| Anx Freq: Less than daily | -0.218 | 0.000 | 0.803 | 0.000 | ||
| Anx Freq: Daily but not constantly | 0.672 | 0.000 | -0.118 | 0.023 | 2.863 | 0.000 |
| Anx Freq: All the time | 1.651 | 0.000 | -0.202 | 0.040 | ||
| Verbal disruption | -0.313 | 0.000 | -0.149 | 0.007 | -0.418 | 0.000 |
| Behav Prob Freq: Once a month | 0.113 | 0.341 | ||||
| Behav Prob Freq: Several times a month | -0.106 | 0.179 | ||||
| Behav Prob Freq: Several times a week | -0.046 | 0.508 | ||||
| Behav Prob Freq: At least daily | -0.019 | 0.770 | ||||
| Depressive Feelings: Depressed mood | -0.182 | 0.000 | 0.000 | 1.000 | -0.369 | 0.000 |
| Depressive Feelings: Any other elements (2-6) | -0.397 | 0.000 | 0.060 | 0.415 | -0.575 | 0.000 |
| Intercept | -0.274 | 0.000 | 1.336 | 0.000 | 1.889 | 0.000 |
| R2 statistic | 0.058 | 0.057 | 0.045 | |||
| c statistic | 0.637 | 0.639 | 0.683 | |||
TABLE 10a: Summary of Regression Models: Cognitive Measures
| TABLE 10a. Summary of Regression Models: Cognitive Measures | |||||
|---|---|---|---|---|---|
| Risk-Adjusted in OBQI or HHQI | University of Colorado Model | Model 1 Clinical Core (Baseline Model) | Model 2 Adds Outcome-Specific | Model 3 Adds OASIS “Prior” Items | |
| IMPROVEMENT IN CONFUSION FREQUENCY | Yes | ||||
| Percent Who Could Improve: 26.7% | |||||
| Percent Improving Among Those Who Could: 41.1% | |||||
| Number of OASIS Items | 66 | 41 | 41 | 43a | |
| Number of OASIS Elements | 94 | 59 | 61 | 67 | |
| R2 statistic | 0.111 | 0.091 | 0.095 | 0.097 | |
| c statistic | 0.693 | 0.673 | 0.678 | 0.680 | |
| IMPROVEMENT IN COGNITIVE FUNCTIONING | No | ||||
| Percent Who Could Improve: 21.8% | |||||
| Percent Improving Among Those Who Could: 43.0% | |||||
| Number of OASIS Items | N/A | 41 | |||
| Number of OASIS Elements | 59 | ||||
| R2 statistic | 0.082 | ||||
| c statistic | 0.665 | ||||
| STABILIZATION IN COGNITIVE FUNCTIONING | No | ||||
| Percent Who Could Stabilize: 69.6% | |||||
| Percent Stabilizing Among Those Who Could: 90.6% | |||||
| Number of OASIS Items | N/A | 41 | |||
| Number of OASIS Elements | 59 | ||||
| R2 statistic | 0.078 | ||||
| c statistic | 0.738 | ||||
NOTES: “Percent Who Could Improve” calculated using all home health episodes, not just those discharged to the community. The smallest sample size for the Cognitive risk-adjustment models is 54,263. Shading indicates that U of CO model statistics are for multiple sub-models; we report the number of unique OASIS items and elements across all sub-models.
|
|||||
TABLE 10b: Final Alternative Risk-Adjustment Models for Cognitive Outcomes
| TABLE 10b. Final Alternative Risk-Adjustment Models for Cognitive Outcomes | ||||||
|---|---|---|---|---|---|---|
| Risk Factor Measured at SOC/ROC | Improvement in: | Stabilization In: | ||||
| Confusion Frequency | Cognitive Functioning | Cognitive Functioning | ||||
| Full Model | Core Only | Core Only | ||||
| Coef. | p | Coef. | p | Coef. | p | |
| DEMOGRAPHICS | ||||||
| Age lt 65 | 0.038 | 0.144 | -0.097 | 0.001 | 0.114 | 0.000 |
| Age 75-84 | -0.165 | 0.000 | -0.120 | 0.000 | -0.324 | 0.000 |
| Age 85+ | -0.336 | 0.000 | -0.274 | 0.000 | -0.629 | 0.000 |
| Gender: female | -0.071 | 0.000 | -0.026 | 0.064 | 0.004 | 0.766 |
| SOCIOECONOMIC FACTORS | ||||||
| Any Medicaid | -0.078 | 0.000 | -0.094 | 0.000 | -0.050 | 0.026 |
| Medicare HMO | 0.084 | 0.000 | 0.044 | 0.053 | -0.042 | 0.036 |
| PRIOR SERVICE USE | ||||||
| Discharged past 14 days: | ||||||
| Discharge from hospital | 0.325 | 0.000 | 0.365 | 0.000 | 0.194 | 0.000 |
| Discharge from rehab facility | 0.474 | 0.000 | 0.432 | 0.000 | 0.084 | 0.000 |
| Discharge from nursing home | 0.203 | 0.000 | 0.193 | 0.000 | -0.010 | 0.650 |
| CLINICAL FACTORS | ||||||
| Prognoses | ||||||
| Overall prognosis good/fair | 0.133 | 0.000 | 0.146 | 0.000 | 0.225 | 0.000 |
| Rehabilitation prognosis good | 0.123 | 0.000 | 0.099 | 0.000 | 0.125 | 0.000 |
| Diagnoses | ||||||
| Diabetes (PPS Group) | -0.017 | 0.277 | 0.034 | 0.040 | -0.056 | 0.001 |
| Orthopedic (PPS Group) | 0.096 | 0.000 | 0.086 | 0.000 | 0.088 | 0.000 |
| Neurological (PPS Group) | -0.097 | 0.000 | -0.133 | 0.000 | -0.263 | 0.000 |
| Wound/Burn (PPS Group) | -0.123 | 0.000 | -0.044 | 0.171 | -0.073 | 0.015 |
| Cancer | -0.057 | 0.022 | 0.028 | 0.306 | -0.167 | 0.000 |
| Mental condition | -0.128 | 0.000 | -0.243 | 0.000 | -0.462 | 0.000 |
| Dementia | -0.444 | 0.000 | -0.463 | 0.000 | -0.709 | 0.000 |
| Hypertension | 0.027 | 0.051 | 0.052 | 0.000 | 0.092 | 0.000 |
| Ischemia | 0.065 | 0.001 | 0.082 | 0.000 | 0.157 | 0.000 |
| Arrhythmia | 0.020 | 0.342 | 0.026 | 0.243 | -0.041 | 0.059 |
| Heart failure | -0.042 | 0.017 | 0.030 | 0.122 | 0.011 | 0.558 |
| COPD | 0.006 | 0.748 | 0.058 | 0.008 | 0.110 | 0.000 |
| Skin ulcer | -0.039 | 0.192 | -0.096 | 0.003 | -0.073 | 0.013 |
| Orthopedic (other than PPS) | 0.074 | 0.000 | 0.060 | 0.001 | 0.247 | 0.000 |
| Incontinence | -0.089 | 0.010 | -0.084 | 0.017 | 0.001 | 0.969 |
| Symptoms, signs, & ill-defined conditions | -0.035 | 0.065 | -0.049 | 0.015 | -0.084 | 0.000 |
| Diagnosis Severity | ||||||
| Number of severity ratings >2 | 0.016 | 0.001 | 0.016 | 0.001 | -0.017 | 0.001 |
| Sensory Status | ||||||
| Partially vision impaired | -0.044 | 0.001 | -0.031 | 0.025 | 0.003 | 0.810 |
| Severely vision impaired | -0.053 | 0.123 | -0.059 | 0.097 | -0.073 | 0.045 |
| Speech: Minimum difficulty | -0.194 | 0.000 | -0.336 | 0.000 | -0.562 | 0.000 |
| Speech: Moderate difficulty | -0.290 | 0.000 | -0.603 | 0.000 | -0.959 | 0.000 |
| Speech: Severe difficulty | -0.440 | 0.000 | -0.965 | 0.000 | -1.290 | 0.000 |
| Integumentary Status | ||||||
| Surgical wound present | 0.191 | 0.000 | 0.216 | 0.000 | 0.484 | 0.000 |
| Stage of most problematic pressure ulcer | -0.021 | 0.147 | 0.001 | 0.956 | -0.016 | 0.266 |
| Status of most problematic stasis ulcer | 0.007 | 0.684 | 0.020 | 0.294 | 0.027 | 0.133 |
| Functional Status/Physical Functioning | ||||||
| ADL/IADL index | -0.011 | 0.000 | -0.038 | 0.000 | -0.102 | 0.000 |
| Elimination Status | ||||||
| Urinary incontinence during the night | -0.160 | 0.000 | -0.168 | 0.000 | -0.159 | 0.000 |
| Urinary incontinence during the day | -0.224 | 0.000 | -0.311 | 0.000 | -0.197 | 0.000 |
| Urinary incontinence during the night & day | -0.193 | 0.000 | -0.235 | 0.000 | -0.171 | 0.000 |
| Urinary catheter present | -0.169 | 0.000 | -0.129 | 0.000 | 0.012 | 0.715 |
| Bowel incontinent less than weekly | -0.073 | 0.021 | -0.073 | 0.026 | -0.061 | 0.091 |
| Bowel incontinent 1-3 times/week | -0.134 | 0.000 | -0.132 | 0.000 | -0.142 | 0.000 |
| Bowel incontinent 4-6 times/week | -0.223 | 0.000 | -0.319 | 0.000 | -0.276 | 0.000 |
| Bowel incontinent daily or more often | -0.181 | 0.000 | -0.225 | 0.000 | -0.354 | 0.000 |
| Ostomy | 0.023 | 0.623 | 0.060 | 0.262 | -0.035 | 0.457 |
| Neuro/Emotional Behavioral Status | ||||||
| Cog Func: Requires prompting | -0.395 | 0.000 | 1.400 | 0.000 | ||
| Cog Func: Requires assistance & some direction | -0.617 | 0.000 | 0.970 | 0.000 | 2.552 | 0.000 |
| Cog Func: Requires considerable assistance | -0.901 | 0.000 | 1.782 | 0.000 | 3.902 | 0.000 |
| Cog Func: Totally dependent | -1.486 | 0.000 | 2.527 | 0.000 | ||
| Conf Freq: In new situations | -0.366 | 0.000 | -0.632 | 0.000 | ||
| Conf Freq: Awakening at night | 1.393 | 0.000 | -0.484 | 0.000 | -0.785 | 0.000 |
| Conf Freq: Day/evenings, not constant | 1.243 | 0.000 | -0.823 | 0.000 | -1.287 | 0.000 |
| Conf Freq: Constantly | 1.908 | 0.000 | -1.322 | 0.000 | -1.811 | 0.000 |
| Anx Freq: Less than daily | -0.070 | 0.000 | -0.004 | 0.790 | -0.013 | 0.400 |
| Anx Freq: Daily but not constantly | -0.021 | 0.201 | 0.045 | 0.011 | -0.022 | 0.244 |
| Anx Freq: All the time | 0.094 | 0.022 | 0.176 | 0.000 | 0.031 | 0.539 |
| Verbal disruption | -0.240 | 0.000 | -0.284 | 0.000 | -0.291 | 0.000 |
| Depressive Feelings: Depressed mood | 0.016 | 0.274 | 0.033 | 0.035 | -0.038 | 0.016 |
| Depressive Feelings: Any other elements (2-6) | 0.078 | 0.014 | 0.079 | 0.018 | 0.036 | 0.338 |
| OUTCOME SPECIFIC RISK-ADJUSTERS | ||||||
| Memory deficit | -0.207 | 0.000 | ||||
| Impaired decision making | -0.096 | 0.000 | ||||
| Status Prior to Admission | ||||||
| Impaired decision making prior 2 weeks | -0.190 | 0.000 | ||||
| Disruptive behavior prior 2 weeks | -0.109 | 0.010 | ||||
| Memory loss prior 2 weeks | -0.212 | 0.000 | ||||
| Intercept | -0.155 | 0.000 | 0.189 | 0.000 | 2.922 | 0.000 |
| R2 statistic | 0.097 | 0.082 | 0.078 | |||
| c statistic | 0.680 | 0.665 | 0.738 | |||
TABLE 11a: Summary of Regression Models: Utilization Measures
| TABLE 11a. Summary of Regression Models: Utilization Measures | |||||
|---|---|---|---|---|---|
| Risk-Adjusted in OBQI or HHQI | University of Colorado Model | Model 1 Clinical Core (Baseline Model) | Model 2 Adds Outcome-Specific | Model 3 Adds OASIS “Prior” Items | |
| ACUTE CARE HOSPITALIZATION | Yes | ||||
| Percent Who Could Be Hospitalized: 100.0% | |||||
| Percent Hospitalized: 28.2% | |||||
| Number of OASIS Items | 49 | 41 | 44 | a | |
| Number of OASIS Elements | 75 | 59 | 62 | ||
| R2 statistic | 0.152 | 0.119 | 0.125 | ||
| c statistic | 0.740 | 0.714 | 0.719 | ||
| DISCHARGED TO THE COMMUNITY | Yes | ||||
| Percent Who Could Be Discharged to Community: 99.5% | |||||
| Percent Discharged to the Community: 68.1% | |||||
| Number of OASIS Items | 53 | 41 | 44 | a | |
| Number of OASIS Elements | 79 | 59 | 62 | ||
| R2 statistic | 0.185 | 0.147 | 0.153 | ||
| c statistic | 0.753 | 0.728 | 0.732 | ||
| EMERGENT CARE | Yes | ||||
| Percent Who Could Have Emergent Care: 97.6% | |||||
| Percent with Emergent Care: 22.7% | |||||
| Number of OASIS Items | 44 | 41 | 44 | a | |
| Number of OASIS Elements | 69 | 59 | 62 | ||
| R2 statistic | 0.100 | 0.072 | 0.075 | ||
| c statistic | 0.710 | 0.679 | 0.683 | ||
NOTES: The smallest sample size for the Utilization risk-adjustment models is 243,865.
|
|||||
TABLE 11b: Final Alternative Risk-Adjustment Models for Utilization Outcomes
| TABLE 11b. Final Alternative Risk-Adjustment Models for Utilization Outcomes | ||||||
|---|---|---|---|---|---|---|
| Risk Factor Measured at SOC/ROC | Acute Care Hospitalization | Discharged to Community | Emergent Care | |||
| Full Model | Full Model | Full Model | ||||
| Coef. | p | Coef. | p | Coef. | p | |
| DEMOGRAPHICS | ||||||
| Age lt 65 | 0.159 | 0.000 | -0.127 | 0.000 | 0.159 | 0.000 |
| Age 75-84 | -0.025 | 0.050 | 0.012 | 0.347 | -0.010 | 0.440 |
| Age 85+ | -0.068 | 0.000 | 0.028 | 0.055 | -0.005 | 0.754 |
| Gender: female | -0.029 | 0.004 | 0.035 | 0.000 | -0.003 | 0.760 |
| SOCIOECONOMIC FACTORS | ||||||
| Any Medicaid | 0.228 | 0.000 | -0.226 | 0.000 | 0.213 | 0.000 |
| Medicare HMO | -0.319 | 0.000 | 0.296 | 0.000 | -0.154 | 0.000 |
| PRIOR SERVICE USE | ||||||
| Discharged past 14 days: | ||||||
| Discharge from hospital | 0.282 | 0.000 | -0.249 | 0.000 | 0.307 | 0.000 |
| Discharge from rehab facility | -0.027 | 0.136 | 0.012 | 0.495 | -0.031 | 0.116 |
| Discharge from nursing home | 0.077 | 0.000 | -0.113 | 0.000 | 0.106 | 0.000 |
| CLINICAL FACTORS | ||||||
| Prognoses | ||||||
| Overall prognosis good/fair | -0.171 | 0.000 | 0.399 | 0.000 | -0.159 | 0.000 |
| Rehabilitation prognosis good | -0.363 | 0.000 | 0.400 | 0.000 | -0.300 | 0.000 |
| Diagnoses | ||||||
| Diabetes (PPS Group) | 0.256 | 0.000 | -0.251 | 0.000 | 0.192 | 0.000 |
| Orthopedic (PPS Group) | -0.199 | 0.000 | 0.199 | 0.000 | -0.149 | 0.000 |
| Neurological (PPS Group) | -0.214 | 0.000 | 0.207 | 0.000 | -0.156 | 0.000 |
| Wound/Burn (PPS Group) | 0.196 | 0.000 | -0.215 | 0.000 | 0.071 | 0.002 |
| Cancer | 0.340 | 0.000 | -0.507 | 0.000 | 0.231 | 0.000 |
| Mental condition | 0.067 | 0.004 | -0.052 | 0.025 | 0.079 | 0.001 |
| Dementia | -0.224 | 0.000 | 0.172 | 0.000 | -0.132 | 0.000 |
| Hypertension | -0.063 | 0.000 | 0.083 | 0.000 | -0.049 | 0.000 |
| Ischemia | 0.048 | 0.001 | -0.032 | 0.031 | 0.107 | 0.000 |
| Arrhythmia | 0.055 | 0.001 | -0.051 | 0.002 | 0.060 | 0.001 |
| Heart failure | 0.287 | 0.000 | -0.276 | 0.000 | 0.247 | 0.000 |
| COPD | 0.101 | 0.000 | -0.079 | 0.000 | 0.138 | 0.000 |
| Skin ulcer | 0.135 | 0.000 | -0.130 | 0.000 | 0.044 | 0.043 |
| Orthopedic (other than PPS) | -0.326 | 0.000 | 0.315 | 0.000 | -0.243 | 0.000 |
| Incontinence | 0.139 | 0.000 | -0.171 | 0.000 | 0.064 | 0.028 |
| Symptoms, signs, & ill-defined conditions | -0.048 | 0.005 | 0.042 | 0.011 | 0.006 | 0.740 |
| Diagnosis Severity | ||||||
| Number of severity ratings >2 | 0.130 | 0.000 | -0.129 | 0.000 | 0.090 | 0.000 |
| Sensory Status | ||||||
| Partially vision impaired | 0.043 | 0.000 | -0.043 | 0.000 | 0.021 | 0.074 |
| Severely vision impaired | 0.040 | 0.163 | -0.029 | 0.316 | 0.022 | 0.475 |
| Speech: Minimum difficulty | 0.009 | 0.521 | -0.014 | 0.303 | 0.011 | 0.458 |
| Speech: Moderate difficulty | -0.055 | 0.019 | 0.069 | 0.003 | 0.007 | 0.790 |
| Speech: Severe difficulty/unable/non-responsive (Levels 3-5) | -0.034 | 0.247 | 0.067 | 0.023 | 0.020 | 0.523 |
| Integrumentary Status | ||||||
| Surgical wound present | -0.278 | 0.000 | 0.315 | 0.000 | -0.246 | 0.000 |
| Stage of most problematic pressure ulcer | 0.183 | 0.000 | -0.207 | 0.000 | 0.108 | 0.000 |
| Status of most problematic stasis ulcer | 0.249 | 0.000 | -0.254 | 0.000 | 0.146 | 0.000 |
| Functional Status/Physical Functioning | ||||||
| ADL/IADL index | 0.069 | 0.000 | -0.081 | 0.000 | 0.057 | 0.000 |
| Elimination Status | ||||||
| Urinary incontinence during the night | -0.063 | 0.001 | 0.069 | 0.000 | -0.020 | 0.330 |
| Urinary incontinence during the day | -0.091 | 0.008 | 0.115 | 0.001 | -0.049 | 0.177 |
| Urinary incontinence during the night & day | -0.011 | 0.435 | 0.016 | 0.255 | 0.002 | 0.910 |
| Urinary catheter present | 0.534 | 0.000 | -0.618 | 0.000 | 0.392 | 0.000 |
| Bowel incontinent less than weekly | 0.053 | 0.068 | -0.072 | 0.012 | 0.069 | 0.023 |
| Bowel incontinent 1-3 times/week | 0.088 | 0.000 | -0.111 | 0.000 | 0.034 | 0.188 |
| Bowel incontinent 4-6 times/week | 0.146 | 0.000 | -0.162 | 0.000 | 0.113 | 0.001 |
| Bowel incontinent daily or more often | 0.205 | 0.000 | -0.216 | 0.000 | 0.141 | 0.000 |
| Ostomy | 0.292 | 0.000 | -0.297 | 0.000 | 0.162 | 0.000 |
| Neuro/Emotional/Behavioral Status | ||||||
| Cog Func: Requires prompting | 0.025 | 0.100 | -0.036 | 0.017 | -0.006 | 0.728 |
| Cog Func: Requires assistance & some direction | -0.055 | 0.017 | 0.016 | 0.475 | -0.057 | 0.020 |
| Cog Func: Requires considerable assistance | -0.147 | 0.000 | 0.057 | 0.111 | -0.131 | 0.001 |
| Cog Func: Totally dependent | -0.189 | 0.003 | 0.137 | 0.031 | -0.148 | 0.029 |
| Conf Freq: In new situations | 0.084 | 0.000 | -0.102 | 0.000 | 0.091 | 0.000 |
| Conf Freq: Awakening at night | 0.119 | 0.001 | -0.146 | 0.000 | 0.154 | 0.000 |
| Conf Freq: Day/evenings, not constant | 0.064 | 0.004 | -0.107 | 0.000 | 0.052 | 0.027 |
| Conf Freq: Constantly | 0.021 | 0.610 | -0.028 | 0.495 | -0.008 | 0.849 |
| Anx Freq: Less than daily | 0.066 | 0.000 | -0.062 | 0.000 | 0.078 | 0.000 |
| Anx Freq: Daily but not constantly | 0.130 | 0.000 | -0.144 | 0.000 | 0.143 | 0.000 |
| Anx Freq: All the time | 0.175 | 0.000 | -0.170 | 0.000 | 0.215 | 0.000 |
| Verbal disruption | 0.042 | 0.271 | -0.057 | 0.132 | 0.070 | 0.073 |
| Depressive Feelings: Depressed mood | 0.121 | 0.000 | -0.152 | 0.000 | 0.091 | 0.000 |
| Depressive Feelings: Any other elements (2-6) | 0.188 | 0.000 | -0.250 | 0.000 | 0.155 | 0.000 |
| OUTCOME SPECIFIC RISK-ADJUSTERS | ||||||
| Dyspnea when walking/climbing stairs | 0.145 | 0.000 | -0.137 | 0.000 | 0.147 | 0.000 |
| Dyspnea when moderate exertion | 0.276 | 0.000 | -0.275 | 0.000 | 0.238 | 0.000 |
| Dyspnea with minimum exertion | 0.469 | 0.000 | -0.481 | 0.000 | 0.368 | 0.000 |
| Dyspnea when at rest | 0.643 | 0.000 | -0.674 | 0.000 | 0.522 | 0.000 |
| Clinical Factors: Therapies | ||||||
| IV/Infusion therapy | 0.489 | 0.000 | -0.476 | 0.000 | 0.328 | 0.000 |
| Ventilator | 0.044 | 0.742 | 0.043 | 0.753 | 0.017 | 0.904 |
| Intercept | -1.947 | 0.000 | 1.628 | 0.000 | -2.104 | 0.000 |
| R2 statistic | 0.125 | 0.153 | 0.075 | |||
| c statistic | 0.719 | 0.732 | 0.683 | |||
TABLE 12: Summary of Agency-Level Analyses: Activities of Daily Living
| TABLE 12. Summary of Agency-Level Analyses: Activities of Daily Living | ||||||
|---|---|---|---|---|---|---|
| Number (Percent of Agencies Compared | Percentage Point Difference: Mean (SD) | Percentage Point Difference at the 5th Percentile | Percentage Point Difference at the 95th Percentile | Spearman's Rank Correlation | Number (Percent of Agencies Changing 2+ Deciles in Ranking | |
| IMPROVEMENT IN BATHING Risk-Adjusted Percent Improving Among Those Who Could: U of CO: 56.3% Full Model: 56.5% |
4,160 (79.4%) |
0.178% (1.84%) |
-2.86 | 3.16 | 0.976 | 162 (3.89%) |
| IMPROVEMENT IN GROOMING Risk-Adjusted Percent Improving Among Those Who Could: U of CO: 61.2% Full Model: 61.3% |
3,388 (64.6%) |
0.098% (2.11%) |
-3.43 | 3.49 | 0.969 | 220 (6.49%) |
| IMPROVEMENT IN DRESSING UPPER BODY Risk-Adjusted Percent Improving Among Those Who Could: U of CO: 61.0% Full Model: 61.1% |
3,590 (68.5%) |
0.083% (2.28%) |
-3.59 | 3.83 | 0.960 | 305 (8.50%) |
| IMPROVEMENT IN DRESSING LOWER BODY Risk-Adjusted Percent Improving Among Those Who Could: U of CO: 60.7% Full Model: 60.9% |
3,755 (71.6%) |
0.157% (2.42%) |
-3.40 | 4.33 | 0.954 | 364 (9.69%) |
| IMPROVEMENT IN TOILETING Risk-Adjusted Percent Improving Among Those Who Could: U of CO: 60.2% Full Model: 60.2% |
2,778 (53.0%) |
0.053% (2.32%) |
-3.78 | 3.85 | 0.956 | 294 (10.6%) |
| IMPROVEMENT IN TRANSFERRING Risk-Adjusted Percent Improving Among Those Who Could: U of CO: 48.8% Full Model: 48.9% |
3,738 (71.3%) |
0.121% (1.56%) |
-2.30 | 2.82 | 0.989 | 34 (0.91%) |
| IMPROVEMENT IN EATING Risk-Adjusted Percent Improving Among Those Who Could: U of CO: 53.4% Full Model: 53.4% |
2,565 (48.9%) |
0.014% (2.23%) |
-3.54 | 3.83 | 0.978 | 82 (3.20%) |
| IMPROVEMENT IN AMBULATION Risk-Adjusted Percent Improving Among Those Who Could: U of CO: 33.4% Full Model: 33.6% |
4,134 (78.9%) |
0.199% (2.73%) |
-4.45 | 4.40 | 0.925 | 715 (17.3%) |
| STABILIZATION IN BATHING Risk-Adjusted Percent Stabilizing Among Those Who Could: U of CO: 91.5% Full Model: 91.3% |
4,225 (80.6%) |
0.173% (0.867%) |
-1.65 | 1.14 | 0.982 | 118 (2.79%) |
| STABILIZATION IN GROOMING Risk-Adjusted Percent Stabilizing Among Those Who Could: U of CO: 93.8% Full Model: 93.7% |
4,185 (79.8%) |
0.116% (0.944%) |
-1.76 | 1.25 | 0.968 | 251 (6.00%) |
| STABILIZATION IN TRANSFERRING Risk-Adjusted Percent Stabilizing Among Those Who Could: U of CO: 94.2% Full Model: 94.1% |
4,280 (81.6%) |
0.079% (0.721%) |
-1.32 | 1.01 | 0.977 | 171 (4.00%) |
| NOTE: The total number of agencies is 5,242. Agencies must have at least 20 home health episodes where individuals have the potential to improve or stabilize (respectively) to be included in the agency comparison of the risk-adjusted outcome. | ||||||
TABLE 13: Summary of Agency-Level Analyses: Instrumental Activities of Daily Living
| TABLE 13. Summary of Agency-Level Analyses: Instrumental Activities of Daily Living | ||||||
|---|---|---|---|---|---|---|
| Number (Percent of Agencies Compared | Percentage Point Difference: Mean (SD) | Percentage Point Difference at the 5th Percentile | Percentage Point Difference at the 95th Percentile | Spearman's Rank Correlation | Number (Percent of Agencies Changing 2+ Deciles in Ranking | |
| IMPROVEMENT IN HOUSEKEEPING Risk-Adjusted Percent Improving Among Those Who Could: U of CO: 44.0% Full Model: 44.0% |
4,267 (81.4%) |
0.057% (2.47%) |
-4.00 | 3.95 | 0.957 | 380 (8.91%) |
| IMPROVEMENT IN LAUNDRY Risk-Adjusted Percent Improving Among Those Who Could: U of CO: 37.5% Full Model: 37.5% |
4,248 (81.0%) |
5.00% (2.04%) |
-3.39 | 3.27 | 0.965 | 297 (6.99%) |
| IMPROVEMENT IN SHOPPING Risk-Adjusted Percent Improving Among Those Who Could: U of CO: 47.4% Full Model: 47.4% |
4,276 (81.6%) |
0.027% (2.06%) |
-3.30 | 3.48 | 0.974 | 214 (5.00%) |
| IMPROVEMENT IN LIGHT MEAL PREP Risk-Adjusted Percent Improving Among Those Who Could: U of CO: 52.2% Full Model: 52.1% |
3,874 (73.9%) |
0.103% (2.57%) |
-4.02 | 4.15 | 0.960 | 310 (8.00%) |
| IMPROVEMENT IN TELEPHONE USE Risk-Adjusted Percent Improving Among Those Who Could: U of CO: 46.1% Full Model: 46.1% |
2,332 (44.5%) |
0.030% (2.20%) |
-3.58 | 3.71 | 0.98 | 84 (3.60%) |
| IMPROVEMENT IN MEDICATION MGMT. Risk-Adjusted Percent Improving Among Those Who Could: U of CO: 33.7% Full Model: 33.9% |
3,574 (68.2%) |
0.130% (2.34%) |
-3.87 | 3.66 | 0.962 | 289 (8.10%) |
| STABILIZATION IN HOUSEKEEPING Risk-Adjusted Percent Stabilizing Among Those Who Could: U of CO: 83.5% Full Model: 83.4% |
3,089 (58.9%) |
0.137% (1.44%) |
-2.53 | 2.08 | 0.981 | 74 (2.40%) |
| STABILIZATION IN LAUNDRY Risk-Adjusted Percent Stabilizing Among Those Who Could: U of CO: 84.0% Full Model: 83.8% |
2,191 (41.8%) |
0.223% (1.60%) |
-2.85 | 2.17 | 0.976 | 85 (3.90%) |
| STABILIZATION IN SHOPPING Risk-Adjusted Percent Stabilizing Among Those Who Could: U of CO: 90.1% Full Model: 90.0% |
3,648 (69.6%) |
0.132% (1.11%) |
-1.97 | 1.55 | 0.981 | 117 (3.20%) |
| STABILIZATION IN LIGHT MEAL PREPARATION Risk-Adjusted Percent Stabilizing Among Those Who Could: U of CO: 90.8% Full Model: 90.6% |
3,682 (70.2%) |
0.164% (1.49%) |
-2.65 | 1.89 | 0.959 | 284 (7.70%) |
| STABILIZATION IN TELEPHONE USE Risk-Adjusted Percent Stabilizing Among Those Who Could: U of CO: 93.0% Full Model: 93.0% |
4,212 (80.4%) |
0.059% (1.02%) |
-1.79 | 1.42 | 0.970 | 249 (5.90%) |
| NOTE: The total number of agencies is 5,242. Agencies must have at least 20 home health episodes where individuals have the potential to improve or stabilize (respectively) to be included in the agency comparison of the risk-adjusted outcome. | ||||||
TABLE 14: Summary of Agency-Level Analyses: Physiologic Measures
| TABLE 14. Summary of Agency-Level Analyses: Physiologic Measures | ||||||
|---|---|---|---|---|---|---|
| Number (Percent of Agencies Compared | Percentage Point Difference: Mean (SD) | Percentage Point Difference at the 5th Percentile | Percentage Point Difference at the 95th Percentile | Spearman's Rank Correlation | Number (Percent of Agencies Changing 2+ Deciles in Ranking | |
| IMPROVEMENT IN PAIN Risk-Adjusted Percent Improving Among Those Who Could: U of CO: 56.0% Full Model: 55.9% |
3,818 (72.8%) |
0.119% (1.58%) |
-2.78 | 2.43 | 0.989 | 31 (0.812%) |
| IMPROVEMENT IN DYSPNEA Risk-Adjusted Percent Improving Among Those Who Could: U of CO: 51.3% Full Model: 51.5% |
3,831 (73.1%) |
0.181% (1.73%) |
-2.66 | 3.00 | 0.989 | 34 (0.887%) |
| IMPROVEMENT IN UTI Risk-Adjusted Percent Improving Among Those Who Could: U of CO: 83.9% Full Model: 83.7% |
771 (14.7%) |
0.287% (2.89%) |
-4.96 | 4.56 | 0.912 | 155 (20.1%) |
| IMPROVEMENT IN URINARY INCONTINENCE Risk-Adjusted Percent Improving Among Those Who Could: U of CO: 48.1% Full Model: 48.2% |
2,710 (51.7%) |
0.100% (1.81%) |
-2.74 | 3.06 | 0.990 | 19 (0.701%) |
| IMPROVEMENT IN BOWEL INCONTINENCE Risk-Adjusted Percent Improving Among Those Who Could: U of CO: 58.9% Full Model: 58.8% |
1,023 (19.5%) |
0.154% (2.13%) |
-3.61 | 3.41 | 0.981 | 26 (2.54%) |
| NOTE: The total number of agencies is 5,242. Agencies must have at least 20 home health episodes where individuals have the potential to improve to be included in the agency comparison of the risk-adjusted outcome. | ||||||
TABLE 15: Summary of Agency-Level Analyses: Cognitive Measures
| TABLE 15. Summary of Agency-Level Analyses: Cognitive Measures | ||||||
|---|---|---|---|---|---|---|
| Number (Percent of Agencies Compared | Percentage Point Difference: Mean (SD) | Percentage Point Difference at the 5th Percentile | Percentage Point Difference at the 95th Percentile | Spearman's Rank Correlation | Number (Percent of Agencies Changing 2+ Deciles in Ranking | |
| IMPROVEMENT IN CONFUSION FREQUENCY Risk-Adjusted Percent Improving Among Those Who Could: U of CO: 39.3% Full Model: 39.4% |
3,165 (60.4%) |
0.158% (1.80%) |
-2.83 | 3.02 | 0.988 | 28 (0.885%) |
| NOTE: The total number of agencies is 5,242. Agencies must have at least 20 home health episodes where individuals have the potential to improve to be included in the agency comparison of the risk-adjusted outcome. | ||||||
TABLE 16: Summary of Agency-Level Analyses: Utilization Measures
| TABLE 16. Summary of Agency-Level Analyses: Utilization Measures | ||||||
|---|---|---|---|---|---|---|
| Number (Percent of Agencies Compared | Percentage Point Difference: Mean (SD) | Percentage Point Difference at the 5th Percentile | Percentage Point Difference at the 95th Percentile | Spearman's Rank Correlation | Number (Percent of Agencies Changing 2+ Deciles in Ranking | |
| ACUTE CARE HOSPITALIZATION Risk-Adjusted Percent Hospitalized Among Those Who Could: U of CO: 29.1% Full Model: 28.9% |
4,798 (91.5%) |
0.184% (2.50%) |
-4.34 | 3.90 | 0.958 | 465 (9.69%) |
| DISCHARGED TO THE COMMUNITY Risk-Adjusted Percent Discharged to Community Among Those Who Could: U of CO: 66.5% Full Model: 66.9% |
4,779 (91.2%) |
0.374% (2.62%) |
-3.94 | 4.75 | 0.956 | 473 (9.90%) |
| EMERGENT CARE Risk-Adjusted Percent Who Had Emergent Care Among Those Who Could: U of CO: 23.1% Full Model: 23.4% |
4,770 (91.0%) |
0.228% (1.79%) |
-2.62 | 3.02 | 0.980 | 134 (2.81%) |
| NOTE: The total number of agencies is 5,242. Agencies must have at least 20 home health episodes where individuals have the potential to have the outcome to be included in the agency comparison of the risk-adjusted outcome. | ||||||