
Prepared by:
Fredric Blavin, Stan Dorn, and Jay Dev
The Urban Institute
Under Task Order: HHSP23337026T
Integrating Health and Human Services Programs and Reaching Eligible Individuals Under the Affordable Care Act
Prepared for:
Alana Landey
Office of the Assistant Secretary for Planning and Evaluation, DHHS
Project 08800-026-00
This paper examines opportunities to apply findings from behavioral economics and decision-making theory to two specific health/human services program interaction contexts: using targeted enrollment strategies to get SNAP recipients into Medicaid, and encouraging individuals seeking health insurance through state marketplaces to apply for SNAP.
"Executive Summary
The neoclassical model of economics assumes that each person has fairly consistent preferences over time and maximizes his or her overall well-being based on the best available information. In contrast, behavioral economics focuses on human limitations, empirically testing the ways in which human behavior departs from the rational and objective calculation of self-interest as the basis of decision-making. The latter literature contains useful findings that can inform policymakers' decisions about how to structure two key connections between health and human services programs under the Affordable Care Act (ACA).
Introduction
The Patient Protection and Affordable Care Act (Affordable Care Act or ACA) seeks to reduce the size of the nation’s uninsured population through policies aimed at improving the accessibility and affordability of health insurance coverage. Two insurance affordability programs targeting the low- and moderate-income uninsured are the legislation’s centerpieces: a Medicaid expansion serves the lowest-income population, and a combination of premium tax credits and cost-sharing reductions helps those with somewhat higher incomes purchase coverage in health insurance exchanges, or Marketplaces.
The ACA’s Medicaid expansion was originally designed as mandatory in all states to cover adults with incomes up to 138 percent of the federal poverty level (FPL). However, a June 2012 Supreme Court ruling effectively made the expansion optional.1 Since October 2013, consumers in every state and the District of Columbia have been able to purchase qualified health plans through Marketplaces, subject to new regulations intended to promote greater transparency and competition, among other policy goals. Federal sliding-scale subsidies to purchase coverage in the new Marketplaces have been offered, starting in January 2014, to individuals who have incomes above Medicaid levels and between 100 and 400 percent of the FPL and who also lack access to affordable employer-sponsored insurance (ESI).2 The Congressional Budget Office projects that that the ACA will reduce the number of uninsured by about 12 million in 2014, 19 million in 2015, 25 million in 2016, and 26 million each subsequent year through 2024.3
The ACA also makes major changes to the eligibility determination process for health and human services programs with the aims of reducing consumers’ burdens when they seek coverage (thereby increasing participation levels), cutting administrative costs, and preventing eligibility errors—changes that have required major improvements to information technology (IT) systems.4 The legislation required the U.S. Department of Health and Human Services (HHS) to “develop interoperable and secure standards and protocols that facilitate enrollment of individuals in Federal and State health and human services programs,” including “electronic matching against existing Federal and State data,” “simplification and submission of electronic documentation, digitization of documents, and systems verification of eligibility,” and “reuse of stored eligibility information.”5 Marketplace web portals seek to share information in “real time” with insurers, state agencies, and the federal government, which has built a Federal Data Services Hub to help verify the income, citizenship, and lawful immigration status of many people applying for Marketplace subsidies or Medicaid.6 The term “human services programs” as used here includes the Supplemental Nutrition Assistance Program (SNAP), Temporary Assistance for Needy Families (TANF), the Low Income Home Energy Assistance Program (LIHEAP), Supplemental Security Income (SSI), the Child Care and Development Fund (CCDF), and similar programs.
This report draws on the insights from neoclassical and behavioral economics to assist federal, state, and local agencies as they move towards modernized and integrated program administration. We review the literature on consumer decision-making, with a special focus on low-income consumers, and identify approaches to improve the integration of health and human services and program participation. We focus on research questions related to two operational contexts:
- When human services program data are used to qualify consumers for Medicaid, how can enrollment be structured to increase Medicaid participation among eligible consumers? For this context, we focus primarily on the behavioral economics literature involving procrastination, default choices, aversion to paperwork completion, and the like. Such literature suggests that even modest opt-in or form-completion requirements can considerably reduce participation levels.
- When consumers apply for health coverage at Marketplaces, how can they be helped to receive human services benefits that they may want and for which they qualify? For this context, we primarily focus on the behavioral economics research related to cognitive and choice overload. Consumers applying for subsidized coverage in the Marketplace could already be overwhelmed with the challenges of first qualifying for assistance, which may involve demonstrating financial eligibility, citizenship status, and, in the case of Marketplace subsidies, lack of access to ESI that the ACA defines as affordable. Many consumers must then select a health plan, weighing the impact of premiums, benefits, cost-sharing, and provider networks. Layering on top of that complexity a further interaction with human services programs could be challenging for many consumers to process.
Among human services programs, we focus on SNAP for two main reasons. First, SNAP currently serves 39 percent (13.7 million) of the 39.5 million adults estimated to be newly eligible for Medicaid if all states expand eligibility—reaching more such adults than any other state- or locally administered human services program.7 SNAP currently serves more than 47 million poor or near-poor individuals.8 This includes an estimated 4.8 million childless adults, who have an average household income at approximately 29 percent of FPL.9
Second, SNAP aids all eligible people who apply. Most other state- and locally administered human services programs, such as TANF, LIHEAP, and CCDF, are funded by federal block grants. Unlike the latter programs, SNAP can help additional eligible individuals without reducing the assistance it provides to current participants. SNAP can thus improve access to benefits by providing information about SNAP eligibility and facilitating enrollment among low-income residents seeking health coverage under the Affordable Care Act. Among the estimated 14.5 million people who qualified for but did not receive SNAP benefits in 2010, 80 percent would be eligible for Medicaid or the Children’s Health Insurance Program (CHIP) if all states implement the ACA’s Medicaid expansion and an additional 8 percent would qualify for Marketplace subsidies.10
This report begins with general background information on traditional and behavioral economics as they relate to these questions. We then provide in-depth analysis of each operational context, working towards developing a menu of practical, research-based approaches for linking health and human services programs to reach eligible consumers more effectively. In each area, we review the relevant behavioral economics literature to help support consumer decision-making at the intersection of health and human services programs.
Background
Many eligible people do not participate in SNAP and Medicaid. In 2010, an estimated 75 percent of eligible people received SNAP with participation levels varying greatly by subpopulation, ranging from 92 percent for children and 90 percent for people with incomes below 100 percent FPL (who qualify for the highest benefit levels), to 67 percent for non-disabled childless adults, 65 percent for people in working families, and 35 percent for the elderly (figure 1).11 Participation rates across states varied as well, with a low of 55 percent of eligible people enrolling in California.12
In 2011, the average Medicaid/CHIP participation rate among children was 87 percent nationwide, with rates ranging from under 75 percent in Nevada, Utah, and Montana to 95 percent or above in Vermont, Massachusetts and Connecticut.13 Medicaid participation levels among adults, who are the target of the ACA Medicaid expansion, lagged far behind children’s, averaging 67 percent among adults who qualified under 2009 rules (figure 2).14
Figure 1. The Percentage of Eligible Individuals Receiving SNAP Benefits within Various Groups, FY 2010
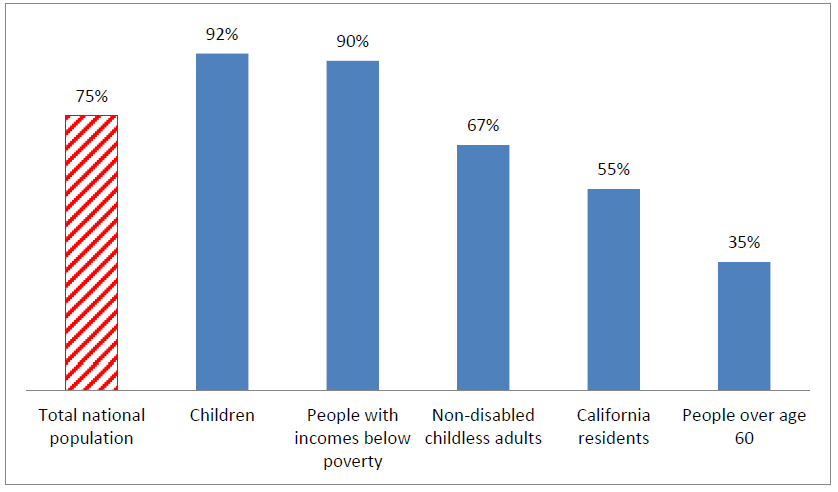
Sources: Eslami, et al., Cunnyngham, 2012.
Figure 2. The Percentage of Eligible Children and Adults Receiving Medicaid Nationally and in the Highest- and Lowest-Ranking States, 2009
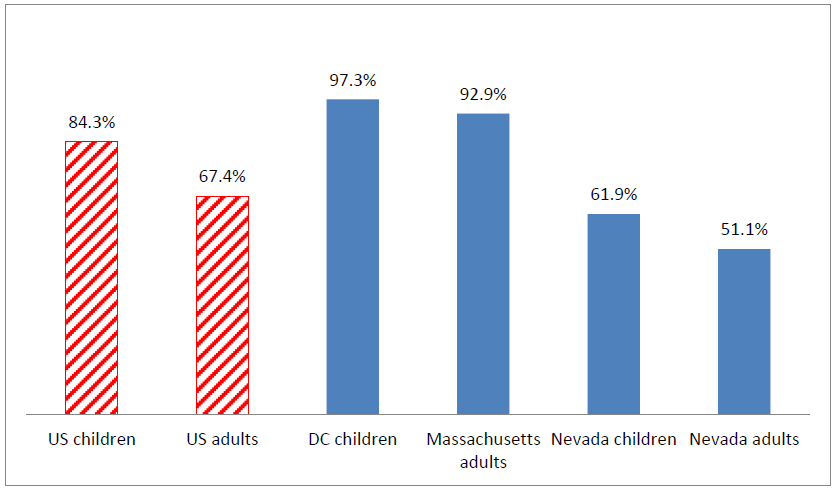
Source: Kenney, et al., 2012. Note: The highest ranking state for children is defined as the state with the highest percentage of eligible children who are enrolled in Medicaid. Similar definitions apply to the lowest-ranking states and to adults. Estimates for 2009 are used in this figure to allow comparisons between children and adults. As noted earlier in the text, more recent estimates for children’s coverage show higher participation levels than in 2009.
If these benefits are valuable and available free of charge, why do so many eligible people fail to sign up? Both traditional neoclassical economics and more recent findings of behavioral economics suggest possible answers.
Insights on take-up from neoclassical economics
Expected utility maximization theory can help explain why many eligible individuals do not take up seemingly free public benefits for which they qualify. Two major literature reviews analyze the impact of multiple factors on participation levels in many different programs. These factors include transaction costs (e.g., both time and dollars spent to meet administrative requirements), lack of information on program eligibility or benefits, and “stigma” associated with government programs.15 Both reviews conclude that administrative barriers and consumer confusion or lack of information matter the most and that larger program benefits have a positive effect on participation. By contrast, stigma—defined as the psychological feeling of shame, a social sense of disrespect associated with program participation, or the perception that participation in a welfare-related program is per se undesirable16—is challenging to empirically define and does not appear to have significant effect, at least as shown in these literature reviews. In sum, tangible costs (which can be temporal or explicitly monetary) and confusion or ignorance reduce take-up, and higher benefits increase participation.
Turning to more specific research about SNAP participation, several factors can inhibit take-up. One such factor is confusion: half of eligible nonparticipants (most of whom have somewhat higher incomes than typical participants) mistakenly think they do not qualify.17 Participation is also more likely among those who qualify for higher benefit amounts, with the median benefit level of eligible nonparticipants well below that of participating households18 Researchers also find that individuals who report more serious nutritional hardship and thus who have larger perceived benefits are more likely to participate, as food insecurity is more frequently reported by SNAP recipients than by eligible non-recipients.19 Transaction costs are another factor that can impede participation, particularly for people who qualify for small benefit amounts; in such cases, SNAP’s costs could reasonably be seen as exceeding its benefits. Although slightly dated because of program streamlining, a 1999 study found that, when the minimum SNAP benefit was $10 a month, average out-of-pocket costs (mostly due to transportation) were $10.31 per application, $5.84 for each of several recertifications per year, plus an average of nearly five hours of consumer time per initial application and 2.5 hours per recertification.20 Today, the minimum monthly benefit is $15.21
Those same three factors highlighted as significant by neoclassical economics—confusion about eligibility, differential benefits, and transaction costs—also affect Medicaid and CHIP. One multivariate study found that among a randomly selected sample of community health center patients, those who perceived the Medicaid application as long and complicated or were confused about who can apply were 1.8 times more likely to be eligible for but not enrolled in Medicaid compared to those who did not perceive these barriers.22 Learning over time might also occur as Medicaid participation levels are affected more by past than current eligibility rules.23 In terms of the second factor, degree of gain, those with larger expected benefits are also more likely to participate in Medicaid. For example, elderly people with chronic functional limitations are four times more likely to enroll, compared to those without such limitations.24 Finally, much work can be required to enroll, imposing costs in the form of time. In the early 1990s, requirements for producing documentation (e.g., birth certificate, citizenship papers, proof of residency, and proof of income) and attending multiple interviews were sufficiently burdensome that up to a quarter of Medicaid applicants could not meet those requirements before applicable deadlines and so could not obtain an eligibility determination.25 Following many states’ considerable streamlining of application procedures since then, regression analyses have shown that measures of inconvenience, such as perceived application length, hinder take-up, while policies such as presumptive eligibility, which lower applicant inconvenience, have a significant positive impact on take-up.26
Insights on take-up from behavioral economics
Neoclassical economics assumes that people have rational, fairly consistent preferences over time. Each person seeks to maximize his or her overall well-being by obtaining, understanding, and rationally acting upon available information. In contrast, behavioral economics focuses on human limitations, empirically testing the ways in which human behavior departs from the rational and objective calculation of self-interest as the basis of decision-making.27
The remainder of this paper describes numerous behavioral economics studies, but we begin here with one striking experiment. Illustrating how the most rational, highly trained decision-makers can be greatly influenced by elements other than the facts, physicians were informed about the outcomes of treating cancer patients with surgery or radiation and asked to select the preferred treatment. To one physician group, information was framed in terms of survival, as follows:
“Surgery: Of 100 people having surgery 90 live through the post-operative period, 68 are alive at the end of the first year and 34 are alive at the end of five years”
“Radiation Therapy: Of 100 people having radiation therapy all live through the treatment, 77 are alive at the end of one year and 22 are alive at the end of five years.”
In this group, 18 percent selected radiation as the better treatment. By contrast, 44 percent favored radiation in the physician group who received the identical factual information, but framed in terms of mortality rather than survival:
“Surgery: Of 100 people having surgery 10 die during surgery or the post-operative period, 32 die by the end of the first year and 66 die by the end of five years.”
“Radiation Therapy: Of 100 people having radiation therapy, none die during treatment, 23 die by the end of one year and 78 die by the end of five years.”
When the identical information was characterized in terms of how many died rather than how many lived, the likelihood that physicians would choose radiation therapy as the superior treatment more than doubled.28 This is not what neoclassical economics predicts from rational decision-makers.
The rest of this paper focuses on the behavioral economics literature as it relates to the two contexts described above involving the integration of health and human services programs. In general, behavioral economics can supplement more traditional economic theory to explain why benefit programs, public and private, often suffer from incomplete take-up. Much of this research involves retirement savings and other programs that serve middle-class consumers, where modest procedural obstacles have been shown to cause significant reductions in participation levels. These potential effects can be amplified among low-income populations that have less access to support or fallback mechanisms, such as reminder systems, inexpensive credit, or automatic savings programs, and that face difficult daily circumstances that can leave them leave them cognitively exhausted.29 Evidence from the behavioral economics literature suggests that a range of apparently minor factors in program design can have a significant impact limiting participation in programs like Medicaid and SNAP, as the next section explores in some detail.
Context #1: Using human services data to qualify consumers for Medicaid
Research findings
For this first operational context, we focus on the behavioral literature involving many people’s aversion to the completion of paperwork. This can take the form of procrastination or failing to submit required forms. As a result, whatever arrangement goes into effect by default—that is, in the absence of consumer action—winds up being widely used, whether or not it accords with consumers’ underlying preferences.
Here, we present real-world examples in four program or service contexts: enrollment in retirement savings plans, enrollment into health coverage based on SNAP data, the impact of opt-in and opt-out rules for organ donation, and the use of tax preparers and community-based organizations to eliminate paperwork completion requirements. These examples suggest that, whether because of inertia, procrastination, paperwork avoidance, a tendency to over-value short-term consequences and under-value long-term effects,30 or discomfort with facing confusing or difficult choices,31 many people tend to be greatly influenced in their program participation decisions by the amount of paperwork they must complete.
Retirement savings
In theory, whether someone must complete a simple form to enroll in a retirement savings plan or to opt out of enrollment should not have a major impact on participation levels. A minor, short-term inconvenience hardly seems commensurate with the long-term benefits of accumulating retirement savings. In reality, considerable research shows that such default arrangements have a significant effect on retirement savings outcomes at every key decision point, including plan participation, savings rates, asset allocation, and post-retirement savings distributions.32
For example, one literature summary noted that “in a typical company” where employees must complete a form to establish a 401(k) account, “only about one-third of employees enroll on their own during the first six months of employment.” By contrast, when a new employee is automatically enrolled in such an account unless he or she completes a form opting out, “90 percent of employees accept default enrollment.”33
Another example involves a study aptly titled, “$100 Bills on the Sidewalk.” The study analyzed seven companies that offered employer matches to worker contributions into 401(k) accounts. In effect, workers over 59 ½ years of age could obtain free employer matching payments; because of their age, they could immediately withdraw their employee contributions, without penalty. Nevertheless, at each firm, between 20 and 60 percent of these older workers failed to claim their employers’ maximum contribution, with losses as high as 6 percent of annual income. At the median firm, 31 percent left employer contributions unclaimed, averaging 2 percent of annual income. The researchers conducted an intensive education intervention, which they found increased participation rates by just one-tenth of one percentage point.34
One response to this research is for employers to change their defaults from non-participation to participation in retirement savings accounts at specified levels, while letting workers opt out of such default arrangements. Researchers have also investigated the possibilities offered by intermediate options that fall short of default enrollment. For example, “quick enrollment” simplifies investment choices, with the employer pre-selecting an asset allocation and contribution rate. As with traditional arrangements, workers must opt to establish a retirement savings account, but rather than being presented with a complex, multidimensional savings and investment problem, they face a simpler binary choice: remain at the status quo, without a 401(k) account, or accept a pre-selected alternative. At one company, participation rates rose from 5 and 15 percent one and four months after hire, respectively, to 19 and 35 percent. At another firm, when quick enrollment was offered to existing employees not previously participating in 401(k) plans, acceptance rates rose from approximately 7 percent and 15 percent four and thirteen months following the renewed offer, respectively, to approximately 15 and 30 percent.35
As a second intermediate option, an "active decision" regimen requires a choice, without leaving room for default. For example, a large company required all new employees, within 30 days of starting work, to complete a form either establishing or declining a retirement savings plan. Sixty nine percent of new workers established 401(k) accounts. When the company switched to a “paperless” telephonic enrollment system that had the unintended effect of ending mandatory decision requirements, participation levels dropped to 41 percent.36 As with “quick enrollment,” the “active decision” strategy raises participation levels (in this case by 28 percentage points), but by a much smaller margin than default enrollment.37
SNAP check-boxes
Louisiana’s experience illustrates the impact of requiring families to check a simple opt-in box before their children can obtain expedited Medicaid coverage based on SNAP receipt. Since February 2010, Louisiana has implemented Express Lane Eligibility (ELE) to qualify children as financially eligible for Medicaid using findings already made by the SNAP program. Children who received SNAP but not Medicaid were mailed Medicaid cards they could use to obtain care. To meet ELE’s statutory requirement for parental consent, the state informed families that using the Medicaid cards would also provide consent to enrollment.
According to the congressionally mandated evaluation of ELE, approximately 18,000 previously uninsured children joined Medicaid through ELE in 2010. This represented a 3 percent increase in total children’s Medicaid and CHIP coverage, with ELE accounting for 28 percent of all new enrollees between February and July.38 However, information technology problems led Louisiana to change its approach to enrollment. Starting in January 2011, children could not receive Medicaid through ELE unless their parents first consented by checking a box on the SNAP application form.39 Even though the check-box was highlighted, bolded, prominently placed on the second page of the SNAP form, and written in very clear language, the average number of children enrolled via ELE as a result of monthly SNAP applications fell by 62 percent after this change was made.40
Organ donation check-boxes and opt-outs
Different countries take different approaches to organ donation. Johnson and colleagues reported that, in six out of the seven European countries where organ donation takes place unless people object by mailing a form or making a telephone call, at least 98 percent of decedents effectively consented to have their organs donated. In three out of the four countries where such form submission or telephone calling is required for organ donation to take place, fewer than 20 percent of decedents have their organs donated, and in the fourth nation (the Netherlands), only 27.5 percent donate, a participation level that was unchanged by a major national education and mass mailing campaign.
To learn more about this disparity, these researchers conducted a randomized, controlled experiment to test the impact of implementing default arrangements through the simplest possible choice mechanism, without any need for mailings, form completion, or even telephone calls. Among all experimental subjects, 79 percent reported a preference for donating their organs after death. One experimental group was deemed to consent unless members checked a simple website box opting out of organ donation. This group had an 82 percent organ donation rate—nearly identical to the expressed preferences of all study participants. Members of a second group had to check a comparably simple website box to opt into organ donation. In the latter group, only 42 percent donated their organs.41 Put differently, in the group where the default was non-donation rather than donation for people who failed to check a simple on-line box:
- the relative rate of organ donation was 49 percent lower (42 percent vs. 82 percent); and
- the organ donation rate was substantially different than consumers’ actual preferences (47 percent lower) rather than almost identical to those preferences (just 4 percent higher).42
41 Johnson, E.J., and D.G. Goldstein. “Defaults and Donation Decisions.” Transplantation. 78 (12): 1713-1716. December 27, 2004.
42 As with 401(k) accounts, intermediate approaches are possible that represent neither pure opt-in or pure opt-out models. For example, the state of Illinois uses an “active decision” or “mandated choice” strategy. People renewing drivers’ licenses must decide whether or not to donate their organs after death; defaults are not permitted. According to agencies involved in organ donation, the donation rate in Illinois is 60 percent, compared to a national average of 38 percent. Richard H. Thaler. “Opting in vs. Opting Out.” New York Times. Sept. 26, 2009. http://www.nytimes.com/2009/09/27/business/economy/27view.html?_r=2&.
Eliminating paperwork by completing it on consumers’ behalf
A randomized, controlled experiment tested the impact of tax preparers actually filing SNAP applications for eligible consumers, compared to completing applications and providing instructions about how and where the consumers could file them. Low-income clients at H&R Block offices were provided information about the monthly SNAP benefits for which they qualified. In addition to filing tax returns for these clients, H&R Block gathered additional information needed for the SNAP application.
The clients were randomly assigned to one of three levels of assistance in completing the SNAP application: Basic (where only a blank application was given to the client), which served as a control group; Plus (where the clients were interviewed and given an application completely filled out by H&R Block staff, plus information about where and how the clients could file the application); or Full Assistance (where the H&R Block employee not only completed the application but also, with the client’s permission, filed it for the client by sending it to the SNAP office, which completed the enrollment process by contacting the client for a telephone interview).
Researchers found that participation in the Full Assistance model substantially increased the probability of completing a SNAP application. Roughly 40 percent of Full Assistance recipients applied for SNAP, compared to 22 percent of the control group, representing an 80 percent relative increase. By contrast, Plus-level help, which gave consumers a fully completed SNAP application and instructions about where and how to file it, yielded no statistically significant difference in application filing, compared to the control group.43
A similar randomized, controlled experiment involved college student aid application forms. When H&R Block staff completed and filed college student aid forms on behalf of tax clients, 55.9 percent successfully completed the application process. This represented a 40 percent relative increase, compared to the 40.2 percent who applied in the control group that received only general information about college aid. By contrast, no statistically significant effects were observed when H&R Block gave families written, personalized estimates of their likely eligibility for student aid, data about potential tuition costs at nearby colleges, and information about how to complete the application process on their own.44
A randomized, controlled experiment in a low-income, predominantly Latino community in Boston came to similar conclusions. This study compared Massachusetts’s normal Medicaid outreach methods with having case managers from a community-based organization file applications for children, then following up over time to address emerging problems.45 The state’s normal outreach methods involved mailings, door-to-door canvassing, radio advertisements in Spanish, grants to community organizations, and a toll-free call center. Among the children who received assistance from community-based case managers, 96 percent enrolled in Medicaid, and 78 percent retained coverage continuously throughout the study’s one-year follow-up period. By contrast, only 57 percent of the children receiving the state’s standard outreach enrolled, and just 30 percent retained coverage continuously throughout the following year.46
Implications for targeted enrollment into Medicaid
In sum, the literature described above finds that apparently modest procedural burdens—the requirement to complete a form or even check a box, for example—can have a substantial impact on program participation, as can eliminating such burdens by completing forms on consumers’ behalf. This has important implications for implementation of targeted enrollment strategies permitted by the Centers for Medicare and Medicaid Services (CMS). In May 2013, CMS issued a State Health Official (SHO) letter that permits states to provide consumers with Medicaid based on their receipt of SNAP, pursuant to waivers under Social Security Act §1902(e)(14)(A) that bypass the normal requirement of individualized income determinations.47 SNAP recipients can automatically receive Medicaid under such waivers, so long as such recipients are known to meet Medicaid’s nonfinancial eligibility requirements.
This option offers the potential to reach numerous uninsured individuals. Of the estimated 26.9 million childless adults who will qualify for Medicaid if all states expand eligibility, SNAP already serves 9.4 million, or 35 percent.48 SNAP provides benefits to an even higher proportion—56.7 percent—of uninsured parents who will qualify for Medicaid.49
However, CMS has made clear that these waivers do not eliminate the legal requirement to file Medicaid applications. Each SNAP recipient has already submitted a SNAP application, which CMS takes into account in determining whether the Medicaid application requirement has been met. CMS’s SHO letter explained that the combination of data from the SNAP application and consumers taking any of the following steps can satisfy the Medicaid application requirement:
- Checking an “opt-in” box on the SNAP application or recertification form;
- Making a telephonic or on-line acknowledgement after receiving a Medicaid card; or
- After receiving a Medicaid card, “indicat[ing] that they are applying for Medicaid when they go through the process of selecting a managed care plan,” which “also activates the Medicaid card.”
Others have suggested a fourth option—namely, sending “a very short form to confirm [consumers’] desire to apply for Medicaid and collect a signature and any additional information the state may require.”50
The research described above makes clear that when consumers must meet apparently modest procedural requirements, such as checking an opt-in box, returning a simple form, or making a telephonic or on-line acknowledgement, they are much less likely to participate in available programs, because of inertia, procrastination, short-term orientation, distraction, confusion, actual underlying preferences, or other factors. The first four states to implement targeted Medicaid enrollment campaigns have sent mailings to consumers who were in the target group—that is, they were not enrolled in Medicaid and they appeared to qualify based on their receipt of SNAP or, in some states, family members’ eligibility for Medicaid or CHIP. Consumers were invited to sign up for Medicaid by returning a simple form or, in some cases, calling a toll-free number. Nearly a quarter of a million people enrolled by November 15, but as one would predict based on the above-described research, most did not respond (table 3). The overall response rate was 34 percent. However, in Arkansas and West Virginia, where officials made telephone calls to all mailing recipients who did not initially respond, response rates were much higher—41 and 46 percent, respectively, compared to 33 and 27 percent in Illinois and Oregon, which did not make such extensive calls immediately following the mailing.51
Table 3. Results of targeted enrollment initiatives reported by 11/15/13
| State | Target group: SNAP recipients | Target group: People with family members enrolled in Medicaid or CHIP | Phone response accepted? | People sent mailings | Mailing response rate | People found eligible for Medicaid and enrolled |
|---|---|---|---|---|---|---|
| Total: | 655,000 | 34% | 223,065 | |||
| Arkansas | Y | 154,000 | 41% | 63,465 | ||
| Illinois | Y | 123,000 | 33% | 35,500 | ||
| Oregon | Y | Y | Y | 260,000 | 27% | 70,000 |
| West Virginia | Y | Y | Y | 118,000 | 46% | 54,100 |
Source: Manatt Health Solutions and the Kaiser Commission on Medicaid and the Uninsured, 2013. Note: total response rate is the average for all states, weighted based on the number of mailing recipients.
Hundreds of thousands of consumers quickly gained coverage in these states because of response rates significantly higher than those achieved by past mailing initiatives aimed at eligible individuals not yet participating in health programs.52 For example, Oregon’s initial 27 percent response rate was more than five times the response rate achieved when it implemented ELE by sending mailings to the parents of children who qualified for Medicaid based on SNAP receipt.53 New enrollees in these four states thus represented tangible and significant early coverage gains that showed the potential impact of targeted enrollment strategies. However, if this approach can be adjusted to further incorporate the findings of behavioral economics research and eliminate the interposition of procedural obstacles before eligible consumers are enrolled into Medicaid—making program participation rather than nonparticipation the default if consumers fail to act—many more eligible uninsured would likely receive coverage.
Can SNAP recipients obtain Medicaid without being asked to complete paperwork?
CMS’s May 2013 SHO letter indicates that, for consumers who have successfully completed the SNAP application process, managed care plan selection can be used to meet Medicaid’s application requirements. Two state Medicaid programs have already shown how consumers can complete the managed care plan selection process without being required to fill out paperwork.
- Massachusetts default enrollment. Under Massachusetts’ 2006 reform, one in four newly insured residents received coverage through the state’s Commonwealth Care program, based on data matches with the state’s preexisting “free care pool,” without any need to file application forms. Consumers qualifying for premium-free coverage had two weeks to select a plan. Those failing to make a choice were automatically assigned a plan. The state structured this strategy to achieve both enrollment and expenditure goals. Despite increased enrollment, Massachusetts saved money by giving the largest share of default enrollees to the plans that made the lowest secret bids stating the prices for which they would serve all enrollees (not just those who were auto-assigned).54
To meet the Medicaid application requirement now articulated by CMS, states would need to modify this approach. For example, they could require plans chosen by default to contact the consumer and obtain consent before capitated payments begin (or before such plans receive more than a limited number of payments). In effect, the outreach that Arkansas and West Virginia conducted at public expense would instead be done by managed care organizations, in response to financial incentives created by the state.55
- South Carolina consent through card use. To implement ELE, South Carolina provided Medicaid to children based on their receipt of SNAP or TANF, starting in September 2012. Families were sent a letter giving them a chance to opt out of Medicaid coverage. The letter also encouraged them, if they did not opt out, to select a managed care plan from among an enclosed list of options. The letter further explained that if they did not choose a plan, they could still obtain fee-for-service care for their children; and that seeking such care would both provide consent to Medicaid enrollment and trigger a second, mandatory round of managed care selection. After that second round, families still not choosing a plan had one assigned by default. More than 92,000 children received coverage in nine months,56 representing a 15 percent increase in the number of eligible children participating in Medicaid.57 Because consumers must take action to show their consent and to initiate mandatory managed care enrollment, this approach, coupled with the prior filing of SNAP or Medicaid applications, would likely meet the Medicaid application requirement articulated by the May 2013 SHO.
Context #2: Helping applicants for health coverage connect to human services programs
This second context focuses on how potentially eligible consumers could be connected to the SNAP program while they are applying for health insurance at the Marketplace. Here, we draw on behavioral economics findings related to cognitive psychology and consumer choice. The discussion emphasizes online applications for health coverage, but much of the analysis also applies to other application modes—that is, by phone, mail, or in person.58
In the following discussion of behavioral economics research, we suggest that the process of applying for coverage and selecting a plan in the Marketplace could drain many consumers of cognitive reserves, leaving little mental energy for considering a SNAP application. We then explore how the interface between the Marketplace and SNAP could be structured to help consumers make good decisions about SNAP, given the significant risk of cognitive overload during the application process for health coverage.
After people have qualified for insurance affordability programs, what else must they do to apply for SNAP?
Depending on the individual’s situation, the following steps may be required:
- Documenting recent income using pay stubs or similar records. SNAP regulations require such documentation as a matter of first resort, unlike Medicaid regulations under the ACA, which require using data matches to establish eligibility whenever possible. Moreover, SNAP requires precise income documentation, since each dollar difference in earnings can translate into a 30-cent difference in benefits. By contrast, consumers are financially eligible for Medicaid if their income does not exceed 138 percent FPL, making it unnecessary to determine whether an individual’s income is at, for example, 90 or 70 percent FPL. Medicaid’s income determination does not end SNAP’s process of establishing financial eligibility, for these reasons as well as those described below.
- Documenting citizenship, satisfactory immigration status, and other facts for which health programs rely on the federal data hub. Health programs will verify citizenship, immigration status, and other facts using information from the Federal Data Services Hub—a new system that provides, in a single cyber-location, a link to information from the Social Security Administration, the Department of Homeland Security, and other data sources. Federal guidance currently limits the extent to which health programs can share information from the federal data hub with human services programs. As a result, consumers applying for SNAP may need to document facts relevant to eligibility, typically including but potentially going beyond citizenship and immigration status, for which health programs rely on the federal data hub.
- Documenting limited assets. Under the ACA’s new approach to Medicaid eligibility as well as subsidy eligibility for Marketplace coverage, income alone determines financial eligibility. For SNAP, by contrast, assets like bank accounts are relevant in many states, where applicants must identify them and document their value.
- Household composition. For most Medicaid beneficiaries under the ACA and for Marketplace subsidies, households are defined much as under tax law. In SNAP, they are defined differently, including people who live together and jointly buy and prepare food. Unrelated roommates can comprise a single SNAP household, but insurance affordability programs will treat them as separate households. Household size may thus need to be described and documented to qualify for SNAP, even for consumers who have already completed a health application.
- Direct communication with caseworkers. Traditionally, SNAP has required in-person interviews before benefits begin. However, many states now permit interviews to occur by phone. No interview process is required to qualify for health coverage, so applying for SNAP will often involve an extra step of meeting with caseworkers, in person or by phone.
Even though federal policymakers have focused on creating simplified applications, qualifying for insurance affordability programs will not be instantaneous or effortless. At a minimum, applicants will need to provide much personal information (contact information, social security number, address, date of birth, etc.) and attest to income and citizenship or immigration status. If data matches fail to provide verification, applicants may need to document these attestations. People who qualify for Medicaid but apply for coverage at a Marketplace are supposed to have their application handled seamlessly without any need for further effort on the applicant’s part. However, in practice some consumers who start their applications at the Marketplace may need to provide information a second time after their files are transferred to their states’ Medicaid programs; such “glitches” will presumably end after Marketplaces and Medicaid agencies have transitioned to full implementation of the ACA’s procedural requirements.59
Consumers who qualify for Marketplace subsidies rather than Medicaid face additional complications. They must shop for private insurance plans, analyzing the impact of possible premium tax credits and cost-sharing reductions. They will need to make complex decisions, weighing advantages and disadvantages related to multiple factors: specific benefits provided within the 10 required benefit categories (plus additional benefits that a particular plan may choose to cover);60 provider networks, including both whether one’s doctor is included in a plan’s network and the general breadth of a plan’s provider network; and costs associated with insurance plans, including plan tiers, premiums, deductibles, copayments, coinsurance, etc.
Such a complex analysis will need to encompass many plans. A recent analysis finds that the average marketplace rating area is served by five carriers that together offer 47 different qualified health plans.61
Research findings
This report does not analyze how Marketplaces and Medicaid programs can best structure the application and health plan choice process. Rather, we focus on that process’s cognitive demands to understand the consumer’s mindset when faced with the additional questions posed by possible SNAP enrollment. Economists have started to consider the complex cognitive challenges associated with choices under uncertainty and over multiple time periods, providing a behavioral economics perspective to explain health insurance choices in a way that standard market models cannot.62 Recent research suggests that the number of plans and how they are presented to consumers could have a substantial impact on plan choice and costs.
Many SNAP-eligible consumers will qualify for Medicaid, rather than Marketplace subsidies. This is particularly true in states that expand Medicaid, thereby raising the lowest income threshold for Marketplace subsidies from 100 to 138 percent FPL. And while plan choice is generally much simpler in Medicaid than it is in Marketplaces, and enrollment brokers often help with those decisions, Medicaid plan selection can nevertheless present challenges. For example, in California counties where Medicaid beneficiaries are not offered a choice of health plans, more than 95 percent of new Medicaid beneficiaries enroll in a plan during their first month of eligibility. By contrast, in counties where a choice of plans is offered, fewer than one percent enroll during their first month; roughly half (51 to 56 percent) enroll in a plan within three months of qualifying for Medicaid; and one in six (15 to 17 percent) are still not enrolled seven months after being found eligible.63
Outside the Medicaid program, experimental evidence indicates that consumers left to their own devices have difficulty making choices among even four standardized plans, making significant financial errors. When instructed to choose the most cost-effective plan, unaided subjects selected the best option 42 percent of the time when presented with four choices (with an average mistake exceeding $200). When the number of choices rose to eight, the proportion of correct selections fell to 21 percent.64
Similarly, in 2009, after the Massachusetts Connector—that state’s pre-ACA health insurance exchange—reorganized a list of 25 plans into three tiers of coverage categorized by price, consumers showed improved ability to choose, becoming increasingly effective in identifying and purchasing the most affordable plan options.65 These results, showing the gains achieved when choices are greatly simplified, suggest that consumers may have difficulty making optimal choices in the much more complex, multi-plan environments that they are now facing in ACA Marketplaces and may find it challenging thinking through and deciding from among available options.
Experimental findings from Medicare Part D coverage of prescription drugs also support the notion that individuals have difficulty making optimal plan choices, even when those choices involve only a single benefit:
- In a nationally representative study of low-income Medicare beneficiaries from the Health and Retirement Survey (HRS), researchers found that individuals who were older and had lower levels of cognition and numeracy skills were less likely to take up fully subsidized Medicare Part D benefits when they were given a range of plan options.66
- A randomized, controlled experiment asked medical residents and interns to select the Medicare Part D prescription drug plan that would best meet the needs of a beneficiary with a specified drug regimen, taking into account premiums and out-of-pocket costs. When this highly numerate, medically aware cohort was presented with three plans, 32.8 percent made the wrong choice, with an average error of $60. Presented with nine plans, 67.3 percent made wrong choices, and the average error increased to $128.51; both increases were statistically significant.67
Another study examined the impact of cognitive limitations on the level of enrollment in supplemental coverage among Medicare beneficiaries, based on data from the HRS. Despite gaps in standard Medicare coverage that leave most beneficiaries without supplemental coverage susceptible to high out-of-pocket expenses, many seniors lack this coverage. The study found, after controlling for other factors, that beneficiaries in the lower third of cognitive ability and numeracy were 11 percentage points less likely to enroll in supplemental coverage than those in the upper third.68
Behavioral economics research has also analyzed the effects of choice overload, a finding from psychology where individuals choose inaction when the number of available options becomes overwhelming.69 For example, one study used data from approximately 800,000 workers to estimate the impact of 401(k) plan choices on participation rates. All other things equal, researchers found that each additional 10 mutual fund options were associated with an approximate 1.5 to 2 percent drop in participation rates.70,71
The evidence is somewhat mixed as to whether this particular effect applies to health coverage. Despite a preference among seniors for fewer Part D choices, some analyses have not found a link between the number of Part D plan choices and the probability of enrolling into coverage.72,73 On the other hand, the above-described research includes examples of the complexities of plan choices leading to both mistaken and deferred decision-making.
Implications for facilitating SNAP enrollment
The above analysis suggests that the process of enrolling into subsidized Marketplace coverage is likely to deplete the cognitive resources of many who go through the process. Asking such consumers to then begin the process of enrolling into SNAP, an entirely new benefit program, could prove challenging.
In designing strategies to overcome this challenge, it is important to take into account two constraints. The first is legal. CMS has issued guidance for states that use multi-benefit applications as alternatives to the single, streamlined application for insurance affordability programs. According to that guidance, multi-benefit applications, which could include questions related to SNAP, are acceptable “if the application collects sufficient information to determine … eligibility for all insurance affordability programs” and the “state clearly indicates the additional questions are optional, or not required for submission, and therefore do not serve as a barrier to the … determination” of eligibility for health coverage. In addition, states “may not deny or delay eligibility for an insurance affordability program due to missing or unverified information pertaining only to a non-health program.”74
The second constraint involves state health agency resources. For the foreseeable future, ACA implementation is likely to continue making many demands on state health officials. Human services programs thus may find it more feasible to implement integration initiatives if they can keep to a minimum the time and other resources needed from state health agencies.
Taking into account these constraints as well as the cognitive burdens of enrolling into health coverage, the following sections sketch out approaches through which consumers applying for health coverage could be given opportunities to seek SNAP benefits at various points in their interactions with the Marketplace. The relative effectiveness of these strategies with consumers in general and with specific subpopulations could be tested empirically, perhaps through randomized, controlled experiments accompanied by strong ethical safeguards.75 The three approaches described below could be implemented separately or in combination.
1. Presenting SNAP enrollment opportunities after the initial enrollment into health coverage is complete
One possible approach would delay questions about SNAP until after the health application process is complete. This would ensure that SNAP questions pose no barrier to enrollment into health coverage, thereby meeting the requirements of the CMS guidance described earlier. It would also avoid burdening state health programs with the need to modify questions and procedures that involve health coverage, since those questions would be answered and procedures completed before any SNAP issues are raised.
However, raising SNAP at this late stage in the application process would subject consumers to the full weight of cognitive overload, as described above. It would therefore be important to recognize that many consumers could enter the SNAP interaction in an exhausted frame of mind. They might not be willing or able to make additional choices about whether to apply for SNAP or learn new facts related to human services programs. At the same time, consumers vary, and many will value choice, information, and flexibility, even if they are exhausted.
One possible approach to minimize these burdens would begin by offering consumers a cognitively undemanding route to SNAP participation. After someone completes the application and plan selection processes for health coverage, the Marketplace interface (or application assister working with the consumer) would inform the consumer that he or she might qualify for help paying for food, based on the information that the consumer already provided. The consumer could then be asked, “Would you like your state’s food agency to contact you to see if you qualify for help paying for food?” If so, the consumer would be asked for his or her preferred contact method (e.g., by text message, email, cell phone call, mail, etc.) and contact information.76 The SNAP office would follow up by contacting the consumer, with a timing that fits the local office’s workflow, to obtain the additional information needed to determine SNAP eligibility.
Whether or not the consumer agrees to be contacted by the state food agency, the consumer could next be asked if he or she wants information about SNAP or an opportunity to apply, without waiting to be contacted by the state’s food agency. If so, the consumer could be given simple information describing SNAP benefits and be connected to the online SNAP application. If technically feasible, that application would be pre-populated with information that the consumer already provided for health coverage. Despite such pre-population, the consumer would need to provide additional information to qualify for SNAP, as explained earlier.
A related approach, inspired by the behavioral economics research discussed in the first part of this paper, would have the consumer’s contact information forwarded to the SNAP agency unless the consumer opts out. Under this variant, more consumers would have their information sent to SNAP. However, consumers might not have indicated their preferred method of contact. It is not obvious that furnishing more names to SNAP, without any information about the contact method that works best for each consumer, would generate increased SNAP enrollment. A hybrid approach might work better, in which consumers are: (a) informed that they will be contacted by the state food agency unless they indicate a contrary preference; (b) asked for their desired method of being contacted; then (c) given a chance to opt out of being contacted.
Proponents of any opt-out approach, whether or not in a hybrid form, would need to answer several questions, in this context. First, is the Marketplace legally authorized to share the applicant’s contact information, without the applicant’s affirmative consent?77 Second, would consumers be taken aback or worry that they are being targeted by “scam artists” if someone claiming to be from the SNAP agency reaches out to them, in the absence of an affirmative request? If so, how could that outreach be designed to forestall such concerns? For example, perhaps quick turnaround from the SNAP agency might minimize this risk by increasing the odds that consumers will remember reading about SNAP when they applied for health coverage.
Regardless of how these questions are answered or which of these specific approaches is preferred, the period after completing the health coverage application and enrollment process deserves consideration as an appropriate point to connect consumers to SNAP, so long as the connection process is carefully designed to account for the cognitive depletion that many consumers are likely to experience at that time.
2. Presenting SNAP enrollment opportunities before the end of the initial application for health coverage
A second strategy would raise the SNAP issue before the initial health enrollment process is complete.78 For example, a consumer who appears likely to qualify for human services programs could be given the option to complete either a health-only application or a multi-program application that requests the information needed by both SNAP and health programs. If the latter application concludes with a telephonic contact between the consumer and a representative of the SNAP agency, that might be enough to meet SNAP interview requirements and allow SNAP benefits to begin immediately, without the risk that a lack of follow-through could cause a consumer to “fall through the cracks” and fail to receive benefits. On the other hand, state health agencies would need to be involved in crafting such a multi-program application, which could make this option hard to implement in many states. Also, a multi-program application can be harder to complete because it has more questions than an application limited to health coverage alone.79 The former, for example, typically asks questions about asset values, which many applicants find burdensome to answer, 80 and which are excluded from health-only applications because assets are irrelevant to eligibility for insurance affordability programs. Even though multi-program applications will be filled out only by those who request such applications, many could overestimate their capacity to complete that process, stop partway through, and wind up receiving neither SNAP nor health coverage.81 Following CMS’s directive to make clear that SNAP-specific questions are optional is likely to be helpful but may not entirely solve this problem.
3. Presenting SNAP enrollment opportunities when health coverage is being renewed
A third approach would raise the SNAP issue as Medicaid or Marketplace subsidy eligibility is being renewed. At this point, consumers are likely to experience much less cognitive and choice overload than during the initial coverage application. At renewal, fewer consumers will be examining the full range of health plan choices.82 Further, analysis of eligibility for insurance affordability programs will be limited to factors most likely to change over time—income and household size—without the need to verify personal identity, to demonstrate citizenship or lawful immigration status, to prove state residence (a requirement for Medicaid eligibility), etc.83
With cognitive overload less likely at renewal, consumers’ interest in or capacity for starting an on-line SNAP application and their willingness to allow the SNAP agency to contact them could be greater than at the initial application. Policymakers could thus consider changing the order or structure in which SNAP options are presented to consumers. For example, rather than first being presented with the easiest possible avenue towards SNAP, consumers could be told that it appears they may qualify for help paying for food and asked if they would rather apply for SNAP themselves or have the state food agency contact them.
Overarching issues
Several issues arise in all the above settings for raising the SNAP question when people apply for health coverage. First, Marketplaces need to decide which consumers will be presented with the option of seeking SNAP. In theory, a Marketplace could offer all applicants for health coverage the opportunity to connect with SNAP. In practice, it will probably be more effective to limit this opportunity to consumers who are likely to qualify. Raising the issue of SNAP with Marketplace applicants whose income is clearly too high to qualify could trigger questions and negative reactions from consumers who may be sensitive to being characterized as potentially eligible for public benefits.84 It could also lead to opposition from Marketplace officials anxious to maintain a strong distinction between traditional means-tested programs and the Marketplace, which targets consumers of all income levels. Further, it would be an inefficient use of SNAP agency resources to contact consumers who are highly unlikely to qualify for SNAP.
Second, it could be important for Marketplaces to link to SNAP records so that the opportunity to submit a SNAP application is presented only to people who are not already receiving SNAP or do not have a pending application. Otherwise, consumers who already participate in the program or who recently applied could become concerned about the status of their SNAP eligibility or could otherwise become needlessly anxious about their situation.
Third, the way that SNAP is framed is likely to influence consumer responses. Much research suggests the importance of even background visual imagery in priming various responses and influencing behavior. One study, for example, compared two groups’ responses to a web site sequence that began with an explanatory web page featuring certain background imagery followed by a neutral web page in which experimental subjects could choose between a sofa that offered the advantage of greater comfort and a sofa that offered the advantage of lower cost. For the group where the background imagery on the introductory page featured fluffy clouds, “designed to prime comfort,” only 38.7 percent preferred the cheaper sofa. Another group was shown an explanatory web page with background imagery consisting of pennies embedded in a green background, “designed to prime price.” In that second group, 55.8 percent preferred the cheaper sofa—a 44 percent relative increase, compared to the first group. Similar results occurred when subjects were offered a choice between safer and cheaper cars, with background imagery priming those two concerns.85 If SNAP is presented along with images of appealing food, for example, or imagery that reinforces a parent’s role as provider for children, consumers may be more likely to seek assistance.
Higher responses could likewise result if receipt of SNAP is framed as a potential loss (“don’t miss out on this chance to get help paying for food”) rather than a potential gain (“get help paying for food”). Behavioral economics research shows that behavior can be more powerfully affected by the risk of loss than the possibility of gain, even if the two are identical in reality but only described differently. A summary of this area of research noted that “people typically require a potential gain of at least $100 to make up for exposure to a potential loss of $50 because the subjective impact of losses is roughly twice that of gains.”86
One illustrative study analyzed the effects of showing 15-minute videos about mammography to women who had not received the recommended number of procedures in the past. Two groups saw different versions of the same video. One version, entitled “The Benefits of Mammography,” described mammography’s gains. The other, called “The Risks of Neglecting Mammography,” provided the same information, framed in terms of the harm that could result from missing a mammogram. In their immediate responses to the videos, the two groups did not differ in what they learned or how much they liked the videos. However, 12 months later, 51.5 percent of those seeing the first video had received a mammography, compared to 66.2 percent in the second group.87 Reframing from gain to potential loss was thus associated with a 20 percent relative increase in the likelihood of receiving a mammogram 12 months after seeing a brief educational video.88 As with the earlier study showing the impact on physician choices when cancer treatment results were described in terms of mortality rather than survival, this example illustrates the effect of framing, as opposed to factual content, on decision-making.
Fourth and more broadly, program administrators could consider field-testing the many options described above. Such testing could investigate optimal timing for posing questions about SNAP as well as the language and visual images that evoke the greatest responses from consumers. For example, field-testing could assess the impact of opt-out language like the following: “It looks like you might be eligible for help paying for food. I assume you'd like to have the state food agency contact you to see if you qualify. If that's right, what's the best way for them to reach you?”
It could also investigate the impact of language suggesting that most people in the consumer’s position agree to such contacts; much behavioral economics research suggests that descriptive norms powerfully influence behavior. For example, one study asked women, if they were to contract breast cancer, whether they would be willing to add chemotherapy to hormonal treatment. Two groups of women were told that adding chemotherapy would raise five-year survival rates by only 1 percent. Among those who were also informed that “a few women” in such a situation chose chemotherapy, 26.6 percent said that they too would make that choice. By contrast, 35.9 percent preferred chemotherapy among those who were instead told that “most women” added chemotherapy to hormone treatment—a 35 percent relative increase.89
Returning to the issue of how to structure the link from health coverage to human services programs, many of the policy choices discussed above ultimately involve empirical questions about which approach will prove most effective. As suggested earlier, randomized controlled experiments, subject to strong ethical safeguards, could go beyond informal “market testing” to rigorously assess the impact of particular methods for giving health applicants an opportunity to seek SNAP benefits.
In all of this analysis, it is important to remember the heterogeneity of low- and moderate-income consumers. People vary on every important dimension—tolerance of risk, speed of cognitive overload, the kinds of stimuli that create cognitive overload, preferences for receiving and giving information in various ways, total cognitive capacity at particular points in time, and more. The most effective system for connecting health applicants to SNAP would allow different types of consumers to find the channel of assistance best suited to meeting their needs.
Conclusion
Structuring the interface between health and human services programs, in the context of ACA implementation, is likely to involve considerable experimentation and learning over time. Fortunately, much research has already identified many factors that influence, sometimes in surprising ways, consumers’ responses to the options they encounter. Based on that research, policymakers can structure the process of moving between health programs and human services programs to increase the odds that consumers’ preferences and needs are met as they enroll in programs for which they qualify. As that effort moves forward, it will be important to engage in ongoing empirical testing and refinement of strategies to incorporate new information about the approaches that prove most effective.
About the authors and acknowledgments
Fredric Blavin, Stan Dorn, and Jay Dev are, respectively, a Senior Research Associate, Senior Fellow, and Research Assistant at the Urban Institute’s Health Policy Center. The authors are grateful to ASPE for supporting this research and particularly appreciative of the assistance and substantive guidance furnished by our project officer, Alana Landey. In addition, the authors thank Brigette Courtot and Gregory Mills of the Urban Institute, Katherine Baicker, Professor of Health Economics in the Department of Health Policy and Management at the Harvard School of Public Health, and the members of this project’s Technical Working Group (listed in the Appendix below) for their thoughtful review of earlier drafts. None of the above individuals, ASPE, the Urban Institute, or any of the Institute’s funders or trustees are responsible for the opinions expressed in this paper, which are the authors’.
Appendix A. Members of the Technical Working Group
Federal Officials
- HHS
- Susan Golonka, ACF/OFA
- Vicki Turetsky (along with Jennifer Burnszynski), ACF/OCSE
- Mark Fucello, ACF/OPRE
- Rochelle Rollins, advisor to the Chief Medical Officer, ACF
- Jeannie Chaffin, ACF/OCS
- Suma Nair, HRSA/Bureau of Primary Care
- Ben O’Dell and Lisa Carr, Center for Partnerships
- Gregorio Hunt, OIEA
- Elizabeth Hadley and Christie Peters, ASPE/Office of Health Policy
- Donna Cohen Ross, CMS/CMCS
- USDA/FNS
- Kathryn Law, Office of Policy Support
- SSA
- Craig Streett, Office of Income Security Programs
State Officials
Louisiana Ruth Kennedy, Medicaid director
Nongovernmental Members
Anita Light and Megan Lape, American Public Human Services Association
Notes
58 However, these application modes create the potential for self-selection. It is possible that many internet applicants could have greater cognitive reserves than some who apply through other venues. On the other hand, many consumers who qualify for subsidies in the Marketplace may ultimately have little choice but to go on line to complete the enrollment process. Most such consumers will be confronted with dozens of plan options, each with its own premiums, covered benefits, out-of-pocket cost-sharing rules, and provider networks. In many cases, consumers may need to peruse web displays of this information to choose a plan.