
The Non-Elderly Disabled Category 2 (NED2) Housing Choice Voucher Program, a joint effort between the Department of Housing and Urban Development and the Centers for Medicare and Medicaid Services, aimed to increase access to affordable housing for non-elderly people (age 62 and under) with disabilities currently residing in institutions, such as a nursing home. To qualify for the program, public housing authorities had to establish a partnership with the state Medicaid agency responsible for assisting individuals to transition out of institutions to arrange for health and social services and supports. The evaluation examined the program’s implementation in a subset of communities that received NED2 vouchers, and estimated the impact of the program on the change in the rate of community transitions among the eligible population. [85 PDF pages]
"Acknowledgments
The authors acknowledge the efforts of the many people who helped produce this report. First, thanks to Hakan Aykan, Alison Cuellar and Gavin Kennedy in the Office of the Assistant Secretary for Planning and Evaluation in the U.S. Department of Health and Human Services, for providing overall direction and support for this study. We also want to extend our sincere thanks to the program staff and managers at the public housing authorities, Money Follows the Person Demonstration grant programs, and other local health and human service agencies who shared their non-elderly disabled Category 2 (NED2) housing choice voucher program experiences; much of the report was informed by their perspectives. We also appreciate the contributions of staff at the Technical Assistance Collaborative, especially Emily Cooper, for sharing information and insight that greatly enhanced the report. We also thank staff at the U.S. Department of Housing and Urban Development (HUD), particularly Susannah Still and Mark Perdue, for explaining the details of HUD administrative data and processing several data extracts.
We are also grateful to the many Mathematica staff who contributed to the report. We thank David Stapleton and Randall Brown for invaluable advice and guidance that helped strengthen the entire report, particularly the impact analysis. Bryan Bernecker merged administrative and survey data and undertook the intensive task of providing order and structure to the data. Joel Smith and Lucy Lu provided additional programming support, Lisa Ferraro Parmelee and Claire Korzen provided editorial support, and Sharon Clark provided secretarial support. Maura Bardos and Raina Aggarwal provided research assistance.
Abstract
Background: The U.S. Department of Housing and Urban Development (HUD), in collaboration with the Centers for Medicare and Medicaid Services, allocated Housing Choice Vouchers to 28 public housing authorities (PHAs) in January 2011. PHAs were required to partner with the state Money Follows the Person program, or the relevant health and human services (HHS) agency, to help voucher recipients access the community-based services and supports necessary for independent living. The vouchers, known as non-elderly disabled Category 2 (NED2) housing choice vouchers, were exclusively available for non-elderly disabled people who lived in an institution.
Objectives: (1) To identify effective implementation methods by assessing patterns between voucher distribution rates and approaches to program operations; and (2) to estimate the impact of the availability of NED2 vouchers on the rate of transition from institutions to the community.
Data Sources: Phone discussions with PHA and health agency staff (process study); HUD administrative data, the Minimum Data Set, and the National Provider Identifier Registry (impact analysis).
Study Design: Via semi-structured interviews with staff at PHAs and health agency partners in the 13 sites that received at least 35 vouchers, we examined the processes used to implement the major program components. We also assessed the vouchers' impact on transitions from nursing facilities (nearly all voucher users initially resided in such settings and data were unavailable for those in other institutions) to the community in the five treatment PHAs that issued and leased the most vouchers in 2011. To do this, we used a difference-in-differences method to estimate how likely nursing home residents eligible for NED2 vouchers were to move to the community before and during the period of voucher availability, compared with similar people who did not have access to vouchers.
Principal Findings: Several implementation procedures were associated with a quicker distribution of vouchers, including strong communication between PHA and health staff, the involvement of a housing specialist, and relaxed portability rules for vouchers. Results from the quantitative analysis indicate that voucher use was most common among people who were male, unmarried, had relatively few functional limitations, and lived in an institution for more than one year. Further, in a pooled sample of three of the five sites, NED2 vouchers were found to increase community transition rates by 8.7 percentage points, an impact that was not significantly different from the maximum potential impact of 10.6 percentage points. The estimated impact is large relative to the 19.0 percent transition rate among a similar group of people in the treatment areas during the period before vouchers were made available.
Conclusions: The success of NED2 vouchers hinges on how well they are targeted. Vouchers are more quickly distributed when allocated to PHAs with well-established relationships with their HHS partners. Further, targeting vouchers to communities with low transition rates has the potential for larger impacts on the number of transitions, compared with communities with higher transition rates at baseline. However, even among PHAs and partners with a demonstrated capacity to support an efficient NED2 voucher program, barriers to finding affordable and accessible housing persist. Additional efforts to overcome these barriers may be worth the investment if the total costs to Medicaid, Medicare, and HUD are less than the cost of paying for longer stays in an institution.
Acronyms
The following acronyms are mentioned in this report and/or appendices.
| CMS | Centers for Medicare and Medicaid Services |
|---|---|
| HCV | Housing Choice Voucher |
| HHS | Health and Human Services Agency |
| HUD | U.S. Department of Housing and Urban Development |
| ICF-ID | Intermediate Care Facility for Individuals with Intellectual Disabilities |
| MD-DHCD | Maryland Department of Housing and Community Development |
| MDS | Minimum Data Set |
| MFP | Money Follows the Person |
| MOU | Memorandum of Understanding |
| MSIS | Medicaid Statistical Information System |
| NED | Non-Elderly Disabled |
| NED2 | Non-Elderly Disabled Category 2 Housing Choice Voucher |
| NOFA | Notice of Funding Availability |
| NPI | National Provider Identifier |
| NPPES | National Plan and Provider Enumeration System |
| PHA | Public Housing Authority |
| PIC | Public and Indian Housing Information Center |
| SSI | Supplemental Security Income |
| TA | Technical Assistance |
| TAC | Technical Assistance Collaborative |
Executive Summary
The Housing Choice Voucher (HCV) program for institutionalized, non-elderly disabled (NED) people stems from the 1999 case Olmstead v. L.C. (527 U.S. 581), in which the U.S. Supreme Court declared that people with disabilities are entitled to receive services in "the most integrated setting appropriate." This ruling required states to expand options for individuals with disabilities to live in community residences rather than institutions such as nursing facilities. Key to making community-based independent living possible is the availability of affordable, accessible housing.
To help expand the availability of rental subsidies for disabled individuals admitted to institutions who would be at risk of longer stays without such assistance, the U.S. Department of Housing and Urban Development (HUD), in collaboration with the Centers for Medicare and Medicaid Services, funded 948 Category 2 HCVs for NED individuals (referred to as NED2 vouchers). HUD allocated these HCVs to 28 public housing authorities (PHAs) in 15 states in January 2011 and required each PHA to partner with its state health and human services (HHS) agency or the state Money Follows the Person (MFP) demonstration program. These collaborating entities would be responsible for arranging and coordinating access to the community-based services and supports voucher recipients would need after leaving institutional settings. Citing long waiting lists for regular HCVs and the major barrier presented by unaffordable housing to MFP programs, federal officials expected each NED2 voucher to be issued and leased (that is, used to rent a unit) within one year of the award and for the vouchers to have a positive impact on the overall rate of transition in the designated areas.
This report summarizes the major findings of an evaluation, conducted by Mathematica Policy Research under a contract with the U.S. Department of Health and Human Services, Office of the Assistant Secretary of Planning and Evaluation, of the implementation of the NED2 HCV program and its effects on enabling institutionalized individuals to make transitions to community housing.
The study had two specific objectives: (1) to identify effective implementation methods by examining the rate at which the vouchers were issued and leased overall and by site, comparing the implementation approaches used by the PHAs and their HHS/MFP partners, and analyzing patterns between implementation approaches and voucher distribution rates; and (2) to estimate the impact of the NED2 program on the rate of transition from institutions to community-based settings among the eligible population in selected sites.
The report is organized as follows. In Chapter I, we provide an overview of the origin and need for the NED2 voucher program and a brief description of its design. In Chapter II, we explain the methods and major findings from the implementation and process analysis, which examined trends in voucher distribution in 13 of the 28 PHA regions (those that were provided with more than 35 vouchers each), and describe the barriers to and facilitators of program implementation across the sites and within each one. In Chapter III, we present methods, data, and findings from the impact analysis on the rate of transitions from nursing facilities (nearly all voucher users initially resided in such settings and data were unavailable for those in other institutions) to the community in the eligible population in the five sites with sufficient and reliable data. In Chapter IV, we draw conclusions from both analyses to provide lessons that can inform and improve future policies and programs designed to help low-income NED individuals make successful transitions from institutions to the community. Chapter II, Chapter III, and Chapter IV are summarized briefly below.
I. Introduction and Background
In 2009, the U.S. Department of Housing and Urban Development (HUD), in partnership with the Centers for Medicare and Medicaid Services (CMS), announced the availability of nearly 1,000 housing choice vouchers (HCVs) to low-income, non-elderly individuals with disabilities who were residing in institutions, with the intention of making rental costs affordable for those who wished to return to the community. This report presents the findings from an evaluation of the implementation and effects of this Non-Elderly Disabled Category 2 (NED2) HCV program.
The origins of the HUD HCV program for institutionalized non-elderly disabled (NED) individuals between the ages of 18 and 62 can be traced to the 1999 U.S. Supreme Court ruling in Olmstead v. L.C. (527 U.S. 581) that people with disabilities are entitled to receive services in "the most integrated setting appropriate."1 This ruling required states to expand options for individuals with disabilities to live in community residences rather than institutions. The availability of affordable, accessible housing is central to making community-based independent living possible for adults with disabilities. Yet, a decade after the Olmstead v. L.C. (527 U.S. 581) decision, the ability to make a transition from institutional care to the community continues to be hindered by the unavailability of appropriate housing.
Non-elderly Medicaid beneficiaries who are disabled and receiving institutional care--most of whom qualify for Medicaid through eligibility for and receipt of Supplemental Security Income (SSI)--have extremely low incomes; incomes of those receiving SSI averaged less than $8,100 a year in 2011 (Social Security Administration 2011). These beneficiaries also need a wide range of health care and social services and supports. Medicaid institutional care is costly, however, and studies have shown that, by comparison, home and community-based care produces an average savings of nearly $44,000 per individual among people of all ages (Kitchener 2006). Moreover, individuals who successfully make the transition from an institution to the community typically experience an improvement in quality of life (Simon 2011). Consequently, federal and state governments have sought to improve the capacity of long-term services and support systems to serve people with disabilities in the community rather than in institutions.
Since 1999, the Federal Government has authorized several grant and demonstration programs designed to help individuals residing in institutions move back to the community. One of the largest of these demonstration programs, administered by CMS, is the Money Follows the Person (MFP) Demonstration, initially enacted under the Deficit Reduction Act of 2005 and extended through 2016 by the Patient Protection and Affordable Care Act of 2010. By December 2011, the program had awarded MFP grants to 43 states and the District of Columbia and had helped nearly 20,000 disabled and elderly Medicaid beneficiaries make transitions to home or community residences. Nearly every state MFP program, however, has cited an insufficient supply of affordable, accessible housing and/or housing vouchers as persistent barriers to allowing more individuals to transition into the community (Lipson et al. 2011; Williams et al. 2012).
In 2010, the average one-bedroom apartment cost more in rent annually than the entire annual income of an individual receiving SSI, and "there was not one state or community in the nation where a person with a disability receiving SSI could afford to rent modest rental housing without a permanent rental subsidy" (TAC 2011). To help low-income individuals with disabilities obtain housing, the Federal Government has, over the years, authorized a variety of subsidy programs, including the Section 811 Supportive Housing for Persons with Disabilities program, which provides funds for the development of affordable housing linked with services and supports, and the HCV program, which provides direct subsidies to offset rental costs. Over the past decade, however, the Section 811 program has produced fewer units than needed to keep up with demand, and the demand for HCVs has far exceeded the supply, as well. As a result, individuals must often wait months or years for either type of housing assistance.
Through the 2009 federal Community Living Initiative, launched on the 10th anniversary of the Olmstead v. L.C. (527 U.S. 581) decision, the U.S. Department of Health and Human Services and HUD collaborated to identify ways to improve the NED population's access to housing, community supports, and independent living arrangements. In 2010, Congress passed the Frank Melville Supportive Housing Investment Act, which reformed and revitalized the Section 811 program to address many of its limitations and permanently designated 55,000 HCVs for NED individuals.
To address specifically the needs of people living in institutions or those at risk of long-term institutionalization, HUD, in collaboration with CMS, announced on April 7, 2010, a Notice of Funding Availability (NOFA) for Rental Assistance for Non-Elderly Persons with Disabilities [HUD NOFA, FR-5332-N-02].2 Its purpose was to expand the availability of rental subsidies for people who would be at risk of institutionalization or a long-term stay in an institution without such assistance.3 This funding ultimately supported 4,321 HCVs for NED households currently living in the community and at risk of institutionalization (Category 1) and 948 HCVs for NED individuals seeking to make a transition to the community from an institution (Category 2). The latter are the focus of this report.
To be eligible to apply for the NED Category 2 voucher program (henceforth referred to as NED2), HUD required local public housing authorities (PHAs), which handle local administration of HCVs, to partner with a state health and human services (HHS) agency or an MFP program (MFP) that would be responsible for arranging access to health and support services, including case management, needed by voucher recipients. HUD also required applying PHAs to demonstrate that they had experience in serving the NED population and resources for supportive services available to them through their partnership with the state HHS/MFP agency.
Of the more than 3,400 PHAs nationwide, 68 submitted qualifying applications for NED2 vouchers. Because the number of vouchers requested exceeded available funds, HUD used a lottery system to award 948 NED2 vouchers to 28 PHAs in 15 states, listed in Table I.1. When HUD made the awards in January 2011, it did not specify an official date by which unissued vouchers would expire or be recalled. It indicated to PHAs, however, that they were expected to issue and lease4 all NED2 vouchers within one year--that is, by January 2012.5 Throughout 2011, local HUD offices monitored PHAs' progress and provided guidance to those within their jurisdictions. To provide technical assistance (TA) to PHAs and to state HHS/MFP programs, CMS contracted with New Editions Consulting, which also provided TA separately to all MFP grantees. New Editions subcontracted with the Technical Assistance Collaborative (TAC), an organization that specializes in housing needs among low-income people with disabilities; together, the two entities provided limited general TA to all PHAs receiving awards, as well as more in-depth TA to five states to strengthen their housing-MFP collaborations.6
To receive a NED2 voucher, an individual must meet certain eligibility criteria. According to the NOFA, a NED family is one in which the head member, spouse, or sole member is a person under the age of 62 who has a disabling condition. HUD defines an individual with a disability as "any person who has a physical or mental disability that substantially limits one or more major life activities; has a record of such an impairment; or is regarded as having such an impairment" (24 Code of Federal Regulations 8.3). The applicant must also meet HUD's HCV income eligibility requirements.7 Although applicants are not required to be Medicaid recipients, those approved are likely to be Medicaid eligible, given HUD's low-income eligibility threshold. Finally, a potential voucher recipient must reside in an eligible institution at the time the voucher is awarded.8
In December 2011, nearly a year after the awards, only about one-third of the 948 vouchers had been leased (that is, used to rent a unit), with some PHAs reporting no vouchers in leased status. HUD officials urged the PHAs to step up efforts to issue and lease the vouchers, and HUD, CMS, and the TA providers focused their assistance on identifying and overcoming reported roadblocks.
In the next chapter, we explain the reasons for this unexpected result and examine how the program was implemented in 13 PHAs that were awarded more than 35 vouchers each to assess whether certain approaches to the implementation process appeared to contribute to greater or lesser success in leasing the vouchers within the original expected time frame. Then, in Chapter III, we examine the impact of the NED2 vouchers on the rate of transitions among the eligible population. In Chapter IV, we bring together results from both process and impact analyses to draw lessons to apply to similar programs and policies intended to help individuals in institutions move to and live independently in the community.
| TABLE I.1. Awarded NED2 HCBS, by State and by PHA | |||
|---|---|---|---|
| State | PHA | HHS/MFP Partner | Number of Awarded NED2 Vouchers |
| Arizona | Pima County | Pima Health Systems, Department of Developmental Disabilities, Community Partnership of Southern Arizona | 25 |
| California | Orange County Housing Authority | Dayle McIntosh Center | 50 |
| City of Pasadena Community Development Commission | Alternative Home Care | 40 | |
| County of Santa Barbara Housing Authority | Tri Counties Regional Center | 25 | |
| County of Santa Clara Housing Authority | Silicon Valley Independent Living Center | 10 | |
| Alameda County Housing Authority | East Bay Innovations | 10 | |
| Florida | Collier County Housing Authority | David Lawrence & National Alliance on Mental Illness | 25 |
| Georgia | City of Decatur | Georgia Department of Medical Assistance | 35 |
| Illinois | Oak Park Housing Authority | Illinois Department of Healthcare & Family Services | 15 |
| Springfield Housing Authority | Springfield Center for Independent Living | 10 | |
| Maryland | Baltimore County Housing Office | The Coordinating Center | 50 |
| Housing Authority of Baltimore City | The Coordinating Center | 40 | |
| Maryland Department of Housing & Community Developmentb | Maryland Department of Health & Mental Hygiene | 12 | |
| Howard County Housing Commission | The Coordinating Center | 10 | |
| Massachusetts | Lynn Housing Authorityb | Massachusetts Executive Office of Health & Human Services | 35 |
| Michigan | Traverse City Housing Commission | Northern Healthcare | 10 |
| New Jerseya | New Jersey Department of Community Affairs | Division of Mental Health & Addiction Services, Division of Developmental Disabilities, Division of Disability Services | 100 |
| New York | Town of Amherst | Headway of Western New York, Western New York Developmental Disabilities Services Office; Erie County Department of Mental Health | 20 |
| North Carolina | Housing Authority of the City of Wilmington | Money Follows the Person | 5 |
| Ohio | Cincinnati Metropolitan Housing Authority | Ohio Department of Jobs & Family Services | 100 |
| Lucas, Ohio Metropolitan Housing Authority | Lucas County Department of Jobs & Family Services | 60 | |
| Pennsylvania | Dauphin County Housing Authority | Center for Independent Living of Central Pennsylvania | 10 |
| Texas | Austin Housing Authority | Texas Department of Aging & Disability Services, Austin Resource Center for Independent Living | 36 |
| Washington | Housing Authority of the City of Tacoma | Department of Social & Health Services | 100 |
| Housing Authority of Snohomish County | Department of Social & Health Services | 50 | |
| City of Longview Housing Authority | Department of Social & Health Services | 35 | |
| Housing Authority of the County of Clallam | Department of Social & Health Services | 15 | |
| Housing Authority of the City of Yakima | Department of Social & Health Services | 15 | |
| Total NED2 Vouchers Awarded | 948 | ||
| SOURCE: HUD. NOTES:
| |||
II. Ned2 Program Implementation
Prior to the release of the HUD NOFA for the NED program, it was widely believed that demand for housing vouchers among low-income, non-elderly individuals admitted to institutions would be high, and that such vouchers could be issued and leased with relative ease. This belief was fueled by state MFP staff, who identified lack of affordable housing as a significant barrier to transitions from institutions to the community, and by the existence of long waiting lists for HCVs more generally. HUD and CMS expected PHAs to issue and lease the NED2 vouchers within one year of the award, by January 2012.
Most PHAs fell far short of this expectation, however. By December 2011, only 34 percent of the 948 NED2 vouchers had been issued and leased.9 Few involved in program implementation on the ground believe this was due to overestimation of need for the vouchers. Rather, program implementation took longer than expected, and the voucher application and housing search processes proved far more challenging than PHAs and their partners anticipated. Gaining an understanding of these challenges may help HUD identify ways to improve the design of the program and better align its goals with what is actually involved in implementing a voucher program targeted to NED individuals who are residing in institutions.
In this chapter, we briefly describe the methodology we used to conduct the process evaluation and then present data on the number of vouchers issued and leased from June 2011 through the summer of 2012, overall and by site. We then examine and compare how the NED2 program was implemented across the sites by describing how PHAs and state HHS/MFP agencies carried out its major components--cross-agency coordination, staff training, outreach to and recruitment of potential applicants, referral and application processes, housing search assistance, and special accommodations. We conclude by identifying common barriers to, and facilitators of, higher voucher issuance and lease rates, the factors that appear to explain variation in these rates early in the implementation process, and some key lessons learned.
A. Methodology
Although 28 PHAs were awarded NED2 vouchers, for the purpose of this analysis we focused on the 13 that received at least 35 vouchers each, since those receiving fewer had less experience by which to judge their success in implementation. The 13 PHAs in eight states that met this threshold are listed in Table II.1.10 Collectively, they received 731 vouchers--77 percent of all vouchers awarded nationwide.
| TABLE II.1. PHAs and HHS/MFP Partners Included in Process Evaluation, by State (PHAs awarded 35 or more vouchers) | |||
|---|---|---|---|
| State | PHA | HHS/MFP Partner | Number of Awarded NED2 Vouchers |
| California | Orange County Housing Authority | Dale McIntosh Center | 50 |
| City of Pasadena Community Development Commission | Alternative Home Care | 40 | |
| Georgia | City of Decatur | Georgia Department of Medical Assistance | 35 |
| Maryland | Baltimore County Housing Office | The Coordinating Center | 50 |
| Housing Authority of Baltimore City | The Coordinating Center | 40 | |
| Massachusettsa | Lynn Housing Authority | Massachusetts Executive Office of Health & Human Services | 35 |
| New Jerseyb | New Jersey Department of Community Affairs | Division of Mental Health & Addiction Services, Division of Developmental Disabilities, Division of Disability Services | 100 |
| Ohio | Cincinnati Metropolitan Housing Authority | Ohio Department of Jobs & Family Services | 100 |
| Lucas, Ohio Metropolitan Housing Authority | Lucas County Department of Jobs & Family Services | 60 | |
| Texas | Austin Housing Authority | Texas Department of Aging & Disability Services; Austin Resource Center for Independent Living | 36 |
| Washington | Housing Authority of the City of Tacoma | Washington State Department of Social & Health Services | 100 |
| Housing Authority of Snohomish County | Washington State Department of Social & Health Services | 50 | |
| City of Longview Housing Authority | Washington State Department of Social & Health Services | 35 | |
| Total NED2 Vouchers Awarded | 731 | ||
| SOURCE: HUD. NOTES:
| |||
This process analysis drew from two sources of data. The first was voucher distribution data received from TAC, which, through a subcontract with New Editions, contacted each of the 28 PHAs that received NED2 vouchers. TAC determined all PHAs' progress through informal quarterly phone and email contacts (in June 2011, September 2011, and December 2011), obtaining information from PHA staff that included current numbers of NED2 voucher referrals, applications, vouchers issued (including those still searching for housing), and vouchers leased.11
Second, Mathematica held phone discussions with staff at the PHAs and state or local HHS/MFP programs,12 using a semi-structured discussion guide, developed with input from TAC, New Editions, CMS, and HUD, that covered the following topics:
-
History of collaboration and communication between each PHA and HHS/MFP staff prior to the NED2 program.
-
Role of the HHS/MFP staff in preparing the PHA's NED2 application to HUD.
-
Training and education of relevant staff following the award.
-
Program outreach and participant recruitment procedures.
-
How PHA and HHS/MFP frontline staff coordinated the process of making referrals and submitted voucher applications for NED2-eligible groups.
-
Level and type of assistance provided to applicants during the application process.
-
Level and type of assistance provided to voucher recipients during the housing search.
-
Responsibility for tracking referrals and issued vouchers.
-
Extent to which existing PHA policies afforded special accommodation to people with disabilities--such as making vouchers immediately portable across the state--or were amended during the NED2 program.
-
Level and frequency of communication and coordination among program staff throughout the program.
These discussions occurred between July and September 2012 with representatives from ten of the 13 selected PHA sites and members of all eight state or local HHS/MFP teams, including project directors, statewide housing specialists or coordinators, and transition coordinators.13 In each state, discussions with representatives from PHAs took place separately from discussions with HHS/MFP program staff.
B. Trends in Voucher Issue and Lease Rates
Data reported by PHA staff to TAC on voucher issue and lease numbers, supplemented by data obtained during Mathematica discussions with PHAs during summer 2012, provided a snapshot at each of four points in time (June 2011, September 2011, December 2011, and summer 2012) of each PHA's progress in issuing and leasing the NED2 vouchers. These data points, presented in the aggregate in Figure II.1, demonstrate that it took PHAs longer to lease the vouchers than initially expected. In June 2011, five months after the initial award, only 5 percent of the 731 vouchers awarded to the 13 PHAs in this analysis were leased, with 23 percent either issued or leased. By December 2011, a month before HUD expected all vouchers to be fully leased, only 36 percent were leased, with 61 percent either issued or leased. By summer 2012, 79 percent of the vouchers were leased, and 93 percent were either issued or leased.
| FIGURE II.1. Percentage of Vouchers Leased, and Issued or Leased, Among 13 PHAs |
|---|
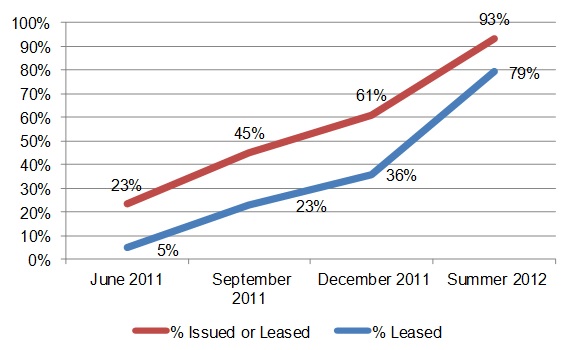 |
| SOURCE: Data points for June, September, and December 2011 were collected by TAC; those for summer 2012 were collected by Mathematica staff. |
Aggregating these data masks significant variance among the 13 PHAs, however. (See Figures A.1 through A.13 in Appendix A, which show issue and lease rates over time for each individual PHA.) In June 2011, five months after the award, the majority of PHAs had issued or leased very few vouchers:
-
Six PHAs reported having at least 20 percent of their vouchers in issued or leased status: those in Pasadena, California; Baltimore County and Baltimore City, Maryland; New Jersey; Cincinnati, Ohio; and Snohomish County, Washington. Of these, Baltimore City had the most impressive start, with 65 percent of its vouchers issued or leased and more than a third of them in leased status.14
-
The remaining seven PHAs--in Decatur, Georgia; Orange County, California; Lynn, Massachusetts; Lucas County, Ohio; Austin, Texas; and Longview and Tacoma, Washington--all reported fewer than 20 percent of their vouchers in issued or leased status, with six reporting no vouchers leased at all. Two of these PHAs--Decatur and Lynn--reported no vouchers leased or issued.
In December 2011, nearly a year after the award, the majority of PHAs continued to show relatively low lease rates. About one month before HUD had expected all vouchers to be leased, only three PHAs--Baltimore City, New Jersey, and Snohomish County--reported having at least 85 percent of theirs issued or leased, and, of these, only Snohomish County and Baltimore City had at least 50 percent leased. The remaining ten PHAs reported fewer than two-thirds of their vouchers in issued or leased status, and all ten reported fewer than 50 percent of their vouchers as leased. Three PHAs--Orange County, Lynn, and Lucas County--reported fewer than 10 percent of their vouchers leased in December.
By summer 2012, however, the majority of the 13 PHAs reported higher leasing rates; only 21 percent of all NED2 vouchers were still not leased. Nine PHAs reported 100 percent of vouchers in either issued or leased status: Lynn, Baltimore County, Baltimore City, New Jersey, Cincinnati, Lucas County, Snohomish County, Longview, and Tacoma. All nine reported high lease rates; the lowest was 74 percent, in Baltimore County. Cincinnati was the only PHA to report 100 percent of its vouchers as leased. Four PHAs, however--Orange County, Pasadena, Decatur, and Austin--reported fewer than 85 percent of vouchers as being issued or leased, and fewer than 70 percent as leased. Orange County reported the lowest leasing rate, at 36 percent.
As these numbers suggest, some sites, particularly Baltimore City, New Jersey, and Snohomish County, had greater success than others in leasing a large proportion of their awarded vouchers early. Progress for Lynn, Baltimore County, Cincinnati, Lucas County, Longview, and Tacoma was slower, but each was able to issue or lease all of its allotted vouchers by summer 2012. A year and a half after the award, however, the remaining PHAs in Orange County, Pasadena, Decatur, and Austin, while citing some progress in 2012, continued to report many of their vouchers unused. We examined the implementation process in each of the 13 sites to determine if noticeable differences in approach, experiences, and barriers might explain the variation in progress.
| TABLE II.2. Implementation Protocol by Site | ||||||||
|---|---|---|---|---|---|---|---|---|
| State | Site | PHA-HHS/MFP Previous Relationship | Involvement of HHS/ MFP in Application | Efforts to Train & Educate Staff | Centralized Coordination of Referral Process | MFP Housing Specialist Involved | PHA-HHS/MFP Communication | Central Database/ Tracking System |
| Most Vouchers Issued and Leased Within the First Year of NED2 Program (>85%) | ||||||||
| New Jersey | New Jersey | No | High | Immediate | Yes | Yes | High | Yes |
| Maryland | Baltimore City | Yes | Medium | Immediate | Yes | Yes | High | Yes |
| Washington | Snohomish County | No | High | Immediate | Yes | Yes | High | Yes |
| All Vouchers Issued and Leased by Summer 2012 (100%) but Not Within the First Year of NED2 Program | ||||||||
| Maryland | Baltimore County | Yes | Medium | Immediate | Yes | Yes | High | Yes |
| Massachusetts | City of Lynn | No | High | Immediate | Yes | Noa | High | Yes |
| Ohio | City of Cincinnati | No | High | Immediate | Yes | Yes | High | Yes |
| Lucas County | No | High | Immediate | Yes | Yes | High | Yes | |
| Washington | City of Tacoma | No | High | Immediate | Yes | Yes | High | Yes |
| City of Longview | No | High | Immediate | Yes | Yes | High | Yes | |
| Fewest Vouchers Issued and Leased Within the First Year of NED2 Program (<60%) and by Summer 2012 (<85%) | ||||||||
| California | Orange County | No | Low | Delayed | No | No | Low | No |
| City of Pasadena | No | None | Delayed | No | No | Low | No | |
| Georgia | City of Decatur | No | Low | Delayed | No | No | Low | No |
| Texas | City of Austin | Yes | High | Immediate | No | No | High | No |
| SOURCE: Mathematica analysis of information obtained from PHA and HHS/MFP staff. NOTE:
| ||||||||
C. Variation in Program Implementation
Although the NOFA established some national standards for the NED2 program, sites were given broad flexibility in implementing these standards, resulting in diverse implementation protocols across communities. In this section, we explore the variation among sites in terms of how they: (1) collaborated in the HUD application process; (2) trained and educated relevant staff; (3) conducted outreach and recruitment; (4) tracked referrals and assisted applicants with required forms and documents; (5) assisted in housing searches; and (6) adjusted PHA policies to accommodate the special needs of NED2 voucher recipients. Table II.2 provides a snapshot of how the 13 sites differed in these implementation procedures.
1. PHA-HHS/MFP Collaboration in the Application Process
A core requirement of the NED2 program was a partnership between PHAs and their respective state HHS or MFP agencies, designed to apply the knowledge and strengths of each partner to meet the housing and health and social service needs of the NED2-eligible population. In some sites, the NED2 program was built on a previous relationship between the two groups, or on relationships with organizations that maintained close ties with the PHAs. For example, the Texas MFP project director had an existing relationship with the state housing finance agency; the Ohio MFP program maintained strong ties to the state PHA association; and the Maryland MFP program has had a longstanding partnership with the Coordinating Center, a non-profit organization that provides transition coordination for the state MFP program, but also works closely with the state's PHAs on housing issues for people with disabilities. These existing connections were regarded as assets during the application development process and throughout program implementation. In other states, however, the relationships between the housing and HHS/MFP teams before the NOFA was released were weak or non-existent, particularly in California, Georgia, and Washington (at the local level, if not the state level). Because staff in these states were not familiar with each other or with each other's rules and processes, more time had to be spent sorting out respective roles and responsibilities.
Perhaps equally important was the extent to which the PHAs that had been awarded vouchers were familiar or had experience with the NED and/or institutionalized population. Although all had at least some experience serving disabled or special needs populations, none reported significant experience with serving people residing in institutions; thus, they needed to rely heavily on their HHS/MFP partners to identify and address the complex needs of the NED2 population. Even without direct experience with institutional residents, some PHAs may have applied lessons learned from extensive experience serving people with disabilities and special needs. Baltimore City, for example, entered into a consent decree in 2005 that required the creation of 1,850 new housing opportunities for non-elderly persons with disabilities.15 This experience resulted in increased awareness among PHA staff there of the complex medical needs of the NED population and strengthened the PHA's relationship with state disability advocates.
Upon release of the NOFA, HHS/MFP project teams in each state reached out to their state's network of PHAs both to generate and determine the level of interest in pursuing the NED2 voucher program. The Washington MFP program, which did not have a previous relationship with the individual PHAs, organized a statewide meeting in advance of the NOFA and took steps to begin drafting a memorandum of understanding (MOU) to demonstrate a partnership between housing and HHS/MFP agencies and indicate how referrals would be made. Similarly, the PHA in Orange County proactively began work on an MOU prior to the NOFA release. In an effort to encourage widespread interest in the voucher program, the Georgia HHS/MFP team coordinated a first-of-its-kind state Medicaid/housing forum, with representatives from all of the state's PHAs. The MFP team in Maryland asked its collaborator, the Coordinating Center, to assemble a task force to identify resources for putting together the application and to determine if the state had the necessary infrastructure to pursue the program. States believed these early efforts helped strengthen their applications and forged relationships they could take advantage of in the future.
After initial efforts to encourage application submissions, most HHS/MFP teams remained in close contact with interested PHAs and played a significant role in the application development and submission process. In two states, however--Georgia and California--the MFP teams were unaware of which PHAs ultimately applied, despite the early efforts to promote submission. The state MFP staff in California was surprised to discover that the PHA in Pasadena had applied without having identified a local MFP lead partner agency in its application. That experience contrasted with, for example, that of Massachusetts, where the HHS team wrote selected sections of the PHA's application. Program representatives in ten of the 13 sites recalled the states' HHS/MFP teams having participated in estimating the number of vouchers to include in their applications. All PHAs except Pasadena collaborated with the HHS/MFP team in developing the MOU, although it was not required by the NOFA. The MFP staff in Washington, however, noted that the draft MOU in the original application was not finalized until after the announcement of awards to specific PHAs.
The NOFA required each applicant to base its request for NED2 vouchers on a reasonable projection of the number of individuals who would be eligible for and in need of the vouchers, using estimates by the HHS/MFP team. The state MFP programs may not have had sufficient local data available to calculate useful estimates, however. In Georgia, where vouchers were needed across the state and some PHAs had rules restricting voucher "porting" during the first year,16 the MFP team had hoped HUD would award just a few vouchers to the 5-6 PHAs interested in applying for them to distribute across the state. Instead, the Decatur PHA application requested 35 vouchers; the state MFP team believed this was more than was needed, and the excess contributed to Decatur's lower voucher utilization rate.
2. Initial Efforts to Inform and Educate Relevant Staff
Upon announcement of the voucher awards, states took action to begin setting up their programs, with notable delays occurring in two of them: California and Georgia. The MFP teams in both noted a delay in finding out which PHAs were awarded vouchers, which may have been due to high-level staffing changes within the two state MFP programs. Regardless of the reason, the result was delays in training and preparation of MFP staff. In California, local MFP agencies were not involved in the Pasadena PHA application, so more effort was required to develop relationships with local MFP partner agencies; this also delayed recruitment of potential voucher applicants.
The other six states moved quickly to set up face-to-face meetings, workshops, and "get-to-know-you" seminars between PHA and HHS/MFP staff, and to establish or refine the referral process. Washington and Ohio both relied on HHS/MFP-funded housing specialists to play a central role, engaging and training transition coordinators on housing issues and educating PHA staff about transition services. These initial education efforts were considered essential, but took several months to establish. For this reason, said Washington, which created an extensive cross-agency communication network between the HHS/MFP staff and the five awarded PHAs, its NED2 program was not fully operational until August 2011, six months after the vouchers were announced.
3. Outreach to and Recruitment of Potential Applicants
To recruit applicants, all sites first sought to identify eligible candidates on existing HCV waiting lists, as required by HCV program regulations. After that, HHS/MFP transition coordinators or case managers in each state or region were primarily responsible for identifying additional eligible applicants. Although HUD said referrals could originate with organizations other than the HHS/MFP partner, few states reported referrals obtained this way. One that did was Massachusetts, where Centers for Independent Living were strongly encouraged to make such referrals, although all referrals had to go through one of three state agencies before submission to the Lynn PHA (see next section for further details). The Ohio MFP team said responses to Section Q of the Minimum Data Set (MDS) Resident Assessment Instrument were a useful source for identifying potential applicants in the Cincinnati area.17 In most states, PHA staff indicated their HHS/MFP counterparts were successful in identifying potential applicants.
A few sites reported a shortage of referrals, at least initially. Washington, for example, reported few referrals early on, which led the team to intensify efforts to educate transition coordinators and case managers about the program and its eligibility criteria. Similarly, after receiving few referrals in Baltimore County in the early stages of the program, the team regrouped and developed an enhanced outreach effort that ultimately led to an increase in referrals. In both cases, staff at the PHAs and the HHS/MFP program worked together to identify the problem and develop a solution.
Similar shortages of referrals occurred in Decatur and Orange County, but in contrast to Washington and Baltimore, both of these situations were attributed to staffing shortages. In Georgia, identifying potential applicants was the primary responsibility of the MFP transition coordinator assigned to the Decatur area, as well as the MFP statewide housing specialist. But from fall 2011 through much of 2012, the MFP program in Georgia had neither a housing specialist nor a project director, and the remaining team members were unable to devote adequate resources to the NED2 program. As a result, the PHA received an insufficient number of referrals.
Similarly, by the end of 2011, the PHA in Orange County stopped receiving referrals from their assigned local MFP partner. The agency was reportedly under a hiring freeze and unable to assign sufficient resources to MFP or the NED2 program. Concerned they would not receive an adequate number of referrals, the PHA team began working directly with the state core MFP team, TAC, and their local HUD office to find a solution. It was eventually determined that the PHA could receive referrals from local MFP agencies in surrounding areas, as long as the PHA kept the assigned lead agency informed about the referrals received. This protocol was officially adopted in early 2012, after the initial January 2012 HUD deadline, and resulted in increased referrals.
4. Referrals, Application Assistance, and Tracking
The NOFA did not provide specific guidelines for how applicants should be referred between the HHS/MFP team and the assigned PHA, the level or type of assistance to be provided to individuals in completing applications, or how the status of referrals and applications should be tracked.
In all sites, the HHS/MFP transition coordinator or case manager was responsible for helping the applicant complete the voucher application and collect the necessary documentation, with varying levels of assistance and involvement from PHA staff. The PHA in Austin, for example, often assisted the MFP team in collecting the necessary information for the application, and frontline staff at the two organizations communicated with each other several times a week regarding active applications. In contrast, the MFP program in Washington funded three regional housing specialists who were assigned the task of coordinating, collecting, and reviewing the NED2 applications from local transition coordinators so PHA staff could be confident the applications they received met HUD and PHA requirements and would be approved quickly.
In some sites, notably Austin, Decatur, Orange County, and Pasadena, the applications were forwarded to the PHA directly from individual transition coordinators, whereas in all other sites, a point person was assigned to review and coordinate submissions. In Ohio, for example, transition coordinators submitted completed applications to the MFP statewide housing specialist, who reviewed and forwarded each to the appropriate PHA, essentially acting as the single point of contact between the MFP field staff and the PHAs. New Jersey, with its single statewide housing agency, adopted a similarly centralized and streamlined approach. For each of the three target population groups, the state identified a statewide point person responsible for working with the transition coordinators in finalizing the application package before forwarding it to the MFP statewide housing coordinator, who would review the application for quality assurance before sending it to the PHA for yet another round of review and approval. Once approved by the PHA, the application would then be passed down to the local PHA field office for processing. Team members in these states--HHS/MFP and PHA staff alike--believed these types of centralized and highly coordinated approaches helped ensure applications were completed in a standardized manner, with gaps or problems quickly identified and resolved.
Except for those in California and Georgia, all state teams described regular and frequent communication between PHA and HHS/MFP staff about the status of referrals and applications. Maryland, Massachusetts, and Washington all adopted an approach similar to that of New Jersey and Ohio, described above, in which a single point of contact was responsible for ensuring applications were complete and tracking the status of all referrals and applications. This arrangement also made it possible to identify problems or breakdowns in communication. In Ohio, for example, the Lucas County PHA was initially less engaged in the process than the PHA in Cincinnati; as a result, applications in Lucas County took longer to process in the early stages of the program. The statewide housing specialist assigned to oversee NED2 operations subsequently made additional efforts to reach out and engage staff at the Lucas PHA, ultimately improving communication and overall workflow. In contrast, the PHAs in Decatur and Orange County both noted long periods of no communication with the MFP team.
Following approval of any voucher application, PHAs are required to conduct a briefing with the individual receiving the voucher to explain rules and responsibilities. In Lynn and Decatur, the PHA staff typically contacted the applicant directly to set up an appointment. In the other sites, however, staff typically contacted the assigned transition coordinator or case manager to help coordinate the appointment. HCV guidelines require these briefings to take place in the PHA office, unless there is a reasonable accommodation request. Only Decatur and Cincinnati reported that all briefings took place at the PHA office. In all other sites, briefings were reported as having taken place in the nursing facility or over the phone. Many of these PHAs indicated that, over time, they became more flexible in making these alternatives the norm (see later section on PHA policies).
Except for those in California and Georgia, all state HHS/MFP staff maintained a central database/tracking system of referrals. In Washington, for example, the MFP team created a statewide database into which all applicant and referral information would be entered directly by transition coordinators or case managers. This allowed for broad statewide tracking and made it easy to identify potential problems. Centralized tracking spreadsheets, also used in Maryland, Massachusetts, New Jersey, Ohio, and Texas, were the centerpiece of regular meetings (ranging from weekly to monthly) between HHS/MFP and PHA staff. In Georgia, because of the MFP staffing shortages noted earlier, and in California, because of the decentralized structure of the state MFP program (PHAs worked directly with local MFP lead agencies with minimal involvement of the state MFP team), little or no regular communication or tracking of referrals took place.
5. Housing Search Assistance
PHA staff in all sites indicated that, upon application approval, a case was referred back to the transition coordinator or case manager for assistance with finding a suitable home. Except for those in Georgia and California, all state transition teams included either a single statewide housing specialist or a network of regional specialists to assist with the housing search. Although the Georgia MFP program included a statewide housing specialist position, the position was vacant from September 2011 through much of 2012. Furthermore, staff at the Decatur PHA operated on the belief that the participant was responsible for seeking out assistance and did not necessarily contact the assigned transition coordinator upon approval. Because of the lack of regular communication between the PHA and MFP team in this state, it is unclear whether voucher recipients always received adequate and/or timely assistance. Finally, during the review period, California did not have a statewide housing specialist position, and local MFP lead agencies were not required to have in-house housing specialists of their own.
6. PHA Special Accommodation Policies for the NED2 Program
The NOFA indicated that PHAs should abide by standard policies established under other HCV programs, which included detailed procedures for responding to reasonable accommodation requests and did not specify any significant adjustments for the NED2 program. It became obvious, however, that many policies governing voucher use--specifically, portability, voucher expiration, and applicant briefing protocol--would need to be amended for the NED2 population to include provisions allowing for, or requiring, special accommodation for people with disabilities.18 Some PHAs, in consultation with their HHS/MFP partners, adopted rules specific to NED2 vouchers from the beginning, whereas most others modified their rules during the project period. Table II.3 details the policies each PHA ultimately adopted for the NED2 voucher program. We examine each of the three policy areas individually.
| TABLE II.3. PHA Policies Governing NED2 Housing Choice Vouchers | ||||
|---|---|---|---|---|
| State | Site | Portabilitya | Voucher Expiration for NED2 Program | Applicant Briefings |
| Most Vouchers Issued and Leased Within the First Year of NED2 Program (>85%) | ||||
| New Jersey | New Jersey | Statewide portability | 60 days + 2 30-day extensions | Unknown |
| Maryland | Baltimore City | Allowed immediate portability | Standard time frames waived | Off site |
| Washington | Snohomish County | Evolved to immediate portability | 120 days | Off site, phone |
| All Vouchers Issued and Leased by Summer 2012 (100%), but Not Within the First Year of NED2 program | ||||
| Maryland | Baltimore County | Allowed immediate portability | Standard time frames waived | Off site |
| Massachusetts | City of Lynn | Evolved to statewide portability | 60 days + 60-day extensions | Off site |
| Ohio | City of Cincinnati | Allowed immediate portability | Open extensions granted | Only on-site briefings |
| Lucas County | Allowed immediate portability | Open extensions granted | Unknown | |
| Washington | City of Tacoma | Evolved to immediate portability | 120 days | Off site, phone |
| City of Longview | Evolved to immediate portability | 120 days | Off site, phone | |
| Fewest Vouchers Issued and Leased Within the First Year of NED2 Program (<60%) and by Summer 2012 (<85%) | ||||
| California | Orange County | Allowed immediate portability | 120 days + one 60-day extension | Phone |
| City of Pasadena | Immediate porting not permitted | Open extensions granted | Off site with MFP staff | |
| Georgia | City of Decatur | Immediate porting not permitted | 60 days + open extensions | Only on-site briefings |
| Texas | City of Austin | Immediate porting not permitted | 120 days | Off site |
| SOURCE: Mathematica analysis of information obtained from PHA and HHS/MFP staff. NOTE:
| ||||
a. Portability
HUD HCV regulations instruct PHAs to permit the porting of a voucher, which allows individuals to move, or "port," their vouchers from the issuing PHA to a PHA in another region where they wish to live or can find more suitable housing. For applicants who do not live in the PHA's jurisdiction at the time of application, HUD regulations allow the PHA to require use of the voucher for 12 months in that jurisdiction before permitting portability. Through a webinar hosted by the TA providers in July 2011, HUD clarified that voucher recipients could, in fact, exercise immediate portability, but only if permitted by the PHA. The housing agency in New Jersey operates a statewide system with regional branches; thus, porting vouchers is an easy and common process there. Both Maryland's and Ohio's PHAs also indicated they would permit a NED2 voucher holder to port the voucher immediately upon issuing. Several PHAs in other states, however, indicated they would have welcomed an earlier acknowledgement by HUD that this was allowable. Several also noted that they faced a financial disincentive to port the vouchers and were reluctant to adopt open porting policies.19 The PHAs in Washington and in Lynn, for example, originally established a no-porting policy; however, they both became more lenient over time, with the Lynn PHA eventually adopting a statewide porting policy for the vouchers.
Both Austin and Decatur maintained a no-immediate-porting policy throughout the life of the program. The Austin PHA, in consultation with its MFP partner, considered loosening the porting rules, but ultimately decided against amending its policy due to the financial disincentive and because it had received few requests to port. The Decatur PHA would only permit a voucher to be ported after 12 months of residency within its jurisdiction; as mentioned above, this was the standard policy under the HCV program, but the Georgia MFP team felt it was a hindrance to making referrals, since few participants wanted to move to the Decatur area. In early 2012, the California MFP team began consulting with the regional HUD office and TAC to establish open portability rules that would allow participants to use vouchers freely throughout the state. This policy would have been particularly helpful to the Orange County PHA, which was receiving very few local referrals, but for unknown reasons, it was never adopted.
b. Voucher expiration
Per the NOFA, HUD required a 60-day minimum expiration between voucher issuance and voucher leasing. While no maximum term was established by program regulations, HUD encouraged PHAs to approve longer terms as a reasonable accommodation for this population. All PHAs allowed for an expiration period that went beyond the standard for other voucher programs by either allowing extensions or waiving a time frame altogether. Although several PHAs set a limit for the number of extensions that would be permitted, issued vouchers actually expired only in Orange County. Those vouchers, which often expired due to failure to locate acceptable housing after several extensions, were rescinded, and the referral process was required to start over.
c. Applicant briefings
All voucher recipients are required to be briefed on the details of the voucher program and on their responsibilities. For other HCV programs, recipients attend these briefings in person at the PHA office. For the NED2 population, however, for whom mobility is often a concern, traveling to the PHA for these sessions can be a challenge or even impossible. The PHAs in Decatur and Cincinnati maintained their requirement for potential voucher recipients to attend briefings at the PHA office (with exceptions made upon receipt of a reasonable accommodation request), but all other PHAs adjusted their policies to promote the holding of briefings at the nursing facility or over the phone. A few PHAs even allowed MFP staff to conduct the briefings by proxy.
D. Barriers to Success and Implementation Procedures Associated with Success
Although many challenges and themes reported across PHAs were common to all, regardless of their level of success, some key differences were evident among those able to issue and lease their vouchers earlier than others. In this section, we first discuss challenges common to all sites, particularly challenges centered on the identification and referral of eligible applicants and problems in leasing of issued vouchers and those unique to participant characteristics or circumstances. Then we turn to a discussion of the implementation processes distinguishing the PHAs more successful in issuing and leasing awarded vouchers.
1. Challenges in Identifying and Referring Eligible Applicants
Many PHAs reported receiving very few referrals in the initial months following program rollout, with a lack of communication between PHA and HHS/MFP staff the most commonly cited reason. In many sites, particularly California, Georgia, and Ohio, it was noted that because the transition coordinators had no previous working history with the PHAs receiving the awards, establishing lines of communication and working partnerships took time. The housing specialist in Ohio noted that much of the first half of 2011 was dedicated to engaging the PHAs there, bringing all the relevant staff together, and implementing an effective communication plan. Georgia's circumstance was unique in that the position of statewide MFP housing specialist, the holder of which was responsible for overseeing the partnership, was vacant for most of the program period. The MFP lead agency in Orange County effectively stopped making referrals to the PHA in mid-2011, due to staffing constraints; with no communication with its local partner. As a result, the PHA spent months working with the state team, HUD, and TAC to adopt eventually a contingency plan through which it was able to begin receiving referrals from other lead agencies. Every site that was ultimately successful in issuing and leasing vouchers cited communication among staff as a crucial facilitator.
Initially, PHA rules, or rules governing the PHAs, were themselves a barrier to referrals. In several sites, including Decatur, Lynn, Pasadena, and Orange County, the number of participants wanting to move to the PHA's jurisdiction was insufficient. This was particularly a problem in Decatur, where the PHA did not alter its policy to permit immediate porting. In contrast, after receiving few initial referrals, the PHA in Lynn began allowing vouchers to be ported to surrounding jurisdictions. When that change still produced too few referrals, the program went statewide. A lack of clarity from HUD on porting rules was noted by several state teams, although whether this affected the rate of referrals in those states is not clear. As noted earlier, California worked closely with regional HUD offices and the TA providers to establish open portability rules. These would have had a positive effect on the PHA in Orange County, in particular, which was not receiving a sufficient number of referrals; however, ultimately the statewide plan was never adopted.
Finally, many transition coordinators and case managers lacked a background in housing and may not have been sufficiently educated about housing options during the initial months of implementation. Washington, for example, noted that MFP transition coordinators and case managers initially made few referrals because, they said, most institutional residents preferred to move in with family, into assisted living facilities, or into group homes; fewer wanted to move to apartments and live on their own, for which they would need NED2 vouchers. MFP transition coordinators also said finding suitable apartments required more work and greater knowledge of housing rules. The regional housing specialists, who were responsible for coordinating activities between the local coordinators and the PHAs, stepped up their education and training efforts; ultimately, this led to an increase in both the quantity and suitability of referrals. Staff at the Snohomish PHA, for example, claimed one reason for their success was that the MFP transition coordinators became very good at identifying and referring candidates more likely to qualify for and use the vouchers.
2. Challenges in Leasing Issued Vouchers
By far, the top two barriers to leasing issued vouchers were lack of accessible housing and lack of affordable housing. These obstacles were cited by every PHA and state HHS/MFP team. Lack of affordable housing was a main reason for establishing this and other HCV programs; however, even with vouchers, transition teams often struggled to identify affordable units.
Even when an acceptable unit could be identified, the landlord was often unwilling to reserve it while the service plan was being implemented--a barrier noted by the teams in several states. In California, for example, where MFP often covers the housing deposit for cash-strapped participants, local agencies must navigate a lengthy bureaucratic process that often takes months in order to receive these advances from the state program. Receiving the necessary approvals for the various services and supports in a participant's service plan may take a similarly prolonged period of time. In a state like California, where vacancy rates are low, landlords simply move on to more readily available renters. HHS/MFP staff in other states also noted that obtaining authorization for all of the services needed to implement a community-based care plan could take weeks or months. The process could be even more challenging with a participant making a transition to a rural community in which fewer community-based services and supports are available.
Establishing relationships with landlords and property developers was cited as a critical factor in Maryland's relative success in leasing vouchers. Due to perceived risks, landlords might be reluctant to rent to people with disabilities or complex medical conditions, as noted by program staff in several sites. But intensive outreach could make a difference. Both PHAs in Maryland conducted outreach and/or held occasional workshops to educate developers and landlords about leasing to people with disabilities. Over time, the PHAs forged solid working relationships that allowed for an easier voucher leasing process. Transition coordinators in the state had a list of properties run by familiar and reliable landlords and often were able to identify a unit prior even to submitting the application. Compared to staff in other sites, the transition team in Maryland spent less time persuading landlords to hold properties, allowing for a smoother leasing process.
3. Challenges Related to Participant Characteristics and Circumstances
Missing documentation, bad credit, and a criminal background on the part of applicants were major challenges reported by staff in most of the sites. Most state teams noted that applicants often lacked the necessary eligibility documentation, such as a birth certificate, state-issued identification card, or Social Security card, or required additional time to locate these and other documents. Contrary to the expectations of some PHA staff, many participants had criminal backgrounds that prevented them from being either approved for vouchers or accepted by landlords. Also commonly cited as a barrier to leasing was bad credit, often incurred as a result of the injury that led to the participant's disability. Other participant-specific barriers included applicants not showing up for their briefings, participants changing their minds about making transitions from institutional settings to the community, and deterioration of health that prevented them from making transitions.
4. Implementation Procedures Associated with Successful Voucher Issuing and Leasing
Factors associated with quicker issuing and leasing of vouchers included strong lines of communication between PHA and HHS/MFP staff, a centralized or streamlined set of referral procedures, involvement of an HHS/MFP housing specialist, and relaxed portability rules (see Table II.2). These characteristics were identified as facilitators of success in the nine sites that eventually issued or leased all of their assigned vouchers: Baltimore City, Baltimore County, Cincinnati, Longview, Lucas County, Lynn, New Jersey, Snohomish County, and Tacoma. Conversely, the absence of many or all of these characteristics was identified as the reason for slower success in Austin, Decatur, Orange County, and Pasadena.20
Lack of communication and of preexisting partnerships was identified as a critical reason for either a slow or rocky rollout of the NED2 program. Both Washington and Ohio spent the initial months establishing working relationships among all frontline staff, developing day-to-day procedures, building the necessary databases, checklists, and resources, and promoting regular communication. Because of the need to make these upfront investments, many states did not officially rollout their NED2 programs until summer 2011. Communication between the PHAs in Pasadena, Orange County, and Decatur and their respective assigned MFP teams remained minimal and at times non-existent through much of 2011 and 2012, which was regarded as a critical reason for the low number of vouchers issued in these sites.
The programs in Washington, Ohio, Massachusetts, New Jersey, and Maryland each benefited from having a single statewide coordinator, an intermediary coordinating entity, or a team of regional program coordinators responsible for ensuring continual progress and accountable for identifying bottlenecks and barriers. States that set up this type of centralized implementation model, in which referrals made by transition coordinators were shepherded through a very specific and streamlined review process before being received by PHA staff, had greater success. Conversely, California operated a decentralized model in which referrals came to PHAs directly from various local agency staff, with very little involvement from the state MFP team; this allowed inconsistencies in quality and required greater effort and involvement on the part of PHA staff.
States with dedicated housing coordinators or specialists at the state or local level, such as Ohio, Washington, Maryland, and New Jersey, had much greater success than states without them, such as Georgia and California. Findings from a recent Mathematica MFP evaluation study highlighted the important role housing specialists play in boosting the number of people who move from institutions back to the community (Lipson et al. 2011). Housing specialists are better situated to provide training and education about housing issues and PHA policies directly to the transition coordinators and case managers, and are better equipped to communicate with PHA staff--benefits perhaps most apparent in Washington, which had three regional housing specialists responsible for overseeing a smooth referral process between local transition coordinators and the PHAs.
Several states expressed initial confusion about whether HUD permitted immediate use of the NED2 vouchers in jurisdictions outside of the receiving PHA, causing several PHAs initially to restrict porting. Some PHA staff would have appreciated a policy that restricted absorption,21 which would have removed the financial disincentive to port vouchers. Sites that established immediate porting rules earlier in the program, such as New Jersey and sites in Maryland, showed earlier signs of success. Massachusetts witnessed increased success only after broadening its porting policy. Sites that strictly abided by the standard regulations governing portability, such as Georgia, Texas, and California, were much slower to see vouchers leased.
In conclusion, although implementing the NED2 program proved far more difficult than many PHAs and their partners expected, all program representatives expressed a firm belief that the program was well worth the effort to the individual voucher users, most of whom would have otherwise remained in institutions longer. All eight states included in this analysis also indicated that the NOFA application process, and the NED2 program itself, had strengthened the states' housing/Medicaid partnerships, and several planned to leverage the newly enhanced relationship to pursue future funding opportunities. Whether the vouchers affected the overall rate of transitions to the community among the eligible group in each region is examined in the next chapter.
III. Impact of Ned2 Vouchers on Community Transitions
The primary purpose of the NED2 voucher program is to expand the availability of rental subsidies to people residing in institutions to enable them to make transitions to community-based settings. Although the process analysis indicates that vouchers were used to facilitate transition to the community by individuals residing in institutions, it does not answer the broader question: did the NED2 vouchers change the overall rate of transitions among eligible individuals in communities that received the vouchers?
We conducted an impact analysis to assess the change in the rate of community transitions among a group of individuals eligible for NED2 housing vouchers in PHA regions that received the vouchers (hereafter "treatment areas") relative to transitions of comparable individuals in selected regions within the same state that did not receive the vouchers (hereafter "comparison areas"), controlling for other factors that could affect transition rates. We restricted the analysis to nursing home residents, as opposed to the larger pool of people residing in institutions, because the overwhelming majority of voucher users initially resided in nursing facilities and necessary data were only available for people in such settings.
This chapter describes the methodology, data sources, and major findings from the impact analysis. It also compares the characteristics of NED2 voucher users to non-users in the treatment areas to understand how the groups differ and to inform future policies for targeting NED2-type vouchers to those most likely to need and use them.
We begin by providing an overview of the methodological approach and describe the survey and administrative data used for the analysis. We then describe NED2 voucher users' demographic, health, functional status, and institutional-related characteristics. Voucher users are found to differ from non-users on a number of characteristics, including gender, marital status, functional status, and length of stay in a nursing facility. We go on to explain the selection of treatment and comparison areas and the use of propensity score matching to select a sample of people similar to NED2 voucher users. Finally, we present findings from the analysis estimating the impact of NED2 voucher availability on transitions to the community. The estimated impacts were quite substantial in a pooled sample of three sites; in fact, the results suggest that each voucher used in these areas represents a transition that would not have otherwise occurred. We found no evidence of an impact in a pooled sample of the two other sites.
A. Overview of Analytical Approach and Data Sources
We used a difference-in-difference analytical method to estimate how likely nursing home residents eligible for NED2 vouchers in treatment areas were to move to the community before and during the period of voucher availability, as compared to people residing in comparison areas. Data availability (described below) led us to focus on a subset of PHA areas that received and leased the highest number of NED2 vouchers in 2011. For each PHA analyzed, we first identified within-state comparison areas that aligned on several characteristics, including rental housing market and community transition rates among nursing facility residents, before HUD allocated the vouchers to PHAs in January 2011.
Second, within each treatment and comparison area, we identified two samples of NED individuals who were eligible for the NED2 vouchers either: (1) before vouchers were available (the pre-intervention period); or (2) during the period of voucher use (the intervention period). The pre-intervention period was structured to cover the same duration as the post-intervention period, which was truncated based on data availability. Among our sample of NED2 users, the first voucher was used in April 2011, and data are available through the end of 2011. Accordingly, for the purposes of our analysis, the intervention period begins on April 1, 2011, and runs through December 31, 2011. The pre-intervention period covers the same time frame as the intervention period one year before voucher use began: April 1, 2010, through December 31, 2010.
Third, we identified a sample of non-elderly individuals in the treatment and comparison areas who were likely to use NED2 vouchers. Restricting the sample to those most likely to use vouchers was critical to detecting the program's effects. The nursing home population in the study areas contained a large proportion of individuals who were extremely unlikely candidates for voucher use, according to an empirical analysis of the characteristics of those who did not receive vouchers such as people receiving hospice care.22 If we were to include the entire population of NED2-eligible nursing home residents in our samples, it would have been nearly impossible to detect a statistically significant impact on transitions since the number of available vouchers (no more than 100 in a PHA) was only a small fraction of the number of residents. Consequently, we constructed a more targeted, smaller sample of people likely to use a voucher to increase the chance of identifying an impact.
Last, we calculated the impact of the availability of NED2 vouchers on the probability of making a transition from a nursing facility to a community-based setting in selected areas using a difference-in-difference estimator. This approach controls for time-varying factors that have common effects across treatment and comparison areas between the pre-intervention and intervention periods, as well as for fixed differences between the treatment and comparison groups that exist in the absence of voucher availability. We used within-state comparison groups to control for state-level policies, regulations, and changes in the economic environment. Differences may have existed in policies and service systems within states that affected institutional care and community living, but we assumed these were constant across the pre-intervention and intervention periods and therefore factored out in the estimation method. We used regression-adjusted difference-in-difference estimates to control for any observable differences between the characteristics of individuals in the treatment and comparison samples.
Issues related to data availability and the pace at which NED2 vouchers were used in each community influenced the time frame of the analysis, selection of communities, and approach used to estimate the impact of the vouchers on community transition rates. Our primary data sources included: (1) HUD administrative data; and (2) MDS data derived from assessments of nursing home residents.
HUD Administrative Data. Information used to identify 2011 NED2 voucher users came from administrative data provided by HUD's Office of Policy Development and Research. The data were collected from two sources: (1) reporting forms used by PHAs participating in the HUD Moving to Work program; and (2) data entries in the PIC for all other PHAs. In both datasets, NED2 voucher users were flagged as program participants.
HUD administrative data contained fewer voucher users than reported by PHAs to the TAC in December 2011 (Table III.1). Several explanations are possible. First, HUD administrative data may have been incomplete. HUD staff speculated there may have been delays in the entry of NED2 data in some PHAs, and other PHAs may have provided incorrect codes for identifying NED2 voucher users. Second, TAC data were reported during interviews and may have been inaccurate. Limitations in available data, combined with the limited time frame for completing this study, restricted our analysis to 2011 voucher users identified in the HUD data, or about one-third of NED2 users who leased vouchers in 2011.
| TABLE III.1. Voucher Use by December 2011 | ||||
|---|---|---|---|---|
| State | PHA Area | Vouchers Funded | Vouchers Leased by 12/11 (TAC) | Vouchers Leased by 12/11 (HUD Administrative Data) |
| PHA Areas Included in Quantitative Analysis | ||||
| Maryland | Baltimore City | 40 | 26 | 28 |
| Baltimore County | 50 | 20 | 13 | |
| Ohio | Cincinnati | 100 | 42 | 26 |
| Washington | Snohomish | 50 | 37 | 32 |
| Tacoma | 100 | 44 | 40 | |
| PHA Areas Excluded from Quantitative Analysis | ||||
| California | Pasadena | 40 | 8 | 5 |
| Orange County | 50 | 9 | 9 | |
| Georgia | Decatur | 35 | 4 | 5 |
| Massachusetts | Lynn | 35 | 2 | 0 |
| New Jersey | Statewide | 100 | 36 | 11 |
| Ohio | Lucas | 60 | 4 | 9 |
| Texas | Austin | 36 | 14 | 11 |
| Washington | Longview | 35 | 17 | 0 |
| SOURCES: Information on the number of vouchers funded was provided by HUD. Voucher distribution data came from two sources: (1) TAC; and (2) HUD administrative data. | ||||
Minimum Data Set (MDS). This data set contains clinical assessment information for all patients in Medicaid-certified and Medicare-certified nursing homes and provides detailed information on the demographic characteristics, residential status (length of stay, discharge date, discharge status), functional status, and health conditions of nursing home residents. One unique element in the MDS is a query to residents about their desire to be discharged to the community; we used residents' answers to help to narrow both treatment and comparison samples to include only those with an interest in and some expectation of returning to the community. The most recent MDS data available for this study covered the period through the end of 2011; data for 2012 are not yet available.23
To identify all residents who resided in nursing facilities during our pre-intervention and intervention periods, we drew data from MDS version 2.0, which has data on people who resided in nursing facilities from the start of the pre-intervention period (April 2010) through September 2010, and from MDS version 3.0, which has this information for October 2010 through December 2011.24
The MDS data had two limitations for this study. First, they did not contain information on the geographic location of each institution, which was necessary to identify individuals residing in a treatment or comparison area. We compensated for this by linking the facility's National Provider Identifier (NPI), which is available in the MDS, to the NPI Registry maintained by CMS, which includes unique identifiers for health care providers assigned using the National Plan and Provider Enumeration System (NPPES) and corresponding zip codes for providers.25 The second limitation of the MDS data was the inclusion of only those NED2 voucher recipients residing in nursing facilities, and thus the exclusion of those residing in other institutions--for example, intermediate care facilities for individuals with intellectual disabilities (ICFs-ID)--who may have been eligible for NED2 vouchers. This was a minor limitation, however, as 94 percent of identified 2011 NED2 voucher users were matched to the MDS and thus known to reside in nursing facilities before making transitions to the community.
Selection of PHA Areas Included in the Analysis. Although the NED2 voucher program became effective in February 2011, only 36 percent of the total available vouchers in the 13 areas covered by the PHAs that received at least 35 vouchers each were leased by December 2011. Because low voucher use would have made it difficult to detect statistically significant impacts, we limited the analysis to the five treatment areas in which, according to HUD data, the highest number of vouchers had been issued by the end of 2011: Baltimore County, Baltimore City, Cincinnati, Snohomish County, and Tacoma (Table III.1).26
B. NED2 Voucher Users
In this section we present descriptive statistics on 2011 NED2 voucher users, extending our knowledge about them from the process analysis. Using linked survey and administrative data, we describe these individuals and compare them with non-users on a variety of demographic, functional, health, and institutional-related characteristics.
1. Method for Identifying NED2 Voucher Users
Using HUD administrative data, we identified 139 voucher users across the five PHAs included in the analysis sample (Table III.2). Generally, the number of voucher users identified in the HUD data in a particular PHA was lower than the count collected by TAC. The exception was Baltimore City, for which we identified two more voucher users than there were vouchers leased. This may have been due to voucher turnover; if a NED2 participant was reinstitutionalized or died, the voucher was made available for reissue. Alternatively, the difference might be attributed to differences in the timing of the two data sources. TAC data collection may have occurred at any point in December 2011 and HUD administrative data identified users through the end of the month. People who leased vouchers later in the month may have been missed by TAC but identified by HUD.
| TABLE III.2. Counts of NED2 Voucher Users in HUD and Matched MDS-HUD Data | ||
|---|---|---|
| NED2 PHA | 2011 NED2 Voucher Users (HUD) | 2011 NED2 Voucher Users Identified in MDS Treatment Area Facilities |
| Baltimore County, MD | 13 | 10 |
| Baltimore City, MD | 28 | 27 |
| Cincinnati, OH | 26 | 20 |
| Snohomish, WA | 32 | 29 |
| Tacoma, WA | 40 | 30 |
| Total | 139 | 116 |
| SOURCES: HUD administrative data and MDS. | ||
We used HUD administrative data to identify NED2 voucher users in the MDS, linking the two data sources using Social Security numbers or last name, gender, and date of birth. Of the 139 voucher users in the HUD data, 130 were successfully matched to records in the MDS. Some of those not identified in the MDS may have resided in institutions other than nursing facilities (for example, ICFs-ID; see above) before voucher use, or information in the HUD administrative data or MDS may have been missing or incorrect. We focused only on the voucher users who resided in nursing facilities in a treatment area during the intervention period.27 Accordingly, we excluded people reported to have been discharged from nursing facilities before NED2 vouchers were made available.28 Finally, we excluded two voucher users based on institutional length of stay.29 After these exclusions, our sample consisted of 116 voucher users.
2. Characteristics of NED2 Voucher Users
To learn more about NED2 voucher users, we compared users to non-users ages 62 years and under who resided in treatment area nursing facilities during the intervention period (Table III.3). Non-users were further divided into two categories: those who made transitions to the community and those who did not. The latter group included people who had died, remained in nursing facilities, moved to different nursing facilities, or moved to acute care or other facilities. It is clear that vouchers users differed substantially from both those who made transitions without vouchers and those who did not make transitions.
A comparison of voucher users to people who made transitions to the community without the use of vouchers is suggestive of the extent to which the vouchers were being used by people who were different from those who would make transitions without such assistance. The two groups differed in terms of several demographic characteristics. For example, voucher users were 14 percentage points less likely to be female than non-users who made transitions. The gender gap was evident in all three states but particularly pronounced in Cincinnati (Appendix Table B.1). There is no obvious explanation for the difference. Voucher users were also less likely to be married than non-users who made transitions (9 percent compared to 25 percent), a difference again reflected in statistics for all three states. Voucher users may have lacked informal and financial support that, for others, was provided by spouses.
| TABLE III.3. Characteristics of NED2 Voucher Users Relative to Other Nursing Facility Residents Ages 62 and Under (%) | |||
|---|---|---|---|
| NED2 Voucher Users (N = 116) | People Who Made Transitions Without NED2 Vouchers (N = 4,804) | People Who Did Not Make Transitions (N = 4,307) | |
| Age | 50.8 | 52.8** | 52.7** |
| Female | 37.9 | 52.3*** | 44.2 |
| Currently married | 8.6 | 25.0*** | 15.0** |
| Non-White | 43.1 | 36.7 | 41.8 |
| Condition: heart/circulatorya | 82.8 | 71.8*** | 68.3*** |
| Condition: infectionb | 19.0 | 23.5 | 20.2 |
| Condition: metabolicc | 43.1 | 38.9 | 38.6 |
| Condition: musculoskeletald | 15.5 | 24.1** | 17.4 |
| Condition: cognitivee | 6.0 | 4.4 | 25.4*** |
| Condition: motorf | 19.0 | 7.9*** | 23.1 |
| Condition: neurologicalg | 30.2 | 19.6 | 41.1** |
| Condition: psychologicalh | 64.7 | 46.0*** | 57.4 |
| Condition: cancer | 4.3 | 4.1 | 5.5 |
| Condition: renal disease | 11.2 | 9.9 | 8.6 |
| Adequate visioni | 94.0 | 92.0 | 71.0*** |
| Adequate hearingj | 97.4 | 96.6 | 88.2*** |
| Able to make self understood | 95.7 | 92.5* | 60.4*** |
| Bed mobility--independentk | 59.5 | 31.4*** | 18.7*** |
| Transfer ability--independentk | 58.6 | 26.6*** | 14.9*** |
| Walk in room--independentk | 42.2 | 24.2*** | 13.4*** |
| Walk in corridor--independentk | 36.2 | 20.8*** | 10.9*** |
| Locomotion on unit--independentk | 69.0 | 32.5*** | 21.1*** |
| Locomotion off unit--independentk | 63.8 | 30.5*** | 18.6*** |
| Dressing--independentk | 50.0 | 24.9*** | 9.4*** |
| Eating--ndependentk | 67.2 | 65.6 | 32.4*** |
| Toilet use--independentk | 55.2 | 26.2*** | 12.2*** |
| Personal hygiene--independentk | 53.4 | 31.0*** | 10.1*** |
| Bathing--independentk | 26.7 | 16.2** | 5.5*** |
| Days in nursing facility | 378.7 | 52.6*** | 648.2*** |
| Medicaid eligible only | 63.8 | 20.3 | 37.5 |
| Medicare eligible only | 3.4 | 18.5 | 7.5 |
| Dual Medicaid/Medicare | 27.6 | 17.6 | 38.9 |
| No Medicaid or Medicare | 5.2 | 43.6*** | 16.2 |
| Entered nursing facility from other facility | 88.8 | 92.0 | 87.2 |
| Does not intend to make transition | 0.9 | 4.5 | 24.0 |
| Intends to make transition | 31.0 | 76.1 | 22.8 |
| Transition intent missing | 68.1 | 19.4*** | 53.2*** |
| SOURCE: HUD administrative data linked to MDS. NOTES: Chi square tests of significance were conducted on Medicaid/Medicare status and intent to make transition; two-sample t-tests for significance were conducted on all other variables.
*Indicates characteristic is statistically different from that of NED2 voucher users at the 10% level. | |||
On average, voucher users had fewer functional limitations than non-users who made transitions to the community. This pattern appeared in every site. We would expect that, all else equal, nursing facility residents with the fewest functional limitations would be the most likely to make transitions, as it is generally easier to set up community care plans for those who have the fewest needs for assistance with daily activities. Accordingly, this could suggest that functional status was not the primary barrier to independent living faced by voucher users.
NED2 voucher users also differed from those who made transitions without vouchers in terms of health insurance coverage. Voucher users were more likely than non-users to be Medicaid-eligible (91 percent were Medicaid-only or had dual Medicaid/Medicare coverage) and less likely to be without public insurance (only 5 percent were without Medicaid or Medicare coverage). This partly reflects the fact that most voucher users were recruited through MFP, which is only available to people eligible for Medicaid. Indeed, all voucher users in our sample from Baltimore and Cincinnati were eligible for Medicaid. In contrast, less than half of non-users who made transitions to the community had Medicaid coverage (38 percent), and 44 percent lacked Medicaid or Medicare coverage. It seems likely that those without Medicaid or Medicare who made transitions to the community had significant financial support from private insurance, their families, or their own assets.
Of those who later made transitions to the community, with or without the use of a voucher, very few indicated they did not intend to do so when they first entered a nursing home. Despite this similarity, the average NED2 voucher user resided in a nursing facility for almost a year longer than the average person who made a transition without a voucher (379 days versus 53 days).
Although in some respects voucher users were more similar to those who made transitions without vouchers than to those who did not make transitions (in terms, for example, of functional limitations and intention to make transitions), in others (demographic characteristics, insurance coverage, and length of stay) they were more similar to those who did not make transitions. These comparisons suggest voucher users tended to be people who wanted to live in the community and, like others who made transitions, had relatively modest functional limitations, but may have faced other significant challenges such as limited social supports or problems finding a home to which they might return.
C. Identifying Treatment and Comparison Samples
Our empirical analysis was based on identifying nursing facility residents in treatment and comparison areas and comparing differences in community transition rates before and during the period of voucher availability. Accordingly, we begin this subsection by describing the selection of treatment and comparison areas. We then describe the process of selecting a sample of individuals from the treatment and comparison areas who were likely to use NED2 vouchers.
1. Defining Treatment and Comparison Areas
For purposes of analysis, we pooled within-state treatment areas. We combined the Baltimore County and Baltimore City PHAs into one area (hereafter "Baltimore") and Snohomish and Tacoma into another area (hereafter "Washington") for analysis. The Cincinnati PHA was the only NED2 PHA analyzed in Ohio.30 Pooling provided us with more statistical power to detect a significant effect of voucher availability on transitions to community-based settings.31 Accordingly, we also present a specification for which we pooled samples across all treatment sites and another for which we pooled samples for the two sites with the most similar baseline characteristics: Baltimore and Cincinnati.
We assessed the comparability of treatment areas along several dimensions before pooling, including two housing-related factors: rental vacancy rates and fair market rents. Rental vacancy rates are available through the Census Bureau, based on the 2011 American Community Survey. Fair market rents are determined annually by HUD as the 40th percentile of the sum of rent and utilities for a two-bedroom apartment in a given area. This index is calculated for metropolitan areas and non-metropolitan counties. Several areas in our analysis were considered to be part of the same area and accordingly to have the same fair market rent.
Baltimore City and Baltimore County are contiguous and were similar based on several housing-related measures. Both areas had low rental vacancy rates (7.4 percent and 5.5 percent, respectively) and were considered to have the same value for fair market rent. The proximity and similarity between the two areas were noticeable in the overlap of transition behavior; we observed residents who resided in the county but used city vouchers to help facilitate their transitions to the community. Furthermore, Baltimore City and Baltimore County had low community transition rates at baseline: 16 percent and 24 percent, respectively. We calculated transition rates based on the analysis sample, the development of which is discussed below.
Although not contiguous, Snohomish County and Tacoma are both close to Seattle, with Snohomish directly to the north and Tacoma directly south. The two areas had similar rental vacancy rates (4.6 percent and 7.7 percent, respectively) and similar values of fair market rent ($1,176 and $1,018). In addition, both areas were observed to have high baseline transition rates among likely voucher users (75 percent in Snohomish and 67 percent in Tacoma).
We identified comparison areas for each PHA included in our analysis based on population size, rental vacancy rates, fair market rents, and baseline community transition rates from nursing homes. Like treatment areas, comparison areas were similar to the treatment areas within the same state along many dimensions and were pooled (Table III.4). For example, the fair market rent value in Cincinnati was within $26 of that in the pooled comparison areas in Ohio. Larger differences emerged on some characteristics across other areas, however. For example, the Washington comparison areas had a higher fair market rent value than the Washington treatment areas. At the same time, the baseline community transition rate was similar in the two areas. Indeed, the difference between baseline community transition rates in the three treatment areas and the pooled samples of corresponding comparison areas was not statistically significant. Although not all comparison areas aligned with corresponding treatment areas on all criteria, those selected represented the most comparable within-state areas and generally exhibited similar housing opportunities. The estimation methodology assumes that, in the absence of NED2, observed differences in transition rates across treatment and comparison areas would have been very similar in the post-intervention period after adjusting for changes in the observed characteristics of individuals in the sample.
| TABLE III.4. Characteristics of Treatment and Comparison Areas | ||||
|---|---|---|---|---|
| Population | Rental Vacancy Rate (%) | Fair Market Rent ($) | Pre-Intervention Period Transition Rate (%) | |
| Baltimore | 1,429,434 | 6.3 | 1,263 | 17.9 |
| Anne Arundel, Montgomery, & Prince George's counties | 2,405,240 | 5.3 | 1,416 | 15.9 |
| Cincinnati | 296,223 | 17.1 | 752 | 24.1 |
| Akron, Cleveland, & Dayton | 734,356 | 9.4 | 726 | 32.0 |
| Washington | 923,078 | 5.3 | 1,142 | 69.6 |
| Bellingham, Spokane County, & Vancouver | 720,382 | 6.4 | 784 | 67.4 |
| SOURCES: Population estimates are available from the Census Bureau. Rental vacancy rates are based on the 2011 American Community Survey. Fair market rents are determined annually by HUD. The rental vacancy rates and value of fair market rents in Baltimore and Washington are based on population-weighted averages. Transition rates are based on authors' calculations using MDS data among the analytical sample in 2010, before NED2 vouchers were made available. | ||||
2. Identifying the Analytical Sample
Given the small number of vouchers relative to the size of the full samples in the treatment and comparison areas, detecting even substantively large impacts on transitions would not be possible if we included the full samples in the analysis. Holding the number of voucher users constant, the ability of the analysis to detect impacts increases as the treatment sample size decreases. To illustrate why, consider a site in which 20 vouchers were used. If the treatment sample contained 10,000 individuals, the maximum potential effect, which is the ratio of used vouchers to the voucher-eligible population, would be just 0.2 percentage points--that is, if all vouchers were used by people who would not have made transitions without vouchers, the impact on the percentage making transitions would be 0.2 percentage points. In contrast, suppose we could exclude 9,500 individuals from this sample because we know they did not meet voucher eligibility criteria or were otherwise unlikely to use NED2 vouchers (based on characteristics observed in the MDS, for instance). That would reduce the treatment sample size to 500 individuals, making the maximum potential effect size 4 percentage points.
Unfortunately, the data did not allow for definitive identification of subjects who met the eligibility criteria used to allocate NED2 vouchers in a given area. Although we could limit our sample based on two of the criteria--age (under 62 years) and residence (institutionalized)--we were unable to make exclusions based on income (unavailable in the MDS) or on disability status, which was not precisely defined. We could, however, identify the subjects in each area who were extremely unlikely to be eligible for, or to use, NED2 vouchers by comparing the characteristics of voucher users to those who did not use them.
We identified subjects for the analytical sample in several stages. First, we identified all people residing in nursing facilities in designated treatment and comparison areas at two distinct times: the period of voucher use and data availability (April 1, 2011, through December 31, 2011) and an analogous time period before vouchers were available (April 1, 2010, through December 31, 2010). The pre-intervention and post-intervention samples were treated as independent, that is, we did not track individuals over time. Next, we excluded nursing facility residents with characteristics exhibited by none of the voucher users. In all sites we excluded individuals who were under age 19 or over age 62, were in hospice care, were comatose, had difficulty communicating with others, were unable to perform bed mobility, were unable to transfer between surfaces, were unable to dress, were unable to use the toilet, were unable to eat or had extreme difficulty doing so, were unable to maintain personal hygiene or had extreme difficulty doing so, had difficulty walking in their rooms, had difficulty walking in facility corridors, or had any of the following conditions: Parkinson's disease, tuberculosis, Alzheimer's disease, or cerebral palsy. We also excluded anyone who indicated he or she did not intend to make a transition to the community--including one voucher user in Washington.
Additional site-level exclusions were based on characteristics of the voucher users in each site. Because nearly all voucher users from Baltimore and Cincinnati also met the eligibility criteria for MFP--they were Medicaid enrollees who had resided in nursing facilities for at least 90 days--we limited the analytical samples in both sites to people who met these criteria. Two voucher users in Baltimore were excluded based on nursing facility length of stay as of the date they leased their vouchers. The Washington sample, reflecting the characteristics of voucher users in the site, included some who were not enrolled in Medicaid, as well as many who had resided in nursing facilities between 20 and 90 days and beyond 90 days.32 Other exclusions were based on functional status and health conditions.
We then identified our analytical sample using propensity score matching. Propensity score matching is an econometric method that helps address the concern that program voucher users are different from non-users, and that individual differences, rather than the program itself, drive differences in outcomes. This method calculates the likelihood of program participation based on observed characteristics and summarizes that information in one number, called a propensity score. Users and non-users are then matched based on the propensity score, and impact estimates are based on differences in outcomes for the matched cases. We estimated propensity scores using a logit model of the likelihood that a subject who resided in a nursing facility in the treatment area during the intervention period used a voucher:
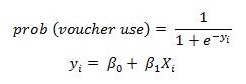 |
where Xi is a vector of demographic characteristics, functional status, health conditions, and institutional stay-related characteristics.33 The equation was estimated separately for each of the three sites (Baltimore, Cincinnati, and Washington).
Propensity scores were calculated as the predicted probability of voucher use in treatment areas during the intervention period based on the above logit regression and matched to the corresponding pre-intervention treatment group and both control groups using the stratification and interval matching method (see Caliendo and Kopeinig 2005). First, the treatment and comparison samples were restricted to the common support, so that individuals with propensity scores outside the range of scores for NED2 voucher users were excluded. Based on this methodology, we were able to reduce our sample sizes to levels at which the probability of detecting an impact on transitions that is equal to the maximum potential effect was reasonably high. Although this was encouraging, it did not guarantee that our analytical sample would detect an impact of that size, and if the impact were smaller, the chance it would be detected was even smaller. We refer to the set of observations we used for the impact analysis as our analytical sample (Table III.5).
For purposes of impact estimation, within each site, all remaining observations were weighted based on propensity scores. The weighted samples for each comparison and pre-treatment group within each site summed to the size of the corresponding treatment sample. We proceeded as follows. First, observations were partitioned into a set of intervals based on propensity score. Intervals were defined so that the intervention period treatment sample was uniformly distributed across intervals, and at least one observation from the pre-intervention treatment sample and one observation from each period of the comparison sample were included in each interval. For each interval in a sample, we defined the weight as the number of treatment group subjects in that interval divided by the number of subjects in the sample in that same interval. The resulting weights were used to produce all of the difference-in-difference impact estimates.
| TABLE III.5. Treatment Area Sample Sizes in Intervention Period and Maximum Potential Effect on Transitions | |||
|---|---|---|---|
| Site | Full Treatment Area Sample | Analytical Treatment Area Sample for Impact Analysis | Maximum Potential Effect on Transitions (percentage points) |
| Pooled | 9,227 | 1,216 | 9.3 |
| Pooled (Maryland & Ohio) | 6,004 | 519 | 10.6 |
| Baltimore City & Baltimore County, Maryland | 3,825 | 362 | 9.7 |
| Cincinnati, Ohio | 2,179 | 157 | 12.7 |
| Snohomish & Tacoma, Washington | 3,223 | 697 | 8.3 |
| SOURCE: HUD administrative data linked to MDS. | |||
A comparison of the characteristics of voucher users and non-users in the analytical treatment sample made apparent that, as intended, the sample selection methodology resulted in an analytical treatment sample in which the observable characteristics of voucher users were quite similar, on average, to those of non-users, although some differences remained (first two columns of Table III.6). There were marginally significant differences in some functional limitations, with users having fewer limitations than non-users. There were also significant differences in the distribution of length of stay in a nursing facility. Finally, a lower proportion of NED2 users had dual Medicaid/Medicare coverage relative to treatment area non-users.
The method for selecting an analytical sample also produced treatment and comparison samples that were generally similar, with a few exceptions. There were significant differences in the unweighted treatment and comparison samples in several domains, including race, health conditions, functional status, and length of stay. Some of these differences were insignificant once the samples were weighted (last two columns), but somewhat surprisingly, most differences in functional status remained. This was an important reason to include the characteristics as covariates when estimating the impact of voucher availability on community transition rates.
| TABLE III.6. Characteristics of Voucher Users and Intervention Period Treatment and Comparison Samples (%) | ||||||
|---|---|---|---|---|---|---|
| NED2 Voucher User (N = 113) (1) | Non-NED2 Users in Treatment Area (N = 1,103) (2) | Treatment Areas, Unweighted (N = 1,216) (3) | Comparison Areas, Unweighted (N = 784) (4) | Treatment Areas, Weighted (N = 1,216) (5) | Comparison Areas, Weighted (N = 784) (6) | |
| Age | 50.8 | 52.4 | 52.3 | 52.1 | 52.3 | 52.7 |
| Female | 38.1 | 41.3 | 41.0 | 39.7 | 41.0 | 45.5 |
| Currently married | 8.0 | 10.9 | 10.6 | 10.1 | 10.6 | 10.0 |
| Non-White | 42.5 | 35.5 | 36.2 | 45.8*** | 36.2 | 30.7** |
| Condition: heart/circulatorya | 82.3 | 78.8 | 79.1 | 78.3 | 79.1 | 77.7 |
| Condition: infectionb | 19.5 | 16.6 | 16.9 | 18.6 | 16.9 | 18.7 |
| Condition: metabolicc | 41.6 | 43.4 | 43.3 | 43.1 | 43.3 | 45.3 |
| Condition: musculoskeletald | 15.0 | 20.8 | 20.2 | 16.8* | 20.2 | 21.2 |
| Condition: cognitivee | 6.2 | 9.9 | 9.5 | 5.6*** | 9.5 | 6.1 |
| Condition: motorf | 19.5 | 18.8 | 18.8 | 19.8 | 18.8 | 18.0 |
| Condition: neurologicalg | 31.0 | 28.8 | 29.0 | 34.1** | 29.0 | 31.9 |
| Condition: psychologicalh | 64.6 | 62.6 | 62.8 | 67.3** | 62.8 | 67.5** |
| Condition: cancer | 4.4 | 2.4 | 2.5 | 1.3 | 2.5 | 2.4 |
| Condition: renal disease | 10.6 | 10.3 | 10.4 | 10.2 | 10.4 | 11.2 |
| Adequate visioni | 93.8 | 93.3 | 93.3 | 92.0 | 93.3 | 92.4 |
| Adequate hearingj | 97.3 | 97.3 | 97.3 | 97.7 | 97.3 | 97.4 |
| Able to make self understood | 95.6 | 92.7 | 92.9 | 94.9* | 92.9 | 94.0 |
| Bed mobility--independentk | 58.4 | 46.8* | 47.9 | 38.9*** | 47.9 | 37.8*** |
| Transfer ability--independentk | 58.4 | 45.1*** | 46.3 | 36.4*** | 46.3 | 35.8*** |
| Walk in room--independentk | 42.5 | 38.8 | 39.1 | 30.4*** | 39.1 | 29.0*** |
| Walk in corridor--independentk | 36.3 | 33.4 | 33.6 | 24.6*** | 33.6 | 24.0*** |
| Locomotion on unit--independentk | 68.1 | 56.5** | 57.6 | 47.1*** | 57.6 | 50.9*** |
| Locomotion off unit--independentk | 62.8 | 51.7** | 52.7 | 43.1*** | 52.7 | 45.2*** |
| Dressing--independentk | 50.4 | 36.4*** | 37.7 | 28.4*** | 37.7 | 29.8*** |
| Eating--independentk | 66.4 | 61.4 | 61.8 | 54.1*** | 61.8 | 54.4*** |
| Toilet use--independentk | 54.9 | 39.7*** | 41.1 | 33.5*** | 41.1 | 31.9*** |
| Personal hygiene--independentk | 53.1 | 39.6*** | 40.9 | 32.3*** | 40.9 | 36.6* |
| Bathing--independentk | 27.4 | 20.7 | 21.3 | 18.9 | 21.3 | 18.1* |
| Days in nursing facility | 386.0 | 367.0 | 368.7 | 488.8*** | 368.7 | 376.8 |
| Distribution of length of stay in nursing facility | ||||||
| <90 days (WA only) | 15.0 | 33.7*** | 32.0 | 17.6*** | 32.0 | 33.7*** |
| 90-180 days | 23.9 | 17.7*** | 18.3 | 20.4*** | 18.3 | 18.9*** |
| 180-365 days | 23.9 | 15.3*** | 16.1 | 19.1*** | 16.1 | 15.0*** |
| 365-730 days | 22.1 | 18.9*** | 19.2 | 20.2*** | 19.2 | 16.5*** |
| >730 days | 15.0 | 14.4*** | 14.5 | 22.7*** | 14.5 | 16.0*** |
| Public Health Insurance Receipt | ||||||
| Medicaid-only | 64.6 | 51.7*** | 52.9 | 53.2 | 52.9 | 46.3 |
| Dual Medicaid/Medicare | 26.5 | 31.4*** | 30.9 | 35.7 | 30.9 | 35.5 |
| Entered nursing facility from other facility | 88.5 | 90.8 | 90.5 | 92.9* | 90.5 | 94.5*** |
| Transition intent missing | 68.1 | 58.9** | 59.8 | 65.3** | 59.8 | 53.9 |
| SOURCE: HUD administrative data linked to MDS. NOTES: Chi square tests of significance were conducted on length of stay in nursing facility and Medicaid/Medicare status; two-sample t-tests for significance were conducted on all other variables.
*Indicates characteristic is statistically different from that of NED2 voucher users (Column 2) or treatment areas (Columns 4 and 6) at the 10% level. | ||||||
D. The Impact of NED2 Vouchers on Transition Rates
We employed a difference-in-difference approach, which controls for preexisting differences between treatment and comparison areas, to estimate the impact of the voucher program on the probability that eligible individuals would make transitions from nursing facilities to the community. The probability of transition was modeled as a function of whether an individual resided in a site with a voucher program (Ti), whether the observation was from the time period after the voucher program was implemented (Pi), whether the individual resided in a treatment area during the implementation period (TiPi), and beneficiary-level control variables (Xi),34 using a logit model:
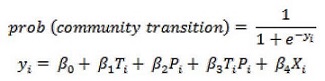 |
where the coefficient of the interaction between the voucher site indicator and the implementation period indicator, β3, captured the effect of the voucher program. The impact analysis was conducted separately for each treatment area (that is, Baltimore, Cincinnati, and Washington) and for the pooled samples (all sites and Baltimore combined with Cincinnati). We produced pooled estimates for Baltimore and Cincinnati without Washington because their baseline characteristics--particularly their pre-period transition rates--were much more similar to each other than to Washington's baseline characteristics. Weights developed via propensity score matching were included in all models.
The estimate of the coefficient, β3, is an estimate of the impact of the availability of vouchers on the unobserved index variable, yi, and is difficult to interpret directly. Hence, we converted each estimate to an estimate of the marginal impact of the availability of the vouchers on transitions in the relevant treatment sample.35 The results were estimates of the impact of the vouchers on the percentage of those in the analytical treatment sample who made transitions during the sample period. For each estimate, we tested the hypothesis of zero impact on this percentage, and we also tested the hypothesis that the true impact was equal to the maximum possible effect--that is, that 100 percent of those who used vouchers would not have made transitions without the benefit of the vouchers. The estimated marginal impact and test results from the logit model appear in Table III.7.36
| TABLE III.7. Estimated Impact of NED2 Vouchers on Community Transition Rates | ||||
|---|---|---|---|---|
| Treatment Area | Estimated Impact (percentage points) | Maximum Potential Impact (percentage points) | p-Value for Test That Impact is Zero | p-Value for Test That Impact Equals the Maximum Potential Impact |
| Pooled sample (all sites) | 3.68 | 9.29 | 0.286 | 0.000* |
| Pooled Baltimore & Cincinnati | 8.70 | 10.60 | 0.060* | 0.681 |
| Baltimore | 9.07 | 9.67 | 0.106 | 0.915 |
| Cincinnati | 12.59 | 12.74 | 0.082* | 0.983 |
| Washington | 0.04 | 8.32 | 0.994 | 0.106 |
| SOURCE: HUD administrative data linked to MDS. Sample sizes are: pooled sample of all sites, 3,283; pooled sample of Baltimore and Cincinnati, 1,731; Baltimore, 963; Cincinnati, 768; Washington, 1,552. NOTES: Effects represent the percentage point impact of voucher availability on rates of community transitions. Control variables vary across sites based on sample exclusions and may include gender, age, age squared, marital status, race, sensory ability (vision, hearing), functional characteristics (up to four different levels of functioning in the following categories: ability to make self understood, bed mobility, transfer ability, walk in room, walk in corridor, locomotion on unit, locomotion off unit, dressing, eating, toilet use, personal hygiene, and bathing), presence of health conditions (heart-related diseases, infection, metabolic conditions, musculoskeletal conditions, cognitive conditions, diseases affecting motor skills, neurological conditions, and psychological conditions), and institutional characteristics (days in nursing facility, days in nursing facility squared, Medicare and Medicaid coverage, type of residence before current stay, and intent to make transition), and binary site indicators. All models include an indicator for treatment area and an indicator for intervention period. *Indicates estimated impact is statistically different from zero (column 3) or the maximum potential impact (column 4) at the 10% level. | ||||
Findings. The results indicated that NED2 vouchers had a positive, statistically significant impact on community transition rates in Cincinnati and in the pooled Baltimore and Cincinnati samples, but not in Baltimore by itself, in Washington, or in the full pooled sample. The estimated impact for the pooled Baltimore and Cincinnati samples (8.7 percentage points) was not significantly different than the maximum possible impact (10.6 percentage points), and analogous statements apply to the separate estimates for the two areas. The estimated impact for Washington was very small (less than one-half of one percentage point) and not statistically different from zero; the difference from the maximum potential impact was also not statistically significant at the 10 percent level, although it was close (the p-value was 0.106). The full pooled estimate was significantly different from the maximum potential impact, which likely reflected the implicit averaging of a very small effect in one site with much larger effects in the other two.
The estimated impacts for the pooled Baltimore and Cincinnati sites and for both sites independently are large relative to the pre-intervention period transition rates (Table III.8). The estimated impacts for these two sites represent, respectively, a 51 percent and 57 percent increase over the corresponding pre-intervention period transition rates in the treatment area. In contrast, the estimated impacts for the pooled sample of all sites and Washington are not only significantly insignificant from zero but are also small relative to baseline transition rates.
| TABLE III.8. Estimated Impact of NED2 Vouchers Relative to Baseline and Comparison Area Community Transition Rates | |||||
|---|---|---|---|---|---|
| Treatment Area | Comparison Area Pre-Intervention Period | Comparison Area Intervention Period | Treatment Area Pre-Intervention Period | Treatment Area Intervention Period | Difference-in- Difference Estimate |
| Pooled sample (all sites) | 46.94 | 50.02 | 48.13 | 54.89 | 3.68 |
| Pooled Baltimore & Cincinnati | 18.92 | 20.71 | 18.97 | 29.46 | 8.70 |
| Baltimore | 13.67 | 13.72 | 17.67 | 26.79 | 9.07 |
| Cincinnati | 31.03 | 36.83 | 21.97 | 40.36 | 12.59 |
| Washington | 67.79 | 71.85 | 69.85 | 73.95 | 0.04 |
| SOURCE: HUD administrative data linked to MDS. NOTES: The first three columns include weighted averages of community transition rates. The fourth column shows the predicted value of community transitions in treatment areas during the intervention period, based on the weighted averages in the first three columns and the estimated impact in the last column. The difference-in-difference estimates represent the percentage point impact of voucher availability on rates of community transitions. | |||||
As a sensitivity test, we estimated a model with a smaller sample for Washington, based on the sample selection criteria used for Baltimore and Cincinnati. We included only individuals who were Medicaid eligible and had resided in nursing facilities for 90 or more days.37 Although the marginal impact estimate for Washington was slightly larger (2.5 percentage points), it remained statistically insignificant.
Our ability to identify impacts was limited by the low number of vouchers used during our analysis period. The likelihood of detecting impacts would be increased if we were able to extend our analysis into early 2012, when the bulk of the remaining vouchers were used. The effect of doing so would increase the maximum potential impact for each site in proportion to the increase in the number of vouchers leased. If the point estimates above represent real impacts, then we would also expect them to increase proportionately. If so, the resulting estimates for all samples would likely be more significant. It also seems likely that the estimate for the Washington sample, or for the three samples combined, would remain insignificantly different from zero.
We were not able to determine why the results for Washington were less consistent with a substantial impact than those for Baltimore and Cincinnati. The differences might, however, be attributed to important differences between Washington and the other sites. Most notably, the pre-intervention transition rates in the Washington treatment area were much higher than those in the other two areas (74 percent in Snohomish and 63 percent in Tacoma, compared with 18 percent and 24 percent, respectively, in Baltimore and Cincinnati). Hence, compared to those in Baltimore and Cincinnati, NED2 voucher users in Washington may have been much more likely to make transitions to the community even without the vouchers. Another difference was that essentially all of the voucher users in Baltimore and Cincinnati met MFP eligibility criteria, whereas many of those in Washington did not.
IV. Conclusions and Lessons for Future Policies and Programs
The 1999 U.S. Supreme Court decision in Olmstead v. L.C. (527 U.S. 581) affirmed the right of people with disabilities to receive publicly provided services and support in the most integrated setting appropriate to their needs. The HUD NED2 program was designed to help non-elderly people with disabilities address barriers to living in the community by providing rental subsidies, assisting with arrangements for the transition to community-based services, and assuring ongoing coordination of housing and social supports.
This evaluation assessed the effectiveness of the NED2 voucher distribution process and estimated the impact of voucher availability on the rate of transition from institutions to community-based settings among the eligible population in selected sites. In this chapter, we conclude by summarizing major findings, discussing lessons that can inform future policies, and suggesting ideas for future research.
A. Implementation Analysis: Conclusions and Lessons Learned
We found that effective voucher distribution appears to be associated with a highly coordinated effort between PHAs and HHS partners and certain implementation processes. These findings provide lessons that, if broadly applied, could improve the efficiency and effectiveness of similar programs in the future:
-
Ensure good communication and strong partnerships between PHA and HHS/MFP staff. By far, the most important facilitator of successful issuing and leasing of vouchers was regular and open communication between PHA and HHS/MFP staff, including managers and frontline staff. Strong partnerships between housing and Medicaid agencies are the backbone of the supportive housing model, suggesting that establishing and maintaining this infrastructure is well worth the investment. To ensure vouchers go to PHAs that are committed to such collaboration, HUD's award criteria could place greater weight on evidence of the PHA-HHS/MFP partnerships.38
-
Assign dedicated program staff and centralize monitoring. Sites that were most successful in leasing vouchers each had a dedicated staff member assigned to track referrals and monitor application status, facilitate communication between transition coordinators and PHA staff, and be accountable for resolving problems or barriers.
-
Align the time line for voucher use with program startup needs. In PHAs that did not have experience with specialized vouchers of this type, the initial phase of the program involved many activities: creating a database to track referrals, developing cross-agency MOUs, assigning and training staff, and developing outreach and marketing strategies. In some sites, both Medicaid and PHA policies had to be modified to accommodate the special needs and characteristics of the target group. Policymakers should take into account these program startup processes when setting expectations regarding the period of time required to issue and lease all vouchers.
-
Employ HHS/MFP housing specialists. Because housing and Medicaid agencies operate under complex federal, state and local policies and procedures, state or local housing specialists who are familiar with both sets of programs are critical assets. Sites that struggled to issue and lease all of their NED2 vouchers were more likely to lack dedicated housing specialists.
-
Relax rules governing voucher portability. Sites with open or relaxed portability rules were able to issue or lease their vouchers faster than those with limiting porting rules. The inclusion of a "no absorption" policy in program regulations would remove the financial disincentive to porting vouchers.
Even among PHAs and HHS/MFP partners with demonstrated capacity to support a NED2 voucher program, additional barriers remain. Potential voucher users may still struggle to find affordable units. It can be difficult in many communities to find housing units that are accessible to those with physical disabilities. Concerted efforts by HHS/MFP staff are important to address landlord concerns about applicants' poor credit or criminal histories; staff can establish strong relationships with landlords and assure them of ongoing help to maintain voucher eligibility, as well as continuation of health and social supports. In the long-term, efforts to overcome these barriers may reduce total public expenditures if the costs to Medicaid, Medicare, and HUD/PHAs of supporting such individuals in the community are less than the cost to Medicaid and Medicare of longer stays in an institution. Lessons learned from the NED2 program may also be useful for finding and maintaining stable housing for people who are homeless and other vulnerable populations which may face similar barriers, such as missing documentation, bad credit, and criminal backgrounds.
B. Impact Analysis: Conclusions and Ideas for Future Research
We found several notable differences between NED2 voucher users and people under age 62 who did not use NED2 vouchers in the five sites with the highest number of voucher users:
-
Voucher users were significantly less likely to be married (9 percent) than people who made transitions to the community without vouchers (25 percent). This finding suggests NED2 vouchers have helped people who do not have access to community supports that are associated with marriage: a home to which they might return and the personal and financial support of a spouse.
-
NED2 voucher users had fewer functional limitations than non-users (both those who transitioned to the community without a voucher, and those who remained in nursing facilities over the observation period). While the reasons for this are unclear, it may be easier to find housing and set up community care plans for people with less need for assistance with activities of daily living. It also suggests that vouchers are most useful to people facing barriers to independent living beyond the services needed to address their functional limitations.
-
The average length of stay in a nursing facility among NED2 voucher users (379 days) was significantly longer than for those who made transitions without vouchers (53 days). This suggests vouchers were used by people who had been unable to make transitions without them, perhaps for a considerable length of time, and were at risk of remaining in institutions for an extended period, perhaps for the rest of their lives.
-
The majority of NED2 voucher users were male (62 percent) compared with just under half of non-users who made transitions without vouchers (47 percent). The gender gap was reflected in all three states, but was particularly pronounced in the Cincinnati site. We are not aware of an obvious explanation for the relatively high rate of voucher use by males.
The availability of NED2 vouchers in Baltimore and Cincinnati was found to have had a substantial, positive impact on community transitions. Estimated impacts in Cincinnati (12.6 percentage points) and the pooled sample of Baltimore and Cincinnati (8.7 percentage points) were statistically different from zero and large relative to the treatment area pre-intervention period transition rates (22 percent and 19 percent, respectively). Perhaps more important, the estimated impacts were not statistically significantly different from the maximum potential impacts (12.7 percent and 10.6 percentage points, respectively). The estimated impact for Baltimore alone was not statistically different from zero but, like the Cincinnati estimate, was nearly as large as the maximum potential impact (9.1 percentage point estimated impact compared to a 9.7 percentage point maximum potential impact) and large relative to the pre-intervention period transition rate (17.7 percent). Hence, it appears likely that the statistical insignificance for the Baltimore estimate reflects insufficient statistical power rather than lack of an impact. In contrast, we found a very small and statistically insignificant effect in Washington.
The fact that the Baltimore and Cincinnati estimates were only slightly lower than the corresponding maximum potential impacts results, separately and pooled, is consistent with the hypothesis that every voucher in those sites was used by an individual who would not have made a transition to the community without it. That does not appear to be the case for Washington, where the estimated impact was just a small fraction of the maximum potential impact, and the hypothesis that the two are equal is on the margin of being rejected.
Limitations. Both our descriptive findings and impact results should be interpreted with caution. Our results are based on just over 100 voucher users in five of the 28 total PHAs. The PHA areas analyzed and the voucher users in the selected PHAs in 2011 may not be representative of all PHAs or all voucher users. Comparisons of NED2 voucher users not included in our analysis and non-users may generate different results. Furthermore, the effects of the NED2 program on the rate of transition from institutions to the community may not be representative of all PHAs. Over the time frame considered, however, we expect the largest estimates in this report might serve as an upper bound for other sites, which leased fewer vouchers.
Future Research. Several avenues of future research have the potential to strengthen and extend our current analysis. Additional or more recent data would make it possible to address unanswered questions regarding the effect of NED2 vouchers on community living outcomes, and strengthen our analyses in other ways:
-
Effects of NED2 vouchers on other outcomes. We were unable to analyze the extent to which vouchers affected other important outcomes, such as rates of reinstitutionalization and post-transition health events, because 2012 MDS and 2012 MSIS data were not yet available. Once these data can be obtained, they can be used to assess whether NED2 voucher use is associated with lower rates of reinstitutionalization or lower rates of hospitalization.
-
An analysis of 2012 voucher users. Once MDS data covering calendar year 2012 become available, the sample for estimating the impact of the vouchers on community transitions can be increased by including 2012 NED2 voucher users. Based on the HUD administrative data through December 2012, the number of voucher users in the analysis would increase by at least 62 percent, potentially improving the reliability of the estimates.39
-
Differences in impact among sites. An additional year of MDS data might allow for the inclusion of other sites in the analysis. With the passage of time, the number of vouchers used in other sites also might be large enough to meet the minimum threshold needed to include them in the analysis.40 This would permit additional checks on the robustness of the results and allow us to identify differences across sites.
-
Strengthen the matching methodology. The use of MSIS and Medicare claims data could strengthen the estimation methodology by improving the ability to match comparison area records to treatment area records and control for additional baseline characteristics, such as the nature of medical events that led to nursing home entry.
The results from additional analysis along these lines would inform policymakers about the contribution of subsidized housing to the success of programs that aim to help people with disabilities leave institutions and live independently in the community. Although we identified positive impacts on transitions in some areas, the sample size and number of areas on which the analysis was based may be perceived as too limited for large scale policy decisions.
References
American Health Care Association. "LTC Stats: Nursing Facility Patient Characteristics Report, December 2010 Update." Washington, DC: American Health Care Association, December 2010.
Caliendo, M., and S. Kopeinig. "Some Practical Guidance for the Implementation of Propensity Score Matching." IZA Discussion Paper No. 1588. Bonn, Germany: IZA, May 2005.
Lipson, D., C. Stone Valenzano, and S.R. Williams. "What Determines Progress in State MFP Transition Programs?" The National Evaluation of the Money Follows the Person Demonstration Grant Program, Reports from the Field No. 8. Washington, DC: Mathematica Policy Research, October 2011.
Kitchener, M., T. Ng, N. Miller, and C. Harrington. "Institutional and Community-Based Long-Term Care: A Comparative Estimate of Public Costs." Journal of Health and Social Policy, 2006, vol. 22, no. 2, pp. 31-50.
Simon, S., and M. Hodges. "Money Follows the Person: Change in Participant Experience During the First Year of Community Living." The National Evaluation of the Money Follows the Person Demonstration Grant Program, Reports from the Field No. 6. Washington, DC: Mathematica Policy Research, May 2011.
Social Security Administration. "SSI Annual Statistical Report, 2011." Washington, DC: Social Security Administration, September 2010.
Technical Assistance Collaborative, Inc. "Priced Out in 2010: The Housing Crisis for People with Disabilities." Boston, MA: TAC, June 2011.
U.S. Department of Housing and Urban Development. "Notice of Funding Availability (NOFA) for HUD's Fiscal Year 2009." Rental Assistance for Non-Elderly Persons with Disabilities. Docket No. FR-5332-N-02, April 7, 2010.
Williams, S., D. Lipson, N. Denny-Brown, R. Lester, B. Orshan, C. Stone Valenzano, and M. Kehn. "Money Follows the Person Demonstration: Overview of State Grantee Progress, July to December 2011." Washington, DC: Mathematica Policy Research, June 2012.
Appendices
APPENDIX A: Voucher-Issue and Lease Rates by Site
| FIGURE A.1. Percentage of Vouchers Issued and Leased in Orange County, CA |
|---|
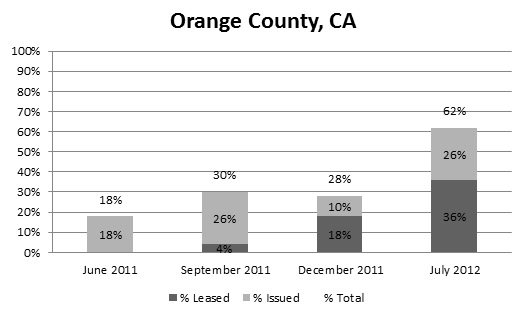 |
| FIGURE A.2. Percentage of Vouchers Issued and Leased in Pasadena, CA |
|---|
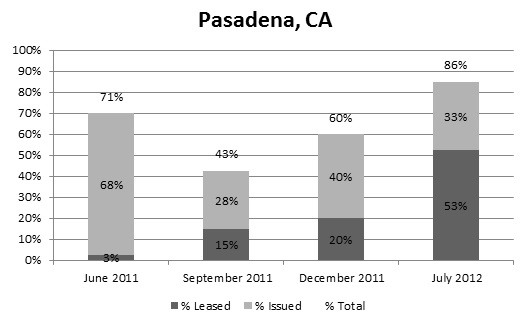 |
| FIGURE A.3. Percentage of Vouchers Issued and Leased in Decatur, GA |
|---|
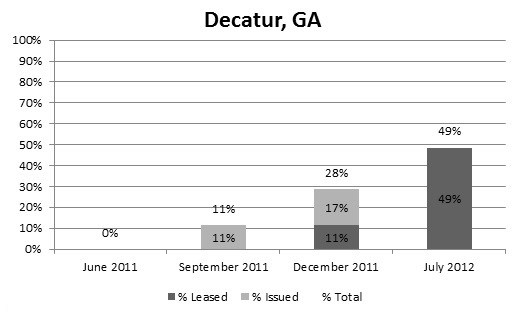 |
| FIGURE A.4. Percentage of Vouchers Issued and Leased in Lynn, MA |
|---|
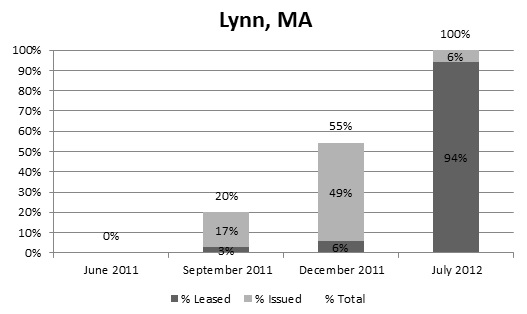 |
| FIGURE A.5. Percentage of Vouchers Issued and Leased in Baltimore County, MD |
|---|
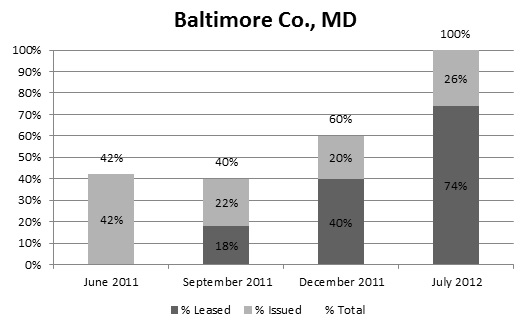 |
| FIGURE A.6. Percentage of Vouchers Issued and Leased in Baltimore City, MD |
|---|
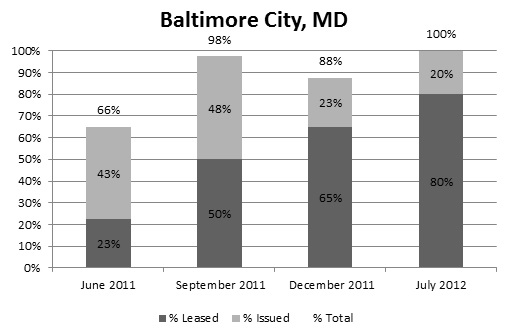 |
| FIGURE A.7. Percentage of Vouchers Issued and Leased in the State of NJ |
|---|
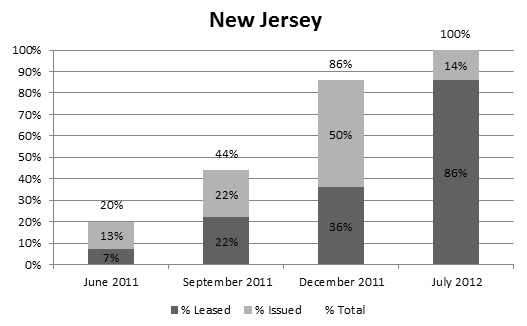 |
| FIGURE A.8. Percentage of Vouchers Issued and Leased in Cincinnati, OH |
|---|
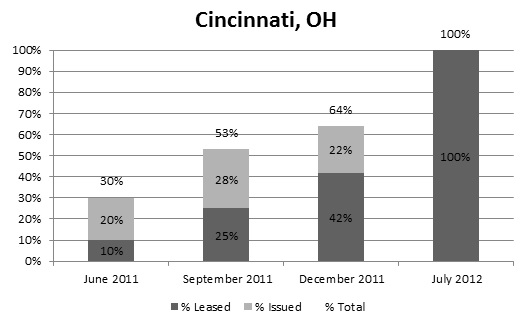 |
| FIGURE A.9. Percentage of Vouchers Issued and Leased in Lucas County, OH |
|---|
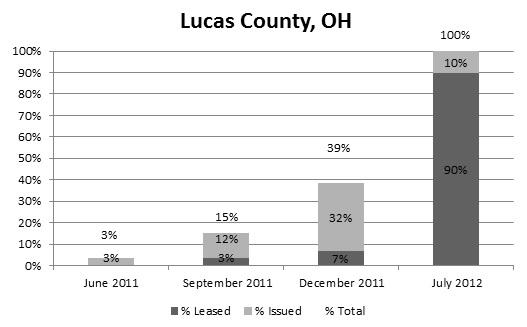 |
| FIGURE A.10. Percentage of Vouchers Issued and Leased in Austin, TX |
|---|
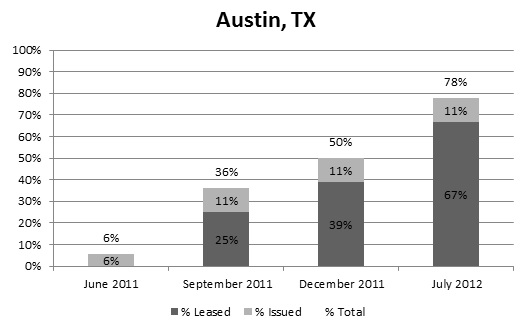 |
| FIGURE A.11. Percentage of Vouchers Issued and Leased in Snohomish County, WA |
|---|
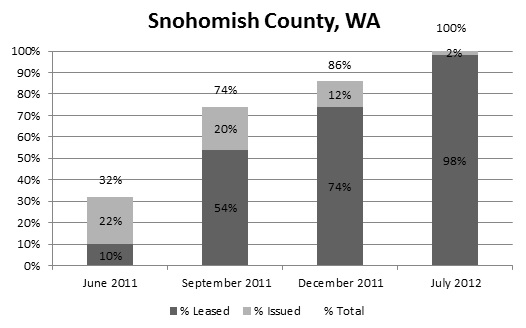 |
| FIGURE A.12. Percentage of Vouchers Issued and Leased in Longview, WA |
|---|
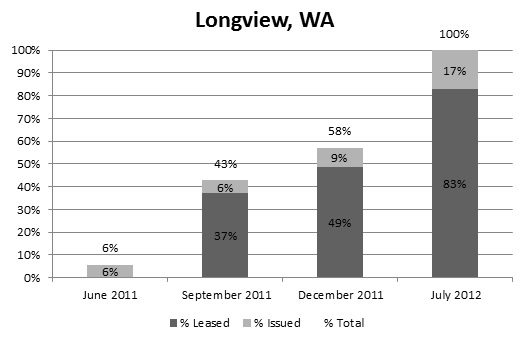 |
| FIGURE A.13. Percentage of Vouchers Issued and Leased in Tacoma, WA |
|---|
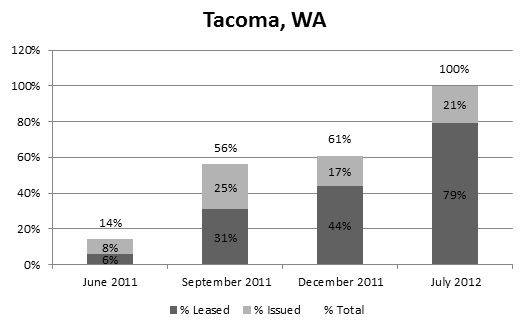 |
APPENDIX B: Characteristics of NED2 Voucher Users by Site
| TABLE B.1. Characteristics of NED2 Voucher Users Relative to Other Nursing Facility Residents Ages 62 and Under Who Make Transitions to the Community (%) |
||||||
|---|---|---|---|---|---|---|
| NED2 Voucher Users | People Who Make Transitions Without a Voucher | |||||
| Maryland (N = 37) |
Cincinnati (N = 20) |
Washington (N = 59) |
Maryland (N = 2,013) |
Cincinnati (N = 944) |
Washington (N = 1,847) |
|
| Age | 50.0 | 48.7 | 52.0 | 52.3 | 52.0 | 53.6 |
| Female | 40.5 | 20.0 | 42.4 | 52.7 | 53.2*** | 51.3 |
| Currently married | 10.8 | 5.0 | 8.5 | 23.8** | 22.5*** | 27.6*** |
| Non-White | 75.7 | 70.0 | 13.6 | 54.2*** | 41.4*** | 15.1 |
| Condition: heart/circulatorya | 81.1 | 85.0 | 83.1 | 69.4* | 75.1 | 72.8** |
| Condition: infectionb | 18.9 | 35.0 | 13.6 | 25.0 | 21.9 | 22.6* |
| Condition: metabolicc | 37.8 | 35.0 | 49.2 | 34.7 | 39.8 | 43.1 |
| Condition: musculoskeletald | 5.4 | 10.0 | 23.7 | 18.3*** | 25.7** | 29.6 |
| Condition: cognitivee | 16.2 | 0.0 | 1.7 | 3.9** | 4.8*** | 4.7* |
| Condition: motorf | 24.3 | 20.0 | 15.3 | 7.8** | 7.3 | 8.3 |
| Condition: neurologicalg | 51.4 | 20.0 | 20.3 | 19.3*** | 20.9 | 19.3 |
| Condition: psychologicalh | 56.8 | 50.0 | 74.6 | 37.1** | 46.1 | 55.6*** |
| Condition: cancer | 0.0 | 0.0 | 8.5 | 3.1*** | 3.2*** | 5.8 |
| Condition: renal disease | 13.5 | 5.0 | 11.9 | 8.0 | 10.3 | 11.6 |
| Adequate visioni | 89.2 | 95.0 | 96.6 | 95.1 | 88.8 | 90.4** |
| Adequate hearingj | 97.3 | 95.0 | 98.3 | 97.9 | 95.3 | 95.9 |
| Able to make self understood | 91.9 | 100.0 | 96.6 | 93.4 | 90.9*** | 92.3* |
| Bed mobility--independentk | 75.7 | 45.0 | 54.2 | 36.6*** | 26.2 | 28.4*** |
| Transfer ability--independentk | 73.0 | 50.0 | 52.5 | 31.6*** | 17.9*** | 25.4*** |
| Walk in room--independentk | 40.5 | 40.0 | 44.1 | 25.7 | 18.0* | 25.7*** |
| Walk in corridor--independentk | 35.1 | 25.0 | 40.7 | 23.5 | 12.0 | 22.2*** |
| Locomotion on unit--independentk | 86.5 | 40.0 | 67.8 | 38.1*** | 19.9* | 32.8*** |
| Locomotion off unit--independentk | 81.1 | 40.0 | 61.0 | 35.1*** | 20.3* | 30.5*** |
| Dressing--independentk | 56.8 | 30.0 | 52.5 | 29.7*** | 19.6 | 22.3*** |
| Eating--independentk | 81.1 | 55.0 | 62.7 | 70.7 | 58.2 | 63.8 |
| Toilet use--independentk | 64.9 | 50.0 | 50.8 | 30.2*** | 21.1** | 24.4*** |
| Personal hygiene--independentk | 59.5 | 30.0 | 57.6 | 33.9*** | 25.2 | 30.9*** |
| Bathing--independentk | 35.1 | 20.0 | 23.7 | 23.7 | 13.9 | 9.1*** |
| Days in nursing facility | 593.6 | 489.8 | 206.3 | 48.2*** | 70.7*** | 48.2*** |
| Medicaid eligible only | 70.3 | 75.0 | 55.9 | 18.1 | 27.4 | 19.1 |
| Medicare eligible only | 0.0 | 0.0 | 6.8 | 17.0 | 13.3 | 22.7 |
| Dual Medicaid/Medicare | 29.7 | 25.0 | 27.1 | 15.9 | 22.0 | 17.2 |
| No Medicaid or Medicare | 0.0 | 0.0 | 10.2 | 48.9*** | 37.2*** | 41.1*** |
| Entered nursing facility from other facility | 78.4 | 85.0 | 96.6 | 86.3 | 94.0 | 97.3 |
| Does not intend to make transition | 0.0 | 0.0 | 1.7 | 3.6 | 6.4 | 4.6 |
| Intends to make transition | 5.4 | 40.0 | 44.1 | 74.4 | 72.5 | 79.8 |
| Transition intent missing | 94.6 | 60.0 | 54.2 | 22.1*** | 21.2 | 15.6*** |
| SOURCE: HUD administrative data linked to MDS. NOTES: Chi square tests of significance were conducted on Medicaid/Medicare status and intent to make transition; two-sample t-tests for significance were conducted on all other variables.
**Indicates characteristic is statistically different from that of NED2 voucher users at the 5% level. ***Indicates characteristic is statistically different from that of NED2 voucher users at the 1% level. |
||||||
APPENDIX C: Logit Model Results Estimating the Effect of NED2 Vouchers on Transition Rates
| TABLE C.1. Logit Model Impact Estimates for Likelihood of Community Transition, Pooled Sample (All Sites) |
||||
|---|---|---|---|---|
| Coefficient | Standard Error | Z-Score | p-Value | |
| Treatment area | 0.0166 | 0.1728 | 0.10 | 0.924 |
| Site = Cincinnati | 0.0574 | 0.1702 | 0.34 | 0.736 |
| Site = Snohomish/Tacoma | 1.1503 | 0.2027 | 5.68 | 0.000 |
| Intervention period | 0.4153 | 0.1944 | 2.14 | 0.033 |
| Treatment area during intervention period | 0.2407 | 0.2256 | 1.07 | 0.286 |
| Female | 0.0309 | 0.1208 | 0.26 | 0.798 |
| Age | -0.0623 | 0.0580 | -1.07 | 0.283 |
| Age squared | 0.0004 | 0.0006 | 0.62 | 0.538 |
| Married | 0.6294 | 0.1825 | 3.45 | 0.001 |
| Widowed/separated/divorced | 0.3413 | 0.1292 | 2.64 | 0.008 |
| Missing marital status | 0.2495 | 0.3442 | 0.72 | 0.469 |
| Non-White | -0.2251 | 0.1417 | -1.59 | 0.112 |
| Missing race | 0.6276 | 0.2825 | 2.22 | 0.026 |
| Vision difficulty | -0.0181 | 0.2170 | -0.08 | 0.933 |
| Hearing difficulty | 0.0031 | 0.2655 | 0.01 | 0.991 |
| Difficulty making self understood | -0.0318 | 0.2763 | -0.12 | 0.908 |
| Bed mobility--supervision needed | 0.1046 | 0.2729 | 0.38 | 0.702 |
| Bed mobility--assistance needed | 0.2293 | 0.3231 | 0.71 | 0.478 |
| Transfer ability--supervision needed | -0.1429 | 0.2627 | -0.54 | 0.586 |
| Transfer ability--assistance needed | -0.3505 | 0.3501 | -1.00 | 0.317 |
| Walk in room--supervision needed | -0.1209 | 0.2522 | -0.48 | 0.632 |
| Walk in room--assistance needed | 0.0265 | 0.3460 | 0.08 | 0.939 |
| Walk in room--did not occur | -0.7753 | 0.2858 | -2.71 | 0.007 |
| Walk in corridor--supervision needed | 0.1619 | 0.2398 | 0.68 | 0.499 |
| Walk in corridor--assistance needed | 0.0254 | 0.3481 | 0.07 | 0.942 |
| Walk in corridor--did not occur | -0.0059 | 0.2711 | -0.02 | 0.983 |
| Locomotion on unit--supervision needed | -0.1813 | 0.2983 | -0.61 | 0.543 |
| Locomotion on unit--assistance needed | -0.3355 | 0.3309 | -1.01 | 0.311 |
| Locomotion on unit--did not occur | -0.0015 | 0.9372 | 0.00 | 0.999 |
| Locomotion off unit--supervision needed | -0.0451 | 0.2648 | -0.17 | 0.865 |
| Locomotion off unit--assistance needed | 0.1991 | 0.3131 | 0.64 | 0.525 |
| Locomotion off unit--did not occur | -0.5259 | 0.4616 | -1.14 | 0.255 |
| Dressing--supervision needed | -0.3095 | 0.2366 | -1.31 | 0.191 |
| Dressing--assistance needed | -0.3643 | 0.2518 | -1.45 | 0.148 |
| Eating--supervision needed | 0.1798 | 0.1611 | 1.12 | 0.264 |
| Eating--assistance needed | -0.7742 | 0.2642 | -2.93 | 0.003 |
| Toilet use--supervision needed | 0.1619 | 0.2484 | 0.65 | 0.514 |
| Toilet use--assistance needed | -0.1805 | 0.2581 | -0.70 | 0.484 |
| Personal hygiene--supervision needed | 0.0932 | 0.2174 | 0.43 | 0.668 |
| Personal hygiene--assistance needed | -0.4370 | 0.2297 | -1.90 | 0.057 |
| Bathing--supervision needed | -0.0849 | 0.1823 | -0.47 | 0.641 |
| Bathing--assistance needed | 0.1243 | 0.1868 | 0.67 | 0.506 |
| Bathing--did not occur | -0.0806 | 0.4322 | -0.19 | 0.852 |
| Renal condition | 0.0924 | 0.1809 | 0.51 | 0.609 |
| Renal condition missing | 0.6240 | 0.1773 | 3.52 | 0.000 |
| Cancer | 0.1641 | 0.4398 | 0.37 | 0.709 |
| Heart/circulatory condition | 0.1945 | 0.1439 | 1.35 | 0.177 |
| Infection | 0.0468 | 0.1366 | 0.34 | 0.732 |
| Metabolic condition | 0.0247 | 0.1210 | 0.20 | 0.838 |
| Musculoskeletal condition | 0.0625 | 0.1461 | 0.43 | 0.669 |
| Cognitive condition | -0.4487 | 0.2397 | -1.87 | 0.061 |
| Motor condition | 0.3104 | 0.1766 | 1.76 | 0.079 |
| Neurological condition | 0.0077 | 0.1368 | 0.06 | 0.955 |
| Psychological condition | -0.2608 | 0.1176 | -2.22 | 0.027 |
| Days in nursing facility | -0.0033 | 0.0004 | -7.85 | 0.000 |
| Days in nursing facility squared | 0.0000 | 0.0000 | 6.33 | 0.000 |
| Medicare eligible only | 0.0806 | 0.2700 | 0.30 | 0.765 |
| Dual Medicaid/Medicare | -0.0245 | 0.1285 | -0.19 | 0.849 |
| No Medicaid or Medicare | 0.1940 | 0.2317 | 0.84 | 0.403 |
| Entered facility from community | 0.4256 | 0.3710 | 1.15 | 0.251 |
| Entered facility from other nursing facility | -0.1487 | 0.2546 | -0.58 | 0.559 |
| Entered facility from unknown/missing | 1.5084 | 0.5793 | 2.60 | 0.009 |
| Transition intent missing | -0.5969 | 0.1365 | -4.37 | 0.000 |
| Constant | 2.5932 | 1.3732 | 1.89 | 0.059 |
| SOURCE: HUD administrative data linked to MDS. Sample size = 3,283. NOTE: The dependent variable equals one if a nursing facility resident made a transition to the community. |
||||
| TABLE C.2. Logit Model Impact Estimates for Likelihood of Community Transition, Pooled Sample (Baltimore City/County and Cincinnati) |
||||
|---|---|---|---|---|
| Coefficient | Standard Error | Z-Score | p-Value | |
| Treatment area | 0.1196 | 0.2484 | 0.48 | 0.630 |
| Site = Cincinnati | 0.2458 | 0.1878 | 1.31 | 0.190 |
| Intervention period | 0.5678 | 0.2219 | 2.56 | 0.010 |
| Treatment area during intervention period | 0.5755 | 0.2992 | 1.92 | 0.054 |
| Female | 0.2697 | 0.1616 | 1.67 | 0.095 |
| Age | -0.1302 | 0.0885 | -1.47 | 0.141 |
| Age squared | 0.0011 | 0.0009 | 1.24 | 0.216 |
| Married | 0.3369 | 0.2583 | 1.30 | 0.192 |
| Widowed/separated/divorced | 0.3041 | 0.1764 | 1.72 | 0.085 |
| Missing marital status | 1.1471 | 0.9332 | 1.23 | 0.219 |
| Non-White | 0.0152 | 0.1708 | 0.09 | 0.929 |
| Missing race | 0.8991 | 0.3016 | 2.98 | 0.003 |
| Vision difficulty | -0.2347 | 0.2708 | -0.87 | 0.386 |
| Hearing difficulty | -0.2182 | 0.4714 | -0.46 | 0.643 |
| Difficulty making self understood | 0.2598 | 0.3534 | 0.74 | 0.462 |
| Bed mobility--supervision needed | 0.1141 | 0.3353 | 0.34 | 0.734 |
| Bed mobility--assistance needed | 0.0036 | 0.3672 | 0.01 | 0.992 |
| Transfer ability--supervision needed | 0.2393 | 0.3319 | 0.72 | 0.471 |
| Transfer ability--assistance needed | 0.0471 | 0.3746 | 0.13 | 0.900 |
| Walk in room--supervision needed | 0.0456 | 0.3070 | 0.15 | 0.882 |
| Walk in room--assistance needed | 0.1490 | 0.5389 | 0.28 | 0.782 |
| Walk in room--did not occur | -0.4656 | 0.4143 | -1.12 | 0.261 |
| Walk in corridor--supervision needed | -0.5324 | 0.3336 | -1.60 | 0.111 |
| Walk in corridor--assistance needed | -0.3128 | 0.4946 | -0.63 | 0.527 |
| Walk in corridor--did not occur | -0.2122 | 0.3926 | -0.54 | 0.589 |
| Locomotion on unit--supervision needed | 0.7360 | 0.3870 | 1.90 | 0.057 |
| Locomotion on unit--assistance needed | -0.3776 | 0.5690 | -0.66 | 0.507 |
| Locomotion on unit--did not occur | -1.2868 | 0.9862 | -1.30 | 0.192 |
| Locomotion off unit--supervision needed | -0.6909 | 0.3361 | -2.06 | 0.040 |
| Locomotion off unit--assistance needed | 0.1517 | 0.5358 | 0.28 | 0.777 |
| Locomotion off unit--did not occur | 0.5623 | 0.7176 | 0.78 | 0.433 |
| Dressing--supervision needed | 0.3445 | 0.3334 | 1.03 | 0.302 |
| Dressing--assistance needed | 0.2025 | 0.3780 | 0.54 | 0.592 |
| Eating--supervision needed | -0.2206 | 0.2213 | -1.00 | 0.319 |
| Eating--assistance needed | -0.4383 | 0.3705 | -1.18 | 0.237 |
| Toilet use--supervision needed | -0.2294 | 0.2929 | -0.78 | 0.434 |
| Toilet use--assistance needed | 0.0945 | 0.3225 | 0.29 | 0.770 |
| Personal hygiene--supervision needed | -0.3410 | 0.3277 | -1.04 | 0.298 |
| Personal hygiene--assistance needed | -1.0464 | 0.3519 | -2.97 | 0.003 |
| Bathing--supervision needed | 0.0943 | 0.2472 | 0.38 | 0.703 |
| Bathing--assistance needed | -0.1423 | 0.2901 | -0.49 | 0.624 |
| Bathing--did not occur | 0.0539 | 0.9017 | 0.06 | 0.952 |
| Renal condition | -0.1367 | 0.3040 | -0.45 | 0.653 |
| Renal condition missing | 0.7680 | 0.1776 | 4.32 | 0.000 |
| Heart/circulatory condition | 0.1548 | 0.1983 | 0.78 | 0.435 |
| Infection | -0.2670 | 0.1858 | -1.44 | 0.151 |
| Metabolic condition | 0.2031 | 0.1533 | 1.33 | 0.185 |
| Musculoskeletal condition | -0.2524 | 0.2162 | -1.17 | 0.243 |
| Cognitive condition | -0.4712 | 0.3112 | -1.51 | 0.130 |
| Motor condition | 0.1928 | 0.2493 | 0.77 | 0.439 |
| Neurological condition | -0.1372 | 0.1745 | -0.79 | 0.432 |
| Psychological condition | -0.1040 | 0.1564 | -0.66 | 0.506 |
| Days in nursing facility | -0.0020 | 0.0005 | -4.08 | 0.000 |
| Days in nursing facility squared | 0.0000 | 0.0000 | 2.67 | 0.008 |
| Dual Medicaid/Medicare | 0.0928 | 0.1647 | 0.56 | 0.573 |
| Entered facility from community | 1.3027 | 0.4654 | 2.80 | 0.005 |
| Entered facility from other nursing facility | -0.1369 | 0.2486 | -0.55 | 0.582 |
| Entered facility from unknown/missing | 1.6504 | 0.5096 | 3.24 | 0.001 |
| Transition intent missing | -0.8394 | 0.1879 | -4.47 | 0.000 |
| Constant | 3.2921 | 2.0876 | 1.58 | 0.115 |
| SOURCE: HUD administrative data linked to MDS. Sample size = 1,731. NOTE: The dependent variable equals one if a nursing facility resident made a transition to the community. |
||||
| TABLE C.3. Logit Model Impact Estimates for Likelihood of Community Transition, Baltimore City/County | ||||
|---|---|---|---|---|
| Coefficient | Standard Error | Z-Score | p-Value | |
| Treatment area | 0.2666 | 0.3544 | 0.75 | 0.452 |
| Intervention period | 0.4061 | 0.3574 | 1.14 | 0.256 |
| Treatment area during intervention period | 0.7295 | 0.4412 | 1.65 | 0.098 |
| Female | 0.6511 | 0.2246 | 2.90 | 0.004 |
| Age | -0.1672 | 0.1434 | -1.17 | 0.244 |
| Age squared | 0.0016 | 0.0014 | 1.07 | 0.284 |
| Married | 0.1079 | 0.3996 | 0.27 | 0.787 |
| Widowed/separated/divorced | 0.3418 | 0.2424 | 1.41 | 0.158 |
| Non-White | -0.0568 | 0.2532 | -0.22 | 0.823 |
| Missing race | 0.8450 | 0.4653 | 1.82 | 0.069 |
| Vision difficulty | -0.1925 | 0.3320 | -0.58 | 0.562 |
| Hearing difficulty | -0.4959 | 0.7118 | -0.70 | 0.486 |
| Difficulty making self understood | 0.3185 | 0.3480 | 0.92 | 0.360 |
| Bed mobility--supervision needed | -0.0604 | 0.5460 | -0.11 | 0.912 |
| Bed mobility--assistance needed | 0.0559 | 0.5213 | 0.11 | 0.915 |
| Transfer ability--supervision needed | 0.0488 | 0.5275 | 0.09 | 0.926 |
| Transfer ability--assistance needed | -0.0004 | 0.5062 | 0.00 | 0.999 |
| Walk in room--supervision needed | -0.0092 | 0.6497 | -0.01 | 0.989 |
| Walk in room--assistance needed | -0.2167 | 0.7703 | -0.28 | 0.778 |
| Walk in room--did not occur | -0.7100 | 0.5007 | -1.42 | 0.156 |
| Walk in corridor--supervision needed | -0.4505 | 0.7259 | -0.62 | 0.535 |
| Walk in corridor--assistance needed | 0.1258 | 0.6678 | 0.19 | 0.851 |
| Walk in corridor--did not occur | -0.0282 | 0.4878 | -0.06 | 0.954 |
| Locomotion on unit--supervision needed | 0.6655 | 0.6253 | 1.06 | 0.287 |
| Locomotion on unit--assistance needed | -0.6785 | 0.6064 | -1.12 | 0.263 |
| Locomotion on unit--did not occur | -1.6912 | 1.0094 | -1.68 | 0.094 |
| Locomotion off unit--supervision needed | -0.4432 | 0.6280 | -0.71 | 0.480 |
| Locomotion off unit--assistance needed | 0.3349 | 0.5898 | 0.57 | 0.570 |
| Locomotion off unit--did not occur | 0.8549 | 0.7887 | 1.08 | 0.278 |
| Dressing--supervision needed | 0.2020 | 0.4741 | 0.43 | 0.670 |
| Dressing--assistance needed | -0.0590 | 0.4793 | -0.12 | 0.902 |
| Eating--supervision needed | -0.0418 | 0.3493 | -0.12 | 0.905 |
| Eating--assistance needed | 0.1245 | 0.4879 | 0.26 | 0.799 |
| Toilet use--supervision needed | -1.5105 | 0.6888 | -2.19 | 0.028 |
| Toilet use--assistance needed | 0.0521 | 0.4091 | 0.13 | 0.899 |
| Personal hygiene--supervision needed | -0.4106 | 0.5114 | -0.80 | 0.422 |
| Personal hygiene--assistance needed | -1.2844 | 0.4630 | -2.77 | 0.006 |
| Bathing--supervision needed | 0.7939 | 0.3509 | 2.26 | 0.024 |
| Bathing--assistance needed | 0.0449 | 0.3821 | 0.12 | 0.907 |
| Renal condition | 0.0707 | 0.4372 | 0.16 | 0.872 |
| Renal condition missing | 0.7644 | 0.2404 | 3.18 | 0.001 |
| Heart/circulatory condition | 0.1173 | 0.2753 | 0.43 | 0.670 |
| Infection | -0.4586 | 0.2794 | -1.64 | 0.101 |
| Metabolic condition | 0.2587 | 0.2144 | 1.21 | 0.228 |
| Musculoskeletal condition | -0.7516 | 0.4051 | -1.86 | 0.064 |
| Cognitive condition | -0.6266 | 0.3173 | -1.97 | 0.048 |
| Motor condition | 0.4077 | 0.3344 | 1.22 | 0.223 |
| Neurological condition | -0.1958 | 0.2252 | -0.87 | 0.385 |
| Psychological condition | -0.1167 | 0.2178 | -0.54 | 0.592 |
| Days in nursing facility | -0.0012 | 0.0007 | -1.65 | 0.099 |
| Days in nursing facility squared | 0.0000 | 0.0000 | 0.87 | 0.386 |
| Dual Medicaid/Medicare | 0.2386 | 0.2232 | 1.07 | 0.285 |
| Entered facility from community | 2.2061 | 0.6547 | 3.37 | 0.001 |
| Entered facility from other nursing facility | -0.0334 | 0.3388 | -0.10 | 0.921 |
| Entered facility from unknown/missing | 1.3677 | 0.5452 | 2.51 | 0.012 |
| Transition intent missing | -0.8243 | 0.2941 | -2.80 | 0.005 |
| Constant | 3.6123 | 3.4186 | 1.06 | 0.291 |
| SOURCE: HUD administrative data linked to MDS. Sample size = 963. NOTE: The dependent variable equals one if a nursing facility resident made a transition to the community. |
||||
| TABLE C.4. Logit Model Impact Estimates for Likelihood of Community Transition, Cincinnati | ||||
|---|---|---|---|---|
| Coefficient | Standard Error | Z-Score | p-Value | |
| Treatment area | -0.2900 | 0.3426 | -0.85 | 0.397 |
| Intervention period | 0.5037 | 0.2596 | 1.94 | 0.052 |
| Treatment area during intervention period | 0.7335 | 0.4182 | 1.75 | 0.079 |
| Female | -0.2756 | 0.2331 | -1.18 | 0.237 |
| Age | -0.0931 | 0.1054 | -0.88 | 0.377 |
| Age squared | 0.0005 | 0.0011 | 0.48 | 0.630 |
| Married | 0.5583 | 0.3808 | 1.47 | 0.143 |
| Widowed/separated/divorced | 0.3223 | 0.2509 | 1.28 | 0.199 |
| Non-White | 0.2475 | 0.2355 | 1.05 | 0.293 |
| Missing race | 1.2392 | 0.4180 | 2.96 | 0.003 |
| Vision difficulty | -0.7195 | 0.4174 | -1.72 | 0.085 |
| Hearing difficulty | 0.7758 | 0.6029 | 1.29 | 0.198 |
| Bed mobility--supervision needed | 0.0613 | 0.4897 | 0.13 | 0.900 |
| Bed mobility--assistance needed | -0.3429 | 0.6300 | -0.54 | 0.586 |
| Transfer ability--supervision needed | 0.4698 | 0.4655 | 1.01 | 0.313 |
| Transfer ability--assistance needed | 0.5970 | 0.6855 | 0.87 | 0.384 |
| Walk in room--supervision needed | -0.2820 | 0.4012 | -0.70 | 0.482 |
| Walk in room--assistance needed | -0.5833 | 0.6598 | -0.88 | 0.377 |
| Walk in room--did not occur | -0.6920 | 0.6285 | -1.10 | 0.271 |
| Walk in corridor--supervision needed | -0.1398 | 0.4696 | -0.30 | 0.766 |
| Walk in corridor--assistance needed | -0.0288 | 0.6574 | -0.04 | 0.965 |
| Walk in corridor--did not occur | -0.0371 | 0.5026 | -0.07 | 0.941 |
| Locomotion on unit--supervision needed | 0.3357 | 0.6024 | 0.56 | 0.577 |
| Locomotion on unit--assistance needed | -0.5886 | 0.5088 | -1.16 | 0.247 |
| Locomotion off unit--supervision needed | -0.6907 | 0.4819 | -1.43 | 0.152 |
| Dressing--supervision needed | 0.7906 | 0.4629 | 1.71 | 0.088 |
| Dressing--assistance needed | 0.4399 | 0.5506 | 0.80 | 0.424 |
| Eating--supervision needed | -0.2450 | 0.2948 | -0.83 | 0.406 |
| Toilet use--supervision needed | 0.4266 | 0.3763 | 1.13 | 0.257 |
| Toilet use--assistance needed | 0.5054 | 0.5116 | 0.99 | 0.323 |
| Personal hygiene--supervision needed | -0.4041 | 0.4350 | -0.93 | 0.353 |
| Personal hygiene--assistance needed | -1.0025 | 0.5272 | -1.90 | 0.057 |
| Bathing--supervision needed | -0.7761 | 0.3286 | -2.36 | 0.018 |
| Bathing--assistance needed | -0.4992 | 0.4100 | -1.22 | 0.223 |
| Bathing--did not occur | -0.1894 | 0.7653 | -0.25 | 0.805 |
| Renal condition | -0.5108 | 0.4435 | -1.15 | 0.250 |
| Renal condition missing | 0.9260 | 0.2773 | 3.34 | 0.001 |
| Heart/circulatory condition | 0.4429 | 0.2761 | 1.60 | 0.109 |
| Infection | 0.1091 | 0.2648 | 0.41 | 0.680 |
| Metabolic condition | 0.1445 | 0.2130 | 0.68 | 0.498 |
| Musculoskeletal condition | 0.0871 | 0.2988 | 0.29 | 0.771 |
| Motor condition | 0.0770 | 0.3935 | 0.20 | 0.845 |
| Neurological condition | -0.0029 | 0.2766 | -0.01 | 0.992 |
| Psychological condition | -0.0343 | 0.2253 | -0.15 | 0.879 |
| Days in nursing facility | -0.0034 | 0.0007 | -4.83 | 0.000 |
| Days in nursing facility squared | 0.0000 | 0.0000 | 3.68 | 0.000 |
| Dual Medicare/Medicaid | -0.0753 | 0.2237 | -0.34 | 0.736 |
| Entered facility from community | -0.0236 | 0.4723 | -0.05 | 0.960 |
| Entered facility from other nursing facility | -0.1754 | 0.3903 | -0.45 | 0.653 |
| Transition intent missing | -0.6837 | 0.2455 | -2.79 | 0.005 |
| Constant | 3.5015 | 2.4316 | 1.44 | 0.150 |
| SOURCE: HUD administrative data linked to MDS. Sample size = 768. NOTE: The dependent variable equals one if a nursing facility resident made a transition to the community. |
||||
| TABLE C.5. Logit Model Impact Estimates for Likelihood of Community Transition, Washington | ||||
|---|---|---|---|---|
| Coefficient | Standard Error | Z-Score | p-Value | |
| Treatment area | -0.0532 | 0.2595 | -0.21 | 0.838 |
| Intervention period | 0.3624 | 0.2992 | 1.21 | 0.226 |
| Treatment area during intervention period | 0.0026 | 0.3343 | 0.01 | 0.994 |
| Female | -0.0821 | 0.1673 | -0.49 | 0.624 |
| Age | -0.0135 | 0.0737 | -0.18 | 0.855 |
| Age squared | -0.0002 | 0.0008 | -0.29 | 0.768 |
| Married | 0.9313 | 0.2991 | 3.11 | 0.002 |
| Widowed/separated/divorced | 0.4203 | 0.1808 | 2.33 | 0.020 |
| Missing marital status | 0.2413 | 0.3705 | 0.65 | 0.515 |
| Non-White | -0.4603 | 0.2448 | -1.88 | 0.060 |
| Missing race | 0.0179 | 0.4969 | 0.04 | 0.971 |
| Vision difficulty | 0.1179 | 0.3709 | 0.32 | 0.751 |
| Hearing difficulty | 0.5302 | 0.4056 | 1.31 | 0.191 |
| Difficulty making self understood | -0.4375 | 0.3693 | -1.18 | 0.236 |
| Bed mobility--supervision needed | 0.3627 | 0.3935 | 0.92 | 0.357 |
| Bed mobility--assistance needed | 0.5969 | 0.4530 | 1.32 | 0.188 |
| Transfer ability--supervision needed | -0.6113 | 0.3826 | -1.60 | 0.110 |
| Transfer ability--assistance needed | -0.8045 | 0.5181 | -1.55 | 0.120 |
| Walk in room--supervision needed | -0.1688 | 0.3769 | -0.45 | 0.654 |
| Walk in room--assistance needed | -0.1736 | 0.4647 | -0.37 | 0.709 |
| Walk in room--did not occur | -1.1966 | 0.4062 | -2.95 | 0.003 |
| Walk in corridor--supervision needed | 0.5968 | 0.3498 | 1.71 | 0.088 |
| Walk in corridor--assistance needed | 0.5383 | 0.5071 | 1.06 | 0.288 |
| Walk in corridor--did not occur | 0.3698 | 0.4025 | 0.92 | 0.358 |
| Locomotion on unit--supervision needed | -0.6485 | 0.4364 | -1.49 | 0.137 |
| Locomotion on unit--assistance needed | -0.4755 | 0.4078 | -1.17 | 0.244 |
| Locomotion off unit--supervision needed | 0.1878 | 0.3657 | 0.51 | 0.608 |
| Locomotion off unit--assistance needed | 0.2877 | 0.3798 | 0.76 | 0.449 |
| Locomotion off unit--did not occur | -0.6021 | 0.5507 | -1.09 | 0.274 |
| Dressing--supervision needed | -0.5552 | 0.3395 | -1.64 | 0.102 |
| Dressing--assistance needed | -0.5733 | 0.3674 | -1.56 | 0.119 |
| Eating--supervision needed | 0.5223 | 0.2471 | 2.11 | 0.035 |
| Eating--assistance needed | -0.8572 | 0.3420 | -2.51 | 0.012 |
| Toilet use--supervision needed | 0.0357 | 0.3798 | 0.09 | 0.925 |
| Toilet use--assistance needed | -0.4619 | 0.3879 | -1.19 | 0.234 |
| Personal hygiene--supervision needed | 0.2065 | 0.2939 | 0.70 | 0.482 |
| Personal hygiene--assistance needed | -0.3057 | 0.3202 | -0.95 | 0.340 |
| Bathing--supervision needed | -0.1753 | 0.2827 | -0.62 | 0.535 |
| Bathing--assistance needed | 0.1587 | 0.2831 | 0.56 | 0.575 |
| Bathing--did not occur | -0.1170 | 0.5384 | -0.22 | 0.828 |
| Renal condition | 0.2066 | 0.2480 | 0.83 | 0.405 |
| Renal condition missing | 0.1520 | 0.4389 | 0.35 | 0.729 |
| Cancer | 0.1171 | 0.4860 | 0.24 | 0.810 |
| Heart/circulatory condition | 0.3024 | 0.2127 | 1.42 | 0.155 |
| Infection | 0.1768 | 0.2057 | 0.86 | 0.390 |
| Metabolic condition | -0.0564 | 0.1798 | -0.31 | 0.754 |
| Musculoskeletal condition | 0.1470 | 0.1946 | 0.76 | 0.450 |
| Motor condition | 0.5677 | 0.2808 | 2.02 | 0.043 |
| Neurological condition | 0.1529 | 0.2212 | 0.69 | 0.489 |
| Psychological condition | -0.3362 | 0.1738 | -1.93 | 0.053 |
| Days in nursing facility | -0.0051 | 0.0008 | -6.36 | 0.000 |
| Days in nursing facility squared | 0.0000 | 0.0000 | 5.28 | 0.000 |
| Medicare eligible only | -0.0530 | 0.2958 | -0.18 | 0.858 |
| Dual Medicaid/Medicare | -0.1414 | 0.1935 | -0.73 | 0.465 |
| No Medicaid or Medicare | 0.0946 | 0.2586 | 0.37 | 0.714 |
| Entered facility from community | -0.3636 | 0.3864 | -0.94 | 0.347 |
| Entered facility from other nursing facility | -0.3277 | 0.9343 | -0.35 | 0.726 |
| Transition intent missing | -0.3723 | 0.2002 | -1.86 | 0.063 |
| Constant | 3.2591 | 1.7690 | 1.84 | 0.065 |
| SOURCE: HUD administrative data linked to MDS. Sample size = 1,552. NOTE: The dependent variable equals one if a nursing facility resident made transition to the community. |
||||
Notes
-
NED HCVs are not new; previous NED vouchers did not, however, exclusively target NED individuals living in institutions, as does NED2. Additionally, the NED2 HCV program is not the first in which HUD has established set-aside vouchers for a special population. Similar targeted voucher programs exist for the homeless veteran population (the HUD-Veterans Affairs Supportive Housing program) and families and youth involved in the child welfare system (the Family Unification Program).
-
Funding for this program originated in the Omnibus Appropriations Act of 2009 (Public Law 111-8), which made available $30 million for incremental Section 8 HCVs for NED families.
-
In addition to nursing facilities, the definition of an institution includes intermediate care facilities and specialized institutions that care for the developmentally disabled or mentally ill.
-
"Leasing" of vouchers refers to a voucher being used to sign a lease on a housing unit with rent subsidized by the voucher.
-
Section IV.B.f of the HUD NOFA informed PHAs that the number of vouchers requested in their applications should reflect the expected need over a 12-month period. A subsequent letter to the PHAs from HUD further reinforced the expectation that "all vouchers are leased within 12 months from the effective date of the Annual Contributions Contract increment."
-
Among the five states were three in which PHAs received NED2 vouchers: California, New Jersey, and Washington. The remaining two states were recipients of NED Category 1 vouchers, which are not the focus of this report.
-
HUD's HCV income eligibility requirements are defined under Title 24 of the Code of Federal Regulations, 982.201(b)(1).
-
Eligible institutions include Medicaid-funded institutions, such as nursing facilities and intermediate care facilities for the developmentally disabled or mentally ill, and non-Medicaid-funded institutions, such as private or public psychiatric facilities that have state-funded dedicated resources, such as fromOlmstead or U.S. Department of Justice settlements.
-
This figure is based on data self-reported by all 28 PHAs to TAC; see the methodology section for further details and limitations of this data set and the data collection process.
-
New Jersey operates a single, statewide housing agency consisting of regional and local field offices. Vouchers awarded to the New Jersey Department of Community Affairs could be used anywhere within the state. Because this PHA operates differently than all other PHAs awarded vouchers, we excluded it from certain segments of the evaluation.
-
These self-reported data were not precise, as updates may have been provided by different staff during each phone conversation, questions were not necessarily posed identically for each PHA, and TAC had no way to validate the information provided. The interactions were, however, the only source of data that provided approximate numbers of vouchers issued or leased at various points in time across all PHAs. Although PHAs were required to track voucher status and provide information on voucher recipients to HUD through the Public and Indian Housing Information Center (PIC) system, those data were not readily available for all 13 PHAs included in this analysis, or for the four points in time we included so we could understand the implementation process.
-
The MFP program team was the state or local HHS partner in seven of the eight states in this analysis. The exception was Massachusetts, which did not have an operational state MFP program until late 2011, after the NED2 program began. In that state, the PHA partnered with the state HHS Community Support Programs division.
-
Representatives from the PHAs in Pasadena, California, Lucas County, Ohio, and Tacoma, Washington, could not be reached for participation in these discussions.
-
Reporting 70 percent in issued or leased status, Pasadena would seem to have had the more impressive start; however, almost all of these vouchers were reported as issued, not leased.
-
The consent decree required the Housing Authority of Baltimore City to create 1,850 new housing opportunities for non-elderly persons with disabilities, including 1,350 Section 8 rental subsidy vouchers (850 tenant-based vouchers and 500 project-based vouchers), as well as the development of fully accessible public housing units. These types of Olmstead or U.S. Department of Justice lawsuits have not been uncommon in recent years, and the settlements, which often mandate transitions of institutionalized individuals to the community, have resulted in stronger relationships between housing and Medicaid staff in many states.
-
Portability refers to the ability of a voucher holder to move from the jurisdiction of his or her receiving housing agency to that of another housing agency. Unless otherwise specified by HUD in the voucher program rules, each PHA is permitted to establish its own rules governing portability. See below for further details.
-
The MDS contains information from the Resident Assessment Instrument, a federally mandated clinical assessment performed on all Medicare and Medicaid beneficiaries residing in nursing facilities. Section Q of this assessment addresses whether the resident would like to explore the possibility of going back into the community.
-
HUD provides PHAs with a HCV Guidebook, detailed regulations, and issue-specific notices, which detail how to provide for reasonable accommodation requests under all HCV programs.
-
Unless otherwise specified in program regulations, if a PHA allows a voucher to be transferred ("ported") to another PHA, the receiving PHA has the choice of billing the initial PHA for any assistance provided to the porting individual or of absorbing the individual into its own program. If the receiving PHA elects to absorb the individual, the initial PHA is left with an unused voucher. Several PHAs regarded this as a disincentive to port and hoped that HUD would have established a "no absorption" policy in the governing regulations.
-
Austin is grouped here because of its relatively low lease rate of 67 percent in summer 2012. The site did not, however, report all the barriers noted by the other three sites listed. Also unlike the others, Austin reported strong lines of communication between the MFP and PHA staff. And although referral activities were not coordinated by a statewide housing specialist, and porting was not permitted, these were not noted as significant barriers to leasing by site staff. Instead, Austin's tight rental market was cited as a major barrier to leasing.
-
See footnote number 19 for a definition of "absorption".
-
As described in more detail in Section C, individuals were deemed "unlikely" to use vouchers in a two step process. First, we excluded nursing facility residents with characteristics exhibited by none of the voucher users. Second, we created propensity scores and excluded non-voucher users who were outside the range of scores predicted for voucher users. This method excludes individuals based on a combination of characteristics.
-
Compared with the MDS, alternative data sources with information on nursing home residents' characteristics are incomplete and/or even less timely. For example, Medicaid Statistical Information System (MSIS) data contain information on patient characteristics, nursing facility admissions, and discharges and could have served as an alternative or supplement to the MDS. There are reporting delays of MSIS data for many states, however, some of which only have data available through September 2010.
-
Because the MDS is only administered to current nursing facility residents, we could not rely exclusively on MDS 3.0, as it would exclude former residents who left facilities before October 2010 and skew the composition of the pre-intervention (April 1 to December 31, 2010) sample relative to the intervention (April 1 to December 31, 2011) sample. We used both MDS versions for the pre-intervention sample but only the MDS 3.0 for the intervention sample.
-
We also linked the NPI to the Medicaid Analytic eXtract Provider Characteristics file but were unable to identify as many NED2 voucher users residing in treatment area PHAs as we did using NPPES data.
-
We also eliminated two PHAs (New Jersey Department of Community Affairs and Lynn Housing Authority in Massachusetts) from the analysis because they made vouchers available statewide, which precluded the construction of within-state comparison groups. Even though 12 NED2 vouchers were awarded to the MD-DHCD and were available statewide, we were able to identify comparison regions for the two PHAs in Maryland by excluding regions in which a majority of those vouchers were used. Of the 11 MD-DHCD voucher recipients included in HUD data, three did not have zip codes recorded, and seven of the eight with zip codes resided in rural areas (most along the Eastern Shore of Maryland); one was in Frederick, Maryland. These areas were not used as comparison areas.
-
No HUD administrative data system matches PHAs to clearly defined geographic areas. For our analysis, we determined which zip codes corresponded to a given treatment area. A few voucher users (one in Cincinnati, three in Snohomish, and four in Tacoma) resided in nursing facilities outside of treatment areas. HUD regulations did not require people applying for the NED2 vouchers to have lived in the PHA issuing the vouchers while they were institutionalized; applicants just had to say they wanted to live in that area after leaving an institution. We did not expand our definition of treatment areas to include outside areas in which voucher users resided, as doing so would have reduced our ability to detect impacts of any given size.
-
We excluded four voucher users (one in Baltimore County, two in Cincinnati, and one in Tacoma) who were discharged from nursing facilities before NED2 vouchers were available.
-
Two voucher users, one in Baltimore County and one in Baltimore City, were reported to have resided in nursing facilities for six or fewer days (according to MDS data) at the time they leased their vouchers, which is inconsistent with the process for voucher assignment and uptake.
-
Although Longview, Washington, and Lucas, Ohio, are in the same states as other PHAs analyzed in this report, we did not include either area in our analysis. HUD administrative data did not include any 2011 NED2 participants in Longview, Washington, and although nine participants from Lucas, Ohio, were in the HUD data, inclusion of a region with a small number of voucher users would have led to a disproportionately large increase in the treatment sample, substantially reducing statistical power.
-
As discussed later, given a fixed number of vouchers in a treatment area, the smaller the sample of potential users in the area, the more likely the estimation methodology would detect an impact of given size.
-
As a sensitivity test, we estimated a specification for the Washington sample that included only those who were Medicaid eligible and had resided in nursing facilities for more than 90 days. As explained below, the results did not change substantially.
-
Specifically, control variables included demographic characteristics (gender, age, age squared, race, and marital status), sensory ability (vision, hearing), functional characteristics (up to four different levels of functioning in the following categories: ability to make self understood, bed mobility, transfer ability, walk in room, walk in corridor, locomotion on unit, locomotion off unit, dressing, eating, toilet use, personal hygiene, and bathing), presence of health conditions (heart-related diseases, infection, metabolic conditions, musculoskeletal conditions, cognitive conditions, diseases affecting motor skills, neurological conditions, psychological conditions, cancer, and renal disease), and institutional characteristics (days in nursing facility, days in nursing facility squared, Medicaid and Medicare coverage, type of residence before current stay, and intent to transition).
-
Beneficiary-level control variables included demographic characteristics (gender, age, age squared, race, and marital status), sensory ability (vision, hearing), functional characteristics (up to four different levels of functioning in the following categories: ability to make self understood, bed mobility, transfer ability, walk in room, walk in corridor, locomotion on unit, locomotion off unit, dressing, eating, toilet use, personal hygiene, and bathing), presence of health conditions (heart-related diseases, infection, metabolic conditions, musculoskeletal conditions, cognitive conditions, diseases affecting motor skills, neurological conditions, psychological conditions, cancer, and renal disease), and institutional characteristics (days in nursing facility, days in nursing facility squared, Medicaid and Medicare coverage, type of residence before current stay, and intent to transition).
-
Results from all logit models, including coefficient estimates, are provided in Appendix C, Tables C.1-C.5.
-
We also estimated a linear probability model to assess the sensitivity of the findings to the empirical specification. A linear probability model is an ordinary least squares model with a binary outcome. The estimated impacts from the linear probability were not substantively different from the results from the logit model.
-
An additional ten voucher users were excluded from the model of Medicaid eligibles who resided in nursing facilities for 90 or more days. The alternate model for Washington included 36 voucher users and an analytical treatment sample of 216 observations. The maximum potential impact was 16.7 percentage points.
-
HUD's application requirements specified that PHAs identify a local HHS/MFP transition agency that would provide service coordination to voucher recipients but did not require evidence of coordination or a commitment to partnership through, for example, confirmation by an HHS/MFP agency director.
-
An estimated 259 individuals used NED2 vouchers through the end of 2012 in the five PHAs analyzed. Of the 259 NED2 voucher users, at least 188 can be linked to the 2011 MDS and resided in a nursing facility in a designated treatment area before transition. The latter figure represents a 62 percent increase over the number (116) who had used their vouchers by the end of 2011. It is likely that an even higher proportion of voucher users would be linked to the 2012 MDS data.
-
Several sites in particular are promising candidates for inclusion in a study using 2012 data. For example, although only nine vouchers were leased in both the Pasadena, California and Lucas County, Ohio sites in 2011, by the end of the next year, 25 and 44 vouchers had been leased in each site, respectively. Similarly, although only 11 vouchers were leased in the Austin, Texas site through the end of 2011, by the end of 2012, 31 vouchers had been leased. However, it is uncertain how many of the voucher users link to the MDS data.