
Thomas DeLeire, Karen Joynt, and Ruth McDonald
This report summarizes research on the effect of the major health insurance coverage expansion under the Affordable Care Act (ACA) on the drivers of uncompensated care (UCC) and on hospital UCC costs.
Key Takeaways
- Early hospital financial reporting and member surveys from hospital associations indicate that, through second quarter 2014, payor mix is shifting in ways that will likely reduce hospital uncompensated care costs. In particular:
- Volumes of uninsured/self-pay admissions (which comprise a major portion of uncompensated care provided by hospitals) have fallen substantially, particularly in “Medicaid expansion” states (states that have elected to expand the Medicaid program through the Affordable Care Act);
- Volumes of uninsured/self-pay emergency department visits have fallen substantially, primarily in Medicaid expansion states; and
- The volume of hospital admissions for patients covered by Medicaid has increased, but only in Medicaid expansion states.
- Initial projections suggest that uncompensated care costs will fall substantially following major insurance coverage expansion, including coverage expansion through both Medicaid and the Health Insurance Marketplaces. Specifically:
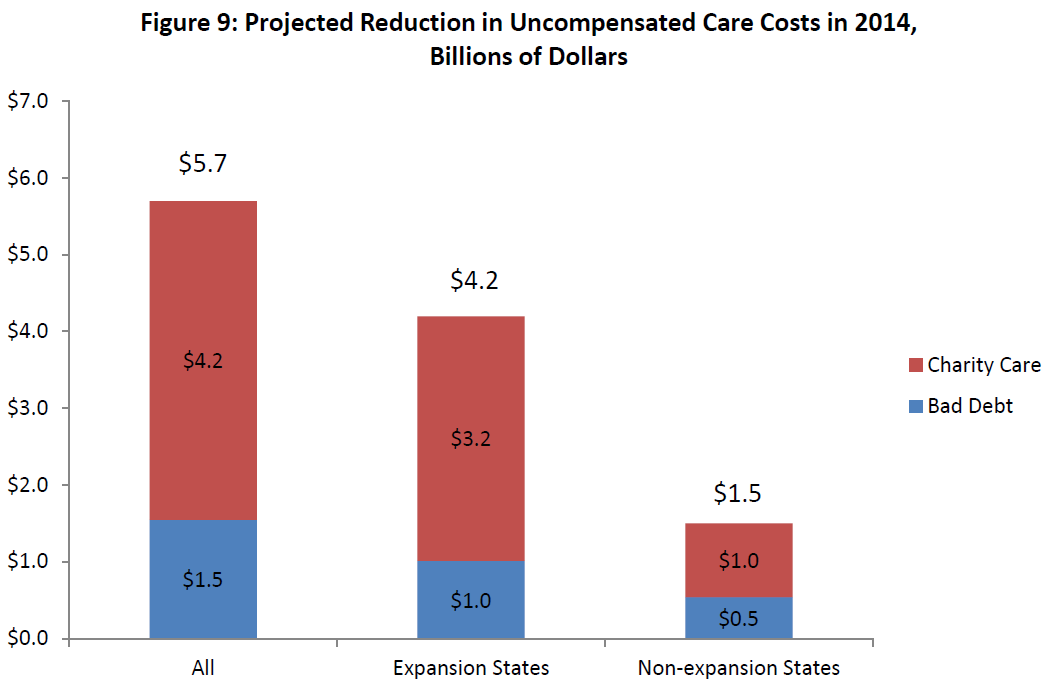
- Based on an estimated 10.3 million decrease in the total number of uninsured and an estimated 8 million increase in the number covered by Medicaid, ASPE estimates that hospital uncompensated care costs will be $5.7 billion lower in 2014 than they otherwise would have been. This represents a 16 percent reduction from baseline uncompensated care spending.
- The projections further suggest that $4.2 billion of this reduction will come from the 25 states plus Washington DC expanding Medicaid as of the beginning of FY2014, representing a 25 percent reduction from baseline uncompensated care spending and 74 percent of total savings. $1.5 billion will come from the 23 Medicaid non-expansion states, representing a 9 percent reduction from baseline uncompensated care spending and 26 percent of total savings. (note NH and PA have decided to expand Medicaid, but had not yet started enrolling individuals at the end of the second quarter of 2014, and therefore they are excluded from these analyses).
United States hospitals provide roughly $50 billion in uncompensated care to uninsured and underinsured patients annually. Under the Affordable Care Act, a major insurance coverage expansion is taking place; this expansion is anticipated to reduce uncompensated care as more and more Americans gain insurance coverage. First, this brief examines earnings reports from major for-profit U.S. hospital chains and finds that volumes of uninsured admissions have fallen by 50-70% in states that have expanded Medicaid, and by 2-14% in states that have not expanded Medicaid. Next, the brief uses cost report data to estimate the change in hospital uncompensated care costs as a result of insurance expansion, and finds that U.S. hospitals are projected to save $5.7 billion in uncompensated care costs in 2014. About three-quarters of these savings ($4.2 billion) will accrue to states that have elected to expand Medicaid, and about a quarter ($1.5 billion) to states that have chosen not to expand Medicaid.
"I. Introduction: Uncompensated Care Costs, Coverage Expansion, and Hospitals
This report summarizes research on the effect of the major health insurance coverage expansion under the Affordable Care Act (ACA) on the drivers of uncompensated care (UCC) and on hospital UCC costs.
Hospital UCC costs totaled between $46 and $51 billion in 2012, according to the American Hospital Association (AHA)1 as well as data provided to the Center for Medicare and Medicaid Services (CMS) via Hospital Cost Reports.2 The Urban Institute reports that each individual uninsured for the full year of 2013 received $1,005 in implicitly subsidized uncompensated care, and that these costs totaled $49 billion nationwide in 2013.3
Though specific definitions differ, UCC is generally considered to be the unreimbursed cost of the care provided by hospitals to people who are uninsured, underinsured,4 or in some cases publicly insured. For the purposes of this report, we define hospital UCC costs as the combined total of bad debt and charity care.5 Bad debt refers to an amount hospitals anticipated receiving for services but in fact never received. Charity care is the value of services rendered for which hospitals never anticipated receiving payment, because the patient’s inability to pay was determined early in the course of care; both of these sources of UCC are in large part generated by medically indigent or uninsured patients, though unrealized co-pays or deductibles for insured patients are also included in this calculation.6,7,8
Uncompensated care is largely federally funded: through Medicaid, Medicare, the Veterans Health Administration, the Indian Health Service, community health center funding, and Ryan White funding for people with HIV/AIDS, the federal government is estimated to pay for 62 percent of UCC.9 The largest portion of these federal funds ($13.5 billion in 2013) flows through the Medicaid program in the form of Medicaid disproportionate share hospital (DSH) and upper payment limit (UPL) payments. Additionally, the Medicare program provides significant federal funding to providers for UCC through the Medicare DSH adjustments, payments for Medicare bad debt, and payments for indirect medical education (IME) ($8 billion in 2013).10 Though neither Medicare DSH nor IME payments are direct payments for UCC, they provide additional funding to recognize the higher cost structure of Medicare services, and may be available to offset provider UCC costs.
Though hospitals are not the only providers of UCC, on a cost basis they provide the majority of such care; 60 percent of all UCC costs are incurred through hospitals, while the other 40 percent of costs are incurred through publicly-supported community providers and office-based physicians. The AHA estimates that 6.1% of hospitals’ total expenses in 2012 were related to the provision of uncompensated care.11
Most analysts predicted that UCC would decline following the major ACA-driven coverage expansion in 2014 because an increase in the number of insured individuals would reduce the number who could not pay their hospital bills, as well as the need for charity care.12 The extent of this reduction is an empirical question, however, as it depends on a number of factors, including the extent to which newly-insured individuals are able to meet the cost-sharing obligations imposed by their plans.
Because of this anticipated decline in UCC following coverage expansion, the ACA enacts reductions in the major existing streams of federal Medicaid and Medicare reimbursement that help to offset costs of uncompensated care. For example, federal Medicaid DSH payments, which totaled $11.4 billion in 2012,13 are scheduled to be cut by just over 10%, or $1.2 billion, in FY2016 and by $17.6 billion in total by FY2020.14 Base Medicare DSH payments are reduced to 25 percent of previous levels under the ACA, and the remaining amount is distributed based on hospitals’ share of the total amount of uncompensated care provided nationally;15 these changes are estimated by the Congressional Budget Office to reduce Medicare DSH spending by $22.1 billion between 2010 and 2019.16 Given the magnitude and timing of these cuts, as well as the uncertainty introduced by whether and how states plan to expand Medicaid, it is critical to determine how UCC is changing following coverage expansion so as to avoid shifting a large financial burden to states, localities, and hospitals.
While this brief focuses primarily on changes in uncompensated care, hospital finances will also be affected by changes in utilization related to the expansion of insurance coverage. Increased volumes from higher utilization will often strengthen hospitals’ finances, although this need not be the case if providers agree to treat newly-insured patients with coverage that pays amounts that do not cover their marginal costs. Research examining prior insurance expansions can shed light on the changes in hospital utilization that might be expected. For example, evidence from Oregon’s Medicaid expansion showed that Medicaid increased the likelihood of being admitted to the hospital from 6.7 percent to 8.8 percent, a 30 percent relative increase.17 The Oregon expansion also suggested that Medicaid coverage increased use of emergency services by 40 percent, or 0.41 visits per person per year.18 Research examining a different abrupt gain of insurance – namely, turning 65 and qualifying for Medicare – similarly suggests a relative increase in admissions of 12-20 percent for those who were previously uninsured, particularly for people with chronic conditions19 and for admissions including elective procedures.20
However, the evidence is not entirely consistent; for example, a study of health care utilization after the creation of a new public insurance plan for low-income uninsured childless adults in Wisconsin found that in the first year of coverage, while outpatient visits increased 29 percent, and emergency department visits increased 46 percent, inpatient hospitalizations actually declined 59 percent as did preventable hospitalizations.21 Additionally, work from Massachusetts showed that overall hospitalizations in Massachusetts were unchanged relative to other states after the implementation of insurance expansion and that preventable hospitalizations declined.22 Further, emergency department visits declined to a small degree (6-8 percent), particularly for conditions which were likely treatable in less resource-intense settings.23
Given a rapidly changing health insurance landscape, it is clear that close ongoing attention to the impact of coverage expansion on hospital utilization, costs, and UCC at the national level is warranted. This report, which attempts to address these issues using the best available early evidence, is in two sections. The first section, “Changes in Hospital Uncompensated Care in 2014,” summarizes evidence available to date on the changes in the drivers of UCC during the first six months of major coverage expansion under the ACA, and allows us to look at initial trends in UCC at a subset of U.S. hospitals. Information in this section is based on quarterly hospital earnings reports, as well as member surveys conducted by hospital associations. The second section, “Projecting the Change in Total Hospital Uncompensated Care Costs,” uses estimates of the historical relationship between changes in insurance coverage and changes in UCC costs to project the decline in total U.S. hospital UCC costs as a result of increases in Medicaid coverage and reductions in the number of uninsured.
1 American Hospital Association, Uncompensated Care Cost Fact Sheet, January 2014. Available at http://www.aha.org/content/14/14uncompensatedcare.pdf
II. Changes in Hospital Uncompensated Care in 2014
While we know that the number of people without any source of health insurance coverage decreased and the number of people covered by Medicaid increased in the first two quarters of 2014, the impact of these changes on the utilization of hospital services and on hospitals’ provision of UCC is as yet unknown. Therefore, the intent of this section is to provide an early picture of changes in Hospital UCC using available data. We first provide a background discussion of what we know about coverage expansion numbers thus far in 2014. We next use data from the financial reporting of five large, for-profit, hospital groups and from member surveys conducted by several hospital associations on how the recent ACA-driven coverage expansion has translated into changes in the volume and payor mix of admitted patients and patients seen in the emergency department in the first two quarters of 2014. Finally, we discuss how these changes likely translate into changes in UCC.
A. Insurance Coverage Expansion Under the Affordable Care Act
For over a decade prior to the ACA, the proportion of the American population that was uninsured had been growing steadily. According to estimates made by the U.S. Bureau of the Census, between 1999 and 2011, the percentage of Americans without any source of health insurance coverage increased from 14 percent to 16 percent (see Appendix A). In 2012, the last year for which Census estimates are available, almost 48 million Americans, or 15 percent, lacked health insurance coverage. This figure was slightly higher among states that have decided (as of the beginning of 2014) to not expand Medicaid (17 percent) than in states that have elected to expand Medicaid (14 percent). Lack of health insurance was more common among adults aged 18 to 64 than among Americans of all ages; in 2012 41 million adults aged 18 to 64, or 21 percent, lacked health insurance.
As a result of implementation of the major coverage provisions in the ACA, the rate of uninsured adults began to drop in the first six months of 2014. The decline was most pronounced in Medicaid expansion states. Data published in the New England Journal of Medicine, using the Gallup-Healthways Well-Being Index, suggested that the uninsured rate for Americans ages 18 to 64 fell 4.7 percentage points, from 21.0 percent in September 2013 to 16.3 percent by April 2014 (the end of open enrollment), and stayed stable through June 2014.24 The study also showed that in Medicaid expansion states, the uninsured rate for those at or below 138 percent of the Department of Health and Human Services Poverty Guidelines declined 6 percent, while in Medicaid non-expansion states it declined by only 3.1 percent.25 Similarly, the Urban Institute, using the Health Reform Monitoring Survey, reported that the uninsured rate across adults of all ages fell from 17.5 percent in Q1 2013 to 13.9 percent in Q2 2014 (14.8 percent to 10.1 percent in Medicaid expansion states, and 20.8 percent to 18.3 percent in Medicaid non-expansion states).26
Commensurately, Medicaid enrollment data strongly suggest that there has been a large increase in the percentage of adults covered by Medicaid in 2014. As of the end of July 2014, enrollment reports demonstrate 7,935,257 more people enrolled in Medicaid and CHIP than in the comparison baseline period of July to September, 2013. The increases in enrollment were overwhelmingly seen in Medicaid expansion states, with 6,888,391 more enrollees, versus 1,046,866 in non-expansion states.27
24 Sommers BD et al., N Engl J Med. 2014 Aug 28;371(9):867-74
B. Early Data on Changes in Hospital Volume and Payor Mix: Quarter One and Quarter Two, 2014
The increase in insurance coverage was expected to decrease hospital UCC by decreasing the proportion of hospitals’ clinical volume comprised of uninsured patients (although increased volumes of patients covered by Medicaid were expected to have a smaller impact on UCC as a result of lower payment rates). In this subsection, we will use data from the first available sources on volume and payor mix since insurance expansion to examine this issue: hospital earnings data and hospital association surveys. Hospital earnings data are from the Q1 and Q2 2014 earnings reports of five large for-profit hospital operators in the United States: Community Health Systems, Inc. (CHS), Hospital Corporation of America (HCA Holdings, Inc.), Tenet Healthcare Corporation, LifePoint Hospitals, Inc., and Universal Health Services, Inc. (UHS). The surveys come from three hospital associations that are located in Medicaid expansion states: the Arizona Healthcare and Hospital Association, the Colorado Hospital Association, and the Arkansas Hospital Association. The Colorado Hospital Association also released data from its DATABANK of financial and volume data from 465 hospitals across 30 states, 15 of which have expanded Medicaid. While the hospitals represented in these earnings reports and surveys are not necessarily representative of the totality of U.S. hospitals, examining them does allow an early look at the impact of the ACA coverage expansions on the provision of UCC.
Declining Uncompensated Care Volumes
Four of the five for-profit hospital groups – Community Health Systems,28 HCA,29 LifePoint,30 and Tenet31 – reported how their hospitals’ volumes of uninsured and/or self-pay admissions (which we will collectively refer to as UCC) changed in Q1 2014 (relative to Q1 2013). The Colorado Hospital Association32 and Arkansas Center for Health Improvement33 also reported similar figures for their membership. Please note that the numbers reported here are relative changes, which allow us to compare trends across hospital chains and across states; the absolute proportion of care provided to the uninsured nationwide ranges from roughly 5-10 percent of total admissions.34
As shown in Figure 1, hospitals overall tended to see relative reductions in their numbers of admitted patients who were uninsured between Q1 2013 and Q1 2014. Moreover, hospitals in Medicaid expansion states saw substantial declines in their uninsured admissions, ranging from 28 to 33 percent relative reductions compared to one year prior. Hospitals in Medicaid non-expansion states, on the other hand, did not experience declines in their volumes of UCC admissions.
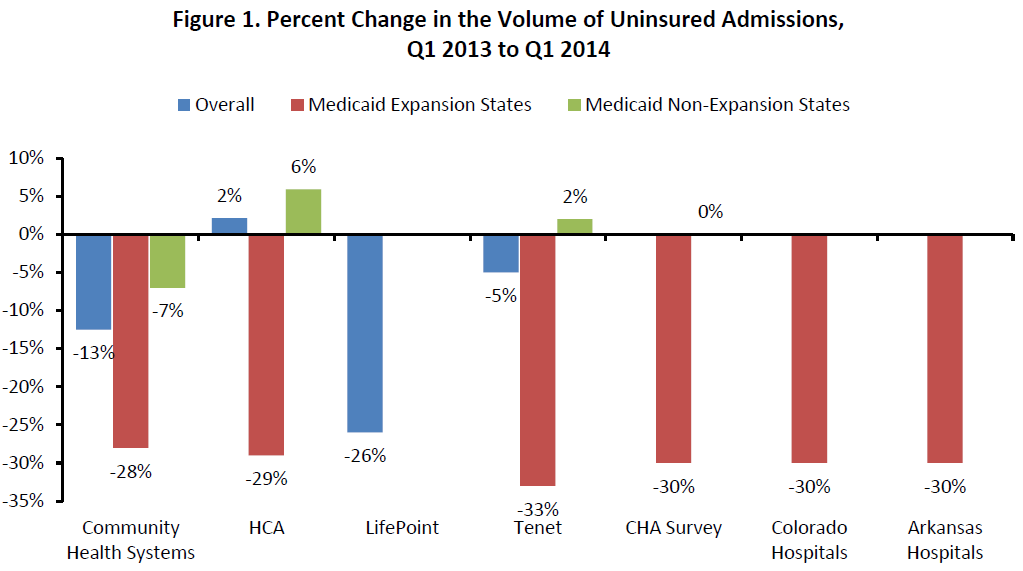
CHA=Colorado Hospital Association. HCA=Hospital Corporation of America.
Though fewer data are available for emergency department (ED) use, among those that reported these figures, hospitals overall saw 0 to 13 percent relative declines in ED visits by uninsured patients between Q1 2013 and Q1 2014. These changes were largely concentrated in Medicaid expansion states, ranging from 16 percent to 28 percent in these states (Figure 2), with small to no changes among hospitals in Medicaid non-expansion states.
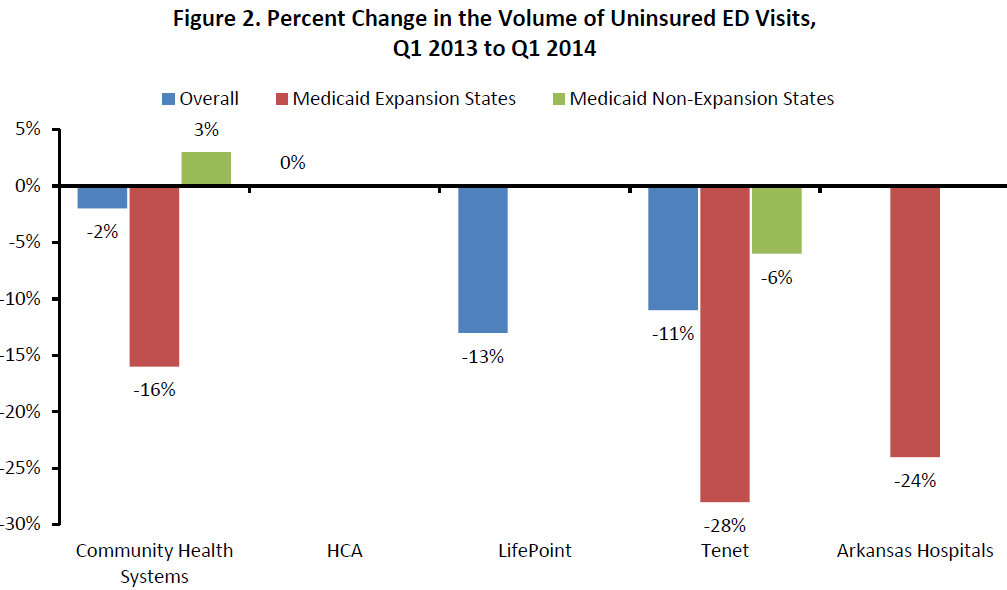
HCA=Hospital Corporation of America. NA=not applicable. NR=not reported.
The declines in volumes of uninsured admissions were even greater between Q2 2013 and Q2 2014. Overall, hospitals saw relative declines in their volumes of uninsured admissions that ranged from 15 to 34 percent. Among hospitals in states that expanded Medicaid, the number of uninsured patients admitted declined between 48 percent and 72 percent between Q2 2013 and Q2 2014 (Figure 3). By contrast, in states that did not expand Medicaid, the decrease in volume of uninsured patients admitted to hospitals ranged between 0 and 14 percent.35 36 37 38
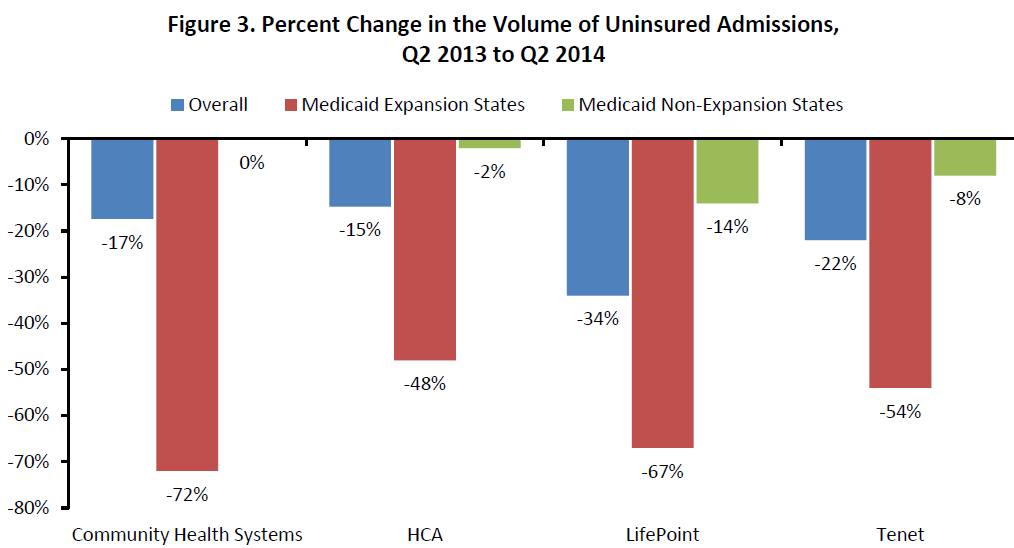
HCA=Hospital Corporation of America.
Again, though less evidence is available, relative reductions in UCC in the ED appeared to continue to grow when comparing Q2 2013 and Q2 2014, ranging from 26 percent to 60 percent in Medicaid expansion states (Figure 4).
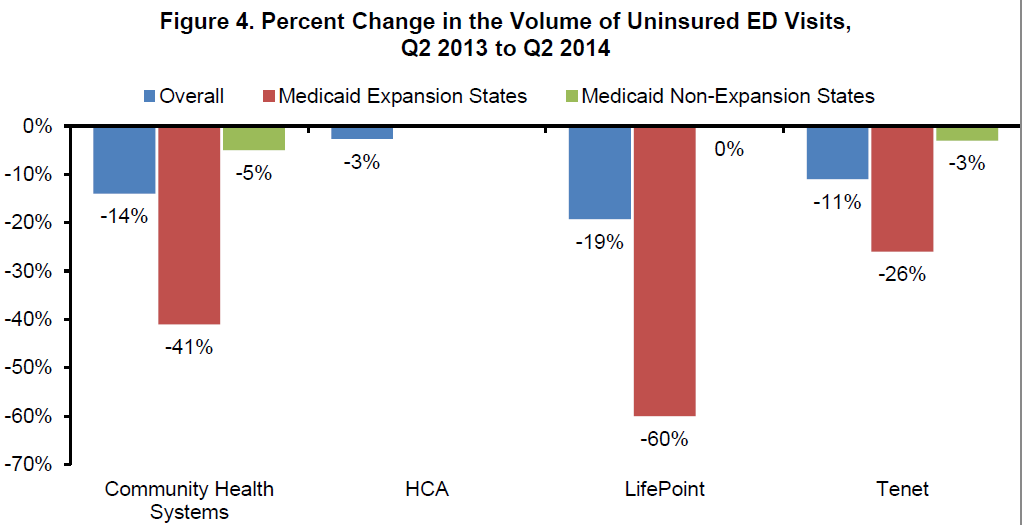
HCA=Hospital Corporation of America.
It is also important to note that the decreases in the volume of uninsured patients that we report above are being seen in both urban and rural hospitals. The two non-urban hospital operators observed, Community Health Systems39 and LifePoint,40 saw a decrease of roughly 70 percent in uninsured admissions in Q2 2004, and a significant drop in uninsured ED volume; the two more urban hospital providers, HCA41 and Tenet,42 saw an average decrease of around 50 percent. Arkansas, a primarily rural state, saw the volume of uninsured patients in inpatient and ED settings decline up to 30 percent43 – on par with other states and hospitals with more urban geography.
Overall, there is thus strong evidence that the volume of uninsured patients is dropping in both the inpatient and ED settings and across a variety of geographical areas, indicating a likely drop in hospital UCC costs.
Increasing Overall Patient Volumes
Despite the observed reductions in the volume of uninsured patients, hospitals have experienced positive trends in their overall volumes of admissions compared to prior years.44 45 46 47 The same-quarter to same-quarter comparisons have improved each of the last three quarters, which is in contrast to prior trends in hospital admission volumes. For example, comparing Q4 2012 to Q4 2013, total hospital admissions declined from 1.8 percent to 10.5 percent across four large for-profit hospital groups. However, when comparing Q1 2013 to Q1 2014, declines were smaller (Figure 5), and when comparing Q2 2013 to Q2 2014, two of the four chains moved into positive comparisons in admission volumes.
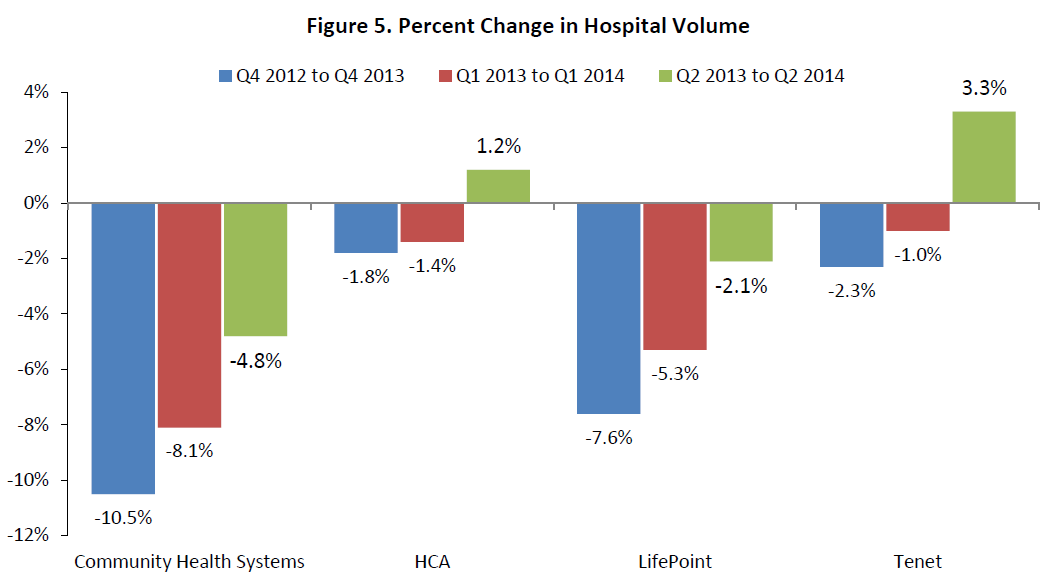
HCA=Hospital Corporation of America
Increases in the Volume of Medicaid Admissions
One group that seems to be driving these volume increases is those patients who are newly insured by Medicaid. Initial data from hospitals and hospital associations suggest that the volume of admissions represented by patients covered by Medicaid has increased, but only in Medicaid expansion states. Between Q1 2013 and Q1 2014, hospitals in Medicaid expansion states experienced relative increases in their volume of Medicaid patients that ranged between 4 percent and 31 percent, while there is no evidence that Medicaid admissions increased among hospitals in Medicaid non-expansion states (Figure 6).48 Please note that the proportion of admitted patients who are insured by Medicaid at baseline ranges significantly across these hospital chains, but Medicaid patients comprise up to 21 percent of total hospital admissions nationwide.49
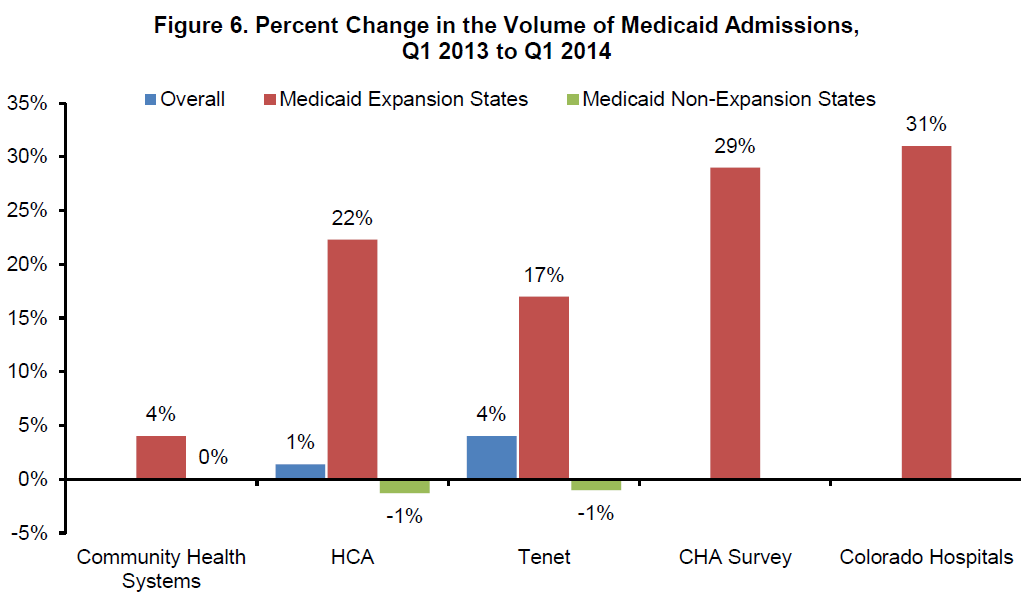
CHA=Colorado Hospital Association; HCA=Hospital Corporation of America.
Growth has continued in the second quarter. Comparing Q2 2013 and Q2 2014, it appears that hospitals in states that expanded Medicaid experienced further relative increases in their volumes of Medicaid admissions that ranged between 17 percent and 32 percent, with again no evidence of increases among hospitals in non-expansion states (Figure 7).50 These large percent increases in the volumes of Medicaid admissions are most likely the result of a shift in admissions of uninsured patients to admissions of patients covered by Medicaid, although some of the increase in Medicaid admissions could be the result of pent-up demand among the formerly uninsured.
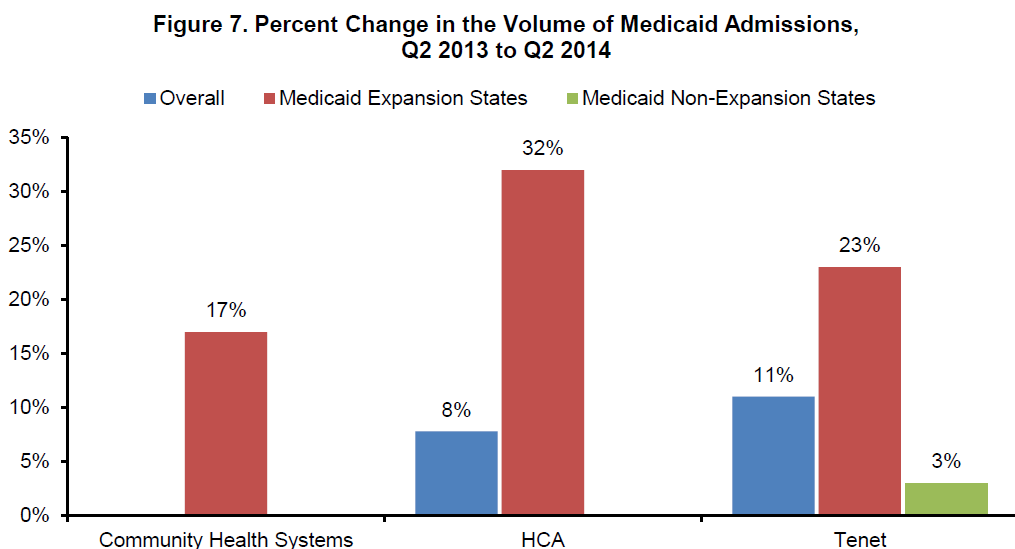
HCA=Hospital Corporation of America.
Evidence suggests that Medicaid admissions are increasing outside these health systems as well, and that the expansions are in both urban and rural areas. For example, in Kentucky, 46 percent of urban hospitals and 36 percent of rural hospitals are receiving more in Medicaid reimbursements than they did a year ago, according to the state’s Cabinet for Health and Family Services, which administers Kentucky Medicaid.51
Changes in UCC and Bad Debt Costs
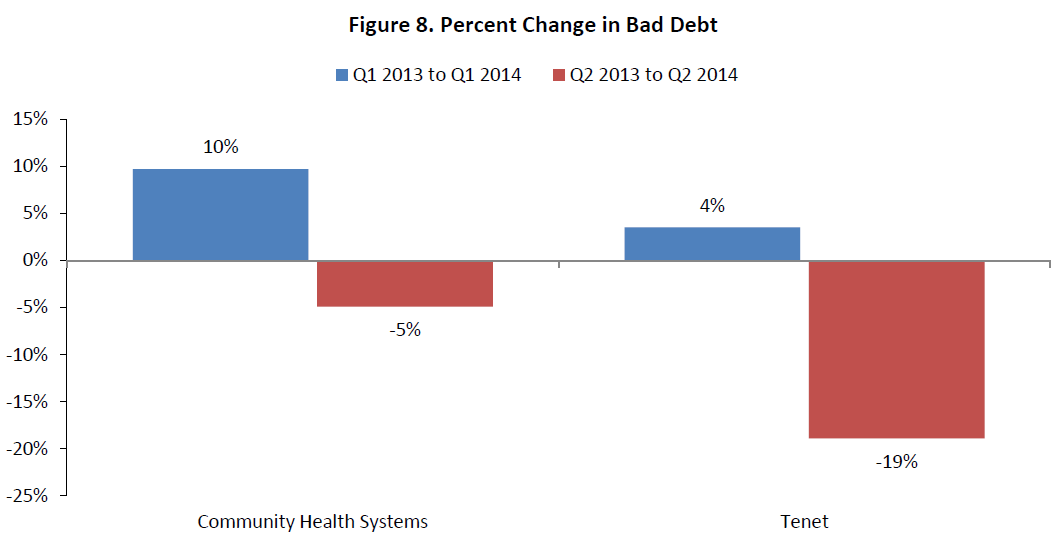
Very little direct evidence on changes in UCC and bad debt costs as a result of insurance expansion is available to date, as bad debt is not always split out in the surveys and earnings reports, and formal 2013 Cost Report filings (which do require separate reporting of bad debt) are not yet available. However, two of the large hospital groups – Community Health Systems and Tenet – did report on their changes in bad debt in the first two quarters of 2014. When comparing Q1 2013 and Q1 2014, bad debt was higher in 2014 in these two hospital groups, with the increase ranging from 4 to 10 percent. In contrast, these groups experienced large declines in bad debt when comparing Q2 2013 and Q2 2014 that range from 5 to 19 percent (Figure 8).
Additionally, reports from the Arizona Hospital and Healthcare Association52 suggest a 31 percent drop in total UCC costs between Q1 2013 and Q1 2014, though again this is not split out into charity care versus bad debt. Similarly, Colorado’s urban hospitals reported providing $3.6 million less in UCC in Q1 2014 than in Q1 2013, while its rural hospitals also experienced a drop in UCC during Q1 2014.53
Finally, though in this brief we focus on hospital uncompensated care, there is also evidence from other sources that uncompensated care in the outpatient setting may be decreasing as well. A recent report from the Robert Wood Johnson Foundation and athenaResearch suggested that the proportion of outpatient visits accounted for by uninsured patients has decreased, particularly in Medicaid expansion states, while the proportion accounted for by Medicaid patients has increased.54 Further study is necessary to understand the consequences and stability of these trends in the outpatient setting.
Summary and Implications
Based on the available data, hospitals in Medicaid expansion states have seen substantial declines in their admission volumes of uninsured patients, declines in their volumes of uninsured patients visiting the ED, and increases in admissions that are covered by Medicaid. Hospitals in non-expansion states, by contrast, report relatively little change in these volumes.
Thus, UCC costs are likely declining among hospitals, particularly among hospitals in Medicaid-expansion states. This has important implications for future financial performance in the hospital industry, as well as for hospitals’ ability to remain clinically excellent and financially solvent in the setting of impending decreases in federal reimbursement for uncompensated care in coming years, as well as implications for state and federal governments.
28 Community Health Systems earnings presentation, 1st quarter 2014, and Community Health Systems' (CYH) CEO Wayne Smith on Q1 2014 Results - Earnings Call Transcript. Available at http://seekingalpha.com/article/2200033-community-health-systems-cyh-ceo...
III. Projecting the Change in Total Hospital Uncompensated Care Costs
In this section, we use existing data from Hospital Cost Reports to project how much lower hospital UCC costs likely will be in 2014 nationally compared to what they would have been without the coverage expansion, based on assumptions about the reduction in uninsured individuals and the growth in Medicaid coverage. It is necessary to project UCC because the Cost Reports are submitted to CMS with a substantial lag: though some hospitals have submitted reports for 2013, the latest comprehensive set of filings available are for fiscal year 2012. As a result, data reported via Hospital Cost Reports will not be available to directly measure any changes in UCC following the 2014 coverage expansion for at least one to two years.
A. Methods
We used data as reported in Hospital Cost Reports for 2011 and 2012 for our analysis. These reports are submitted to CMS annually by all acute-care and critical access hospitals (CAHs). Data on UCC are reported in Worksheet S-10 of Form CMS-2552-10, which was first used beginning in May 2010.55 We defined UCC as the sum of two reported items: (1) the cost of charity care provided to uninsured patients (line 23 column 1); and (2) the cost of non-Medicare bad-debt expense (line 29).56
Table 1 reports the sum of UCC over all reporting hospitals as well as its two components (charity care and bad debt) for the years 2011 and 2012 for the 25 states plus Washington DC that have expanded Medicaid and initiated enrollment as of July 2014, the 2 states that have expanded Medicaid and are now initiating enrollment (PA and NH), and the 23 non-expansion states (note that PA and NH are listed separately because, though they are expanding Medicaid, their enrollment will begin during or after the time period covered in our savings projections; CMS similarly separates out these two states on their most recent Medicaid enrollment report).57 Also note that hospital UCC in expansion states was slightly higher than in non-expansion states in 2011 and 2012:
Table 1: Amounts and Sources of Hospital Uncompensated Care as Reported in CMS Hospital Cost Reports, 2011-2012 (billions of current $)
| Uncompensated Care (Total) | Non-Medicare Bad Debt | Charity Care to Uninsured Patients | |
| 2011 | |||
| All States | 34.1 | 14.7 | 19.4 |
| Medicaid Expansion States | 18.2 | 7.1 | 11.0 |
| States Implementing Medicaid Expansion after Q2 2014 (NH and PA)* | 0.8 | 7.0 | 8.0 |
| 2012 | |||
| All States | 34.7 | 15.2 | 19.5 |
| Medicaid Expansion States | 17.6 | 6.8 | 10.8 |
| States Implementing Medicaid Expansion after Q2 2014 (NH and PA)* | 0.9 | 0.5 | 0.3 |
| Non-expansion States | 16.3 | 7.9 | 8.4 |
Source: ASPE calculations from CMS Hospital Cost Reports available publicly from CMS.gov. Figures are summed over all reporting hospitals. Expansion states are defined to include AR, AZ, CA, CO, CT, DE, DC, HI, IL, IA, KY, MD, MA, MI, MN, NV, NJ, NM, NY, ND, OH, OR, RI, VT, WA, and WV. Non-expansion states are defined as all other states, with the exception of NH and PA (see next).
*: Note that NH and PA are implementing the Medicaid expansion, but were not included among actively enrolling states for this analysis because enrollment in these states is scheduled to begin either in mid-2014 or at the beginning of 2015, and thus coverage gains would not be expected to fully accrue during the time frame included in our projection (FY 2014). These states were therefore excluded from the analyses.
The numbers of individuals who were uninsured and who were covered by Medicaid in each state and in each year in 2011 and 2012 were obtained from estimates made by the U.S. Bureau of the Census.58 These estimates are based on survey data from the Current Population Survey's Annual Social and Economic Supplement. These numbers were used to model the association between numbers of uninsured and Medicaid-covered individuals in each state and the amount of UCC provided in 2011 and 2012 (see Appendix B for detailed methodology and model outputs).
We then used this model to project 2014 UCC by using projected numbers of individuals who are uninsured and covered by Medicaid at the state-level. The most recent estimate of the reduction in uninsured was published in the New England Journal of Medicine, using ASPE analyses based on the Gallup-Healthways WBI poll, and suggests that 10.3 million fewer people were uninsured as of June 2014.59 Based on Medicaid enrollment reports,60 we assumed that the number of individuals covered by Medicaid would be 7.9 million higher than it otherwise would have been as a result of coverage expansion, of which 6.9 million is in expansion states, and 1.0 million in non-expansion states. We also estimated that roughly two-thirds of the decline in the number of uninsured persons (which is composed of both new enrollment in Medicaid and new enrollment in private insurance programs, through the Marketplace or through employers) would come from states that expanded Medicaid.
There are limitations to these projections; for example, if consumers cannot pay the cost-sharing amounts required under their coverage, it is possible that hospitals will still be left with a degree of uncompensated care for these individuals. The mix of rates and plans offered and selected in any given state will impact hospital reimbursement; our models reflect overall patterns. Additionally, there is concern that the Cost Report data, because it is self-reported by hospitals, may not be of high enough fidelity to use in estimating hospital UCC. For this reason, Medicare has continued to use each hospital’s number of Medicaid days and Medicare Supplemental Security Income days as their proxy for uncompensated care rather than the Cost Report information. However, MedPAC and others have recommended that the Cost Report data be used because they believe it provides a better estimate of uncompensated care.61 We chose to use Cost Report data because it allows us to examine multiple components of uncompensated care, but we recognize the limitations inherent in hospital-reported data.
B. Projected Reduction in Uncompensated Care Costs in 2014 as a Result of Increased Rates of Medicaid Coverage and Decreased Rates of Uninsurance
Based on the model outlined above, we found that, in 2011-2012, a one-million person increase in the number of individuals covered by Medicaid in a state was associated with a $0.292 billion decrease in hospital UCC in that state. Similarly, a one-million person increase in the number of uninsured in a state was associated with a $0.344 billion increase in hospital UCC in that state.
Therefore, a 7.9 million person increase in the number of uninsured individuals covered by Medicaid and an 10.3 million person decrease in the number of individuals who are uninsured overall, as we see in 2014 thus far, should lead to a net $5.7 billion reduction in hospital UCC costs in FY 2014 relative to what these costs would have been in the absence of coverage expansion, or a 16 percent reduction overall.
Most of this projected reduction ($4.2 billion of the $5.7 billion) is projected to come from reductions in charity care, with the remainder coming from reductions in bad debt. $4.2 billion of the reduction in UCC is projected to accrue in Medicaid expansion states, and $1.5 billion in Medicaid non-expansion states (Figure 9).
Reassuringly, this estimated reduction is similar to the reduction that would be obtained by multiplying estimates of per capita uncompensated care costs in the literature by the total change in insurance coverage. For example, Coughlin et al.62 estimate that each full-year uninsured person incurred $1,005 in implicitly subsidized uninsured costs (the concept of uncompensated care most closely comparable to the estimate in this brief) in 2013. If 60 percent of that care is hospital-based, then a 10.3 million person reduction in the uninsured might be expected to lead to a 10.3 million * $1,005 * 60 percent, or $6.2 billion reduction in hospital uncompensated care costs, very similar to the $5.7 billion estimate arrived at above.
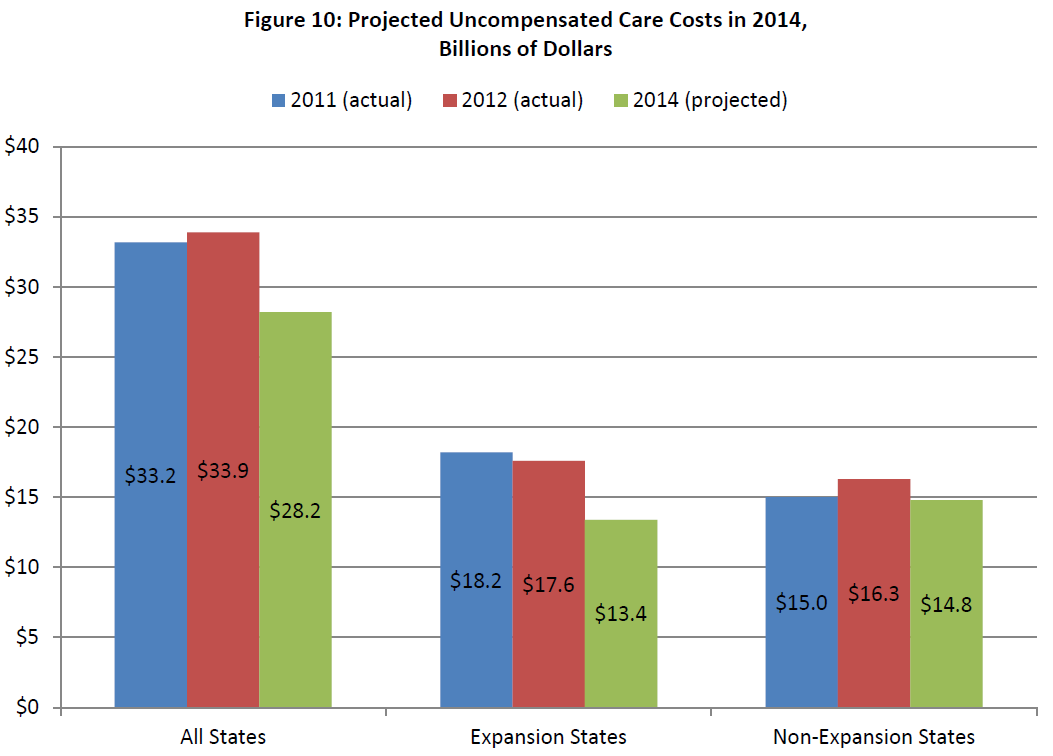
Applying our estimated reductions from the model, and assuming an otherwise stable level of anticipated spending in 2014 of $33.2 billion, we calculate that hospital UCC in 2014 under insurance expansion would therefore project to around $28 billion overall. We project that $13 billion of spending on UCC at hospitals would take place in Medicaid expansion states and $15 billion in Medicaid non-expansion states (Figure 10).
In sum, we find that insurance expansion under the ACA, via both Medicaid and Marketplace insurance expansion, can be anticipated to be associated with a sizeable reduction in hospital UCC costs. Though baseline UCC spending was similar between expansion and non-expansion states, projected UCC costs drop significantly more in expansion states under this projection. Hospitals in expansion states are projected to save $4.2 billion, which represents about 25 percent of these states’ baseline spending or 74 percent of the total savings nationally. Hospitals in non-expansion states are projected to save $1.5 billion, representing 9 percent of these states’ baseline spending, or 26 percent of the total savings nationally.
62 Coughlin et al, 2014
Summary
Early hospital financial reporting and member surveys from hospital associations indicate that payor mix is shifting and uncompensated care is declining through second quarter 2014. Volumes of uninsured/self-pay admissions and ED visits (which are major drivers of uncompensated care) have fallen substantially, but particularly in Medicaid expansion states. Overall volumes of admissions from patients covered by Medicaid have increased, but predominantly in Medicaid expansion states. Projections suggest that UCC costs will be substantially lower in 2014 as a result of coverage expansion than they otherwise would have been: projections estimate a $5.7 billion reduction in hospital UCC costs in 2014 (16 percent of baseline uncompensated care spending). In Medicaid expansion states, hospitals are projected to experience reductions of $4.2 billion, representing 25 percent of these states’ baseline spending or 74 percent of the total savings nationally. In Medicaid non-expansion states, hospitals are projected to experience reductions of $1.5 billion, representing 9 percent of these states’ baseline spending, or 26 percent of the total savings nationally. This has important implications for hospitals’ future financial performance as public and private insurance continue to expand and as levels of federal reimbursement for UCC are reduced through cuts in DSH payments.
Appendices
Appendix A: Individuals Uninsured and Covered by Medicaid, by Year (all ages, millions of individuals)
| Uninsured | Medicaid | |||||||||||
| All States | Non-Expansion States | Expansion States | All States | Non-Expansion States | Expansion States | |||||||
| Year | Number | Percent | Number | Percent | Number | Percent | Number | Percent | Number | Percent | Number | Percent |
| 1999 | 37,702 | 14% | 19,230 | 13% | 18,471 | 14% | 27,353 | 10% | 13,389 | 9% | 13,964 | 11% |
| 2000 | 36,586 | 13% | 18,880 | 13% | 17,706 | 13% | 28,062 | 10% | 13,721 | 9% | 14,341 | 11% |
| 2001 | 38,023 | 13% | 19,936 | 13% | 18,087 | 14% | 30,166 | 11% | 15,260 | 10% | 14,906 | 11% |
| 2002 | 39,776 | 14% | 21,264 | 14% | 18,512 | 14% | 31,934 | 11% | 16,054 | 11% | 15,880 | 12% |
| 2003 | 41,949 | 15% | 22,229 | 15% | 19,719 | 14% | 34,326 | 12% | 17,406 | 11% | 16,920 | 12% |
| 2004 | 41,752 | 14% | 22,707 | 15% | 19,045 | 14% | 38,055 | 13% | 19,170 | 12% | 18,885 | 14% |
| 2005 | 43,035 | 15% | 23,354 | 15% | 19,681 | 14% | 38,191 | 13% | 19,514 | 13% | 18,677 | 14% |
| 2006 | 45,214 | 15% | 24,587 | 16% | 20,627 | 15% | 38,370 | 13% | 19,061 | 12% | 19,309 | 14% |
| 2007 | 44,088 | 15% | 24,691 | 16% | 19,397 | 14% | 39,685 | 13% | 19,639 | 12% | 20,046 | 14% |
| 2008 | 44,780 | 15% | 24,684 | 15% | 20,097 | 14% | 42,831 | 14% | 21,455 | 13% | 21,376 | 15% |
| 2009 | 48,985 | 16% | 27,503 | 17% | 21,482 | 15% | 47,847 | 16% | 23,702 | 15% | 24,145 | 17% |
| 2010 | 49,951 | 16% | 27,816 | 17% | 22,134 | 15% | 48,533 | 16% | 24,300 | 15% | 24,233 | 17% |
| 2011 | 48,613 | 16% | 27,172 | 16% | 21,442 | 15% | 50,835 | 16% | 25,438 | 15% | 25,397 | 18% |
| 2012 | 47,951 | 15% | 27,474 | 17% | 20,476 | 14% | 50,903 | 16% | 25,012 | 15% | 25,891 | 18% |
Source: U.S. Census Bureau
Appendix B: Projected Effects of Increased Medicaid Coverage and Decreases in Uninsurance on Hospital Uncompensated Care: Detailed Methods
APSE conducted a statistical analysis to assess, at the state level, the association between the amount of uncompensated care (UCC) provided by hospitals in a state in a year and the number of individuals covered by Medicaid and the number of individuals who are uninsured. It then used the results of this analysis along with state-level projections of the numbers of uninsured and Medicaid-covered individuals to project how much lower UCC would be.
Hospital UCC in 2011 and 2012 was calculated from Hospital Cost Reports, as described in the main body of this report. These data were then aggregated to the state level in each year for use in the state-level analysis.
The numbers of individuals who were uninsured and who were covered by Medicaid in each state and in each year were obtained from estimates made by the U.S. Bureau of the Census.63 These estimates are based on survey data from the Current Population Survey.
To assess the association between UCC and the numbers of uninsured and Medicaid-covered individuals, we used the following panel-data model:

where:
UCCs,t is the dollar amount of UCC provided by hospitals in state s and in year t (in billions of current dollars);
Medicaids,t is the number of individuals covered by the Medicaid program in state s and in year t (in millions);
Uninsureds,t is the number of individuals who were uninsured for the entire year in state s and in year t (in millions);
ϕs is a set of state fixed effects; and
θt is a set of year fixed effects.
The use of panel data and the inclusion of a set of state and year fixed effects is preferred over a simpler model assessing the cross-sectional association between UCC, Medicaid, and Uninsured because the latter model is more likely to be affected by omitted variable bias.
The results of this statistical model are reported in the Table below. The results indicate that a one-million increase in the number of people uninsured in a state is associated with a $0.344 billion increase in hospital UCC in that state. Similarly, a one-million increase in the number of people covered by Medicaid in a state is associated with a $0.292 billion decrease in hospital UCC in that state.
63 United States Census Bureau, online Health Insurance data. Available at http://www.census.gov/hhes/www/hlthins/
Appendix B Table: The Association Between Hospital Uncompensated Care and the Numbers of Uninsured and Medicaid-Covered Individuals, 2011-2012
| Uncompensated Care (Total) | Bad Debt | Charity Care | |
| Uninsured | 0.344*** | 0.128** | 0.216*** |
| (0.0837) | (0.0537) | (0.0699) | |
| Medicaid | -0.292** | -0.0249 | -0.267* |
| (0.138) | (0.0744) | (0.136) | |
| Observations | 102 | 102 | 102 |
| R-squared | 0.998 | 0.993 | 0.999 |
Robust standard errors are reported in parentheses.
*** p-value<0.01; ** p-value<0.05; * p-value<0.10.
Source: ASPE calculations from CMS Hospital Cost Reports and U.S. Census Bureau data available publicly from CMS.gov and from Census.gov.