
For the period: October 1, 2013 – March 31, 2014
(Including Additional Special Enrollment Period Activity Reported through 4-19-14)
This is the sixth in a series of issue briefs highlighting national and state-level enrollment-related information for the Health Insurance Marketplace (Marketplace).1 This brief includes data for states that are implementing their own Marketplaces (also known as State-Based Marketplaces or SBMs), and states with Marketplaces that are supported by or fully run by the Department of Health and Human Services (including those run in partnership with states, also known as the Federally-facilitated Marketplace or FFM).
This brief also includes updated data on the characteristics of persons who have selected a Marketplace plan (by gender, age, and financial assistance status) and the plans that they have selected (by metal level). Additionally, for the first time, Appendix C of this report includes self-reported race/ethnicity data on persons who have selected a Marketplace plan through the FFM. This report also includes data on other characteristics of people who have selected plans in the FFM and the plans they have selected. (Detailed state-level tables can be found in Appendix E, and in the Addendum to the Report).2
Key Marketplace Enrollment Statistics
- Over 8 million people have selected a plan through the Health Insurance Marketplace (SBMs and FFM) through March 31st (including additional special enrollment period (SEP) activity reported through Saturday, April 19th).
- 2.2 million (28 percent) of the people who selected a Marketplace plan during the initial open enrollment period were young adults between the ages of 18 and 34. A total of 2.7 million (34 percent) were between the ages of 0 and 34 (including additional SEP activity reported through Saturday, April 19th).
- Nearly 3.8 million people selected a Marketplace plan during the March enrollment surge at the end of the initial open enrollment period, including nearly 1.2 million young adults (ages 18-34), or 31 percent of the total surge, who selected a Marketplace plan during March (including additional SEP activity reported through Saturday, April 19th).
- 47 percent of the total number of people who selected a Marketplace plan and 52 percent of the young adults (ages 18-34) who selected a Marketplace plan did so during the last month of the initial open enrollment period (including additional SEP activity reported through Saturday, April 19th).
- The number of young adults who selected Marketplace plans doubled during the last month of the initial open enrollment period, from nearly 1.1 million (during the first 5 months) to more than 2.2 million (including additional SEP activity reported through Saturday, April 19th).
- Over the course of the initial open enrollment period, consumer interest in the Marketplace was high, as measured by 98 million website visits and 33 million calls to the call centers (FFM and SBMs combined, including additional SEP activity reported through Saturday, April 19th).
This report captures cumulative enrollment-related activity during the initial open enrollment period (10-1-13 to 3-31-14), including activity associated with individuals who qualified for a Special Enrollment Period (SEP) that was reported through 4-19-14. The data on SEP activity include information for those who qualified for an SEP because they were “in line” on 3-31-14,3 4 as well as those who qualified for an SEP for other reasons.5 Several metrics are reported, including: the number of visits to the Marketplace websites, the number of calls to the Marketplace call centers, the number of persons who have been determined or assessed eligible by the Marketplaces for Medicaid or the Children’s Health Insurance Program (CHIP),6 and the number of persons who have selected a plan through the Marketplace.
The cumulative number of individuals that have selected a Marketplace plan between 10-1-13 and 3-31-14, including additional SEP activity reported through April 19th is over 8 million (including those who have paid a premium and those who have not yet paid a premium).
Figure 1 and Table 1 show that, consistent with expectations,7 the proportion of young adults (ages 18 to 34) who have selected a Marketplace plan through the SBMs and FFM has remained strong. Young adults accounted for 31 percent of the Marketplace plan selections after March 1st, which was 4 percentage points higher than their share of plan selections between 12-29-13 and 3-1-14 (27 percent) and 7 percentage points higher than their share of plan selections between 10-1-13 and 12-28-13 (24 percent). Meanwhile, the proportion of older adults (ages 35 and over) selecting a Marketplace plan has continued to decrease (from 70 percent between 10-1-13 and 12-28-13 to 62 percent after March 1st).
Figure 1
Trends in the Age Distribution of Individuals Who Have Selected a Marketplace Plan, 10-1-13 to 3-31-14
(Including Additional SEP Activity through 4-19-14)
The proportion of young adults (ages 18-34) selecting a Marketplace plan increased by 4 percentage points after March 1st (from 27% to 31%), while the proportion of older adults (35 & over) selecting a plan continued to decrease
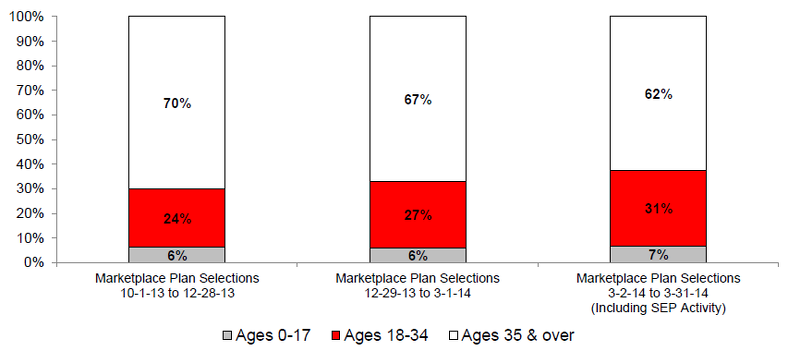
Notes: Represents cumulative monthly data on the number of unique individuals who have been determined eligible to enroll in a Marketplace plan through the SBMs and FFM, and have selected a plan (with or without the first premium payment having been received by the issuer). The percent distribution excludes plan selections where the age is unknown. Between 10-1-13 and 12-28-13, 2.2 million individuals selected a plan; between 12-29-13 and 3-1-14, 2.1 million selected a plan; between 3-2-14 and 3-31-14 (including additional SEP activity through 4-19-14), 3.8 million selected a plan, for a total of 8 million Marketplace plan selections for 10-1-13 to 3-31-14 (including SEP activity through 4-19-14). SEP activity includes plan selections by those who qualified for an SEP because they were “in line” on 3-31-14, as well as those who experienced a qualifying life event or a complex situation related to applying for coverage in the Marketplace.
Table 1
| Trends in the Distribution of Marketplace Plan Selections By Age Group (based on data reported as of 4-29-14) | Marketplace Plan Selections, 10-1-13 to 12-28-13 | Marketplace Plan Selections, 12-29-13 to 3-1-14 | Marketplace Plan Selections, 3-2-14 to 3-31-14 (including SEP Activity through 4-19-14) | Cumulative Total, Initial Open Enrollment Period 10-1-13 to 3-31-14 (including SEP Activity through 4-19-14) | ||||
|---|---|---|---|---|---|---|---|---|
| Number | % of Total | Number | % of Total | Number | % of Total | Number | % of Total | |
| MARKETPLACE TOTAL | ||||||||
| Ages 0-17 | 126,735 | 6% | 124,521 | 6% | 246,266 | 7% | 497,522 | 6% |
| Ages 18-34 | 489,460 | 24% | 586,530 | 27% | 1,172,953 | 31% | 2,248,943 | 28% |
| Ages 35 & over | 1,442,012 | 70% | 1,465,422 | 67% | 2,351,803 | 62% | 5,259,237 | 66% |
| Subtotal With Available Data on Age | 2,058,207 | 100% | 2,176,473 | 100% | 3,771,022 | 100% | 8,005,702 | 100% |
| Unknown Age | 95,214 | n/a | -87,569 | n/a | 6,416 | n/a | 14,061 | n/a |
| Total, All Ages | 2,153,421 | n/a | 2,088,904 | n/a | 3,777,438 | n/a | 8,019,763 | n/a |
| SBM SUBTOTAL | ||||||||
| Ages 0-17 | 61,049 | 7% | 39,803 | 6% | 41,054 | 4% | 141,906 | 6% |
| Ages 18-34 | 212,909 | 25% | 198,736 | 26% | 298,946 | 32% | 710,591 | 28% |
| Ages 35 & over | 595,016 | 68% | 513,726 | 68% | 598,292 | 64% | 1,707,034 | 67% |
| Subtotal With Available Data on Age | 868,974 | 100% | 752,265 | 100% | 938,292 | 100% | 2,559,531 | 100% |
| Unknown Age | 88,017 | n/a | -88,017 | n/a | 14,054 | n/a | 14,054 | n/a |
| Total, All Ages | 956,991 | n/a | 664,248 | n/a | 952,346 | n/a | 2,573,585 | n/a |
| FFM SUBTOTAL | ||||||||
| Ages 0-17 | 65,686 | 6% | 84,718 | 7% | 205,212 | 7% | 355,616 | 7% |
| Ages 18-34 | 276,551 | 23% | 387,794 | 27% | 874,007 | 31% | 1,538,352 | 28% |
| Ages 35 & over | 846,996 | 71% | 951,696 | 66% | 1,753,511 | 62% | 3,552,203 | 65% |
| Subtotal With Available Data on Age | 1,189,233 | 100% | 1,424,208 | 100% | 2,832,730 | 100% | 5,446,171 | 100% |
| Unknown Age | 7,197 | n/a | 448 | n/a | -7,638 | n/a | 7 | n/a |
| Total, All Ages | 1,196,430 | n/a | 1,424,656 | n/a | 2,825,092 | n/a | 5,446,178 | n/a |
Notes: Represents cumulative data on the number of unique individuals who have been determined eligible to enroll in a Marketplace plan through the SBMs and FFM, and have selected a plan (with or without the first premium payment having been received by the issuer). Special Enrollment Period (SEP) activity includes plan selections that were made between 4-1-14 and 4-19-14 by those who qualified for an SEP because they were “in line” on 3-31-14, as well as those who experienced a qualifying life event or a complex situation related to applying for coverage in the Marketplace.
Percentages in this table are based on the total number of plan selections for which the applicable data are available, excluding plan selections with unknown data for age.
Source: Centers for Medicare & Medicaid Services, as of 4-29-2014.
There was an 89 percent increase in the cumulative number of individuals who selected a Marketplace plan after March 1st (including SEP activity through 4-19-14).
The total number of new Marketplace plan selections was significantly higher after March 1st (including SEP activity through 4-19-14) when compared with comparable data for February (nearly 3.8 million versus 0.9 million, respectively), consistent with expectations that the rate of Marketplace plan selections would increase as the March 31, 2014 end of the initial open enrollment period approached.
1 The previous Marketplace enrollment reports can be accessed at http://www.aspe.hhs.gov/health/reports/2012/ACA-Research/index.cfm.
2 The Addendum to the Marketplace Summary Enrollment Report is available at http://aspe.hhs.gov/health/reports/2014/MarketPlaceEnrollment/Apr2014/i….
3 Those who had started the enrollment process on or before March 31st (i.e., those who were “in line”) were allowed to complete that process, even if their enrollment was not finalized before March 31. This accommodation was made so that people who had demonstrated a good faith effort to enroll during the Open Enrollment Period were not penalized if the Marketplace websites or call centers could not complete their enrollment by March 31st.
4 The SEP for individuals who were “in-line” on 3-31-14 ended on 4-15-14 for the FFM. Most SBMs followed the federal guidelines regarding individuals who started the process before 3/31 but could not finish, allowing applicants to complete the application and select a plan by April 15th. Other states, including Colorado, Nevada, Oregon, and Maryland allowed consumers additional time beyond April 15th to complete the enrollment process and obtain coverage in 2014. For example, Maryland’s SEP continued through April 18, 2014, while Oregon established an SEP which continues through April 30. Colorado’s SEP extends through May 30th, and Nevada will offer an SEP from April 1, 2014 – May 30, 2014 to individuals who have either successfully registered or attempted to register for an account on Nevadahealthlink.com prior to March 31, 2014.
5 This includes persons who had a qualifying life event that qualifies them for an SEP (such as a change in marital status, a change in dependents, or losing minimum essential health coverage), or a complex situation related to applying for coverage in the Marketplace. Additional information on Marketplace SEPs can be found at https://www.healthcare.gov/how-can-i-get-coverage-outside-of-open-enrol….
6 Data related to Medicaid and CHIP eligibility in this report are based on applications submitted through the Marketplaces. October through March data based on applications submitted through state Medicaid/CHIP agencies were released by the Centers for Medicare & Medicaid Services in a separate report, “Medicaid & CHIP: March 2014 Monthly Applications, Eligibility Determinations, and Enrollment Report,” May 1, 2014, which can be accessed at http://www.medicaid.gov/AffordableCareAct/Medicaid-Moving-Forward-2014/….
7 The general expectation is that people who are older and sicker are more likely to select coverage earlier in the initial enrollment period, while “younger and healthier people will tend to wait until towards the end of the open enrollment period.” “The Numbers Behind “Young Invincibles” and the Affordable Care Act,” Larry Levitt, Gary Claxton and Anthony Damico, Kaiser Family Foundation, December 17, 2013, available at http://kff.org/healthreform/ perspective/the-numbers-behind-young-invincibles-and-the-affordable-care-act/.
Enrollment Growth in March
As expected, an enrollment surge occurred in March as the close of the open enrollment period approached for the Marketplace. This is consistent with the experience of private employers, the Federal Employees Health Benefits Program (FEHBP), and Medicare Part D.8
Table 2 shows that approximately 0.9 million (12 percent) of the more than 8 million total Marketplace plan selections during the initial open enrollment period (including SEP activity through 4-19-14) were selected after 3-31-14.9
Table 2
| Cumulative Number of Marketplace Plan Selections by Plan Selection Date 10-1-2013 to 3-31-2014, Including SEP Activity Through 4-19-14 (based on data reported as of 4-29-14) | Total Number of Individuals Who Have Selected a Marketplace Plan During The Initial Open Enrollment Period (Including SEP Activity Through 4-19-14) | By Plan Selection Date | |
|---|---|---|---|
| Number Who Selected a Marketplace Plan By 3-31-14 | Number Who Selected a Marketplace Plan Between 4-1-14 and 4-19-14 | ||
| Number | Number | Number | |
| SBM Subtotal | 2,573,585 | 2,312,058 | 261,527 |
| FFM Subtotal | 5,446,178 | 4,797,210 | 648,968 |
| MARKETPLACE TOTAL | 8,019,763 | 7,109,268 | 910,495 |
Notes: Represents cumulative data on the number of unique individuals who have been determined eligible to enroll in a Marketplace plan through the SBMs and FFM, and have selected a plan (with or without the first premium payment having been received by the issuer). Special Enrollment Period (SEP) activity includes plan selections that were made between 4-1-14 and 4-19-14 by those who qualified for an SEP because they were “in line” on 3-31-14, as well as those who experienced a qualifying life event or a complex situation related to applying for coverage in the Marketplace. Source: Centers for Medicare & Medicaid Services, as of 4-29-2014.
As discussed earlier, the total number of Marketplace plan selections at the end of the initial open enrollment period was over 8 million (including SEP activity through 4-19-14). We note that the Congressional Budget Office (CBO) Marketplace enrollment projection of 6 million for 2014 is estimated based on average enrollment for the calendar year (full-year equivalents from CMS enrollment data will not be available until sometime in 2015).10 It is important to note that the Marketplace plan selection data as of the end of the open enrollment period do not represent effectuated enrollment (e.g., those who have paid their premium), and does not include the additional persons who will experience a qualifying life event (also known as a change in life circumstances, such as having a baby, getting married, getting divorced, or losing other coverage) that enables them to qualify for an SEP and enroll in Marketplace coverage for 2014 through the end of the year.11
8 For additional information, please refer to the March Marketplace Enrollment Report, which can be accessed at http://www.aspe.hhs.gov/health/reports/2014/MarketPlaceEnrollment/Mar201... and Appendix C of the November Marketplace Enrollment Report, which can be accessed at http://www.aspe.hhs.gov/health/reports/2013/MarketPlaceEnrollment/rpt_en....
9 The Department estimates that most of these persons qualified for an SEP because they were “in-line” on 3-31-14. As discussed earlier, this number may also include persons who qualified for an SEP due to a change in life circumstances, or a complex situation related to applying for coverage in the Marketplace. The data are not disaggregated based on the reason that a given individual qualified for an SEP.
10 CBO recently revised its initial CY 2014 Marketplace enrollment projection (to 6 million in the February 2014 baseline from 7 million in earlier baselines). CBO estimates represent averages over the calendar year (i.e., a full-year equivalent or total life years), rather than an estimate for a point in time.), rather than an estimate for a point in time. CBO’s “Budget and Economic Outlook: Fiscal Years 2014 to 2024,” released Feb. 4, 2014, accessed at http://www.cbo.gov/sites/default/files/private/cbofiles/attachments/45010-Outloo....
11 There are nine types of life events that would potentially allow an individual to qualify for an SEP through the Marketplace.: 1) a change in marital status (marriage, divorce); 2) a change in dependents (birth, adoption, or undertaking placement of a child); 3) permanently moving to a state whose health plan options differ from their current choices; 4) gaining new status as a citizen or lawfully present individual in the USA; 5) experiencing a change in income; 6) experiencing an enrollment error on behalf of the Marketplace; 7) losing minimum essential health coverage due to job loss, divorce, loss of Medicaid or CHIP eligibility, expiration of COBRA coverage, or decertification of a health plan; 8) being already enrolled in a Marketplace plan, but experiencing a change in income or household status, affecting tax credit or cost-sharing reduction eligibility; and 9) aging off of their parent’s healthcare plan at 26 years of age. Additionally, there are several types of other complicated cases that may qualify for an SEP, relating to: exceptional circumstances, misinformation or misrepresentation, an enrollment error, system errors related to immigration status, display errors on HealthCare.gov, Medicaid/Marketplace transfers, error messages, unresolved casework, victims of domestic abuse, and other system errors.
Effectuated Enrollment
CMS does not yet have comprehensive and accurate data about effectuated enrollment (that is, the number of individuals who have effectuated their enrollment and gained coverage through payment of the first premium). However, some issuers have made public statements indicating that 80 percent to 90 percent of the people who have selected a Marketplace plan have made premium payments.12 Issuers have the flexibility to determine when premium payments are due.
12 For example, the Blue Cross Blue Shield Association recently estimated that roughly 80 to 85 percent of the people who had selected one of their plans through the Marketplace went on to pay their first month's premium, based on data for policies that took effect on 2-1-14 or earlier (for more information, see “Blue Cross Says ‘80-85’ Percent of Obamacare Enrollees Are Paying,” by Bruce Japsen, Forbes, April 2, 2014, accessed at www.forbes.com/sites/brucejapsen/2014/04/02/blue-cross-plans-say-80-to-8...). Additionally, Wellpoint recently reported that 90 percent of those who have signed up for their plans through the Marketplace have paid their premiums (for more information, see “WellPoint: Surge in young health exchange customers may ease premium hikes” by Maureen Groppe, IndyStar, April 30, 2014, accessed at http://www.indystar.com/story/news/politics/2014/04/30/wellpoint-surge-y...).This is consistent with estimates from Aetna, WellPoint, Health Care Services Corporation, and Blue Shield of California, who recently indicated that between 80 to 85 percent of the people who had selected their plans had paid through February 2014 (for more information, see “Administration: 4.2 million people signed up for Obamacare plans through February” by Kyle Cheney, Politico, March 11, 2014, accessed at http://www.politico.com/story/2014/03/obamacare-affordable-care-act-1045...). Similarly, Blue Cross and Blue Shield of Minnesota has stated that 95 percent of the people who signed up for coverage that took effect on 1-1-14 had paid premiums by the deadline of 1-10-14 (for more information, see “One-Fifth of New Enrollees Under Health Care Law Fail to Pay First Premium,” Robert Pear, The New York Times, February 13, 2014, accessed at http://www.nytimes.com/2014/02/14/us/politics/one-in-5-buyers-of-insuran...).
Increase in Health Insurance Coverage
In addition to the more than 8 million people who have selected plans through the Marketplace during the initial open enrollment period (including SEP activity through 4-19-14), CBO recently estimated that an additional 5 million people have purchased coverage outside of the Marketplace in Affordable Care Act-compliant plans.13 Meanwhile, the Blue Cross Blue Shield Association estimates that its plans have enrolled 1.7 million in Affordable Care Act-compliant, off-Marketplace plans.14 Additionally, E-Health reports that 45 percent of its off-Marketplace enrollees from January through early March of 2014 were ages 18 to 34.15
Moreover, recent national surveys indicate that the number of Americans with health insurance coverage is growing, and the number of 18 to 64 year olds who are uninsured is declining. For example, Gallup has found a 3 percentage point decrease in the uninsured rate for adults (18 to 64) from the third quarter of 2014 to March 2014 (18 percent versus 15 percent, respectively, corresponding to a 7.26 million decline in the number of uninsured adults).16 Similarly, the Urban Institute estimates a 2.7 percentage point decrease in the uninsured rate for adults (18 to 64) from October 1, 2013 to March 31, 2014 (corresponding to a 5.4 million decline in the number of uninsured adults).17 Meanwhile, the RAND Corporation estimates a 4.7 percentage point decrease in the uninsured rate (corresponding to a net decrease of 9.3 million uninsured adults, ages of 18 to 64) from the last week of September 2013 through March 2014.18
13 Congressional Budget Office (CBO), “Updated Estimates of the Effects of the Insurance Coverage Provisions of the Affordable Care Act, April 2014,” April 2014, accessed at http://cbo.gov/sites/default/files/private/cbofiles/attachments/45231-ACA_Estima....
14 Sophie Novack, “The Missing Millions in the Obamacare Enrollment Total,” National Journal, April 3, 2014, accessed at http://www.nationaljournal.com/health-care/the-missing-millions-in-the-o....
15 Ibid.
16 Alyssa Brown, “Is the Affordable Care Act Working?,” Gallup Thrive blog post, April 16, 2014. Available at: http://thrive.gallup.com/2014/04/is-affordable-care-act-working.html.
17 Long SK, Kenney GM, Zuckerman S, et al. QuickTake: Number of Uninsured Adults Falls by 5.4 Million since 2013. Washington, DC: Urban Institute; 2014. Accessed at http://hrms.urban.org/quicktakes/changeInUninsurance.html.
18 Katherine Carman and Christine Eibner, “Changes in Health Insurance Enrollment Since 2013: Evidence from the RAND Health Reform Opinion Study,” RAND Corporation, April 2014. Available at: http://www.rand.org/pubs/research_reports/RR656.html.
Single Risk Pool in Each State
To increase stability and comparability in health plan rating, the Affordable Care Act requires a single risk pool in each state, encompassing both plans that were purchased inside of the Marketplace (“Marketplace plans”) and Affordable Care Act-compliant plans that were purchased outside of the Marketplace. Risk-adjustment occurs across all plans in each state’s single risk pool. The Department will have more complete data on the size of the single risk pool in each state as issuers report their enrollment for medical loss ratio, rate review, and risk adjustment purposes over the course of the next year.
Enrollment Growth at the End of the Open Enrollment Period
There was continued growth in total Marketplace plan selections after March 1st (including SEP activity through 4-19-14), compared to the October-February period:
- Marketplace Total (SBMs and FFM) – there was an 89 percent increase in plan selections after March 1st (including SEP activity through 4-19-14)
- the 4.2 million cumulative number in October-February rose by nearly 3.8 million after March 1st to a cumulative total of more than 8 million (including SEP activity through 4-19-14)
- SBMs – there was a 59 percent increase in plan selections after March 1st (including SEP activity through 4-19-14)
- the 1.6 million cumulative number for October-February rose by more than 0.9 million after March 1st to a cumulative total of nearly 2.6 million (including SEP activity through 4-19-14)
- FFM – there was a 108 percent increase in plan selections after March 1st (including SEP activity through 4-19-14)
- the 2.6 million cumulative number in October-February rose by 2.8 million after March 1st to a cumulative total of 5.4 million (including SEP activity through 4-19-14)
The following are highlights of Marketplace enrollment-related information for the initial open enrollment period, including additional SEP activity through 4-19-14 (see Appendix E and the Addendum to the Marketplace Summary Enrollment Report for specific state-level data).
Cumulative Highlights for the period: October 1, 2013 – March 31, 2014 (including Additional Special Enrollment Period Activity through 4-19-14)
Marketplace Eligibility Determinations and Plan Selection
- Number of Eligible Persons who have Selected a Plan through the SBMs and FFM: 8 million
- Number of Persons who have had a Medicaid/CHIP Determination or Assessment through the Marketplaces: 6.7 million (does not include individuals applying through State Medicaid/CHIP agencies.)
Marketplace Plan Selection by Gender
- 46 percent19 of the persons who have selected a Marketplace plan are male
- 54 percent of the persons who have selected a Marketplace plan are female
Marketplace Plan Selection by Age
- 28 percent of the persons who have selected a Marketplace plan are between the ages of 18 and 34
- The percentage of young adults among persons who selected a Marketplace plan after March 1st (31 percent) was 4 percentage points higher than it was in January and February, and 7 percentage points higher than it was from October through December (27 percent and 24 percent, respectively)
- 34 percent of the persons who have selected a Marketplace plan are between the ages of 0 and 34
Marketplace Plan Selection by Metal Level
- 20 percent of the persons who have selected a Marketplace plan have selected a Bronze plan
- 65 percent of the persons who have selected a Marketplace plan have selected a Silver plan
- 9 percent of the persons who have selected a Marketplace plan have selected a Gold plan
- 5 percent of the persons who have selected a Marketplace plan have selected a Platinum plan
- 2 percent of the persons who have selected a Marketplace plan have selected a Catastrophic plan
Marketplace Plan Selection by Financial Assistance Status
- 85 percent of the persons who have selected a Marketplace plan have selected a Marketplace Plan with Financial Assistance20
FFM Marketplace Plan Selection by Gender and Age
- 29 percent of the males who have selected a Marketplace plan through the FFM are between 18 and 34
- 28 percent of the females who have selected a Marketplace plan through the FFM are between 18 and 34
FFM Marketplace Plan Selection by Gender and Metal Level
- FFM Marketplace Plan Selection by Gender and Metal Level
- 67 percent of the males who have selected a Marketplace plan through the FFM have selected a Silver plan
FFM Marketplace Plan Selection by Financial Assistance Status and Metal Level
- 76 percent of the persons who have selected a Marketplace plan with Financial Assistance through the FFM have selected a Silver plan
- 95 percent of the persons selecting a Silver plan in the FFM will be receiving Federal financial assistance in paying their premiums
- 25 percent of the persons who have selected a Marketplace plan without Financial Assistance through the FFM have selected a Silver plan
- 33 percent of the persons who have selected a Marketplace plan without Financial Assistance through the FFM have selected a Bronze plan
FFM Marketplace Plan Selection by Metal Level and Age
- 68 percent of the young adults between the ages of 18 and 34 who selected a Marketplace plan through the FFM selected a Silver plan
- 17 percent of the young adults between the ages of 18 and 34 who selected a Marketplace plan through the FFM selected a Bronze plan
- 7 percent of the young adults between the ages of 18 and 34 who selected a Marketplace plan through the FFM selected a Gold plan
- 4 percent of the young adults between the ages of 18 and 34 who selected a Marketplace plan through the FFM selected a Platinum plan
- 5 percent of the young adults between the ages of 18 and 34 who selected a Marketplace plan through the FFM selected a Catastrophic plan
- Young adults account for 83 percent of all catastrophic plan selections through the FFM
Monthly Data on Marketplace Plan Selection – As shown in Figure 2, the cumulative number of persons who have selected a Marketplace plan has increased considerably since the end of the fifth month of the initial open enrollment period.
Figure 2
Trends in the Cumulative Number of Individuals Who Have Selected a Marketplace Plan, 10-1-13 to 3-31-14
(Including Additional SEP Activity through 4-19-14)
Over 8 million people have selected a Marketplace plan since October 1st, including 5.4 million who have selected a plan through the FFM
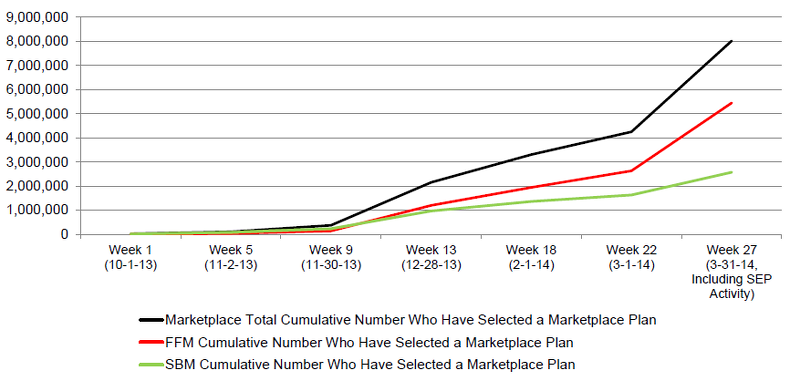
Notes: Represents cumulative monthly sums of data on the number of unique individuals who have been determined eligible to enroll in a plan through the SBMs and FFM, and have selected a plan (with or without the first premium payment having been received by the issuer). SEP activity includes plan selections by those who qualified for an SEP because they were “in line” on 3-31-14, as well as those who experienced a qualifying life event or a complex situation related to applying for coverage in the Marketplace
Source: Centers for Medicare & Medicaid Services, as of 4-29-2014.
Enrollment Growth by Age - Table 3 shows that the cumulative number of young adults (ages 18 to 34) selecting a Marketplace plan grew faster than for other age groups when the period after March 1st (including SEP activity through 4-19-14) is compared to the five month period. The cumulative number of young adults selecting a Marketplace plan has doubled – increasing by 109 percent (nearly 1.2 million) since March 1st (from nearly 1.1 million to 2.2 million). By comparison, there was an 82 percent increase in Marketplace plan selections for all other age groups during the same time period (from nearly 3.2 million to over 5.7 million).
Table 3
| Trend In the Cumulative Number of Marketplace Plan Selections By Age Group (based on data reported as of 4-29-14) | Cumulative Total, First Five Months 10-1-13 to 3-1-14 | Cumulative Total, 10-1-13 to 3-31-14 (Including Additional SEP Activity through 4-19-14) | % Change |
|---|---|---|---|
| MARKETPLACE TOTAL | |||
| Ages 18 to 34 | 1,075,990 | 2,248,943 | 109% |
| All Other Age Groups Combined | 3,158,690 | 5,756,759 | 82% |
| Subtotal With Available Data on Age | 4,234,680 | 8,005,702 | 89% |
| Unknown Age | 7,645 | 14,061 | 84% |
| Marketplace Total | 4,242,325 | 8,019,763 | 89% |
| SBM TOTAL | |||
| Ages 18 to 34 | 411,645 | 710,591 | 73% |
| All Other Age Groups Combined | 1,209,594 | 1,848,940 | 53% |
| Subtotal With Available Data on Age | 1,621,239 | 2,559,531 | 58% |
| Unknown Age | 0 | 14,054 | n/a |
| Marketplace Total | 1,621,239 | 2,573,585 | 59% |
| FFM TOTAL | |||
| Ages 18 to 34 | 664,345 | 1,538,352 | 132% |
| All Other Age Groups Combined | 1,949,096 | 3,907,819 | 100% |
| Subtotal With Available Data on Age | 2,613,441 | 5,446,171 | 108% |
| Unknown Age | 7,645 | n/a* | n/a |
| Marketplace Total | 2,621,086 | 5,446,178 | 108% |
Notes: Represents cumulative data on the number of unique individuals who have been determined eligible to enroll in a Marketplace plan through the SBMs and FFM, and have selected a plan (with or without the first premium payment having been received by the issuer). Special Enrollment Period (SEP) activity includes plan selections that were made between 4-1-14 and 4-19-14 by those who qualified for an SEP because they were “in line” on 3-31-14, as well as those who experienced a qualifying life event or a complex situation related to applying for coverage in the Marketplace. The percentages for Ages 18 to 34 and All Other Age Groups Combined are based on the total number of plan selections for which the applicable data are available, excluding plan selections with unknown data for age.
* Data for cells with less than ten Marketplace plan selections have been suppressed in this table, but are included in the totals.
Source: Centers for Medicare & Medicaid Services, as of 4-29-2014.
Marketplace Plan Selections by Age – The proportion of Marketplace plan selections by persons between the ages of 18 and 34 has been increasing (Table 4). Persons between the ages of 18 and 34 account for more than a quarter (28 percent) of all Marketplace plan selections (SBMs and FFM) for the initial open enrollment period, including SEP activity through 4-19-14 (compared to 24 percent during the first three months of the initial open enrollment, and 27 percent during the months of January and February).
- SBMs: 28 percent between the ages of 18 and 34 (10-1-13 to 3-31-14, including SEP activity through 4-19-14).
- FFM: 28 percent between the ages of 18 and 34 (10-1-13 to 3-31-14, including SEP activity through 4-19-14).
Table 4
| Comparison of the Age Distribution of Marketplace Plan Selections (SBM & FFM) For the Initial Open Enrollment Period: 10-1-13 to 3-31-14 (Including SEP Activity through 4-19-14) (based on data reported as of 4-29-14) | Percent of Total Individuals Who Have Selected a Marketplace Plan (1) |
|---|---|
| Age < 18 | 6% |
| Age 18-25 | 11% |
| Age 26-34 | 17% |
| Age 35-44 | 17% |
| Age 45-54 | 23% |
| Age 55-64 | 25% |
| Age ≥65 21 | 0% |
| Total | 100% |
| Ages 18 to 34 | 28% |
| Ages 0 to 34 | 34% |
(1) Represents the age distribution based on Represents cumulative data on the number of unique individuals who have been determined eligible to enroll in a Marketplace plan through the SBMs and FFM, and have selected a plan (with or without the first premium payment having been received by the issuer). Special Enrollment Period (SEP) activity includes plan selections that were made between 4-1-14 and 4-19-14 by those who qualified for an SEP because they were “in line” on 3-31-14, as well as those who experienced a qualifying life event or a complex situation related to applying for coverage in the Marketplace. The percentages are based on the total number of plan selections for which the applicable data are available, excluding plan selections with unknown data for age. Additionally, these percentages have been rounded, and may not add to totals due to rounding errors.
Source: Centers for Medicare & Medicaid Services, as of 4-29-2014.
19 Based on the total number of plan selections for which the applicable data are available (excluding unknown). Some percentages may not add to 100% due to rounding.
20 Represents individuals who have selected a Marketplace plan, and qualify for an advance premium tax credit (APTC), with or without a cost-sharing reduction (CSR).
21 There are nearly 400,000 uninsured persons over the age of 65; some persons over 65 have selected Marketplace plans.
Overview of Enrollment-Related Activity to Date
Selected a Marketplace Plan – Over 8 million persons selected a Marketplace plan during the initial open enrollment period (including additional SEP activity through 4-19-14), including nearly 2.6 million in SBMs and 5.4 million in the FFM (these numbers include those who have paid a premium and those who have not yet paid a premium, regardless of when their coverage begins).
The following are additional highlights of the data on the characteristics of Marketplace plan selections during the initial open enrollment period, including SEP activity through 4-19-14 (see Appendix A for national-level tables, and see the Addendum to the Marketplace Summary Enrollment Report for state-level tables).22
- Marketplace Plan Selections by Gender – The gender distribution of Marketplace plan selections has remained constant. More than half of the people who have selected a Marketplace plan through the SBMs and FFM between 10-1-13 and 3-31-14 (including additional SEP activity through 4-19-14) are female (54 percent of the total for the Marketplace as a whole, excluding plan selections where gender is unknown), while the remaining 46 percent are male. The comparable proportions for the first five months of the initial open enrollment period were 55 percent and 45 percent, respectively.
- SBMs: 53 percent female, 47 percent male (10-1-13 to 3-31-14, including SEP activity through 4-19-14).
- FFM: 55 percent female, 45 percent male (10-1-13 to 3-31-14, including SEP activity through 4-19-14).
By comparison, males account for half (50 percent) of the total non-elderly population in the United States (ages 0 to 64).23
- Marketplace Plan Selections by Metal Level – The proportion of Silver Marketplace plan selections has continued to increase. Silver plans account for nearly two-thirds (65 percent) of the Marketplace plan selections in the SBMs and FFM between 10-1-13 and 3-31-14, including additional SEP activity through 4-19-14 (compared with 63 percent during the first five months of the initial enrollment period).
- SBMs: 58 percent Silver (10-1-13 to 3-31-14, including SEP activity through 4-19-14).
- FFM: 69 percent Silver (10-1-13 to 3-31-14, including SEP activity through 4-19-14).
The metal level distribution of the remaining Marketplace plan selections (SBMs and FFM combined) are as follows: bronze (20 percent), gold (9 percent), platinum (5 percent), and catastrophic (2 percent).
- Marketplace Plan Selections by Financial Assistance Status – The proportion of Marketplace plan selections with financial assistance (i.e., Marketplace plan selections by individuals who are eligible to receive financial assistance) has also continued to increase. More than eight out of ten (85 percent) of the people who selected a Marketplace plan through the SBMs and FFM between 10-1-13 and 3-31-14 (including additional SEP activity through 4-19-14) are eligible to receive Federal financial assistance in paying their premiums.24 The comparable proportion for the first five months of the initial open enrollment period was 83 percent.
- SBMs: 82 percent in Marketplace plans with financial assistance (10-1-13 to 3-31-14, including SEP activity through 4-19-14).
- FFM: 86 percent in Marketplace plans with financial assistance (10-1-13 to 3-31-14, including SEP activity through 4-19-14).
Tax credits for premium assistance may be available to individuals with family incomes between 100 and 400 percent of the Federal Poverty Level (138 to 400 percent of FPL in states taking the Federally-funded option to expand Medicaid). These percentages are consistent with previous estimates.25 It is also important to note that people who are not eligible for advance premium tax credits may have chosen to enroll in an Affordable Care Act-compliant, off-Marketplace plan instead; including them in the denominator would lower the percentages of people in Affordable Care Act-compliant plans in the individual market who are receiving premium assistance.
Additional Characteristics of FFM Marketplace Plan Selections – The following are highlights of data on additional characteristics of FFM Marketplace plan selections between 10-1-13 and 3-31-14 (including additional SEP activity through 4-19-14), based on cross-tabulations of the above mentioned metrics (see Appendix B for national-level tables, and see the Addendum to the Marketplace Summary Enrollment Report for state-level tables).
- FFM Marketplace Plan Selections by Gender and Age
- Young adults (ages 18-34) accounted for 29 percent of all males selecting Marketplace plans through the FFM, compared with 28 percent of all females selecting Marketplace plans through the FFM, and 28 percent of all FFM Marketplace plan selections as a whole.
- Meanwhile, adding children ages 0 to 17 results in males between the ages of 0 and 34 accounting for over a third (36 percent) of all males selecting Marketplace plans through the FFM, compared with 33 percent for females, and 35 percent for all persons who selected a Marketplace plan through the FFM.
- FFM Marketplace Plan Selections by Gender and Metal Level
- Females were more likely to select Silver plans in the FFM (71 percent versus 67 percent for males).
- Males were more likely to select Bronze plans in the FFM (19 percent versus 16 percent for females).
- FFM Marketplace Plan Selections by Financial Assistance Status and Metal Level
- Persons selecting a Marketplace plan who are eligible to receive financial assistance were more likely to select Silver plans in the FFM (76 percent versus 25 percent for persons selecting a Silver Marketplace plan without financial assistance).
- Persons selecting a Marketplace plan without financial assistance were more likely to select Bronze plans in the FFM than other metal levels (33 percent versus 15 percent for persons selecting a Marketplace plan with financial assistance). They were also more likely to select gold, platinum and catastrophic plans than were persons who are eligible to receive financial assistance.
- More than nine out of ten (95 percent) of the persons selecting a Silver plan in the FFM are eligible to receive Federal financial assistance in paying their premiums.
- FFM Marketplace Plan Selections by Metal Level and Age
- Among young adults (ages 18 to 34), 68 percent selected a Silver plan, while 17 percent selected a Bronze plan, 7 percent selected a Gold plan, 4 percent selected a Platinum plan, and 5 percent selected a Catastrophic plan.
- One out of three (34 percent) of the 1.1 million persons who selected a standalone dental plan through the FFM are young adults (ages 18-34).26
Web Site and Call Center Volume – There were 98 million visits to the SBM and FFM websites,27 and 33 million calls to the SBM and FFM call centers between 10-1-13 and 3-31-14 (including additional SEP activity through 4-19-14).
Table 5
| Cumulative Marketplace Enrollment-Related Information For the Initial Open Enrollment Period: 10-1-13 to 3-31-14 (Including SEP Activity through 4-19-14) (1) (based on data reported as of 4-29-14) | Marketplace Total | SBM Total | FFM Total |
|---|---|---|---|
| Visits on the Marketplace websites (2) | 98,333,355 | 31,109,693 | 67,223,662 |
| Calls to the Marketplace call centers | 33,303,050 | 9,592,887 | 23,710,163 |
| Number of individuals who have selected a Marketplace plan | 8,019,763 | 2,573,585 | 5,446,178 |
| Males who have selected a Marketplace plan (3) | 46% | 47% | 45% |
| 18 to 34 year olds who have selected a Marketplace plan (3) | 28% | 28% | 28% |
| Individuals who have selected a Silver Marketplace plan (3) | 65% | 58% | 69% |
| Individuals who have selected a Marketplace plan with financial assistance (3) | 85% | 82% | 86% |
(1) Represents cumulative data on the number of unique individuals who have been determined eligible to enroll in a Marketplace plan through the SBMs and FFM, and have selected a plan (with or without the first premium payment having been received by the issuer). Special Enrollment Period (SEP) activity includes plan selections that were made between 4-1-14 and 4-19-14 by those who qualified for an SEP because they were “in line” on 3-31-14, as well as those who experienced a qualifying life event or a complex situation related to applying for coverage in the Marketplace. See Appendix F for methodological information. Visitors to the Marketplace websites is the sum of monthly data and has been unduplicated to the extent possible; however, we do not believe that all duplication has yet been removed.
(2) While all SBMs have provided updated data on call center activity, not all SBMs have provided updated data on website visits.
(3) Percentages shown in this table are based on the total number of plan selections for which the applicable data are available, excluding plan selections with unknown data for a given metric (e.g., age, gender, etc.)
Source: Centers for Medicare & Medicaid Services, as of 4-29-2014.
22 The percentages cited in this section are based on the total number of plan selections for which the applicable data are available, excluding plan selections with unknown data for a given metric (e.g., age, gender, metal level, etc.) Aggregate data on the total number of plan selections with available data for a given metric, and the corresponding number of plan selections with unknown data for a given metric can be found in Appendix Table A1.
23 ASPE analysis of the 2010-2012 Current Population Survey Annual Social and Economic Supplement (CPS ASEC, covering calendar years 2009-2011), adjusted using ASPE’s TRIM3 microsimulation to include only estimated nonelderly U.S. citizens and others lawfully present.
24 This includes people who qualify for an advance premium tax credit (APTC), with or without a cost-sharing reduction (CSR).
25 For example, the Congressional Budget Office (CBO) estimates for CY 2014 were as follows: 6 million subsidized / 7 million total in Marketplace = 86% with financial assistance. (Source: "Effects on Health Insurance and the Federal Budget for the Insurance Coverage Provisions in the Affordable Care Act—May 2013 Baseline," May 14, 2013, accessed at http://www.cbo.gov/sites/default/files/private/cbofiles/attachments/43900-2014-0....)
26 It is important to note that the totals for standalone dental plans do not include individuals who are enrolled in Marketplace plans that provide integrated medical and dental coverage.
27 While all SBMs have provided updated data on call center activity, not all SBMs have provided updated data on website visits. In addition, duplication has been removed from the data on the cumulative number of website visitors to the extent possible; however, it is possible that not all duplication has been removed.
Methodological Overview
The data reported here have been generated by the information systems of the Centers for Medicare & Medicaid Services (CMS), based on information reported to CMS by SBMs, and information collected by the FFM for states with HHS-supported or fully run Marketplaces (including those run in partnership with states). Data for certain metrics are not yet available for some SBM states due to information system issues. (Please refer to Appendix F for additional methodological information.)
As discussed earlier, this report includes cumulative data for the initial open enrollment period (10-1-13 to 3-31-14), including additional activity associated with individuals who qualified for a Special Enrollment Period (SEP) because they were “in line” on 3-31-14, as well as those who experienced a qualifying life event or a complex situation related to applying for coverage in the Marketplace. To the extent possible, these counts seek to avoid potential duplication associated with monthly reporting.
This report also includes data on the characteristics of persons who have selected a Marketplace plan (by gender, age, metal level, and financial assistance status for the SBMs and FFM; and for the FFM, by gender and age, gender and metal level, financial assistance status and metal level, and metal level and age). In some cases, the data for certain characteristics of Marketplace plan selections are not yet available. Detailed state-level tables can be found in Appendix E, and in the Addendum to the Marketplace Summary Enrollment Report.28
Please note that for the first time, the Appendices of this report include FFM data on the race/ethnicity (Appendix C) and health insurance coverage status at the time of application (Appendix D) and of the persons who have selected a Marketplace plan through the FFM. While this information is provided for transparency purposes, its quality is low and its use should be limited.
We believe that the information contained in this issue brief provides the most systematic “snapshot” of enrollment-related activity in the Marketplaces to date because the data for the various metrics are counted using comparable definitions for data elements across states, and between the SBMs and FFM. It is important to note that the SBM enrollment-related data that are reported in this issue brief represent state data that have been reported to CMS as of April 29, 2014, and may differ from comparable data that have previously been publicly reported on SBM websites or in media reports because that data may be based on different time periods or metric definitions from those used in this report.
28 The Addendum to the Marketplace Summary Enrollment Report is available at http://aspe.hhs.gov/health/reports/2014/MarketPlaceEnrollment/Apr2014/ib....
Appendices
| Contents | |
|---|---|
| Appendix A: | Characteristics of Marketplace Plan Selection by Gender, Age, Metal Level, and Financial Assistance, 10-1-2013 to 3-31-2014 (including Additional Special Enrollment Period Activity through 4-19-14) |
| |
| |
| |
| |
| |
| Appendix B: | Summary of Additional Characteristics of FFM Marketplace Plan Selections, 10-1-2013 to 3-31-2014 (including Additional Special Enrollment Period Activity through 4-19-14) |
| |
| |
| |
| |
| |
| Appendix C | Characteristics of Persons Who Have Selected Marketplace Plans Through the FFM By Race/Ethnicity |
| Appendix D | Characteristics of Persons Who Have Selected Marketplace Plans Through the FFM By Health Insurance Coverage Status At the Time of Application |
| Appendix E: | Total Marketplace Eligibility Determinations, and Marketplace Plan Selections by Marketplace Type and State, 10-1-2013 to 3-31-2014 (including Additional Special Enrollment Period Activity through 4-19-14) |
| Appendix F: | Methodology and Technical Notes |
Note: The Addendum to the Marketplace Summary Enrollment Report is available at http://aspe.hhs.gov/health/reports/2014/MarketPlaceEnrollment/Apr2014/ib....