
Contract HHSP23320045017XI
Task Order HHSP233200700003T
Prepared for:
Department of Health and Human Services, Office of the Assistant Secretary for Planning and Evaluation
Prepared by:
The Lewin Group and
i3 Innovus
July 2009
This report was prepared by The Lewin Group, Inc., in collaboration with i3 Innovus. Staff contributing to this report include: Clifford Goodman, PhD*, Joanna Campbell, PhD†, Erin Karnes*, Laura Peterson*, Shalini Naik, MS†, Kristen Nunes†, William Vogt, PhD‡, Deborah Marshall, PhD†, Steve Clark†, Bengt Jönsson, PhD†, and William Crown, PhD†. The Lewin Group and i3 Innovus gratefully acknowledge the guidance and support of Amber Jessup, PhD, of the Office of the Assistant Secretary for Planning and Evaluation, Department of Health and Human Services.
* The Lewin Group
† i3 Innovus
‡ National Bureau of Economic Research
Unlike most conventional drugs, biological products are usually large, complex molecules that are produced by living organisms. These commercially engineered biologics currently account for billions of dollars in health care spending. Starting early last century, Congress has regulated most biologics separately from small molecules under the Biologics Control Act, which was later incorporated into the Public Health Service (PHS) Act. Although some biologics are regulated under the Federal Food, Drug, and Cosmetic Act (FDCA) for historical reasons, and are, therefore, candidates for generic production through section 505(j), an Abbreviated New Drug Application (ANDA), or through 505(b)(2), using data from previously approved innovator biologics to make claims of safety and effectiveness, there is no abbreviated path for replica or closely similar follow-on products for biologics under the PHS Act. While this group of products is known by various names, this report uses the term “follow-on protein products” (FoPPs).
Due to the potential cost savings that FoPPs could provide in the US market, members of Congress have made various proposals for establishing a regulatory pathway for FoPPs. The purpose of this report is to provide an unbiased estimate of potential cost savings from the introduction of FoPPs under multiple scenarios for abbreviated regulatory pathways. Findings from this analysis may be useful in the context of ongoing policy deliberations. A better understanding of the potential impact of legislative provisions for the regulatory pathway on cost savings may inform policymakers as such a pathway is considered.
This report was prepared by The Lewin Group and i3 Innovus under contract to the Assistant Secretary forPlanning and Evaluation. The findings and conclusions of this report are those of the author(s) and do not necessarily represent the views of ASPE or HHS. Material contained in this publication is in the public domain and may be reproduced, fully or partially, without permission of the Federal Government.
"I. Executive summary
Background & Purpose
Unlike most conventional drugs, biological products are usually large, complex molecules that are produced by living organisms such as yeast or mammalian cells. These commercially engineered biologics currently account for billions of dollars in health care spending. Starting early last century, Congress has regulated most biologics separately from small molecules under the Biologics Control Act, which was later incorporated into the Public Health Service (PHS) Act. Although some biologics are regulated under the Federal Food, Drug, and Cosmetic Act (FDCA) for historical reasons, and are, therefore, candidates for generic production through section 505(j), an Abbreviated New Drug Application (ANDA), or through 505(b)(2), using data from previously approved innovator biologics to make claims of safety and effectiveness, there is no abbreviated path for replica or closely similar follow-on products for biologics under the PHS Act. While this group of products is known by various names, this report uses the term "follow-on protein products" (FoPPs). Because of their different molecular nature and mode of production compared to small molecule drugs, synthesizing truly identical generic versions of original biologics is regarded as unlikely. However, due to the size of the market, and as more originator (or "branded") products approach expiration of their intellectual property, there is an increased interest in exploring FoPPs and creating a regulatory pathway under the PHS Act that is analogous to 505(b)(2) or 505(j) under the FDCA.
To date, at least six FoPPs have been approved in the US by the FDA, perhaps the most prominent of which is a follow-on of somatropin. Sandoz's Omnitrope® is a biologic intended to replicate the recombinant human growth hormone (hGH), somatropin (Genotropin®, Pfizer), which is regulated under the FDCA. Since hGH products are approved under the FDCA, the abbreviated approval of Omnitrope® does not establish a pathway for follow-on versions of biologics regulated under the PHS. Unlike the US , Europe has created a "biosimilars" program, which uses a case-by-case approach to regulate FoPPs, requiring some clinical efficacy and safety data for market approval. At the time of this report, 13 FoPPs had been approved by the European Medicines Agency (EMEA) through their biosimilars program. Six of these FoPPs are for granulocyte colony-stimulating factor (G-CSF), two are for hGH, and five are for erythropoietins. Although the biosimilars program established a model of a regulatory pathway and has approved its first products, the data on market performance are only emerging.
Due to the potential cost savings that FoPPs could provide in the US market, members of Congress have made various proposals for establishing a regulatory pathway for FoPPs. Five bills were introduced in the 110th Congress and referred to committee; however, none were reported out of committee or received a vote. To date, two bills have been introduced in the 111th Congress related to FoPPs. Controversy surrounds the various approaches proposed in these bills, particularly given the high prices associated with biologics and the likelihood of price discounts with the introduction of FoPPs. Three studies released in early 2007 generated estimates of the cost savings that could result from patent expiration of branded biologics and the emergence of corresponding FoPPs assuming the approval of a regulatory mechanism under the PHS Act. While these analyses started with similar goals, they generated divergent estimates.
The purpose of this report is to provide an unbiased estimate of potential cost savings from the introduction of FoPPs under multiple scenarios for abbreviated regulatory pathways. Findings from this analysis may be useful in the context of ongoing policy deliberations. A better understanding of the potential impact of legislative provisions for the regulatory pathway on cost savings may inform policymakers as such a pathway is considered.
Methodology
The first of two stages of research and analysis identified the likely candidates for FoPPs. In this stage, we examined broad categories of biological products using searches of the Internet, published literature, and other sources (e.g., market research reports) to locate relevant information. We also conducted semi-structured interviews with experts from federal agencies, industry, academia, and health economists. Each biologic category was examined with regard to criteria identified as important through the preliminary search and interviews. The results of this review informed the selection of a subset of biologic categories for further consideration. We then analyzed individual biologics within these selected categories based on additional criteria identified as relevant to the potential for development of a FoPP. From these analyses, we generated a list of the most likely candidates for FoPPs.
Estimation of the cost impact of FoPP competition for the selected biologic drugs proceeded in two stages. First, we estimated costs associated with the utilization of the originator biologic products, assuming the status quo of no FoPP entrants (sometimes identified here as the "world without" scenario). We then estimated total costs for the "world with" scenario, which includes the costs associated with the originator biologic products and any competing FoPP(s). Describing the "world with" scenario involved modeling changes in current marketplace dynamics resulting from the introduction of FoPPs, including anticipated: (1) lower prices, (2) substitution away from originator biologics currently on the market, and (3) market expansion. The net difference between the "world without" and "world with" costs is the estimate of the incremental cost impact associated with the entry of FoPPs.
The analysis used a high-level approach to estimating the potential cost impact associated with competition from FoPPs, suitable for accommodating drugs spanning multiple, widely varying disease areas. We characterized each originator product along a series of dimensions, including market size, molecular complexity, pre-entry market competitiveness, and fixed costs of FoPP entry. These product characteristics were inputs into models of FoPP entry, the subsequent evolution of brand and FoPP prices, overall market size, and brand and FoPP market shares, i.e., the components necessary to calculate the cost-impact of FoPP entry. The models of market entry, pricing and demand were grounded in a series of microeconomic studies of the economics of the pharmaceutical industry generally, and the biological industry specifically.[1],[2],[3],[4],[5] Default parameter estimates were derived from the published literature and market studies, supplemented by input from experts in clinical matters, pharmacoeconomics and pharmaceutical economics. A summary description of the approach is provided in Figure 1.
Figure 1: Schematic of Model Framework for Analysis of Cost Impact of
FoPP Availability (Base-Case Analysis)
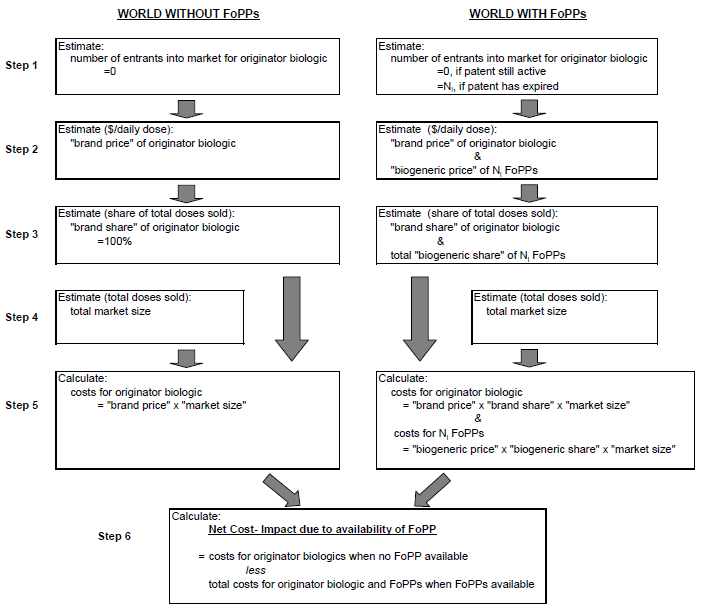
Figure 1 is entitled "Schematic of Model Framework for Analysis of Cost Impact of FoPP Availability (Base-Case Analysis)". The figure is a diagram of two columns, one being "WORLD WITHOUT FoPPs" and the second being "WORLD WITH FoPPs." Each column has 5 seperate steps of calculations which then lead to Step 6, which is a calculation shared by both columns. This particular diagram demonstrates the likely number of FoPP entrants is a key determinant of the estimates of cost impact of FoPP competition.
The base-case analysis of the incremental cost impact associated with FoPP availability used straightforward assumptions regarding FoPP entry, FoPP pricing, FoPP market share, and overall market size. The model was then run iteratively under a series of alternative assumptions on entry, pricing, market share and market size. Finally, the base case results were subjected to sensitivity analyses involving variation of selected underlying model parameters through a pre-determined range of plausible values. Particular attention was given to modeling varying assumptions designed to represent a potential range of
Results
From the 10 original categories of biologics considered, 6 categories of biologics were selected for further analysis based on input from experts and the results of our initial research, including:
- Erythropoietin (EPO)
- Cancer monoclonal antibodies (MAbs)
- Anti-tumor necrosis factor (anti-TNF) agents
- Interferon beta
- Granulocyte-colony stimulating factor (G-CSF)
- Interferon alpha
Within these categories, only individual products that ranked in the top 20 biologics according to 2006 sales were evaluated. Among the categories considered, the following biologics were selected as the most likely candidates for FoPPs:
- Procrit®/EPOGEN® (EPO)
- Rituxan® (MAb)
- Herceptin® (MAb)
- Avastin® (MAb)
- Enbrel® (anti-TNF)
- Remicade® (anti-TNF)
- Avonex® (interferon beta)
- Rebif® (interferon beta)
- Neupogen® (G-CSF)
- Pegasys® (interferon alpha)
Projected cost savings associated with establishing a regulatory pathway for FoPPs are based on modeling the anticipated experience with FoPPs for these 10 products.
Under the base case scenario:
- Biologic markets are assumed to open to FoPP competition after patent expiry and the expiry of a data exclusivity period of 12 years.
- FoPP entry is therefore assumed to occur no earlier than 2012.
- Our model projects that the number of FoPP entrants will range from zero (for Pegasys®) to three (for the EPOs, and Avastin®) over the period 2009-2019.
- FoPP entry is therefore assumed to occur no earlier than 2012.
- The small number of entrants is estimated to be accompanied by maximum FoPP price discounts of 20% (for Avastin) and FoPP market shares of 54% (for Neupogen).
- The price discounts associated with FoPP entry are estimated to result in an additional (induced) increase in the overall demand for these products of at most 4%.
- Under these base case assumptions, cost savings from entry of FoPPs total $9.97 billion dollars over the period 2009-2019.
- $5.3 billion of this is estimated to accrue to private payers.
- $4.65 billion of this is estimated to accrue to public payers.
- $5.3 billion of this is estimated to accrue to private payers.
These estimates are most sensitive to assumptions about the size of eventual FoPP price discounts and brand price inflation in the context of FoPP competition.
- For example, assuming FoPP price discounts of 40% increases the estimate of cost savings by a factor of four, to $44 billion.
- Assuming decreases in brand prices averaging 1.5% per year also increases the estimate of cost savings, to approximately $40 billion.
- In contrast, the effect of varying assumptions on the rigor of the regulatory process, modeled by varying the time to first entry of FoPPs and the fixed cost of FoPP entry, has smaller effects on estimated cost savings.
- Delaying entry of FoPPs by five years lowers the estimate of overall cost savings for the period 2009-2019 by $7.9 billion.
- Assuming that all FoPP entrants will be required to field the equivalent of a 900-person clinical trial lowers the estimate of overall cost savings by $1.5 billion.
- The estimate of cost savings is sensitive to additional FoPP entries in years after the biologic markets first open to competition, as well the manner in which the fixed costs of entry for FoPPs are estimated.
- Assuming that, in years subsequent to the first year of opening of the markets, there will be two additional FoPP competitors for each product increases the estimated cost impact to $16.5 billion.
- Assuming that potential FoPP manufacturers generally would be required to build entirely new production facilities rather than take advantage of existing capacity significantly reduces the estimated number of FoPP entrants and resulting cost savings to negligible levels, i.e., less than $0.5 billion.
- Assuming that, in years subsequent to the first year of opening of the markets, there will be two additional FoPP competitors for each product increases the estimated cost impact to $16.5 billion.
Conclusions and Policy Implications
The matter of expediting competition in the costly and rapidly evolving therapeutic biologics market has great medical and economic significance. Proposed approaches involve abbreviated regulatory approval pathways analogous to the 505(b)(2) or 505(j) processes for drugs regulated under FDCA. In this analysis, we attempt to quantify the financial impact of expedited competition of FoPPs in major therapeutic biologics markets.
The uncertainty associated with market response to FoPP entry is demonstrated by the variation in estimates reported in prior studies. Our analysis combines microeconomic models of the pharmaceutical industry with empirical data and the considered opinion of clinical experts and experts in the fields of pharmacoeconomics and pharmaceutical economics to systematically address the question of “How would FoPP entry affect expenditures on major biologics?”
Our base case analysis estimates total cost savings of $10 billion over the period 2009-2019, assuming entry of the first FoPP into the markets considered no earlier than 2012. Notably, six of the ten biologics that we assess are not expected to be exposed to FoPP competition until 2014 or later. Of even greater significance is that our estimates of the likely fixed costs of entry associated with satisfying clinical requirements similar to those required by the EMEA are projected to limit the number of market entrants per biologic to at most three, and in most cases two or less. As a consequence of the relatively small number of predicted entrants, our estimate of the accompanying FoPP price discount is also low, in the range of 12–20%.
The ability of regulatory authorities to affect this estimate varies in the context of this model. We assume that increased regulatory rigor would arise in the form of requirements to generate greater amounts of clinical evidence, delaying the time to FoPP market entry. Moreover, any requirement for FoPP manufacturers to follow published FDA guidance is likely to introduce further delays. Delaying projected FoPP entry in each market by two years reduces estimated cost savings by $3.4 billion from the base case, or 34%. Further, additional requirements for clinical evidence are more costly to implement. Requiring all FoPP entrants to meet a “very high clinical standard,” which we model as having to conduct a clinical trial involving 900 patients, reduces projected overall cost savings by $1.5 billion from the base case, or about 15%.
In addition to considering alternative scenarios of regulatory rigor, we conducted multiple additional sensitivity analyses around the baseline assumptions at each stage of the analysis including: the year in which branded biologics are exposed to FoPP competition, the increase/decrease in utilization for branded biologic drugs over the period, the size of the fixed costs of entry for FoPP manufacturers, the number of eventual FoPP entrants into each market, the price discounts offered by FoPP manufacturers, brand price inflation in the context of FoPP competition, and the market shares captured by FoPP entrants.
Our sensitivity analyses suggest that the effect of variation in regulatory requirements is small compared to the effect of variation in pricing behavior by originator and FoPP manufacturers. Indeed, the estimates of cost savings are most sensitive to assumptions about the size of FoPP price discounts. If FoPP manufacturers discount conservatively, then projected cost savings will be relatively small. If, however, the opening of the market brings about highly competitive behavior on the part of the originator or FoPP manufacturers, projected cost savings over the period 2009-2019 can be significant, i.e., in excess of $40 billion.
II. Introduction
Background
1. US Regulation of Chemical Small Molecules vs. Biological Products
Most conventional drugs, from aspirin to beta-blockers to statins, comprise small molecules produced using a form of chemical synthesis. In contrast, biological products are usually large, complex molecules that are produced by living organisms such as yeast or mammalian cells. Examples are vaccines, blood and blood products, and insulin. Today, certain commercially bioengineered biologics such as erythropoiesis-stimulating agents and granulocyte colony stimulating factors account for billions of dollars in health care spending. US sales of biologics are expected to exceed $60 billion by 2010.[6]
Small molecules are regulated under the Federal Food, Drug, and Cosmetic Act (FDCA), passed in 1938 to establish a new approval process for drugs. The FDCA includes the 1984 Hatch-Waxman amendments, which established the prevailing drug approval scheme in the US . In brief, under this scheme, most novel drugs ("new chemical entities" [NCEs]) are approved under a New Drug Application (NDA), which pertains to safety and effectiveness as well as patents claiming the drug product and methods for using it (i.e., section 505(b)). The Hatch-Waxman Act provides five years of market exclusivity to the sponsor of an NCE, during which time applications cannot be submitted for alternate versions of the NCE. Further, sponsors can receive three more years of market exclusivity for modifications to existing products that require new clinical investigations. This extended exclusivity prevents Food and Drug Administration (FDA) approval of a generic product with the same modification or a new indication during that time. One method of permission to a generic drug sponsor to market its product is provided through FDA approval of an Abbreviated New Drug Application (ANDA) as described in section 505(j) of the FDCA. Under an ANDA, a generic drug must have the same active ingredient as the original product and the same indications of use, route of administration, dosage form, strength, and (in most instances) labeling as the original product. Having the identical active ingredients as the original product, approval of a generic as safe and effective generally relies on safety and effectiveness data submitted with the original product. An alternative method for generic approval is provided through section 505(b)(2) of the FDCA, commonly referred to as the "paper NDA." FDA has taken the position that a 505(b)(2) permits the applicant to file an NDA that does not contain full reports of clinical studies proving safety and effectiveness, and, instead, references a previously approved innovator product.[7]
Starting with the Biologics Control Act early in the last century, Congress has regulated most biologics separately from small molecules. In 1944, the Biologics Control Act was incorporated into the Public Health Service (PHS) Act, under which biologics are still regulated today. (For historical reasons, certain biologics are regulated under the FDCA, including human growth hormone (hGH), calcitonin, and hyaluronidase.) Consistent with this different regulatory status for biologics, FDA provided a different regulatory scheme for these products. As opposed to the NDA process, marketing of biologics requires FDA approval of a Biological License Application (BLA), which pertains to both the biologic product itself and the producing facility. The PHS Act does not provide an abbreviated approval scheme for products intended to be replicas or closely similar follow-on products.[8] While these products are known by various names (e.g., biosimilars, biogenerics), this report uses the term "follow-on protein products" (FoPPs).
Because of their different molecular nature and mode of production compared to small molecule drugs, producing truly identical generic versions of original biologics is regarded currently as unlikely or impossible. As more originator (or "branded") biologics approach expiration of their intellectual property, there are opportunities for sponsors to develop similar or follow-on products, if not true generic versions. However, the absence of a regulatory pathway under the PHS Act that is analogous to either the 505(j) (ANDA) or 505(b)(2) (paper NDA) pathways under the FDCA complicates the market environment for producing FoPPs that could compete with the original biologics and lower prices in the manner that generics have done for small molecule drugs.
2. Early Experience with US Regulation of FoPPs
To date, at least six FoPPs have been approved by the FDA through section 505(b)(2) of the FDCA.[9] Some examples of products approved through this mechanism to date are: Hylenex® (hyaluronidase recombinant human, Baxter), HydaseTM (hyaluronidase, Akorn), Amphadase® (hyaluronidase, Amphastar), Fortical® (calcitonin salmon recombinant, Upsher-Smith) Nasal Spray, GlucaGen® (glucagon, Novo Nordisk), and Omnitrope® (somatropin, Sandoz).[10] While it is not the first approved FoPP, the case of the somatropin follow-on is of particular importance because it is the first instance of a human growth hormone (hGH) FoPP, i.e., a relatively more complex biologic, approved through the FDA 505(b)(2) process.
Sandoz's Omnitrope® is a biologic intended to replicate the recombinant hGH, somatropin, which is regulated under the FDCA. After several years of consultation with the FDA, Sandoz filed an abbreviated application for Omnitrope® in July 2003. The application consisted of physiochemical, pharmacokinetic, pharmacodynamic, and clinical data comparing Omnitrope® with the innovator drug, Genotropin® (Pfizer). The clinical comparative data submitted came from two controlled trials in pediatric subjects. These data, in combination with the FDA's prior finding that the innovator drug is safe and effective, were intended to support the conclusion that Omnitrope® is also safe and effective for the same indications as the innovator drug, including indications for which Omnitrope® was not studied. [11],[12],[13] Following a year of deliberation, the FDA was still unable to reach a decision whether or not to approve the drug. As a result, Sandoz filed a suit with federal courts forcing the FDA to make a decision. Ultimately, the FDA approved Omnitrope® for use in the US in May 2006, concluding that, while the active ingredient was not identical to the active ingredient of the innovator product, it was highly similar and shared the same molecular weight.[14] While still considered a FoPP to Genotropin®, Omnitrope® has not been rated by the FDA as therapeutically equivalent to Genotropin® or any previously approved hGH product.[15] Since all hGH products are approved under the FDCA, the abbreviated approval of Omnitrope® does not establish a pathway for follow-on versions of biologics regulated under the PHS Act.
3. European Biosimilars Program
While experience with regulation of FoPPs in the US is currently limited to biologics under the FDCA, Europe presents a potential model for a new regulatory pathway for FoPPs in the US . In its "biosimilars" program, Europe has taken a case-by-case approach in regulating FoPPs, requiring some clinical efficacy and safety data for market approval. As implemented by the European Medicines Agency (EMEA), this program provides 10 years of market exclusivity (which can be extended for one year for new therapeutic indications) for a reference (i.e., originator) product against generic, hybrid, or similar biological products.[16]
The first two FoPPs were approved under the biosimilars program in 2006. These were two hGH FoPPs to somatropin, which is produced as branded products Genotropin® (Pfizer) and Humatrope® (Eli Lilly). The FoPPs for these products are known as Omnitrope® (Sandoz) and Valtropin® (Biopartners), respectively. Although it is generally acknowledged that price discounts resulting from the availability of FoPPs are unlikely to reach the amounts with generic versions of regular/small molecules, early experience with Omnitrope® in Germany suggests that the discounts may still be significant.[17] The global market for hGH is about $2.47 billion.[18] In Germany , Sandoz launched Omnitrope® at a 20% discount, and Omnitrope® currently sells for approximately 25% less than Genotropin®.[19] Although these price discounts might have been expected to yield significant savings for consumers and the health system, market share to date for these products across most of Europe is only a few percent. (Undocumented reports suggest that market share in Poland may exceed 50%.[20])
Five additional FoPPs were approved by the EMEA in 2007. The approved FoPPs are based on Johnson & Johnson's erythropoiesis-stimulating agent (ESA), Eprex (marketed as Procrit® in the US ). Binocrit® (Sandoz GmbH), Epoetin alfa Hexal® (Hexal Biotech Forschungs GmbH), and Abseamed® (Medice Arzneimittel Pütter GMBH & Co.) are all epoetin alphas, while Silapo® (Stada Arzneimittel AG) and Retacrit® (Hospira Enterprises B.V.) are epoetin zetas.[21],[22] The current global market for ESAs is $11.94 billion annually, posing a considerable target for competition by biosimilars.[23] Of note in this market is that all three epoetin alphas are products of a single company (Rentschler Biotechnologie GmbH) and that the two epoetin zetas are products of a single company (Norbitec GmbH).
In 2008, six FoPPs for granulocyte colony-stimulating factors (G-CSFs) were approved by the EMEA. XM02, manufactured by Sicor Biotech UAB in Vilnius, Lithuania, has been approved for sale as Biograstim (CT Arzneimittel), Filgrastim Ratiopharm (Ratiopharm), Ratiograstim (Ratiopharm) and Tevagrastim (Teva Pharmaceuticals).[24],[25],[26],[27] Filgrastim, manufactured by Sandoz in Austria, has been approved for sale as Filgrastim Hexal (Hexal Biotech Forschungs GmbH) and Zarzio (Sandoz GmbH).[28],[29] These are biological medicinal products similar to the reference product Neupogen™ (filgrastim) authorized in the EU. The market for G-CSFs is $4.36 billion annually.[30] Similar to the ESA market, while there are six filgrastim follow-ons, only two companies actually manufacture these biologics: Biotech UAB and Sandoz.
Although the biosimilars program established a model of a regulatory pathway and has approved its first products, the data on market performance are only recently emerging. The European experience with regulation of FoPPs may differ from what may arise in the US . Consumption levels of these products tend to be lower in Europe than in the US (although lower prices for the FoPPs could increase European consumption). Reference pricing used in Europe may make the market for FoPPs less attractive by placing additional downward price pressure on the original product once FoPPs enter the market.
4. US Proposals to Establish a Regulatory Pathway for FoPPs
Members of Congress and other policymakers have put forth various proposals for establishing a regulatory pathway for FoPPs. During the 110th Congress, five bills were introduced in the House and Senate and referred to committee. While none of these bills were reported out of committee or received a vote, it is likely that similar proposals will arise in the 111th Congress. To date, two unique bills (three bills in total) have been introduced in the 111th Congress related to biosimilars, including a reintroduction of The Access to Life Saving Medicine Act, now entitled The Promoting Innovation and Access to Life Saving Medicine Act by Representative Waxman and Senator Schumer and a reintroduction of The Pathway for Biosimilars Act by Representative Eshoo. Key provisions from each bill in the 110th and 111th Congress are provided below.
111th Congress, H.R. 1548/S.726: The Promoting Innovation and Access to Life-Saving Medicine Act[31]
Reintroduction of 110th Congress, H.R. 1038/S. 623: The Access to Life-Saving Medicine Act[32])
- Allows a company to file an abbreviated biological product application with the FDA that includes:
- Data demonstrating that the product is comparable to or interchangeable with the innovator product
Information to show that the conditions in the labeling proposed for the FoPP have been previously approved for the innovator product - Information to show that the route of administration, dosage, and strength of the FoPP are the same as the reference product
- Data demonstrating that the product is comparable to or interchangeable with the innovator product
- Allows the FoPP applicant to request FDA make a determination of the interchangeability of the FoPP and the reference product
- Provides the innovator product five years of market exclusivity and an additional six months of market exclusivity for pediatric applications
- The version introduced in the 110th Congress did not provide a period of market exclusivity for the innovator product
- The version introduced in the 110th Congress did not provide a period of market exclusivity for the innovator product
- Provides the innovator product with a total of eight years of market exclusivity if an additional indication is approved
- Provides a period of up to 36 months of market exclusivity for the first FoPP
111th Congress, H.R. 1548: The Pathway for Biosimilars Act
Figure 2 is entitled "Schematic of Model Framework for Analysis of Cost Impact of FoPP Availability (Base-Case Analysis)". The figure is a diagram of two columns, one being "WORLD WITHOUT FoPPs" and the second being "WORLD WITH FoPPs." Each column has 5 seperate steps of calculations which then lead to Step 6, which is a calculation shared by both columns. This particular diagram demonstrates the likely number of FoPP entrants is a key determinant of the estimates of cost impact of FoPP competition.
In this model, the likely number of FoPP entrants is a key determinant of the estimates of cost impact of FoPP competition (following Grabowski et al. 2007). Fewer FoPP entrants will yield less competition, a higher relative FoPP price (lower discount on FoPPs), and smaller cost impact. Additional determinants derived in the model include the FoPP price discount, the degree of market uptake of FoPPs (captured by FoPP market share), and expansion of overall market size in response to (presumably less expensive) FoPP alternatives. The modules estimating market entry, pricing and demand are grounded in a series of microeconomic studies of the economics of the pharmaceutical industry generally, and the biological industry specifically[62],[63],[64],[65],[66],[67] Default parameter estimates external to the model were derived from the published literature, market research studies, supplemented by the input of clinical consultants and experts in
Step 1: Estimating the number of entrants into a biologic product market
Step 1 in the model, the estimation of the number of FoPP entrants, is based on a re-formulation of the framework proposed in the Grabowski et al. (2007) paper, "Entry and competition in generic biologicals," which makes use of the market entry framework of Bresnahan and Reiss (1991).[68] The details of the derivation are presented in the technical Appendix A. We chose the Grabowski framework as a methodological point of reference because it was one of the few papers to explicitly model entry into a biologics (rather than generics) market.
Estimation of FoPP entry into the market for a specified biologic proceeds in two steps. First, the entry decision is analyzed as if the market were one for small-molecule drugs; the resulting estimate of the number of FoPP entrants is then adjusted for institutional differences between markets for biologics and small molecule drugs. Thus, we first estimate the number of generic entrants expected to enter a standard small molecule market equivalent in size to the biologic market of interest (as measured by market revenue). This number is then adjusted for differences between the markets for biologics and small molecules in price-cost margins and fixed costs of entry.
Step 2: Estimating "brand" and "FoPP" prices
Step 2 of our model, estimating the brand price after FoPP entry and FoPP price discount, draws on the analysis of Reiffen and Ward (2005) and Bhattacharya and Vogt (2003). In this stage, we model the FoPP price relative to the "brand" price as a function of the expected number of FoPP entrants.
The choice of Reiffen and Ward merits additional discussion. An important attribute of their analysis is the estimation of the discount attributed to generic entry as a non-linear function of the number of generic competitors. However, the estimated discounts associated with generic entry are somewhat smaller than those of alternative analyses, e.g., Saha et al. (2006) and Grabowski et al. (2007). We contend (based on our stage 1 analysis and supported by the biosimilar experience in Europe) that high fixed costs of entry into these markets are likely to result in few FoPP entrants per drug. The effect of few competitors is bolstered by the expectation that FoPP products are unlikely to be considered identical to the innovator products. (We return to this point in greater detail, below). Biologic markets after FoPP entry may, therefore, be better characterized as imperfectly competitive, even oligopolistic markets, resulting in smaller price discounts than would occur in a market with either much greater numbers of entrants or non-differentiated products.
Step 3: Estimating "brand" and "FoPP" market shares
Step 3 of our model, estimating the cumulative FoPP market, share draws on the analysis of Saha et al. (2006). As we are interested only in predicting market share, rather than analyzing the structural relationships between the determinants, we use the OLS analyses of Saha et al. to estimate FoPP market share as a function of FoPP price discount, the number of FoPP entrants, the overall market size, and the level of HMO coverage within the market.
Step 4: Estimating market size post-FoPP entry
Multiple studies of pharmaceutical benefits design (e.g., Gaynor, Li and Vogt, 2007; and Joyce et al., 2002)[69],[70] have demonstrated that the demand for pharmaceutical products decreases as prices increase. Similarly, the entry of FoPPs and the associated biosimilar price discount are anticipated to induce an increase in pharmaceutical demand and, therefore, in market size.[71] Although some studies show that generic entry in the small molecule market can depress overall market size as brand producers cut back on advertising, we believe that this effect will be negligible in the biologic market, as FoPP producers are likely to try and establish an independent market identity (as does, e.g., Sandoz's Omnitrope®, which is a FoPP for Pfizer's hGH, Genotropin®).
Therefore, we model the increase in market size as a function of the weighted decrease in price, where the weights are the relative "brand" and "FoPP" market shares, which are affected, in turn, by the predicted number of FoPP entrants.
Steps 5-6: Estimating cost impact FoPP entry
The model calculates cumulative cost impact over the period 2009-2019. The base-case analysis of the incremental cost impact associated with FoPP availability uses straightforward assumptions to estimate FoPP entry, FoPP pricing, FoPP market share, and overall market size. The model then re-calculates the cost impact under a series of alternative assumptions on entry, pricing, market share and market size. Finally, the base case results are subjected to sensitivity analyses involving variation of selected underlying model parameters through a pre-determined range of plausible values.
Given the uncertainty regarding new approval pathways for FoPPs, it is important to develop estimates of the cost impact of the availability of FoPPs that are sensitive to the effects of differing levels of rigor for regulatory approval. In this model, the rigor of the approval model affects the estimated cost impact through two pathways: 1) the time to market entry of the FoPP and 2) the fixed costs of satisfying regulatory requirements. The time to market and the costs of clinical trials are assumed to increase with the level of regulatory stringency.
IV. Results
Most Likely Candidates for FoPPs and Rationale for their Selection
1. Evaluation of Biologic Categories
As described in Section III: Methodology, each of the top 10 biologic categories according to 2006 annual sales was evaluated using a set of criteria (e.g., regulatory route, market factors) to determine which categories are most likely to include candidates for FoPPs over the next decade. Information gathered during this review is presented by biologic category in Appendix B and summarized in Table 1.
Based on the factors listed for each category, in addition to feedback from expert stakeholders, two categories (i.e., recombinant coagulation factors and enzyme replacement biologics) were eliminated from consideration. Also, this analysis focuses on biologics currently under the PHS Act that would be eligible for a new abbreviated pathway with the passage of proposed legislation; therefore, the regulatory route for the biologic category was a key consideration. Given that hGH and insulin were approved under the FDCA rather than via the BLA pathway under the PHS Act, these two categories were also eliminated from further consideration.
2. Evaluation of Specific Biologics within the Selected Biologic Categories
Starting with the six remaining categories (i.e., EPO, MAb, anti-TNF, interferon beta, G-CSF, and interferon alpha), we examined individual biologics within these categories that ranked in the top 20 biologics according to 2006 sales. Criteria for this review are described in Section III: Methodology. Detailed information gathered during this review is presented in Appendix C and summarized by biologic category following Table 1.
Originator product markets are assumed to be closed to entry until expiry of both the patent protection period and data exclusivity period (Table 4), with FoPP entry in prior years assumed to equal zero.
| Procrit/Epogen | Herceptin | Rituxan | Avastin | Enbrel | Remicade | Avonex | Rebif | Neupogen | Pegasys | |
|---|---|---|---|---|---|---|---|---|---|---|
| Year of Market Launch | 1990 | 1998 | 1997 | 2004 | 1998 | 1998 | 1996 | 2002 | 1991 | 2002 |
| Initial indication | Anemia | Breast Cancer | Non-Hodgkin's Lymphoma | Colorectal Cancer | Rheumatoid Arthritis | Crohn's Disease | Multiple Sclerosis | Multiple Sclerosis | Neutropenia | Hepatits C |
| Year of Effective Patent Expiry | 2013 | 2015 | 2015 | 2017 | 2012 | 2014 | 2013 | 2013 | 2013 | 2017 |
| Procrit/ Epogen | Herceptin | Rituxan | Avastin | Enbrel | Remicade | Avonex | Rebif | Neupogen | Pegasys | |
|---|---|---|---|---|---|---|---|---|---|---|
| Data Exclusivity Period | 12 | 12 | 12 | 12 | 12 | 12 | 12 | 12 | 12 | 12 |
| Year of Data Exclusivity Expiry | 2002 | 2010 | 2009 | 2016 | 2010 | 2010 | 2008 | 2014 | 2003 | 2014 |
⇓
| Procrit/ Epogen | Herceptin | Rituxan | Avastin | Enbrel | Remicade | Avonex | Rebif | Neupogen | Pegasys | |
|---|---|---|---|---|---|---|---|---|---|---|
| Market first open to FoPP entry | 2013 | 2015 | 2015 | 2017 | 2012 | 2014 | 2013 | 2014 | 2013 | 2017 |
Our approach draws from and adapts experience gained from the small molecule market. Following the opening of the market to competition, the initial number of FoPP entrants is estimated using Equation 1; derived following Grabowski et al. (2007) and Anderson, Palma and Thisse (1992). The starting point is the entry equation described by Grabowski et al. (2007), which is then adjusted to account for the need for the entry elasticity for FoPPs to reflect that FoPPs are likely to be more differentiated than small-molecule generics and that price-cost margins for biologic drugs are likely to differ from those of small-molecule drugs. In addition, the functional form of the entry equation is changed to prevent the prediction of negative entrants. The derivation of Equation 1 is detailed in Appendix A, Memo on Entry Modeling.
The estimation of the number of FoPP entrants proceeds in two steps. First, we estimate the number of generic entrants expected to enter a standard small molecule market equivalent in size to the biologic market of interest as measured by market revenue (the first term on the RHS of Equation 1). This number is then adjusted for differences between the markets for biologic drugs and small molecules, particularly higher price-cost margins and higher fixed costs of entry.
Equation 1
NFoPP = NSM (PCMFoPP / PCMSM * FCFoPP / FCSM)η
Where:
Description
Outcome:
NFoPP number of FoPP entrants into biologic market in first year market open
Inputs:
NSM number of entrants into small molecule market of equivalent size (in revenue)
PCMFoPP / PCMSM relative price-cost margin for FoPP drug versus originator biologic
FCFoPP / FCSM relative fixed costs of entry for FoPP
η elasticity of market entry w.r.t. fixed costs of entry, price-cost margins, and market revenue
Parameter Inputs:
NSM : number of entrants into small molecule market of equivalent size (in revenue)
estimation based on first stage equation from Grabowski (2007) study predicting number of entrants
into equivalent small molecule market:Equation 2
NSM = exp [0.07 + (0.36) *1n (MktSze) ]
MktSze : Projected US market in year in which market opens to entry (YOFE), measured by revenue in US$2000 (Table F-5).
- 2007 US market revenue from company annual reports
- Predicted growth in US market revenue from market research
- Projections of average growth in market revenue (sales) over period 2007-2012
Market Revenue of Branded Drug (US$mn) Procrit/ Epogen Herceptin Rituxan Avastin Enbrel Remicade Avonex Rebif Neupogen Pegasys Mkt Revenue (US$mn) , 2007 $4,179 $1,506 $2,787 $2,695 $3,052 $2,534 $1,090 $625 $861 $388 Avg. YOY Change in Rev. 0.5% 5.0% 9.0% 19.0% 10.0% 8.0% 6.6% 18.0% 1.7% -7.0% Avg. YOY Change in Price -1.3% 3.7% 4.8% 0.2% 4.7% 1.3% 10.9% 10.9% 3.6% -3.5% Avg. YOY Change in Util. 1.8% 1.3% 4.0% 18.7% 5.1% 6.6% -3.9% 6.4% -1.8% -3.6% YOY=year on year (annual change)
Projected Mkt Revenue , 2009 $4,221 $1,660 $3,311 $3,816 $3,693 $2,956 $1,239 $870 $891 $336 Projected Mkt Revenue in YOFE $4,306 $2,225 $5,553 $15,347 $4,915 $4,343 $1,599 $1,991 $953 $188 PCMFoPP/ PCMSM : Relative price-cost margin (average mark-up) estimated from:
percentage gross margisn = (sales — cost of sales)/salesDefault value of 1.13 from:
- PCMFoPP = 0.87 from representative major biologic manufacturer
Table 2. Calibrations of Relative Fixed Costs of Entry between Biologic and Small-Molecule Markets
Pair of Calibrated Relative FC valuesProcrit/Epogen Neupogen Scenario 1: EU Market >8 >6.5 Scenario 2: Global Market >12.3 >10.8 Mid-Point >10.2 >8.7 As the relevant entry decision probably lies somewhere between these two hypothesized extremes, we use
the mid-point of the range in FC estimates (10.2 for EPOs, and 8.7 for Neupogen) in base-case analyses.
These analyses are subject to extensive sensitivity analyses which are discussed in Section 6.1.2.Estimates of the relative FC of entry parameter for the remaining biologic product markets are calculated,
relative to the EPO value of 10.2, by linking differences in the complexity of molecule structure to likely
differences in regulatory requirements for clinical evidence (Table F-6). These are based in part on the following
EMEA guidance and estimates of the cost of clinical trials in this population of $25,000 per patient, as follows:
- For somatropins: one "adequately powered, randomised, parallel group clinical trial"; 12-months immunogenicity data
Clinical Requirement Number of Patients Approximate cost Low 150 $3.75mn Medium 300 $7.5mn High 600 $15mn Very High 900 $22.5mn Erythropoietins are regarded as having "medium" regulatory requirements. These differences in expected clinical trial costs
are combined with an estimate of the cost of entering the small-molecule market of $2.5mn to estimate the relative FC of
entry for products with a Low, High and V. High regulatory requirement. The resulting estimates of relative FC range
between 8.7 and 16.2 (Table F-7).
Table F-6: Categories of Likely Regulatory Clinical Requirements
Clinical trial costs 1= Low 2= Medium 3= High 4= V. High
Clinical Trial Costs Procrit/ Epogen Herceptin Rituxan Avastin Enbrel Remicade Avonex Rebif Neupogen Pegasys 1=Low
2=Medium
3=High
4=V. High2 4 4 4 3 4 1 1 1 3
Table F-7: Base-case Estimate of Relative Ratio of Fixed Cost of Entry for Follow-on Producers into Biologic versus Small Molecule Market[138]
Estimated relative fixed costs of market entry Procrit/ Epogen Herceptin Rituxan Avastin Enbrel Remicade Avonex Rebif Neupogen Pegasys Relative FC of entry:
Biologic/Small Mol.10.20 16.20 16.20 16.20 13.20 16.20 8.70 8.70 8.70 13.20 Parameter Inputs:
η : Elasticity of entry for biologic market w.r.t. innovator market size, innovator PCM, and innovator FC (see Appendix A):
Equation 3
η = 1/1+ γ + δ ≈ 0.79
Where:
γ: entry elasticity of PCM
δ: entry elasticity of revenue
γ : Entry elasticity of PCM; calculated as:
γ = entry elasticity of price * price elasticity of PCM
γ = {0.36} * {(1-0.87)/0.87} = 0.054
- In Grabowski (2007), entry elasticity of price is ~0.72; we discount this by half to account for greater differentiation in FoPP market, i.e., to 0.36
- Price elasticity of PCM = (1-PCM)/(PCM); PCM in biologic market assumed to be 0.87; based on financial reports of pharmaceutical companies that specialize in biologic
δ : entry elasticity of revenue; calculated as:
δ =the entry elasticity of price * the price elasticity of revenue
δ = 0.36 * 0.6 = 0.216
- Entry elasticity of price assumed to be 0.36
- Price elasticity of revenue = 1 — price elasticity of demand; from literature, price elasticity of demand assumed to be 0.4Under these assumptions, our estimates of initial FoPP entrants range between 0 and 2 entrants for the markets under consideration (Table F-8). The model predicts zero entrants for Pegasys®, primarily because this market is forecast to decline in size. Currently, only one entrant is estimated for Herceptin® as well, although the key factor here is the complexity of the molecule and correspondingly high fixed cost of entry. In contrast, the model predicts two entrants into each of the interferon alpha markets, which is one more than the EU experience of a single application for FOPP entry into the interferon market; this was Alpheon (BioPartners), which referenced Roche's Roferon-A, which subsequently received a negative opinion from the Committee on Medicinal Products for Human Use.
Table F-8: Base-case Estimate of Number of FoPP Entrants
Procrit/Epogen Herceptin Rituxan Avastin Enbrel Remicade Avonex Rebif Neupogen Pegasys Year of first entry (YOFE) 2013 2015 2015 2017 2012 2014 2013 2014 2013 2017 Market rev. ($mn), YOFE $4,306 $2,225 $5,553 $15,347 $4,915 $4,343 $1,599 $1,991 $953 $188 Relative Fixed Costs of Entry 10.20 16.20 16.20 16.20 13.20 16.20 8.70 8.70 8.70 13.20 Elasticity of market entry 0.79 0.79 0.79 0.79 0.79 0.79 0.79 0.79 0.79 0.79
Procrit/Epogen Herceptin Rituxan Avastin Enbrel Remicade Avonex Rebif Neupogen Pegasys Predicted # entrants, YOFE 3 1 2 3 2 2 2 2 2 0 b. 2 Base-case Estimates Brand and FoPP Prices, Pre- and Post- FoPP Entry
Price calculations are based on defined daily doses as described in Figure 9. Base-case estimates of price discounts are a function of the estimated number of FoPP entrants and range between 12% and 20% for the markets with a positive number
Table F-9: Defined Daily Doses
Procrit/Epogen Herceptin Rituxan Avastin Enbrel Remicade Avonex Rebif Neupogen Pegasys 1000 units 20.8mg 71.4mg 25mg 7mg 3.75mg 4.3mcg 4.3mcg 0.35mg 26 mcg 'World without' Parameter Inputs
PbrandWWO : Price of the branded drug/daily dose in absence of FoPP entrants (Table F-10)
- Derived from average sales price (ASP) data reported by CMS in the January 2008 "Payment Allowance Limits for Medicare Part B Drugs" series.
- Prices for public payers set to ASP+6%, consistent with Medicare payment allowances
- Prices for private payers set to ASP
InflbrandWWO : Inflation rate of the branded drug/ daily dose in absence of FoPP entrants (Table F-10)
- Estimate based on 3-year CAGR from ASP+6% reimbursement data published by CMS in the January 2008 "Payment Allowance Limits for Medicare Part B Drugs" series.
- Inflation rate assumed to remain constant over duration of the mode
Procrit/Epogen Herceptin Rituxan Avastin Enbrel Remicade Avonex Rebif Neupogen Pegasys 1000 units 20.8mg 71.4mg 7mg 3.75mg 4.3mcg 4.3mcg 0.35mg 26 mcg
Brand Price ($/daily dose) Prior to FoPP Entry Procrit/Epogen Herceptin Rituxan Avastin Enbrel Remicade Avonex Rebif Neupogen Pegasys Brand price inflation -1.29% 3.66% 4.79% 0.22% 4.66% 1.31% 10.92% 10.92% 3.61% -3.50% 2007 ($/DDs) - ASP $ 8.45 $ 115.81 $ 342.76 $ 135.52 $ 44.58 $ 19.53 $ 45.10 $ 45.10 $ 210.08 $ 58.39 2009 ($/DDs) - ASP $ 8.24 $ 124.44 $ 376.41 $ 136.13 $ 48.83 $ 20.04 $ 55.49 $ 55.49 $ 225.52 $ 54.37 2019 ($/DDs) - ASP $ 7.23 $ 178.23 $ 601.16 $ 139.21 $ 77.04 $ 22.83 $ 156.38 $ 156.38 $ 321.57 $ 38.08 'World with' Parameter Inputs
InflbrandWW : Inflation rate of the branded drug/daily dose in presence of FoPP entrants (Table F-11)
- Brand price assumed to continue to rise after FoPP entry, albeit at a slower rate
- InflbrandWW = 0.95 * InflbrandWWO; based on Bhattacharya and Vogt (2003)
- The rate of brand price inflation changes post-FoPP entry is not dependent on the number of FoPP competitor
Table F-11: Price of Brand Drug, in Presence of FoPP entrants Procrit/Epogen Herceptin Rituxan Avastin Enbrel Remicade Avonex Rebif Neupogen Pegasys Brand inflation rate beforeFoPP entry -1.29% 3.66% 4.79% 0.22% 4.66% 1.31% 10.92% 10.92% 3.61% -3.50% Brand inflation rate after FoPP entry -1.36% 3.47% 4.55% 0.21% 4.43% 1.25% 10.37% 10.37% 3.43% -3.68% PFoPPWW: Discount associated with price of the FoPP/daily dose (Table F-12)
- Estimated as discount on PbrandWWO
- FoPP discount based on estimates from Reiffen and Ward (RW), 2005
Table 4: Estimates of FoPP
Based on estimates from Reiffen and Ward (2005)No.
FoPP entrantsRW estimates of generic discount
1 12% 2 19% 3 20% 4 22% 5 24% 6 26% 7 28% 8 28% 9 28% 10 31% 11+ 37%
Table F-12: Base-case Discounts Associated with FoPP Entry
FoPP Price Discount (%)Procrit/Epogen Herceptin Rituxan Avastin Enbrel Remicade Avonex Rebif Neupogen Pegasys 2009 0% 0% 0% 0% 0% 0% 0% 0% 0% 0% 2010 0% 0% 0% 0% 0% 0% 0% 0% 0% 0% 2011 0% 0% 0% 0% 0% 0% 0% 0% 0% 0% 2012 0% 0% 0% 0% 19% 0% 0% 0% 0% 0% 2013 20% 0% 0% 0% 19% 0% 19% 0% 19% 0% 2014 20% 0% 0% 0% 19% 19% 19% 19% 19% 0% 2015 20% 12% 19% 0% 19% 19% 19% 19% 19% 0% 2016 20% 12% 19% 0% 19% 19% 19% 19% 19% 0% 2017 20% 12% 19% 20% 19% 19% 19% 19% 19% 0% 2018 20% 12% 19% 20% 19% 19% 19% 19% 19% 0% 2019 20% 12% 19% 20% 19% 19% 19% 19% 19% 0% c. Base-case Estimates of Market Shares for FoPP Drugs
By definition, market shares of FoPP entrants prior to entry are zero. Base-case estimates of the cumulative market share for FoPP products in each market after entry range from 10% to 54% (Table F-13). Estimates are based on the OLS specification reported in Saha et al. (2005), and are a function of the FoPP price discount, number of FoPP entrants, market size, and level of HMO coverage (Table F-13):
Equation 4:
ln (MktShrFoPP/ MktShrbrand)= 0.998 - 2.4965 * (PriceFoPP/Pricebrand) + 0.705 * NFoPP
-0.0002 * MktSze - 0.3975 * BigMkt + 1.979 * HMOCovWhere:
MktShrFoPP/ MktShrbrand: Market share of FoPP entrants (cumulative) relative to the brand
PriceFoPP/Pricebrand: Ratio of FoPP price to brand price
NFoPP: Number of FoPP entrants
MktSze: Market size in year that market opens to entry (US$2000)
HMOCov: Average HMO share of payers; estimated as 21% of private payers and 12% of public payers
Table F-13: Base-case Estimates of FoPP Market Share
US market shares of FoPPs (%)Procrit/Epogen Herceptin Rituxan Avastin Enbrel Remicade Avonex Rebif Neupogen Pegasys 2009 0% 0% 0% 0% 0% 0% 0% 0% 0% 0% 2010 0% 0% 0% 0% 0% 0% 0% 0% 0% 0% 2011 0% 0% 0% 0% 0% 0% 0% 0% 0% 0% 2012 0% 0% 0% 0% 28% 0% 0% 0% 0% 0 2013 35% 0% 0% 0% 28% 0% 48% 0% 54% 0% 2014 35% 0% 0% 0% 28% 32% 48% 45% 54% 0% 2015 35% 32% 27% 0% 28% 32% 48% 45% 54% 0% 2016 35% 32% 27% 0% 28% 32% 48% 45% 54% 0% 2017 35% 32% 27% 10% 28% 32% 48% 45% 54% 0% 2018 35% 32% 27% 10% 28% 32% 48% 45% 54% 0% 2019 35% 32% 27% 10% 28% 32% 48% 45% 54% 0% 2. Base-case Estimates of Overall Market Size, Pre- and Post- FoPP Entry
Market size in this model is defined in millions of daily doses (Table F-14). Initial market size is estimated by dividing 2009 market revenue by the estimated 2009 Pricewght /daily dose. The default estimate of Pricewght is the weighted price across private and public payers, derived from an analysis of commercial versus Medicare and Medicaid expenditures (Table F-15).
Table F-14: Initial Market Size (millions daily doses)
Daily Doses (DDs) DefinedProcrit/ Epogen Herceptin Rituxan Avastin Enbrel Remicade Avonex Rebif Neupogen Pegasys 1000 units 20.8mg 71.4mg 25mg 7mg 3.75mg 4.3mcg 4.3mcg 0.35mg 26 mcg
Total market size (mn DDs) - US markets without FoPPsProcrit/ Epogen Herceptin Rituxan Avastin Enbrel Remicade Avonex Rebif Neupogen Pegasys 2009 Market Size 498.18 13.02 8.51 26.97 73.98 144.26 21.74 15.27 3.85 6.00 Avg. YOY Change in Util. 1.8% 1.3% 4.0% 18.7% 5.1% 6.6% -3.9% 6.4% -1.8% -3.6% a. 'World without' Parameter Inputs
Base-case estimates of increases in overall market size are calculated as the residual after projected changes in price are subtracted from projected changes in overall market revenue (Table F-16). Base-case estimates of market size do not account for entry of second-generation drugs.
Table F-16: Base-case Estimate of Market Size in Absence of FoPP Entry Procrit/ Epogen Herceptin Rituxan Avastin Enbrel Remicade Avonex Rebif Neupogen Pegasys 1000 units 20.8mg 71.4mg 25mg 7mg 3.75mg/P 4.3mcg 4.3mcg 0.35mg 26 mcg/P
Total market size (mn DDs) - US markets without FoPPsProcrit/ Epogen Herceptin Rituxan Avastin Enbrel Remicade Avonex Rebif Neupogen Pegasys 2009 Market Size 498.18 13.02 8.51 26.97 73.98 144.26 21.74 15.27 3.85 6.00 Avg. YOY Change in Util. 1.8% 1.3% 4.0% 18.7% 5.1% 6.6% -3.9% 6.4% -1.8% -3.6%
Total market size (mn DDs) -US markets without FoPPsProcrit/ Epogen Herceptin Rituxan Avastin Enbrel Remicade Avonex Rebif Neupogen Pegasys 2009 498.18 13.02 8.51 26.97 73.98 144.26 21.74 15.27 3.85 6.00 2010 507.23 13.19 8.85 32.02 77.75 153.78 20.89 16.25 3.78 5.78 2011 516.45 13.36 9.2 38.02 81.72 163.94 20.08 17.28 3.71 5.57 2012 525.84 13.53 9.57 45.14 85.88 174.76 19.29 18.39 3.64 5.37 2013 535.39 13.71 9.96 53.6 90.26 186.3 18.54 19.56 3.58 5.18 2014 545.12 13.89 10.36 63.64 94.86 198.6 17.82 20.81 3.51 4.99 2015 555.03 14.07 10.77 75.56 99.7 211.72 17.13 22.14 3.45 4.81 2016 565.12 14.25 11.2 89.71 104.78 225.7 16.46 23.55 3.38 4.63 2017 575.39 14.43 11.65 106.52 110.12 240.6 15.82 25.06 3.32 4.46 2018 585.84 14.62 12.12 126.47 115.73 256.48 15.21 26.66 3.26 4.30 2019 596.49 14.81 12.61 150.17 121.63 273.42 14.61 28.36 3.20 4.15 b. 4.2 'World with' Parameter Inputs
The model assumes that any price discounts associated with FoPP entry will bring about an increase in the overall market size due to a positive elasticity of price demand, following Equation 5. Our base-case estimates of induced demand range between 1% and 3% of overall market size.
Equation 5:
InducedDemand = λ * EffectDisc
Where:
λ: Price elasticity of demand; base-case estimate is -0.4
- Estimate based on the mid-point of the range (-0.2 , -0.6) reported in the Goldman et al. (2007) review
Table F-17: Base-case Overall Price Discount in Market in "World With FoPPs"
Weighted Price Discount in MarketYEARS Procrit/ Epogen Herceptin Rituxan Avastin Enbrel Remicade Avonex Rebif Neupogen Pegasys 2009 0.0% 0.0% 0.0% 0.0% 0.0% 0.0% 0.0% 0.0% 0.0% 0.0% 2010 0.0% 0.0% 0.0% 0.0% 0.0% 0.0% 0.0% 0.0% 0.0% 0.0% 2011 0.0% 0.0% 0.0% 0.0% 0.0% 0.0% 0.0% 0.0% 0.0% 0.0% 2012 0.0% 0.0% 0.0% 0.0% 5.4% 0.0% 0.0% 0.0% 0.0% 0.0% 2013 7.1% 0.0% 0.0% 0.0% 5.6% 0.0% 9.2% 0.0% 10.2% 0.0% 2014 7.1% 0.0% 0.0% 0.0% 5.7% 6.1% 9.5% 8.8% 10.3% 0.0% 2015 7.2% 4.0% 5.2% 0.0% 5.9% 6.2% 9.7% 9.0% 10.4% 0.0% 2016 7.2% 4.1% 5.4% 0.0% 6.1% 6.2% 10.0% 9.3% 10.4% 0.0% 2017 7.3% 4.2% 5.6% 2.1% 6.2% 6.2% 10.2% 9.6% 10.5% 0.0% 2018 7.3% 4.3% 5.7% 2.1% 6.4% 6.3% 10.5% 9.8% 10.6% 0.0% 2019 7.3% 4.4% 5.9% 2.1% 6.5% 6.3% 10.7% 10.1% 10.7% 0.0% Base-case estimates of overall market size in the presence of FoPP entry are presented in Table F-18. It is assumed that both brand and FoPP manufacturers will actively support their drugs with advertising and detailing. The implication of this assumption is that FoPP entry does not exert a negative effect on overall market size, as is sometimes the case in the small molecule market.
Table F-18: Base-case Estimates of Market Size in Presence of FoPP Entrants
Inputs for Estimation of Market Size Following FoPP EntryProcrit/ Epogen Herceptin Rituxan Avastin Enbrel Remicade Avonex Rebif Neupogen Pegasys YOFE 2013 2015 2015 2017 2012 2014 2013 2014 2013 2017 FoPP % price discount, YOFE 20% 12% 19% 20% 19% 19% 19% 19% 19% 0% FoPP market share, YOFE 35% 32% 27% 10% 28% 32% 48% 45% 54% 0% Price elasticity of demand -0.4 -0.4 -0.4 -0.4 -0.4 -0.4 -0.4 -0.4 -0.4 -0.4 ↓
Market size (mn DDs) - US markets with FoPP entry YEARS Procrit/ Epogen Herceptin Rituxan Avastin Enbrel Remicade Avonex Rebif Neupogen Pegasys 2009 498.18 13.02 8.51 26.97 73.98 144.26 21.74 15.27 3.85 6.00 2010 507.23 13.19 8.85 32.02 77.75 153.78 20.89 16.25 3.78 5.78 2011 516.45 13.36 9.20 38.02 81.72 163.94 20.08 17.28 3.71 5.57 2012 525.84 13.53 9.57 45.14 87.74 174.76 19.29 18.39 3.64 5.37 2013 550.57 13.71 9.96 53.60 92.27 186.30 19.23 19.56 3.72 5.18 2014 560.67 13.89 10.36 63.64 97.04 203.46 18.50 21.54 3.66 4.99 2015 570.95 14.29 11.00 75.56 102.05 216.93 17.80 22.94 3.59 4.81 2016 581.42 14.48 11.45 89.71 107.32 231.30 17.12 24.43 3.52 4.63 2017 592.09 14.68 11.91 107.41 112.86 246.61 16.47 26.02 3.46 4.46 2018 602.95 14.87 12.40 127.54 118.68 262.94 15.84 27.71 3.40 4.30 2019 614.01 15.07 12.91 151.43 124.81 280.35 15.24 29.51 3.34 4.15 3. Base-case Estimates of Cost-Impact
Under our default assumptions, the base-case scenario estimates cost savings from entry of FoPPs totaling approximately $10 billion dollars (Table F-19). Using the estimated distribution of private and public payers reproduced in Table F-20, $5.3 billion of this amount is estimated to accrue to private payers (not shown) and $4.6 billion is estimated to accrue to public payers (Table F-21).
Table F-19: Estimated Cost Impact of Availability of FoPPs: All Payers, 2009-2019
US Market without FoPPs
Total Cost of Originator Drug ($mn), 2009-2019 Procrit/ Epogen Herceptin Rituxan Avastin Enbrel Remicade Avonex Rebif Neupogen Pegasys Total Cost ($mn) $47,608 $23,588 $58,146 $116,032 $68,434 $49,198 $19,141 $25,024 $10,672 $2,636 US Market with FoPPs
Total Cost of Originator Drug ($mn), 2009-2019 Procrit/ Epogen Herceptin Rituxan Avastin Enbrel Remicade Avonex Rebif Neupogen Pegasys Total Cost ($mn) $37,350 $19,736 $49,574 $110,690 $53,247 $39,396 $12,754 $16,699 $7,003 $2,636
Total Cost of FoPP drugs ($mn), 2009-2019Procrit/ Epogen Herceptin Rituxan Avastin Enbrel Remicade Avonex Rebif Neupogen Pegasys Total Cost ($mn) $8,847 $3,513 $7,364 $4,634 $12,919 $8,541 $5,392 $7,037 $3,175 $0 Cost Impact of FoPPs
Cost of Drug ($mn) Procrit/ Epogen Herceptin Rituxan Avastin Enbrel Remicade Avonex Rebif Neupogen Pegasys Total Cost - US Markets $47,608 $23,588 $58,146 $116,032 $68,434 $49,198 $19,141 $25,024 $10,672 $2,636 Total Cost - US Markets $46,197 $23,249 $56,938 $115,324 $66,166 $47,937 $18,147 $23,736 $10,179 $2,636 Cost Impact of FOPPs $1,412 $340 $1,208 $707 $2,268 $1,262 $994 $1,288 $493 $0 Total Cost Impact (in US$ millions) $9,972
All Payers: Cost Impact of FOPPs ($mn) - by year YEARS Procrit/ Epogen Herceptin Rituxan Avastin Enbrel Remicade Avonex Rebif Neupogen Pegasys 2009 $0 $0 $0 $0 $0 $0 $0 $0 $0 $0 2010 $0 $0 $0 $0 $0 $0 $0 $0 $0 $0 2011 $0 $0 $0 $0 $0 $0 $0 $0 $0 $0 2012 $0 $0 $0 $0 $168 $0 $0 $0 $0 $0 2013 $193 $0 $0 $0 $193 $0 $97 $0 $63 $0 2014 $196 $0 $0 $0 $222 $167 $110 $115 $65 $0 2015 $199 $56 $183 $0 $254 $182 $124 $144 $68 $0 2016 $202 $61 $209 $0 $290 $199 $139 $180 $70 $0 2017 $205 $67 $238 $195 $332 $217 $156 $224 $73 $0 2018 $208 $74 $271 $233 $378 $237 $174 $279 $76 $0 2019 $211 $81 $308 $279 $431 $259 $194 $346 $78 $0
Table F-20: Ratio of Public to Private Payers for Selected Biologic Drugs
Distribution of Public and Private PayersProcrit/ Epogen Herceptin Rituxan Avastin Enbrel Remicade Avonex Rebif Neupogen Pegasys Public Payers 48% 41% 57% 66% 37% 37% 45% 45% 41% 48% Private Payers 52% 59% 43% 34% 63% 63% 55% 55% 59% 52% Public+private 100% 100% 100% 100% 100% 100% 100% 100% 100% 100% Table F-21: Estimated Cost Impact of Availability of FoPPs: Public Payers, 2009-2019
Coverage of Expenditures by Public Payers, 2009-2019 Procrit/ Epogen Herceptin Rituxan Avastin Enbrel Remicade Avonex Rebif Neupogen Pegasys Public Payer Coverage 48% 41% 57% 66% 37% 37% 45% 45% 41% 48% US Market without FoPPs
Total Cost of Originator Drug ($mn), 2009-2019 Procrit/Epogen Herceptin Rituxan Avastin Enbrel Remicade Avonex Rebif Neupogen Pegasys Total Cost ($mn) $23,545 $10,005 $33,970 $78,084 $26,257 $18,877 $8,890 $11,623 $4,527 $1,304 US Market with FoPPs
Total Cost of Originator Drug ($mn), 2009-2019 Procrit/Epogen Herceptin Rituxan Avastin Enbrel Remicade Avonex Rebif Neupogen Pegasys Total Cost ($mn) $18,471 $8,371 $28,962 $74,489 $20,430 $15,115 $5,924 $7,756 $2,971 $1,304
Total Cost of FoPP drugs ($mn), 2009-2019 Procrit/Epogen Herceptin Rituxan Avastin Enbrel Remicade Avonex Rebif Neupogen Pegasys Total Cost ($mn) $4,375 $1,490 $4,302 $3,119 $4,957 $3,277 $2,505 $3,268 $1,347 $0 Cost Impact of FoPPs
Cost of Drug ($mn) Procrit/ Epogen Herceptin Rituxan Avastin Enbrel Remicade Avonex Rebif Neupogen Pegasys Total Cost - US
Markets$23,545 $10,005 $33,970 $78,084 $26,257 $18,877 $8,890 $11,623 $4,527 $1,304 Total Cost - US
Markets$22,847 $9,861 $33,264 $77,608 $25,387 $18,392 $8,428 $11,024 $4,318 $1,304 Cost Impact of
FOPPs$698 $144 $706 $476 $870 $484 $462 $598 $209 $0 Total Cost Impact (in US$ millions) $4,648
Public Payers: Cost impact of FOPPs ($mn) - by year Procrit/ Epogen Herceptin Rituxan Avastin Enbrel Remicade Avonex Rebif Neupogen Pegasys 2009 $0 $0 $0 $0 $0 $0 $0 $0 $0 $0 2010 $0 $0 $0 $0 $0 $0 $0 $0 $0 $0 2011 $0 $0 $0 $0 $0 $0 $0 $0 $0 $0 2012 $0 $0 $0 $0 $64 $0 $0 $0 $0 $0 2013 $95 $0 $0 $0 $74 $0 $45 $0 $27 $0 2014 $97 $0 $0 $0 $85 $64 $51 $53 $28 $0 2015 $98 $24 $107 $0 $97 $70 $57 $67 $29 $0 2016 $100 $26 $122 $0 $111 $76 $65 $84 $30 $0 2017 $101 $29 $139 $131 $127 $83 $72 $104 $31 $0 2018 $103 $31 $158 $157 $145 $91 $81 $130 $32 $0 2019 $104 $34 $180 $188 $165 $100 $90 $161 $33 $0 6. Sensitivity Analyses
6.1 Effect of Differences in Regulatory Requirements
Given the uncertainty regarding new approval pathways for FoPPs, it is important to develop estimates of the cost impact of the availability of FoPPs that account for the effects of proposed approval pathways that have differing levels of stringency. In this model, differences in the stringency of the approval process influence estimated cost impacts through two main parameters: 1) the time to market entry of the FoPP and 2) the fixed costs of satisfying regulatory requirements. Both of these parameters are assumed to increase with the level of regulatory stringency. Regulatory stringency affects the time to market entry of FoPPs in multiple ways. Principally, the greater the level of clinical evidence required, the more time required to comply with the requirements. Also, waiting for clarifying guidance to be issued by regulatory bodies can delay FoPP entrance. We explore the effects of varying the time to initial FoPP entrance and varying fixed costs of entry below.
6.1.1 Timing of Initial Entry of FoPP Competitors
The base-case analysis assumes that the market opens to FoPP competition once the listed patent protection period expires and the data exclusivity period lapses. However, the market may open to FoPP competition more quickly or more slowly than our base-case estimates. Regulators may call for greater or lesser levels of clinical evidence to be provided in support of approval processes. Potential applicants could be required to delay pursuing market access pending issuance of formal guidance. A final legislated data exclusivity period for protein products may differ from our base-case estimate of 12 years. Entry may occur more rapidly if there is a successful challenge to the patent (outside of a countervailing data exclusivity period). Finally, FoPP competition may be stalled if the first indication to open to competition is not sufficiently attractive. Thus, we explored the effect of varying the date at which the FoPP market is open to entry on our estimates of cost impact.
As is evident in Table 5, delaying projected initial entry of FoPP competitors by five years reduces our estimate of cost savings from FoPP availability by $7.9 billion, or 79%.
Table 5: Effect on Varying Time of FoPP Entry on Estimates of
Cost-Impact of FoPP Availability ($billion)Earliest Entry Latest Entry Cost Impact All Payers
2009-2019Cost Impact Private Payers
2009-2019Cost Impact Public Payers
2009-20195 years earlier 2009 2014 $17.56 $9.00 $8.56 2 years earlier 2010 2015 $13.40 $7.07 $6.33 Base case 2012 2017 $9.97 $5.32 $4.65 2 years later 2014 2019* $6.53 $3.57 $2.96 5 years later 2017 2019* $2.08 $1.20 $0.88 Five years earlier is set to 2009 as it would be unrealistic to estimate the cost impact in 2007 when there were no FoPPs.
Some markets do not open to entry during model duration.6.1.2 Variation in Fixed Costs of Entry
Our base-case analysis assumes that regulatory requirements for FoPP entrants will resemble those issued thus far by the EMEA. Thus, we classify the likely requirements for Neupogen® and the interferon betas (Avonex® and Rebif®) as "low" (150-patient trial) and the likely requirements for the EPOs as "medium" (300-patient trial). However, it may be the case that regulatory requirements are more stringent. In Table 6, we explore the effect of increasing the clinical requirements by progressively raising the minimum level of evidence required.
In the context of our model, raising the minimum requirement for clinical evidence from low to medium has a minimal effect on our base-case estimates. Requiring all entrants to meet a "very high" standard of clinical evidence has a relatively small effect on our baseline estimates of cost savings, reducing the estimate by $1.5 billion, or 15.3%.
Table 6: Effect of Increasing Clinical Requirements on Estimates of
Cost-Impact of FoPP Availability ($billions)Cost Impact All Payers
2009-2019Cost Impact Private Payers
2009-2019Cost Impact Public Payers
2009-2019Base case $9.97 $5.32 $4.65 Minimum clinical requirement> Medium: 300 pts>
$9.71> $5.18> $4.54> Minimum clinical requirement> High: 600 pts>
$8.45> $4.50> $3.94> Minimum clinical requirement> Very High: 900 pts>
$8.45> $4.50> $3.94> Our base-case estimates of the ratio of fixed costs of entry for a biologic versus small molecule market (ratios of 8.7-16.2) are calibrated to produce an estimate of FoPP entrants in the EPO market that has face validity. However, these are significantly lower than, for example, the values implied by Grabowski et al. (2007), which range as high as 100. These latter ratios would be expected if, for example, every potential entrant would require building an entirely new facility to enter the biologic market, but could rely on existing production capacity to enter the small molecule market. In Table 7, we explore the effect of varying our estimate of the ratio of fixed costs of entry for a biologic versus small molecule market (FCFoPP/ FCSM) directly. In the context of our model, as one would expect, the number of FoPP entrants is sensitive to the ratio FCFoPP/ FCSM. A ratio of 25 decreases estimated cost savings by $5 billion, or 46.9%. A ratio of 50 results in a single FoPP entrant for Avastin® and negligible cost savings. To put these figures in context, if we assume that fixed costs of entry in the small molecule generic market average $2.5 million, FCFoPP/ FCSM ratios of 25 and 50 imply FoPP fixed costs of entry of $62.5 million and $125 million respectively.
Table 7: Effect of Varying Fixed Costs of Entry for Biologic Market
versus
Small Molecule Market on Estimates of Cost-Impact of FoPP Availability ($billions)Maximum No. FoPP Entrants Cost Impact All Payers 2009-2019 Cost Impact Private Payers 2009-2019 Cost Impact Public Payers 2009-2019 Base case 3 $9.97 $5.32 $4.65 2 $5.30 $2.78 $2.51 1 $0.30 $0.10 $0.20 0 $0.00 $0.00 $0.00 6.2 Multi-year Entry of FoPPs
Our approach is based, in part, on Grabowski et al. (2007), who model the specific question "What is the equilibrium number of generic entrants in the twelve-month period after the market opens to competition (i.e., after patent expiry, and the expiry of the data exclusivity agreement)?" Similarly, our base case estimates assume that that the number of FoPP entrants in place 12 months after the market opens to competition will remain constant for the remainder of the study period.
It may be the case (as occurs in small molecule markets) that additional FoPP products would enter the market in subsequent years. Therefore, we explore the effect of allowing additional FoPP entrants after the first year in which the market opens (for products that experience a positive number of entrants). Additional entrants would enter in the second year of market opening and would, in the context of the model, exert downward pressure on the relative FoPP price, increase the FoPP market share, and increase the estimated cost savings associated with FoPP entry as shown in Table 8. Assuming even a single additional entrant in each market in the subsequent year increases our estimate of cost savings by $2.3 billion, or 22.8%.
Table 8: Effect of Allowing Additional FoPP Entry on Estimates of
Cost-Impact of FoPP Availability ($billions)Largest Discount Largest Market Share Cost Impact All Payers
2009-2019Cost Impact Private Payers
2009-2019Cost Impact Public Payers
2009-2019Base case 20% 54% $9.97 $5.32 $4.65 22% 63% $12.25 $6.56 $5.69 24% 78% $16.54 $8.91 $7.63 6.3 Interchangeability of FoPPs
The microeconomic studies of pricing and market share in the pharmaceutical industry referenced here share the assumption of homogenous generic entrants. Given the anticipated differences in the production processes, FoPPs are likely to be inherently heterogeneous. While modeling FoPP heterogeneity directly is beyond the scope of this analysis, we can probe the effects of the likely outcome of such heterogeneity. A market in which there were heterogeneous FoPP entrants would behave in a manner more characteristic of an oligopoly or imperfectly competitive market, i.e., with higher prices (smaller discounts) and smaller quantities sold, although the effects on the relative market shares of brands and FoPPs are ambiguous.
To examine the potential effects of greater heterogeneity among FoPP entrants, we re-estimate the model with smaller discounts associated with FoPP entry and assess the effect on estimates of cost impact. As shown in Table 9, decreasing the price discount that would accompany FoPP entry, as would be expected for a small number of heterogeneous products, has a fairly significant effect on our estimates of overall cost impact. A 25% reduction in the estimated FoPP discount decreases estimated cost savings by $3.2 billion, or 32%.
Table 9: Effect of Varying Estimated FoPP Price Discounts on Estimates of
Cost-Impact of FoPP Availability ($billions)Smallest* Discount Largest Discount Cost Impact All Payers
2009-2019Cost Impact Private Payers
2009-2019Cost Impact Public Payers
2009-2019Base case 12% 20% $9.97 $5.32 $4.65 9% 15% $6.78 $3.62 $3.15 7% 12% $5.26 $2.82 $2.44 *Smallest non-zero discount
6.4 Variation in FoPP Price & Market Share
There are a number of additional demand- and supply-side factors that are not modeled explicitly in our analysis that nonetheless might influence FoPP prices and FoPP market shares. Examples of such factors that might affect pricing include strategic pricing on the part of FoPP manufacturers and payers' ability to extract large price discounts. Factors that affect the demand for FoPP products include brand loyalty on the part of patients, perceived therapeutic substitutability, and the extent to which payers are able to influence physician prescribing behavior. Although modeling these factors explicitly is beyond the scope of this analysis, it is instructive to explore how variation in assumptions of FoPP price discounts and market uptake affect estimates of overall cost impact.
Previously, we explored the effect of more conservative estimates of FoPP price discounts that might be associated with a small number of heterogeneous FoPPs. Here, we explore the effect of more aggressive price discounts that would be consistent with strategic pricing behavior by FoPP manufacturers, or payers extracting large pricing concessions. In the context of the model, aggressive FoPP discounts would lead to larger FoPP market share as well as an increase in overall market size. (The model does not allow FoPP market share to rise above 85%). As Table 10 shows, more aggressive estimates of discounting behavior on the part of FoPP manufacturers has a dramatic effect on the estimate of overall cost impact. For example, assuming that all FoPPs discount heavily at 40% (a figure that is not inconsistent with the small molecule market) leads to an increase in the estimated cost impact of $35 billion.
Table 10: Effect of Increase in FoPP Discounts on Estimated Cost Impact of
Availability of FoPPs ($billions)Smallest* Discount
Largest Discount
Cost Impact All Payers
2009-2019Cost Impact Private Payers
2009-2019Cost Impact Public Payers
2009-2019Base case 12% 20% $9.97 $5.32 $4.65 25% 25% $16.15 $8.67 $7.48 40% 40% $44.20 $23.80 $20.40 *Smallest non-zero discount
Likewise, we might expect that market uptake of FoPPs would lag if patients exhibit high levels of brand loyalty, or physicians perceive the FoPPs to have low levels of therapeutic substitutability. Conversely, if payers are able to influence physician prescribing behavior or institute a tier-structure that promotes FoPP use, then market penetration might be considerably higher than our base-case estimates. Our estimates of cost impact are less sensitive to variation in market share versus variation in prices, in part because the effects of changes in price are compounded by reinforcing changes in market share. As shown in Table 11, a 25% increase in base-case FoPP market share only increases estimated cost-impact of FoPP availability by $2.3 billion, or 23%.
Table 11: Effect of Change in FoPP Market Share on Estimated Cost Impact of
Availability of FoPPs ($billions)Smallest* Market Share Largest Market Share Cost Impact
All Payers 2009-2019Cost Impact Private Payers 2009-2019 Cost Impact Public Payers 2009-2019 25% reduction in base-case FoPP market share 8% 40% $9.05 $4.84 $4.22 10% reduction in base-case FoPP market share 9% 48% $7.69 $4.11 $3.58 Base case 10% 54% $9.97 $5.32 $4.65 10% increase in base-case FoPP market share 11% 59% $10.90 $5.82 $5.08 25% increase in base-case FoPP discount 13% 67% $12.30 $6.56 $5.73 *Smallest non-zero market share
6.5 Price of Branded Biologic Drugs
Our base-case analysis assumes that the presence of FoPP competition will moderate brand price inflation by 5% (i.e., the inflation rate for branded drugs will be 95% of the pre-FoPP rate). It may be the case; however, that FoPP entry exerts stronger downward pressure on brand price inflation.
We present the results of sensitivity analyses that explore the effects of varying assumptions on the rate of price increases in branded drugs in Table 12. We would expect the increased cost savings caused by lower expenditures on branded biologics to be offset in part by increases in overall utilization driven by induced demand. Lowering our estimate of the rate of brand price inflation in the presence of FoPP competition by 50% more than doubles our estimated cost-savings to $21.42bn (increase of 115%). We also investigate the estimated cost impact if the advent of FoPP competition either halts brand price inflation altogether (0% inflation) or causes decreases in price of 1.5% per year. In this latter instance, the estimated cost impact is increased by a factor of 4 to $40.3bn.
Table 12: Effect of Change in Price Inflation for Branded Biologics ($billions) Largest Annual Inflation Rate Cost Impact All Payers
2009-2019Cost Impact Private Payers
2009-2019Cost Impact Public Payers
2009-2019Base case 10.37% $9.97 $5.32 $4.65 25% decrease in annual rate of brand price inflation
8.19% $15.11 $8.15 $6.96 50% decrease in annual rate of brand price inflation
5.46% $21.42 $11.63 $9.79 0% annual rate of brand price inflation
0% $32.38 $17.71 $14.66 -1.5% annual decrease in brand price
-1.50% $40.29 $21.92 $18.37 6.6 Second-Generation Branded Products
Our base-case analysis assumes no further entrants into the market beside the originator product and any FoPP entrants. Moreover, base-case estimates of projected increases in overall market size assume that current, short-term projections (of three-five years) will hold constant over remainder of the model.
Our attention here is not on new treatments expected to enter the market in the near term (e.g., Cimzia® and Golimumab® for rheumatoid arthritis), or relatively new competitors already on the market (e.g. Neulasta® for neutropenia). The effects of these drugs on sales and revenue of their competitors are presumably built into current market projections for the early portion of our model.
Given the model horizon of 2009-2019, it may be constructive to consider the case of entrants into the market in the medium to long term (i.e. 2013+) by products that compete with the originator and follow-on product (e.g., a second- or third-generation biologic). In such an instance, the size of the market for the originators and FoPPs would decrease, as would the long-term estimated cost impact of the FoPPs in that particular market. The effect of decreasing long-term market size is presented in Table 13. A sizeable loss in market share to a newer-generation competitor would be required to generate a significant effect on estimated cost-impact.
V. Discussion
The issue of the need to expedite competition in the biologic market is an important and challenging one. Facilitating patient access to affordable and innovative new drugs that can improve health outcomes is a worthwhile goal. Proposed approaches involve abbreviated regulatory approval pathways analogous to the 505(b)(2) or 505(j) processes for drugs regulated under the FDCA. In this analysis, we attempt to quantify the financial impact of proposals to expedite FoPP competition in major biologic drug markets.
This estimate is challenging to derive for a number of reasons, starting with the limited number of cases of follow-on products from which to draw conclusions on market behavior. The uncertainty around market response to FoPP entry is demonstrated by the variation in estimates reported in prior studies. In our analysis, we combined microeconomic models of the pharmaceutical industry with empirical data and the considered opinion of clinical experts and experts in the fields of pharmacoeconomics and pharmaceutical economics to systematically address how FoPP entry would affect pharmaceutical expenditures on major biologics.
Our base-case analysis estimates total cost savings of approximately $10 billion over the period 2009-2019, assuming entry of the first FoPP into the markets is considered no earlier than 2012. This estimate is within the range reported in previous studies. Six of the 10 biologics that we assess are not expected to be exposed to FoPP competition until 2014 or later. Of greater significance is that our estimates of the likely fixed costs of entry associated with satisfying clinical requirements similar to those required by EMEA are associated with a small number of market entrants, i.e., no more than three (in the EPO and anti-TNF markets) and zero in the case of Pegasys®. As a consequence of relatively small number of predicted entrants, our estimate of the accompanying FoPP price discount is in the range of 12–20%, with FoPP market penetration of 10-54%.
Our base-case estimates of the likely cost-impact of FoPP entry into the US market are low relative to most previous studies of this topic (CBO,[145] Express Scripts,[146] Engel & Novitt[147]) and consistent in magnitude with the findings from one study (Avalere[148]). Key differences between this study and previous ones include our structured analysis of FoPP competition on a product-specific basis and the derivation of estimated price discounts following the entry of FoPP competition that account for the significant differences between the biologic and small-molecule markets (including higher fixed costs of entry and few competitors marketing products that are likely to be perceived as heterogeneous). This approach results in smaller estimates of branded biologics expenditures exposed to competition during the study period, smaller baseline estimates of likely price discounts (10-20% vs. 10-40% for other studies), and correspondingly smaller estimates of FoPP market uptake. Moreover, we estimate a smaller price response on the part of the brand biologics to FoPP competition.
As we noted above, there is much uncertainty about the likely number of FoPP entrants, FoPP price discounts, and the market shares that would be seen after actual market entry. Therefore, we performed a series of sensitivity analyses to assess how our estimate of overall cost impact would vary under different scenarios. If, for example, we project subsequent entry of two additional FoPP entrants into each market (in some cases doubling our base-case estimate), our projected costs savings increase by roughly 66%, to $16.5 billion. Not surprisingly, our estimate of cost impact is particularly sensitive to the assumptions on FoPP price discounts, as the effect of lower prices is compounded by the phenomenon of lower FoPP prices leading to increased FoPP market share (offset somewhat by the growth in the overall market due to induced demand). If we assume that all FoPP entrants discount by 25%, our estimate of overall cost savings increases by more than 60% to $16.15 billion; assuming more aggressive discounting of 40% increases our estimate by a factor of four to $44 billion.
In the context of our model, however, the ability of regulatory authorities to affect this estimate varies. As noted earlier, we assume that increased or decreased regulatory requirements will act through two paths. The first is the timing of a market's opening to FoPP competition; the second is the cost of complying with regulatory requirements. We assume that increased regulatory rigor will delay the time to FoPP entrance, as it should, generally, require longer to generate larger amounts of clinical evidence; moreover, any requirement for FoPP manufacturers to follow published FDA guidance will introduce further delays. We explore the effect of introducing delays to FoPP entry by two and five years. Delaying projected FoPP entry in each market by two years reduces estimated cost savings by $3.4 billion, or 34%. Likewise, additional clinical requirements are more costly to implement. We explore this issue in two ways. First, we directly model the effect of requiring all FoPP entrants to meet a "very high clinical standard," which we model as running a 900-patient clinical trial; under this scenario, projected overall cost savings are reduced by $1.5 billion, or roughly 15%. As an alternate check, we also increase our estimate of the ratio of FoPP fixed costs of entry in the biologic versus small molecule market, from a range of 8.7-16.2 to 25 (assuming small molecule fixed cost of entry of $2.5 million, this is equivalent to increasing fixed costs of entry by approximately $22.5 - $40 million); this reduces project cost savings by $5 billion, or 46.9%.
Our sensitivity analyses show our estimates of cost savings to be most sensitive to assumptions about the size of FoPP price discounts and reductions in brand-price inflation following FoPP entry. If FoPP manufacturers discount conservatively, then projected cost savings will be relatively small. If, however, the opening of the market brings about highly competitive behavior on the part of either or both brand product or FoPP manufacturers, projected cost savings over the period 2009-2019 can be significant (over $40 billion).
VI. Study and data limitations
A. General Limitations
This study was completed in two phases (i.e., selection of candidates and economic analysis). While there are limitations specific to each phase, there are also limitations that applied to the entire study. As in any model, there is an inherent difficulty in predicting the future. Determining which candidate biologics manufacturers will choose to pursue with FoPPs and how many of these FoPPs will be produced for each originator drug is an imprecise evaluation subject to many factors. Unforeseen future changes (e.g., in patent extensions, additional indications covered, advances in technology) could affect the attractiveness of an originator drug and the ability of a company to create a FoPP.
Similarly, there is currently no approval pathway for FoPPs under the PHS Act. (Omnitrope® and glucagons were approved under the FDCA.) Delays in creation of an approval pathway would affect the outcome of our analysis, pushing back market entry for some of the first FoPPs by several years. Even if one of the proposed bills were approved, variations between these bills with regard to the period of market exclusivity for the first FoPP, jurisdiction for determinations of interchangeability, and the level of evidence necessary to make a ruling of biosimilarity would affect outcomes predicted by our model. Additionally, the stringency of regulations, once approved, may make it more difficult to produce FoPPs for some types of biologics compared to others. For example, the case-by-case approach of the EMEA requires different levels of evidence for different biologic products. A similar model in the US might deter manufacturers from pursuing a FoPP for biologics, requiring higher standards of evidence for biosimilarity due to the associated costs of production and clinical trials.
B. Limitations Related to the Selection of Candidates
Many of the limitations of our study are specific to the selection of candidate biologics. The lack of available and consistent information about patent expiry dates was one of the limitations to our study. Patent expiry dates, which were drawn from market research reports, public corporate documents, and other sources, are often inconsistent. This derives in part from inherent uncertainty of intellectual property law and claims, various court decisions, and business decisions.[149]
Similarly, due to the complexity of biologics, there are generally several patents protecting a manufacturer's exclusivity rights for any given drug. While the patent protecting the drug itself may expire in a given year, the formulation, technology involved in manufacturing, or cell line used to create the biologic itself may not expire until later. Patent challenges also make patent expiry a variable that is difficult to determine for this analysis. Successful patent challenges by generic manufacturers could potentially open the market to FoPPs several years ahead of the projected patent expiry, while patent extensions would delay the introduction of a FoPP. This ambiguity makes it difficult to accurately select the most likely candidates for FoPPs based on patent information.
In our discussion with experts, there was no consensus as to what the most important selection criteria for a candidate biologic should be. While some argue that the complexity of the molecule will limit the number of FoPP entrants to the market, others claim that, if the market is large enough, generic manufacturers will find a way to overcome scientific hurdles. The lack of consensus regarding the ranking of selection criteria limits our study, as we may have chosen some candidate biologics for our analysis that may have been excluded given different criteria.
C. Limitations Related to Economic Analysis
As in all analyses of this type, the validity of the final estimates relies on the validity of the underlying assumptions. It is because of the high degree of uncertainty that we performed and describe the results of several sensitivity analyses.
We highlight the key role played by several assumptions here. First, our estimates of market size beginning in 2012 are a simple linear extrapolation of market projections over the period 2008-2012. To the extent that growth potential in these markets is under- or over-estimated, our projected cost savings will also be under- or over-estimated. We explore a related matter in Section 6.5, where we model the effects of a "second-generation drug," which significantly reduces market revenue for the specified drug and associated FoPPs.
Second, as noted in earlier sections, information on patent expiry is difficult to find and not always consistent; as a result, our estimates of market opening to entry are also subject to uncertainty. Here too, we investigate the effect of assuming markets opening earlier and later than our base-case estimate.
Additionally, the first step in our model is the estimation of market entry, which depends heavily on the estimated fixed costs of entry to each market. Due to the lack of empirical data, this estimate is calibrated within the model to produce an estimated number of entrants with face validity. However, the method of calibration is also subject to uncertainty and we therefore perform multiple sensitivity analyses on the fixed cost of entry estimate and the projected number of market entrants.
Finally, our models of market entry, market pricing, and market uptake are based in part on studies performed in the small molecule market, which differs in important ways from the biologic market. Although we have attempted to adjust our estimates to account for these differences, there is still uncertainty as to their applicability. Therefore, we perform additional sensitivity analyses in which we vary each of the parameters in turn and explore the effect on the projected cost savings. Even so, these variables interact in complex ways, and single-way deterministic analyses do not fully account for these potential differences.
General Limitations
Limitations Related to the Selection of Candidates
Limitations Related to Economic Analysis
Appendix A: Memo on Entry Modeling A-1
William B. Vogt
The purpose of this memo is to provide a theoretical framework and empirical suggestions for the "Economic analysis of the availability of follow-on protein products." This document is based on the Lewin/i3 Innovus technical specifications for that analysis, on the entry framework of Bresnahan & Reiss (JPE, 1992), and on the empirical work of Grabowski, Ridley, & Schulman.
1. The Entry Model
The key equations for step 1, "world with FoPPs," are the entry equations:
∏N=S/N(PN - AVCN)d(PN) - FN (1)
The number of ÕNis greater than zero. If we ignore the fact that N must be an integer, we can write:
N ≈ S(PN - AVCN)d(PN)/ FN (2)
The number of entrants is going to be the N given by approximation 2, rounded down to the nearest integer. The notation for this equation is defined in Table 1.
Table 1: Notation for entry model
Symbol Meaning ∏N Profits of Nth entrant S Market size (in people) N Number of entrants under consideration PN Price ofr the drug of the Nth entrant AVCN Average variable cost of the Nth entrant dN Per-capita demand at price PN FN Fixed cost of entry of Nth entrant Since this is a static, one-period model, when we pass to thinking about the real world, everything must be recast in net present value (NPV) terms. Fixed costs are paid only once, but profits are earned for several periods, so we should think of the whole numerator in approximation 2 as multiplied by the necessary factor to put it in NPV terms: for an infinitely lived product with constant profits, we would multiply the numerator by 1/r, where ris the typical entrant's cost of capital.
Now, if this factor is constant across drugs, it is of no particular concern. However, if there is some reason to believe that biologic drugs will be on the market longer/shorter or that they will experience less/more entry over time by competing branded drugs, then something should be done to boost/shrink market size for the biologics.
1.1 Simple manipulation of the entry equation
Equation 2 can yield some interesting results. If we ignore price effects of entry, we can see that the "first-order" effect of a change in the fixed cost of entry is to change the number of entrants by the same percentage, δlnN/δlnFN=1 or the fixed-cost elasticity of entry is roughly one. Similarly, the average margin elasticity of entry is one and the market size elasticity of entry is one.
It can be useful to rewrite this equation in terms of revenue and price-cost margin:
∏N = (S/N) R(PN - AVCN)d(PN) - FN
∏N = (1/N) [Sd(PN)PN] [PN -AVCN/PN]- FN
∏N = (1/N) R(PN)PCM(PN) - FN
(3)
Equating profits to zero and doing a little algebra yields:
ln(N) ≈ ln Rev(PN) + ln PCM(PN) - ln FN (4)
Now, suppose then that we start with some small-molecule generic market about which we know a lot, and we consider how some biologic "generic" market is going to differ. As long as the differences in the various quantities are small (and maintaining the assumption of no price effects of entry), a reasonable approximation of the percent difference in the number of entrants (in the long run) is going to be:
∆%N ≈ ∆%Rev + ∆%PCM - ∆%FN (5)
Unfortunately, we cannot expect the differences to be small (especially regarding fixed costs), so we must write the formula properly:
Nbiologic / Nsmallmol ≈ Revbiologic / Revsmallmol PCMbiologic / PCMsmallmol Fsmallmol / Fbiologic (6)
that there is a small-molecule market with 10 generic entrants. Suppose further that we are interested in predicting the number of entrants in a biologic market (somehow similar in the view of the analyst, e.g., same disease treated). Say the biologic and small molecule markets have the data in Table 2, with revenue and price-cost margin measured pre-patent-expiry.
Table 2: Calculating relative entry levels Variable Small Molecule Biologic Ratio Revenue (SdP)
$1BB $600MM 0.6 Markup (PCM)
50% 75% 1.5 Fixed Cost (F)
$100MM $300MM 0.3 Total (multiplying) 0.3 The rows in that table correspond to the terms in Equation 6. Multiplying down the last column of the table is multiplying across that equation, and the total at the bottom is the ratio on the left-hand-side of the equation. This simple analysis would lead us to estimate that there will be 30% as many, or three biologic entrants. This framework assumes no reactions of price to entry and, therefore, no differential reactions of price to entry and, therefore, no reaction of demand to entry, etc.
1.2 Introducing price effects
To do the entry model properly requires recognizing that prices in the generic market decline with entry. We expect the prices of generic drugs to drop with entry of more generics, as demonstrated in the relevant economic literature. As price falls with entry, price-cost margins will also fall. Revenues may fall or rise, depending on the price elasticity of demand; if demand for prescription drugs is price inelastic, then revenue will fall with entry.
We can approximate the response of revenues and price-cost margins to entry with constant elasticity functional forms as follows. For revenues,
Rev(PN) = AN-δ, and, for price-cost margin, PCM(PN) = BN -γ. Since we will often know the revenue and price-cost margin for the innovator drug before generic entry, it is helpful to recast these equations relative to the innovator's revenues and price-cost margins pre-expiry, thus
Rev(PN) / Rev(P1) = N-δ and PCM(PN) / PCM(P1) = N -γ. Notice the negative signs on d and g, as these parameters measure the percent fall in revenues and price-cost margins with entry.A little algebra on equation 4 leads us to:
ln (N) ≈ ln Rev(P1) +δ ln N + ln PCM1+ γ lnN - ln FN (7)
This equation can be solved for N:
ln (N) ≈ ln Rev(P1) + ln PCM1- ln FN / 1 + γ + δ (8)
From this, we can calculate the elasticity of entry:
η = 1 / 1 + γ + δ (9)
We now need estimates of d and g, the entry elasticity of price-cost margin and the entry elasticity of revenue, respectively. The price elasticity of revenue is equal to one minus the price elasticity of demand, 1 - e. We know that the price elasticity of price-cost margin is equal to (1 -PCM)/PCM. Thus, if we know the price-cost margin, the price elasticity of demand, and the entry elasticity of price, we can calculate the elasticity of entry, h.
A reasonable estimate of the price elasticity of demand from the literature is e = 0.4.
Grabowski et al. (hereafter GRS) find that each entrant reduces prices by 9%. Since they see eight entrants on average, this corresponds to an entry elasticity of price of 0.72. However, since GRS made their estimate on small-molecule generics and since biologic generics are likely to be more differentiated than small-molecule generics, the entry elasticity of price is likely to be smaller than this.
1.3 Modifying price effects & entry elasticity for biologics
We can get an idea of how much smaller using standard models of product differentiation. The CES model of Dixit and Stiglitz has a pricing equation of:
PN = c (1 + ημ / n - 1) (10)
The logit product differentiation model has a very similar pricing equation:
PN = c + ημ / n - 1 (11)
In each case, m is a parameter controlling how differentiated the products are. It is a little easier to work with the logit model. The cross-price elasticities of demand are proportional to m in this model, as is the elasticity of price with respect to N.
So, in the logit model at least, if we think that generic biologics are only half as substitutable with one another as are generic small-molecule drugs, then we should reduce the entry elasticity of price by one-half for biologicals, to 0.36.
1.4 Putting it together
First, we calculate gand d. The entry elasticity of revenue, d, is just the entry elasticity of price, 0.36, times the price elasticity of revenue, 0.6, or 0.22. The entry elasticity of price-cost margin is just the entry elasticity of price, -0.36, times the price elasticity of price-cost margin, which is 0.43 for a price-cost margin of 70%, or 0.15. This makes the entry elasticity, h, equal to 1/(1 + 0.22 + 0.15), or 0.73.
Returning to the example of Table 2, we found that entry would be only 30% of the small-molecule-drug level for the similar biologic. That now has to be modified appropriately to deal with h < 1. The improved analysis leads us to change Equation 6 as follows:
Nbiologic / Nsmallmol = (Revbiologic / Revsmallmol PCMbiologic / PCMsmallmol Fsmallmol / Fbiologic )n (12)
To calculate the actual difference between the small-molecule and biologic examples, we need to take 30% to the 0.72 power. Since 0.30.72 = 0.42, we conclude that there will be 42% as many entrants, or about 4 instead of about 10.
2 Applying the method
The method we describe above allows us to compare the expected number of generic entrants between a small-molecule drug and a similar biologic drug, based on differences in revenue, price-cost margin, and fixed costs of entry. In practice, we apply this model to each biologic market by, first, predicting the number of drugs that would enter that market were it a small-molecule market given the market's revenue. Then, we modify that number of entrants to take account of the differences between small-molecule and biologic drugs using the formula:
Nbiologic = Nsmallmol (PCMbiologic / PCMsmallmol Fsmallmol / Fbiologic )n (13)
The revenue term is omitted since revenue was used to predict the number of small-molecule entrants.
3 Differences with Grabowski et al.
The method we describe above is different from that described by GRS in several ways.
First, we derive our estimate of hrather than estimating it. GRS estimate h using data from small-molecule drugs and then assume that this h also applies to biologic drugs. Because we believe that: (1) biologic generic drugs are likely to be more differentiated than small-molecule generics, (2) price-cost margins for biologics are likely to be different than those for small-molecule drugs, and (3) these differences lead to differences in the entry elasticity as a theoretical matter (as discussed above), it is important to adjust the entry elasticity, accordingly.
Second, we apply our estimate of the entry elasticity to the differences in fixed costs and to the differences in price-cost margins between small-molecule drugs and biologic generics. Again, as discussed above, this difference is mandated by the standard theory of entry. Just as the higher fixed costs of biologic generics discourage entry, the higher price-cost margins of biologics encourage entry, and we need to account for tradeoffs between these two forces.
Third, we apply our adjustment formula in a multiplicative form, as in Equation 13, rather than in a partially linear form, as GRS do in their equations 2 and 6. For comparison, their Equations 2 and 6 would imply that, for a small molecule and biologic differing only in fixed costs:
(Nbiologic - Nsmallmol ) / Nsmallmol = η(Fsmallmol / Fbiologic ) / Fsmallmol (14)
whereas, our formula would yield (again for drugs differing only in fixed costs):
Nbiologic = Nsmallmol (Fsmallmol / Fbiologic )n (15)
It is apparent that GRS's equations are a linear approximation to ours by noting that:
η = Nbiologic / Fbiologic Fbiologic / Nbiologic
≈ (Nbiologic - Nsmallmol) /Nsmallmol / (Fsmallmol- Fbiologic) / Fbiologic (16)
and observing that the above expression is equivalent to their formulation. There are two related problems with the GRS formulation. First, the approximation used above is derivative- based and is therefore only valid for small differences in fixed costs. Since we expect large differences in fixed costs between biologic and small-molecule drugs, this renders the approximation suspect. Second, for any proportional difference in fixed costs greater than 1/h, the GRS model predicts negative numbers of entrants. Our formulation never predicts negative numbers of entrants, although it can predict zero entrants if Nbiologic is less than one, since we always round fractional numbers of entrants down. A prediction of zero entrants can sometimes be reasonable, such as for sufficiently high difference in fixed costs; whereas a prediction of a negative number of entrants is not.
Appendix B: Overview of Top Ten Biologic Categories B-1
Table B-1: Overview of Top Ten Biologic Categories (in descending order according to annual sales)
Biologic Category 2006 Annual Sales within Category ($B)1 Growth Rate in Sales from 2005 to 20061 Indication(s) Size of Affected Population US/EU Approved FoPP(s) Estimated Influence of FoPPs 7 Market Factors Pros Cons Erythropoietins (EPO) $11.94 6.7% Anemia1 800,000 4 Yes2,6 1 Recent negative publicity regarding cardiovascular safety of EPO drugs10 Highest annual sales Large affected population EU approved FoPP Greatest estimated influence of FoPP BLA pathway Smaller growth rate in sales Concerns about cardiovascular safety in some patients Major cancer monoclonal antibodies (MAbs) $10.62 56.8% Various forms of cancer (e.g., metastatic colorectal cancer, non-Hodgkin's lymphoma, certain forms of breast cancer)1,3 Not available No 4 Recombinant MAbs are expected to be insulated from generic competition through 2018 given patent protections9,11 Second highest annual sales Largest growth rate in sales High estimated influence of FoPP BLA pathway Potential patent protection until 2018 Anti-tumor necrosis factor (anti-TNF) agents $10.28 24.8% Rheumatoid arthritis, psoriasis, and other conditions (e.g., Crohn's disease, ulcerative colitis) 1,3 Not available No Not ranked Some anti-TNFs use MAb technology and therefore will have some of the same patent issues as Mabs11 Third highest annual sales Large growth rate in sales BLA pathway Non-biologic treatments availableRelatively newer biologic category Some anti-TNFs have potential patent protection until 2018 Insulin and insulin analogs $8.97 24.4% Diabetes1 14,600,000 4 No 2 Market challenges given domination by key companies (e.g., Lilly), complexity of advanced delivery systems, and erosion of the market by insulin analogs, which are patent-protected until 20132 High annual sales Largest reported affected population Large growth rate in sales High estimated influence of FoPP Second generation and analog products have eroded the market Monopoly held by very few large companies NDA pathway Recombinant coagulation factors $4.71 17.0% Certain bleeding disorders, including hemophilia1 18,000 (hemophilia)5 No 5 Clinical trials are required for approval of each new product12 High annual sales Moderate growth rate in sales BLA pathway Clinical trials required for the approval of every product Small affected population Low estimated influence of FoPP Interferon beta $4.40 14.4% Multiple sclerosis1 340,000 4 No 3 (Interferons as a group) Patent situation for interferon beta products is regarded as complex; new dosing schedules and delivery approaches are expected to increase competition2,8 Large affected population Moderate growth rate in sales High estimated influence of FoPP BLA pathway Lower annual sales Non-biologic treatments available Granulocyte-colony stimulating factor (G-CSF) $4.36 11.4% Neutropenia; congenital or acquired (e.g., as a result of chemotherapy)1,2 Not available Yes14,15,16,17,18,19 Not ranked Longer acting form of G-CSF (Neulasta) has majority of US market share and patent is not expected to expire until 2015; first generation Neupogen has lower sales and market share2, 8 Moderate growth rate in sales BLA pathway Market erosion by second generation pegylated G-CSF Lower annual sales Human growth hormone (hGH) $2.47 6.9% Growth deficiency/ failure1 12,000 4 Yes2 1 There are no second generation hGH products2 FoPP Omnitrope already approved for use in the US No second generation products to erode the market Highest estimated influence of FoPP Small affected population Lower annual sales Small growth rate in sales NDA pathway Interferon alpha $2.26 6.9% Various conditions (e.g., chronic hepatitis B and C, renal cell carcinoma, malignant melanoma, myeloma, certain leukemias)1 Not available No 3 (Interferons as a group) One FoPP, Biopartners' Alpheon,received a negative opinion from EMEA
based on concerns over comparability with the reference product; second generation pegylated products, which are administered less frequently, have eroded the market for first generation interferon alpha2; pegylated interferon alpha products have a significant clinical advantage over non-pegylated products 13High estimated influence of FoPP BLA pathway Second smallest annual sales Shrinking growth rate in sales Smaller affected population Enzyme replacement $1.71 27.5% Various conditions (e.g., Fabry disease, Gaucher disease, Pompe disease)2 Not available No 6 None reported Large growth rate in sales BLA pathway Smallest annual sales Comprises several smaller treatment indications Small affected population
Low estimated influence of FoPPSources
1:Top 20 biologics. Barcelona, Spain: La Merie Business Intelligence, 2007. Accessed November 16, 2007. http://www.pipelinereview.com/free-downloads/Top20Biologics2006.pdf
2: The future of biosimilars: key opportunities and emerging therapies. London, UK: Reuters Business Insights, 2007
3: Various sources: About Rituxan (rituximab). Biogen Idec & Genentech, 2007. http://www.rituxan.com/lymphoma/RituxanRoleInNHL.jsp.; Remicade (infliximab) - treating your condition. Centocor, Inc., 2007.
4: http://www.remicade.com/remicade/global/treatingyourcondition.html.; All about Intron A. Schering Corporation, 2007. http://www.introna.com/introna/home.action.
5: Miller S, Houts J. Potential savings of biogenerics in the United States. Express Scripts, 2007.
6: What is hemophilia? National Heart, Lung, and Blood Institute, 2007. http://www.nhlbi.nih.gov/health/dci/Diseases/hemophilia/hemophiliawhat.html
7: Various sources: Biopartners submits MS treatment to the EMEA. Pharmaceutical Business Review, 2007. http://www.pharmaceutical-business-review.com/articlenews.asp?guid=45DB….; Teare I. Biosimilar warfare: the arrival of generic biopharmaceuticals - the Omnitrope decision. BSLR, 2005/2006. http://www.lawtext.com/pdfs/sampleArticles/Biosimilars.pdf.; Zuhn D. Three new biosimilars pass EMEA test. Patent Docs: Biotech & Pharma Patent Law and News Blog, 2007. http://www.patentdocs.net/patentdocs/2007/07/three-new-biosi.html.
8: Note: estimated influence of FoPPs for each category is based on a Reuters Business Insights survey, the findings of which are included in "The future of biosimilars" report and indicate the product groups that will most likely be affected by the introduction of FoPPs.
9: Pisani J, Bonduelle Y. Opportunities and barriers in the biosimilar market: evolution or revolution for generics companies? PricewaterhouseCoopers LLP, 2007.
10: Monoclonal antibody market growth set to outstrip small molecules. Pharmaceutical Business Review Online, 2007. http://www.pharmaceutical-business-review.com/articlefeature.asp?guid=FA5F623C-C82A-4A57-BFE8-D2C7D8648799
11: Amgen announces update to U.S. prescribing information for Aranesp ® and EPOGEN ®: New boxed warning applies to oncology and nephrology incidations for the class of approved ESAs. Thousand Oaks, CA: Amgen, 2007. Accessed January 5, 2007. http://wwwext.amgen.com/media/mediaprdetail.jsp?releaseID=972417 originally did not expire until 2018 but after a patent challenge, the US government revoked the patent. Genentech has appealed this decision and the patent remains valid and enforceable throughout the appeals process. Source: Rader RA. Biopharmaceutical products in the
12: Genentech received a patent in 2001 for Cabilly II, a combination of Cabilly and Boss technologies, and as a result, now holds the technology that nearly all companies planning to manufacture recombinant monoclonal antibodies must license. The patent for Cabilly II U.S. and European markets. BioPlan Associates, Inc., 2007 & Pollack, A. Patent held by Genentech is revoked by government. The New York Times, February 22, 2007. Accessed January 18, 2008. http://www.nytimes.com/2007/02/22/business/22patent.html?r=1&oref=slogin
13: Information ascertained from expert interview with Paul Aebersold
14: Searcy C. How advanced drug delivery technologies can help manage product life cycles throughout pharmaceutical development. Montville, NJ: Drug Delivery Technologies. Accessed January 18, 2008. http://www.drugdeliverytech.com/cgibin/articles.cgi?idArticle=206.
15: EPARs for authorised medicinal products for human use: Biograstim. London, England: European Medicines Agency, 2008. Accessed May 10, 2009 at http://www.emea.europa.eu/humandocs/Humans/EPAR/biograstim/biograstim.h… g g gyy http://www.emea.europa.eu/humandocs/Humans/EPAR/filgrastimratiopharm/filgrastimratiopharm.htm
16: EPARs for authorised medicinal products for human use: Ratiograstim. London, England: European Medicines Agency, 2008. Accessed May 10, 2009 at http://www.emea.europa.eu/humandocs/Humans/EPAR/ratiograstim/ratiograstim.htm
17: EPARs for authorised medicinal products for human use: Tevagrastim. London, England: European Medicines Agency, 2008. Accessed May 10, 2009 at http://www.emea.europa.eu/humandocs/Humans/EPAR/tevagrastim/tevagrastim…
18: EPARs for authorised medicinal products for human use: Filgrastim Hexal. London, England: European Medicines Agency, 2008. Accessed May 10, 2009 at http://www.emea.europa.eu/humandocs/Humans/EPAR/filgrastimhexal/filgrastimhexal.htm
19: EPARs for authorised medicinal products for human use: Zarzio. London, England: European Medicines Agency, 2008. Accessed May 10, 2009 at http://www.emea.europa.eu/humandocs/Humans/EPAR/zarzio/zarzio.htm
Appendix C: Specific Biologics in Six Major Categories C-1
Table C-1: Specific Biologics in Six Major Categories Drug Name Sales ($M)1 US Market Share US Patent Expiration US/EU Approved Biosimilar(s) Biosimilars approved in other countries or under development Within-category Ranking*** Pros Cons EPO Aranesp $4,121 38.8% 2 2016 4 No No 2 Largest sales Largest market share Biosimilar approved in China Later patent expiration Offers a marginal/insignificant clinical improvement over Procrit/EPOGEN Procrit/EPOGEN $3,180 (Procrit) $2,844 (EPOGEN) 29.2% (Procrit) 32% (EPOGEN) 2 2013 4 Yes 9 Yes: China 10 * 1 Large sales Large market share Biosimilar approved in EU Biosimilar approved in China Neorecormon/Epogin $1,794 Not marketed in US No N/A N/A N/A N/A MAbs Rituxan $3,912 Not available 2015 4 ** No In development: India 10 1 Largest sales in category Third overall in the top 20 biologics by sales 2006 Biosimilar in development in India Herceptin $3,175 Not available 2015 4 No In development: India 10 2 Second largest sales in category Sixth overall in the top 20 biologics by sales 2006 Biosimilar in development in India Avastin $2,395 Not available 2017 4 ** No No 3 Large sales Tenth overall in the top 20 biologics by sales 2006 No biosimilar in development Late patent expiration Anti-TNF Enbrel $4,474 Not available 2012 4 No Yes: China 11 1 Largest sales in category First overall in the top 20 biologics by sales 2006 Biosimilar already approved in China Remicade $3,764 Not available 2014 5 No No 2 Second largest sales in category 4th overall in the top 20 biologics by sales 2006 Patent expires in five years No biosimilar in development Uses MAb technology that may bepatent protected until 2018 Humira $2,044 Not available 2016 4 ** No No 3 Large sales Twelfth overall in the top 20 biologics by sales 2006 No biosimilar in development Late patent expiration Uses MAb technology that may bepatent protected until 2018 Interferon beta Avonex $1,707 39.5% 2 2013 4 No No 1 Largest sales in category Largest US market share in category Patent expires in four years Fifteenth overall in the top 20 biologics by sales 2006 No biosimilar in development Rebif $1,418 14.3% 2 2013 4 No No 2 Second largest sales in category Sixteenth overall in the top 20 biologics by sales 2006 Patent expires in four years No biosimilar in development Betaseron $1,273 14.3% 2 2007/2008 2,6,7,8 No No 3 Large sales Patent has already expired Nineteenth overall in the top 20 biologics by sales 2006 No biosimilar in development G-CSF Neulasta $2,710 51% (global) 3 2015 4 No Yes: Lithuania 10 Pending approval: marketing rights for Europe and the rest of the world with the exception of Japan and US 10 In development in the EU: Phase 1-2a study 10 2 Largest sales in category Large market share Eighth overall in the top 20 biologics by sales 2006 Biosimilar approved in Lithuania and pending approval the rest of the world except Japan and the US In phase 1-2a studies in EU Later patent expiration Offers a marginal/insignificant clinical improvement over Neupogen Neupogen $1,213 24% (global) 3 2013 4 Yes 9,13,14,15,16,17,18 In development for: Europe, South-Eastern Asia, Middle East, Asia Pacific - Phase 3 10 1 Large sales Patent expires in four years Seventeenth overall in the top 20 biologics by sales 2006 Biosimilar in phase 3 trials for EU and other parts of the world Second generation peglated product has taken large portion ofmarket share Interferon alpha Pegasys $1,186 Not available 2017 4 No Yes: China 10 In development: EU 10 1 Large sales Biosimilar product in development for EU use by Biopartners Biosimilar already developed in China by Shenzhen Kexing Biotech Significant clinical advantage over non-pegylated interferon alpha Pegylation increases safety, efficacy, and duration of effect 12 Less frequent dosing increases odds of compliance 12 Shrinking market with the decline in hepatitis A incidence Sources
1 Top 20 biologics. Barcelona, Spain: La Merie Business Intelligence, 2007. Accessed November 16, 2007. http://www.pipelinereview.com/free-downloads/Top20Biologics2006.pdf
2 Miller S, Houts J. Potential savings of biogenerics in the United States. Express Scripts, 2007
3 Pisani J, Bonduelle Y. Opportunities and barriers in the biosimilar market: evolution or revolution for generics companies? PriceWaterhouseCoopers LLP, 2007.
4 Riley S. The pharmaceutical market outlook to 2018 London, UK: Reuters Business Insights, 2008.
5 Lanthier M, Behrman R, Nardinelli C. Economic issues with follow-on protein products. Nature Reviews Drug Discovery, 2008: e-pub 25 July, 2008.
6 Schering AG: set for Betaseron buy-back boost. Pharmaceutical Business Review Online, 2006. Accessed January 4, 2008. http://www.pharmaceutical-business-review.com/articlefeature.asp?guid=754ADB1D-F6AC-4FAF-9781-B00AD97D8941.
7 Biotech feature (Issue 2): biogenerics. PipelineReview.com. Accessed January 4, 2008. http://www.pipelinereview.com/pipelinesamples/biogenericsbfm.pdf.
8 Patent Terms Extended Under 35 USC §156. Washington, DC: United States Patent and Trademark Office, 2007. Accessed January 18, 2008. http://www.uspto.gov/web/offices/pac/dapp/opla/term/156.html.
9 Zuhn D. Three new biosimilars pass EMEA test. Patent Docs: Biotech & Pharma Patent Law and News Blog, 2007. http://www.patentdocs.net/patentdocs/2007/07/three-new-biosi.html.
10 The future of biosimilars: key opportunities and emerging therapies. London, UK: Reuters Business Insights, 2007.
11 Pearson S. Biosimilars market ripe for expansion: can innovation in drug design stem the rising tide? Generic Engineering and Biotechnology News 2007;27(9). http://www.genengnews.com/articles/chitem.aspx?aid=2115&chid=4
12 Searcy C. How advanced drug delivery technologies can help manage product life cycles throughout pharmaceutical development. Montville, NJ: Drug Delivery Technologies. Accessed January 18, 2008. http://www.drugdeliverytech.com/cgibin/
articles.cgi?idArticle=206.
13: EPARs for authorised medicinal products for human use: Biograstim. London, England: European Medicines Agency, 2008. Accessed May 10, 2009 at http://www.emea.europa.eu/humandocs/Humans/EPAR/biograstim/biograstim.htm
14: EPARs for authorised medicinal products for human use: Filgrastim Ratiopharm. London, England: European Medicines Agency, 2008. Accessed May 10, 2009 at http://www.emea.europa.eu/humandocs/Humans/EPAR/filgrastimratiopharm/filgrastimratiopharm.htm
15: EPARs for authorised medicinal products for human use: Ratiograstim. London, England: European Medicines Agency, 2008. Accessed May 10, 2009 at http://www.emea.europa.eu/humandocs/Humans/EPAR/ratiograstim/ratiograstim.htm
16: EPARs for authorised medicinal products for human use: Tevagrastim. London, England: European Medicines Agency, 2008. Accessed May 10, 2009 at http://www.emea.europa.eu/humandocs/Humans/EPAR/tevagrastim/tevagrastim.htm
17: EPARs for authorised medicinal products for human use: Filgrastim Hexal. London, England: European Medicines Agency, 2008. Accessed May 10, 2009 at http://www.emea.europa.eu/humandocs/Humans/EPAR/filgrastimhexal/filgrastimhexal.htm
18: EPARs for authorised medicinal products for human use: Zarzio. London, England: European Medicines Agency, 2008. Accessed May 10, 2009 at http://www.emea.europa.eu/humandocs/Humans/EPAR/zarzio/zarzio.htm *India has a biosimilar EPO but it is unclear which brand drug it replicates **Genentech received a patent in 2001 for Cabilly II, a combination of Cabilly and Boss technologies, and as a result, now holds the technology that nearly all companies planning to manufacture recombinant monoclonal antibodies must license. The patent for Cabilly II originally did not expire until 2018 but after a patent challenge, the US government revoked the patent. Genentech has appealed this decision and the patent remains valid and enforceable throughout the appeals process. Source: Rader RA. Biopharmaceutical products in the U.S. and European markets. BioPlan Associates, Inc., 2007 & Pollack, A. Patent held by Genentech is revoked by government. The New York Times, February 22, 2007. Accessed January 18, 2008. http://www.nytimes.com/2007/02/22/business/22patent.html?r=1&oref=slogin*** Within Category Ranking denotes the likelyhood of a FoPP for aparticular product within the drug class. We use this ranking to determine the specific candidate biologics for our analysis
References
- http://www.fda.gov/CDER/GUIDANCE/2853dft.pdf.
- http://www.emea.europa.eu/htms/human/presub/q35.htm.
- http://www.espicom.com/web.nsf/structure/Brochures01/$File/biosim06bro….
- http://www.pipelinereview.com/free-downloads/Top20Biologics2006.pdf.
- http://www.patentdocs.net/patentdocs/2007/07/three-new-biosi.html.
- http://www.emea.europa.eu/pdfs/human/press/pr/47920007en.pdf.
- http://www.emea.europa.eu/humandocs/Humans/EPAR/biograstim/biograstim.h….
- http://www.emea.europa.eu/humandocs/Humans/EPAR/filgrastimratiopharm/fi….
- http://www.emea.europa.eu/humandocs/Humans/EPAR/ratiograstim/ratiograst….
- http://www.emea.europa.eu/humandocs/Humans/EPAR/tevagrastim/tevagrastim….
- http://www.emea.europa.eu/humandocs/Humans/EPAR/filgrastimhexal/filgras….
- http://www.emea.europa.eu/humandocs/Humans/EPAR/zarzio/zarzio.htm.
- http://www.govtrack.us/congress/bill.xpd?tab=summary&bill=s111-726.
- http://www.govtrack.us/congress/bill.xpd?tab=summary&bill=s110-623.
- http://www.govtrack.us/congress/bill.xpd?tab=summary&bill=h110-5629.
- http://www.govtrack.us/congress/bill.xpd?tab=summary&bill=h110-5629.
- http://www.govtrack.us/congress/bill.xpd?bill=h110-1956&tab=summary.
- http://www.govtrack.us/congress/bill.xpd?tab=summary&bill=s110-1505.
- http://www.govtrack.us/congress/bill.xpd?tab=summary&bill=s110-1695.
- http://www.mttlr.org/volfourteen/kelleher.pdf.
- http://www.baltimoresun.com/topic/chi-sun-obama-health-care-nov30,0,190….
- http://www.nytimes.com/2007/02/22/business/22patent.html?r=1&oref=slogin.
- http://www.nhlbi.nih.gov/health/dci/Diseases/hemophilia/hemophiliawhat….
- http://www.drugdeliverytech.com/cgi-bin/articles.cgi?idArticle=206.
- http://www.amgen.com/patients/prca.html.
- http://www.immunex.com/media/mediaprdetail.jsp?year=2002&releaseID=5152….
- http://www.procrit.com/procrit/shared/OBI/PI/ProcritBooklet.pdf#page=1.
- http://www.epogen.com/pdf/epogenpi.pdf.
- http://www.rituxan.com/lymphoma/RituxanRoleInNHL.jsp.
- http://www.remicade.com/remicade/global/treatingyourcondition.html.
- http://medco.mediaroom.com/index.php?s=64&cat=5; Nadeau et al. Cowen and Company Biotechnology Industry Outlook: Putting “Stock” Into Partnerships. 2008.
- http://www.bls.gov/ppi/home.htm.
- http://www.emea.europa.eu/htms/human/epar/eparintro.htm.
- http://www.emea.europa.eu/pdfs/human/biosimilar/9452805en.pdf.
- http://www.emea.europa.eu/pdfs/human/biosimilar/9452605en.pdf.
- http://www.emea.europa.eu/pdfs/human/biosimilar/10204606en.pdf.
- http://www.emea.europa.eu/pdfs/human/biosimilar/3132905en.pdf.
- http://www.kff.org/medicare/upload/7775.pdf.
- http://www.kff.org/insurance/7672/upload/76723.pdf.
- [149]Schacht 2009.