
Norah Mulvaney-Day, Brent Gibbons, and Shums Alikhan
TruvenHealth Analytics, an IBM company
February 2019
Printer Friendly Version in PDF Format (111 PDF pages)
ABSTRACT
This study assessed the impact of the Paul Wellstone and Pete Domenici Mental Health Parity and Addiction Equity Act of 2008 (MHPAEA) on the private, large group employer-sponsored insurance market. The impact of MHPAEA on mental health (MH) and substance use disorder (SUD) utilization and spending outcomes was assessed using interrupted time series regression analysis, focusing on outpatient services. In lieu of a control group, we compared MH and SUD services with non-behavioral health services. MHPAEA had significant and positive effects on any use of SUD services and the frequency of SUD services used. Increases in insurer and enrollee spending on SUD outpatient services were driven by increased utilization, and not enrollee cost sharing. When examined separately, similar effects were found for both opioid use disorder (OUD) and non-OUD SUD services, supporting the conclusion that effects can be attributed to parity and not to general trends related to the OUD crisis. Although MHPAEA had similar positive impacts on utilization of and spending on MH outpatient services, these effects were more moderate. MHPAEA led to a dramatic shift toward out-of-network spending for SUD outpatient services. In secondary analyses, we examined the impact of parity on three subgroups: individuals with serious mental illness, those with OUD, and high utilizers of behavioral health services. The effects on use and spending outcomes in these secondary analyses were consistent with overall findings. Sensitivity analyses were conducted by including only continuously contributing employers, which produced very similar results. Finally, the analyses provide evidence that the effects of parity on outpatient services were continuing up until the study end date of September 30, 2015, particularly for SUD services. [111 PDF pages]
This report was prepared under contract #HHSP223201600023I between the U.S. Department of Health and Human Services (HHS), Office of Disability, Aging and Long-Term Care Policy (DALTCP) and Truven Health Analytics. For additional information about this subject, you can visit the DALTCP home page at http://aspe.hhs.gov/office-disability-aging-and-long-term-care-policy-daltcp or contact the ASPE Project Officers, Laurel Fuller and D.E.B. Potter, at HHS/ASPE/DALTCP, Room 424E, H.H. Humphrey Building, 200 Independence Avenue, S.W., Washington, D.C. 20201; Laurel.Fuller@hhs.gov.
DISCLAIMER: The opinions and views expressed in this report are those of the authors. They do not reflect the views of the Department of Health and Human Services, the contractor or any other funding organization. This report was completed and submitted on November 30, 2017.
"ACKNOWLEDGMENTS
Truven Health Analytics, an IBM company, prepared this report under contract to the Office of the Assistant Secretary for Planning and Evaluation (ASPE), U.S. Department of Health and Human Services (HHS) (HHSP233201600023I/HHSP23337002T). The authors appreciate the guidance of D.E.B. Potter and Laurel Fuller (ASPE), Emily Jones (National Institute of Drug Abuse) and Kristin Beronio (Center for Medicaid & Medicare Services). Minya Sheng (Truven Health) contributed to the data programming and analysis. Paige Jackson and Linda Lee (Truven Health) provided editorial support. Mustafa Karakus (Truven Health) provided feedback on this report and guidance throughout the project.
The views and opinions expressed here are those of the authors and do not necessarily reflect the views, opinions, or policies of ASPE or HHS. The authors are solely responsible for any errors.
STANDARD ABSTRACT
This study assessed the impact of the Paul Wellstone and Pete Domenici Mental Health Parity and Addiction Equity Act of 2008 (MHPAEA) on the private, large group employer-sponsored insurance market. The impact of MHPAEA on mental health (MH) and substance use disorder (SUD) utilization and spending outcomes was assessed using interrupted time series regression analysis, focusing on outpatient services. In lieu of a control group, we compared MH and SUD services with non-behavioral health services. MHPAEA had significant and positive effects on any use of SUD services and the frequency of SUD services used. Increases in insurer and enrollee spending on SUD outpatient services were driven by increased utilization, and not enrollee cost sharing. When examined separately, similar effects were found for both opioid use disorder (OUD) and non-OUD SUD services, supporting the conclusion that effects can be attributed to parity and not to general trends related to the OUD crisis. Although MHPAEA had similar positive impacts on utilization of and spending on MH outpatient services, these effects were more moderate. MHPAEA led to a dramatic shift toward out-of-network spending for SUD outpatient services. In secondary analyses, we examined the impact of parity on three subgroups: individuals with serious mental illness, those with OUD, and high utilizers of behavioral health services. The effects on use and spending outcomes in these secondary analyses were consistent with overall findings. Sensitivity analyses were conducted by including only continuously contributing employers, which produced very similar results. Finally, the analyses provide evidence that the effects of parity on outpatient services were continuing up until the study end date of September 30, 2015, particularly for SUD services.
ABSTRACT
Summary: The Paul Wellstone and Pete Domenici Mental Health Parity and Addiction Equity Act of 2008 (MHPAEA) ensures that large group health plans and health insurance issuers offer comparable benefits for mental health (MH) and substance use disorder (SUD) services and medical/surgical services. This legislation builds on prior federal legislation from 1996, which extended parity to SUD services and provided a broader array of benefits, such as financial limits (e.g., unequal cost sharing), quantitative treatment limits (e.g., visit and stay limits), and processes and techniques for managing care (often called non-quantitative treatment limits). This report details an empirical investigation of the effects of MHPAEA on the large group employer-sponsored insurance market. Analyses focus on the impact of MHPAEA on access, frequency of use, and spending on outpatient behavioral health (BH) services.
Major Findings: MHPAEA had significant and positive effects on any use and frequency of SUD outpatient services and frequency of MH outpatient services. Although MHPAEA had a positive impact on average spending by insurer and enrollee, average out-of-pocket amount paid per outpatient visit by the enrollee did not increase. Hence, increases in utilization of MH and SUD outpatient services drove increases in spending due to MHPAEA, and not increased cost sharing by the enrollee. Analyses of opioid use disorder (OUD) and non-OUD SUD services supported the conclusion that effects on utilization and spending were attributable to parity and not to general trends related to the OUD crisis. In most cases, the impacts of MHPAEA were similar in direction across MH and SUD outpatient services, but the magnitude of effect was greater for SUD services. Finally, findings showed that parity resulted in a dramatic shift toward out-of-network providers for SUD outpatient services.
Purpose: This study empirically assessed the impact of the MHPAEA on the private, large group employer-sponsored insurance market. We analyzed whether MHPAEA had population-level effects on the following outcome dimensions for outpatient services: any use, frequency of use, spending, and reimbursement.
Methods: We used data from the Truven Health MarketScan® Commercial Claims and Encounters Database from January 1, 2005, through September 30, 2015. The study population consisted of enrollees younger than 65 years with continuous enrollment in employer-sponsored insurance plans. We designated January 1, 2011, as the beginning of the post-parity period (to align with the passage of the interim final rule). An interrupted time series regression framework was used to estimate the impact of parity on each outcome, with population-level summarized monthly measures of outcomes. Analysis focused on outcomes for MH and SUD outpatient services, but we also examined OUD and non-OUD SUD services and outcomes for high utilizers and vulnerable subpopulations. In lieu of a control group, results were compared with non-BH services.
EXECUTIVE SUMMARY
Background
The Paul Wellstone and Pete Domenici Mental Health Parity and Addiction Equity Act of 2008 (MHPAEA) ensures that large group health plans and health insurance issuers offer comparable benefits for mental health (MH) and substance use disorder (SUD) services and medical/surgical services. This legislation builds on the Mental Health Parity Act of 1996, which removed annual and lifetime dollar limits applied to MH coverage that were not comparable to medical and surgical benefits. MHPAEA extended parity to a broader array of benefits. With MHPAEA, large group employer-sponsored insurance plans can no longer choose to cover only some types of MH/SUD treatments if the same plan covers comparable medical/surgical treatments. Large group employer-sponsored insurance plans that cover MH and SUD services now must provide comparable coverage in six treatment categories: in-network inpatient, out-of-network inpatient, in-network outpatient, out-of-network outpatient, emergency care, and prescription drugs.
Operationally, MHPAEA requires comparability in three specific areas related to insurance coverage.
-
Financial Requirements: cost sharing (e.g., copayments and deductibles).
-
Quantitative Treatment Limits (QTLs): limits on the quantity of treatment covered (e.g., number of days or number of visits covered in a single year).
-
Non-Quantitative Treatment Limits: processes and procedures used to determine eligibility for insurance coverage (e.g., prior authorization requirements, determination of medical necessity).
The expectation is that by addressing comparability of coverage in these three areas and including SUD treatment in the parity requirements, MHPAEA potentially will affect the behavioral health (BH) delivery system in four areas: (1) access or any use of services (e.g., whether an individual enters MH/SUD treatment at all); (2) the total number of MH/SUD visits once an individual enters treatment; (3) the overall spending on MH/SUD treatment (both by the insurer and by the enrollee); and (4) the reimbursement paid to the provider (both by the insurer and by the enrollee as a function of cost sharing through deductibles, copayments, coinsurance and provider network status).
Approach to This Research
Some previous research has found that large group employer-sponsored insurance plans shifted their coverage patterns, particularly by eliminating QTLs. Although MHPAEA was passed in 2008, the implementation period has spanned a number of years, with the Final Interim Regulations becoming fully effective in January 2011. Thus, it was only recently that data became available to test the long-term impact of MHPAEA. The research presented here advances the field by: (1) examining a broader range of outcomes potentially affected by parity; (2) conducting analyses according to various analytic groups to better understand how parity affects specific groups, including stratifying the SUD group into opioid use disorder (OUD) and other SUD (non-OUD); and (3) adding more years of data to better model pre-parity and post-parity trends.
Methods
Our primary data source was the Truven Health MarketScan® Commercial Claims and Encounters (CCAE) Database. This database contains private insurance claims from approximately 150 large employers for employees, their dependents, and early retirees, which covers roughly 50 million lives per year. We examined enrollees younger than 65 years with annual continuous enrollment who were covered under large group employer-sponsored private insurance plans that included prescription drug data in their files.
We used a population-level analytic approach. First, we graphically present population-level outcomes over the study period, during which time parity was implemented. We then used a regression model to estimate the size of the parity impact and the statistical significance of the estimated impacts for each outcome.
Primary analyses focused on the impact of MHPAEA on outpatient services. We examined the impact of parity for use and spending outcomes separately for MH and SUD outpatient services. We also examined OUD and non-OUD SUD services. In secondary analyses, we examined use and spending outcomes for high utilizers and for two subpopulations--individuals with serious mental illness (SMI) and separately, individuals with OUD. Population-level monthly outpatient services outcomes were assessed over the study period from January 1, 2005, through September 30, 2015. The following outcomes were assessed:
-
Utilization outcomes:
-
Percentage of enrollees with any service use.
-
Number of services used per service user.
-
-
Financial outcomes (insurer):
-
Average insurer spending per service user (over 1-month period).
-
Average insurer reimbursement amount paid per service use (visit).
-
-
Financial outcomes (enrollee):
-
Average enrollee out-of-pocket spending per service user (over 1-month period).
-
Average enrollee out-of-pocket amount paid per service use (visit).
-
-
Other spending outcome (including insurer AND enrollee spending):
-
Ratio of total out-of-network spending to total overall spending.
-
The outpatient service category used in this report includes all services in the MarketScan CCAE outpatient file, with the exceptions of emergency department visits and laboratory and radiology tests. Thus, our outpatient service category was broad in scope and included such services as clinician office visits, intensive outpatient treatment, partial hospitalization, and outpatient residential services. We used a spending decomposition framework as a theoretical structure for interpreting results, which allowed us to explain what was driving any changes that we observed in spending at the population level.
For our regression analysis, we used a population-level interrupted time series (ITS) regression to estimate the impact of parity on each outcome, similar to methods used in other recent parity analyses.[1] We considered the pre-parity period as years 2005-2010 and the post-parity period as years 2011-2015. In each ITS regression, a linear time variable measured the overall slope of the trend line, whereas a parity pre-post indictor measured the one-time parity impact on the level of the trend line and a parity*month variable measured the impact of parity on the slope of the trend line. Additionally, we controlled for seasonality by including indicators for each month. In all spending-related outcomes, we controlled for inflation by including a quarterly measure of inflation. In lieu of a control group, results were compared with non-BH services, and sensitivity analyses were run on continuously contributing employers. We also performed tests for serial correlation on all models.
Summary of Results
Overall, findings from our primary analyses indicated that MHPAEA had a significant impact on utilization the outpatient visits for BH, particularly for SUD services.
-
MHPAEA did not have an impact on any use of MH outpatient services (the percentage of enrollees who used one or more services). However, MHPAEA did have a small but meaningful positive effect on any use of SUD outpatient services, including both OUD and other non-OUD SUD services.
-
MHPAEA had a significant positive impact on the frequency of outpatient services for both MH and SUD (average number of outpatient services used per service user). The magnitude of the impact of MHPAEA on SUD outpatient services was roughly ten times larger than the magnitude for MH outpatient services.
-
The impact of parity on SUD outpatient services continued well into year 2015, which translates to an estimated increase of more than three additional SUD outpatient monthly services per service user, over the entire post-parity period.
-
MHPAEA had a similar significant positive impact on frequency of outpatient services for both OUD and other SUD conditions, although the average number of outpatient services used per service user was slightly higher for the OUD diagnosis group than for the non-OUD diagnosis group.
Although MHPAEA had a positive and significant impact on average spending by the insurer (for both MH and SUD outpatient services) and the enrollee (for SUD outpatient services), there was little impact on enrollee cost sharing and no impact on reimbursement rates to providers.
-
MHPAEA had a significant positive impact on average monthly insurer spending on MH and SUD outpatient services (both OUD and non-OUD services). For insurer spending on MH outpatient services, the impact was moderate, but the impact on SUD outpatient services was more substantial.
-
MHPAEA had no impact on average out-of-pocket spending for MH. There was a small but non-trivial impact of MHPAEA on the average enrollee spending for SUD outpatient visits (both OUD and non-OUD services).
-
There was no statistically significant effect of parity on the average reimbursement paid per outpatient visit for SUD. There was a statistically significant impact of MHPAEA on reimbursement rate paid per MH outpatient visit, but analyses indicated that this impact was not due to MHPAEA but rather to general health care trends.
-
There was no statistically significant effect of parity on the average out-of-pocket amount paid per service by the enrollee for MH or SUD outpatient services. This result indicates that increases in spending were not due to increased cost sharing by the enrollee.
Analyses of out-of-network spending found significant and positive effects of MHPAEA on insurer and enrollee spending on SUD outpatient services.
-
For SUD outpatient services, MHPAEA had a large and significant positive impact, demonstrating a shift in spending to out-of-network outpatient services. This large and significant impact was observed for both OUD and non-OUD SUD outpatient services, indicating that this impact was not driven exclusively by the opioid crisis.
-
There was a general trend shifting spending to in-network for MH outpatient services as well as non-BH services. These findings suggest that this shift was due to general health trends and not to the impact of MHPAEA.
Analyses across analytic subgroups demonstrated different patterns in spending across the MH and SUD service categories.
-
MHPAEA had a positive and significant impact on frequency of visits for high utilizers at the 95th percentile of service use. Total spending by the insurer for both MH and SUD treatment increased. However, there was no significant impact of parity on out-of-pocket costs to the enrollee for MH outpatient visits. For high utilizers of SUD services, there was a modest increase in out-of-pocket costs following parity.
-
For those with SMI, MHPAEA had a positive impact on average insurer spending, primarily for SUD outpatient services. However, important for this group, there was no impact of MHPAEA on average out-of-pocket spending for either MH or SUD outpatient services.
-
For those with an OUD, there was a positive impact of MHPAEA on insurer spending for both MH and SUD outpatient services. There also was a substantial positive impact on out-of-pocket spending for those receiving SUD services. Interestingly, MHPAEA also had a significant, positive impact on the level of out-of-pocket spending on MH outpatient services for those with SUD.
Conclusions
MHPAEA had a positive impact on utilization of outpatient BH services at the mean. Overall, the findings demonstrate a significant impact of MHPAEA on average utilization of MH and SUD outpatient services. Because we found effects for outcomes at the mean, we can conclude that the impacts of MHPAEA on outpatient service utilization were broad in scope and evident for the average user of outpatient BH services.
The impact of MHPAEA was particularly strong for SUD outpatient services. Although the impact of MHPAEA on utilization was evident for both MH and SUD outpatient services, we observed a much larger impact on SUD services. For example, the impact of MHPAEA on the frequency of SUD outpatient services was roughly ten times larger than the impact on MH outpatient services. This impact on utilization of SUD outpatient services was not unexpected, given that MHPAEA expanded parity to include SUD services and thus some insurance companies may have added SUD coverage where previously there was none.
The impact of MHPAEA on utilization of SUD outpatient services was not due to the OUD epidemic. MHPAEA affected both OUD and other non-OUD SUD diagnosis groups in a similar way, increasing confidence that the changes observed at the point of parity implementation were due to parity and not to the OUD crisis. However, we did observe a greater magnitude of impact of MHPAEA for OUD outpatient services, suggesting that the influx of individuals with OUD diagnoses during the same time frame as parity implementation interacted to some extent.
MHPAEA was not associated with a significant change in reimbursement rates to the providers or with increased out-of-pocket costs per service for the enrollee. Although we found that MHPAEA had a positive impact on both insurer and enrollee average monthly spending on outpatient BH services, the overall impact of parity on reimbursement rates per visit and enrollee out-of-pocket spending per visit was negligible. These findings demonstrate that MHPAEA's impact on increased outpatient service utilization was the driver of the impact on spending for BH outpatient services (both for the insurer and the enrollee).
MHPAEA led to a dramatic shift to out-of-network spending for outpatient SUD services. Analyses of in-network and out-of-network spending demonstrated that these increases in the ratio of out-of-network spending to total outpatient spending for SUD outpatient services were not due primarily to the opioid epidemic. Although MHPAEA had a substantial and positive impact on spending for all SUD outpatient services, in the stratified analyses, this impact was evident primarily for non-OUD SUD services.
These analyses found no evidence that the effects of MHPAEA are leveling off over time. One methodological advantage of this study is that it extends the post-period to the third quarter of 2015, well beyond the point of other published studies in this area. Our analyses demonstrate that in the large employer-sponsored insurance market, the impact of parity, particularly on SUD outpatient services, is continuing to grow.
In sum, MHPAEA led to improved access and utilization of BH outpatient services, and increases in spending were driven primarily by overall increases utilization of outpatient services. Although spending for SUD services increased, it is important to note that use of SUD services is a small fraction of overall BH service use and is unlikely to have an impact on overall health care spending. Further analyses of the dramatic shift toward out-of-network outpatient SUD services is necessary. Future research should investigate the reasons for this shift and the implication that SUD provider networks may be inadequate. More research also is needed on the additional burden of the out-of-pocket spending for those with OUD, attributed to the increased outpatient service use that parity has facilitated. Given the current OUD crisis, it is critical to assess whether this cost sharing is a barrier to receipt of SUD outpatient treatment for those with OUD.
1. INTRODUCTION
The Paul Wellstone and Pete Domenici Mental Health Parity and Addiction Equity Act of 2008 (MHPAEA) ensures that large group health plans and health insurance issuers offer comparable benefits for mental health (MH) and substance use disorder (SUD) services and medical/surgical services. This legislation builds on prior federal parity legislation from 1996 that removed annual and lifetime dollar limits applied to MH coverage that were not comparable to medical and surgical benefits. MHPAEA extended parity to a broader array of benefits, such as financial limits (e.g., unequal cost sharing), quantitative treatment limits (QTLs, such as visit and stay limits), and processes and techniques for managing care (often called non-quantitative treatment limits or NQTLs). MHPAEA also extended parity to SUD services. MHPAEA states that the financial requirements (FRs) and treatment limitations that apply to these behavioral health (BH) benefits cannot be more restrictive than the predominant requirements and limitations that apply to substantially all medical/surgical benefits.
The overall objective of this work is to assess the impact of MHPAEA on the access, utilization, spending, and reimbursement for BH services in the private large group employer-sponsored insurance market. The specific research questions that guided this investigation are listed in Table 1.
| TABLE 1. Study Outcome Dimensions and Research Questions Addressed | |
|---|---|
| Dimension | Research Question Addressed |
| Access | How did MHPAEA affect any use of different types of BH services? |
| Utilization patterns | How did MHPAEA affect frequency of use of BH services? |
| Spending | How did MHPAEA affect overall spending on BH services? |
| Reimbursement | How did MHPAEA affect reimbursement rates per unit of MH or SUD services? |
Structure of This Report
In this report, we start with an extensive background and the motivation for this study, then describe the methods and findings, and conclude with a discussion and suggestions for future research.
-
In Chapter 2, we outline the background of MHPAEA, including literature to date on changes in insurance benefits following MHPAEA and the impact of these changes on BH services. In this chapter, we also describe how our work builds on and expands previous analyses of the impact of parity.
-
In Chapter 3, we briefly describe the methods we used in our analyses. Detailed descriptions of our methods are provided in Appendix B.
-
In Chapter 4, we present our findings in detail on the impact of MHPAEA on access, utilization, spending, and reimbursement, focusing specifically on outpatient MH and SUD services. Supplemental tables with information on our findings across other types of MH and SUD services are included in Appendix E (and in supplemental files upon request). The detailed methods and results in the appendices are included for individuals who are interested in reviewing the technical components of the work in more detail.
-
In Chapter 5, we discuss the importance of these findings and suggest several areas for future research in this area.
-
For the reader's convenience, Appendix A contains definitions of the acronyms and abbreviations used in this report.
-
Appendix C, Appendix D, and Appendix F contain the diagnosis and drug codes used to define the study populations.
2. BACKGROUND
Efforts to ensure that individuals with BH conditions receive insurance benefits that are comparable to those with medical conditions have been unfolding over the course of the past two decades. Two federal parity laws have been passed that directly apply to large group health plans.
The Federal Parity Laws--1996 and 2008
In 1996, the first federal parity law was passed. This law, titled the Mental Health Parity Act, states that if a health plan included MH benefits in its coverage package, then the dollar limits on coverage for these benefits in a single year could not differ from the annual limits for medical/surgical benefits. This law also states that the lifetime limits could not be different for MH benefits compared with medical benefits.
Although the Mental Health Parity Act was an instrumental step forward in raising awareness and redressing inequities in insurance coverage for MH benefits, it was only a first step. This Act addressed only annual and lifetime limits, which still allowed insurance companies to impose other restrictions on MH coverage, such as covering only selected MH treatments or applying higher cost sharing for MH visits. Perhaps most important, this Act applied only to coverage for MH conditions and not for SUDs.
In 2008, MHPAEA was passed. This federal law greatly extended parity in coverage beyond what was included in the 1996 law. Large group insurance companies that cover MH and SUD services now must provide comparable coverage in six treatment categories: in-network inpatient, out-of-network inpatient, in-network outpatient, out-of-network outpatient, emergency care, and prescription drugs. These rules for comparability mean that insurance companies can no longer pick and choose which types of coverage to include. For example, because the 1996 law applied only to total lifetime limits in coverage, insurance plans still could refuse to cover more expensive types of inpatient MH services or limit the number of outpatient visits they would cover per year, as long as the total annual or lifetime limit for all other MH services combined was not different from the limit for medical/surgical care. With MHPAEA, large group insurers no longer can choose to cover only some types of MH/SUD treatments if comparable medical/surgical treatments are covered by the same plan. Operationally, MHPAEA requires comparability in three specific areas related to insurance coverage.
-
Financial Requirements (FRs): cost sharing (e.g., copayments and deductibles).
-
Quantitative Treatment Limits (QTLs): limits on the quantity of treatment covered (e.g., number of days or number of visits covered in a single year).
-
Non-Quantitative Treatment Limits (NQTLs): processes and procedures used to determine eligibility for insurance coverage (e.g., prior authorization requirements, determination of medical necessity).
Health plans are required by the law to consider all three of these areas, demonstrate compliance with MHPAEA, and monitor compliance over time.
Implementation of Parity
Although the two federal parity laws were passed at two discrete points in time, the actual implementation of parity occurred in a staged process. The passage of any law usually includes a period of time during which health plans and insurers can begin implementation, before being held fully accountable for specific components of its implementation.[2] Furthermore, federal laws often are replicated at the state level, typically with more extensive provisions than the federal law. Following passage of the Mental Health Parity Act, many states chose to implement expanded parity laws at the state level. Many of these state laws extended the parity provisions to include annual and lifetime limits for SUD treatment, as well as MH treatment. However, states varied widely in the extent of coverage for SUDs in these state laws. Some states such as Rhode Island, Maine, and Oregon extended parity to cover SUDs and transitioned over time from providing partial SUD parity to providing full parity.[3] Massachusetts offered full parity coverage for SUD treatment only if individuals had a co-occurring mental illness, and New Hampshire offered partial parity, which allowed for discrepancies between SUD coverage and medical/surgical coverage.
With the passage of MHPAEA, all states were held to the same standard, and parity for SUDs was included in the rule. However, this law also had a long period of development and transition during which time early adopters had ample opportunity to implement policies consistent with parity in advance of the final law.[4] The actual legislative process for MHPAEA unfolded as follows:
-
October 3, 2008--MHPAEA signed into law, effective for plan years beginning on or after October 3, 2009.
-
January 1, 2010--Date by which many insurers start their calendar plan years. Initial effective date for MHPAEA regulations.
-
February 2, 2010--U.S. Department of Health and Human Services (HHS) Interim Final Regulations issued, with binding implementation regulations, effective for plan years beginning on or after July 1, 2010.
-
January 1, 2011--Date by which many insurers start their calendar plan years. Effective date for compliance with the Interim Final Regulation in the large employer-sponsored insurance market.
-
November 13, 2013--Passage of the MHPAEA Final Regulations, effective for plan years beginning on or after July 1, 2014.
Because specific guidance was given in the Interim Final Regulations on how to calculate and document the comparison of limits and FRs, as well as detailed instructions on the requirements with respect to NQTLs, we treat January 2011 as the formal implementation date for MHPAEA. Because we expect that some companies were early adopters, we treat 2009-2010 as the interim period for implementation of MHPAEA.
What Is Already Known About the Impact of MHPAEA?
To date, a number of research studies have been conducted on the impact of MHPAEA on MH/SUD benefits and delivery of services. These studies can be separated into two types. The first type examines the actual changes in benefits and terms of coverage for MH/SUD services before and after MHPAEA was passed. The second type examines the impact these changes had on specific outcomes of the policy change on service delivery, such as shifts in use of MH/SUD services and amount of spending on these services by insurers.
Research on Changes in Benefits and Coverage
In general, most studies have found that parity laws, including MHPAEA, have a strong impact on QTLs, with most plans substantially reducing or eliminating treatment limits. Thalmayer and colleagues studied Optum large group plans and found that almost all plans dropped their annual visit or annual day limits following parity.[5] Horgan and colleagues reported that annual limits specific to BH care were virtually eliminated between 2009 and 2010 in large commercial plans.[6] Despite concerns that MHPAEA might lead plans to drop MH/SUD coverage rather than redress possible parity violations, these authors also found that the percentage of plans offering BH coverage was unchanged during this time period. In fact, approximately 80 percent of commercial health plans reported an increase in the size of their BH provider network following parity.
Parity laws also have been found to shift FRs for MH/SUDs to a level that is comparable to those for medical/surgical treatment. Horgan and colleagues found that copayments for both behavioral and general medical services increased slightly.[7] Other early analyses of group health plans governed by the Employee Retirement Income Security Act and health insurance offered through group health plans reported that most FRs that did not meet the MHPAEA standard declined significantly in 2011.[8] Despite these improvements, this report found that a substantial minority of health plans still imposed some types of financial limitations that were inconsistent with MHPAEA, particularly higher copayments and coinsurance rates for in-network outpatient services compared with comparable medical/surgical treatments. Another study found that the impact of MHPAEA on FRs for MH coverage in one large health plan was nuanced. Friedman and colleagues examined the impact of MHPAEA on cost sharing for both inpatient and outpatient services, comparing plans that offer different combinations of in-network and out-of-network benefits.[9] They found that MHPAEA was associated with overall higher intermediate care copayments but lower outpatient copayments for services provided in-network.
Documenting the impact of MHPAEA on NQTLs is more difficult, because this information usually is not publicly accessible and is by definition difficult to quantify. There is some indication that NQTLs still were being applied in a manner inconsistent with MHPAEA following implementation of the law. For example, in 2010, nearly three in ten health plans used more stringent precertification and utilization management controls for MH/SUD than for medical/surgical conditions.[10] However, Horgan and colleagues found that prior authorization requirements for specialty medical and BH outpatient services declined between 2009 and 2010, although the proportion of plans reporting strict continuing review requirements increased slightly.[11]
Shifts in Behavioral Health Service Use and Spending
The impact of the parity law on service utilization and spending is still an ongoing debate, because measuring the impact of the law on outcomes requires enough time following implementation to measure the effects. Given that pre-MHPAEA, most individuals used BH below the pre-parity limits, the impact of MHPAEA on average was expected to be minimal, with the greatest impacts seen only for the highest utilizers.[12] Initial evaluations of the impact of MHPAEA on commercial insurance coverage provide evidence of progress implementing parity, including an increase in utilization of BH services as well as an expansion of coverage.[13, 14] One study reported that the parity law was associated with 4.6 additional MH or functional therapy visits for children with autism spectrum disorder.[15] Busch and colleagues found that as a result of parity out-of-pocket costs declined by a significant dollar amount for bipolar disorder, adjustment disorder, and major depression diagnosis.[16] In another study, Busch and colleagues found that MHPAEA had little impact on SUD utilization but a minor impact on SUD treatment spending with an increase of $9.99 per health plan enrollee.[17] Given that the MHPAEA Interim Rule was only effective for many plans starting in 2011, it is only recently that we have had enough years of information post-parity to fully assess the impact of MHPAEA on long-term outcomes in the large employer-sponsored insurance market.
Parity and Substance Use Disorder Treatment
Given that the 2008 parity law expands parity to include SUD treatment--in contrast to the original 1996 law, which applied only to MH conditions--it is important to examine the impact of parity separately for MH and SUD. There are many ways that a lack of parity in insurance coverage for SUD treatment could affect individuals in need of treatment.[18] Even when QTLs and FRs are fully addressed, lack of parity in NQTLs may be a particular concern for those with an SUD. For example, prior authorization requirements can add a barrier for patients in SUD treatment that can be especially detrimental for individuals in early stages of recovery who require immediate engagement in treatment to avoid risk of relapse. So-called fail first policies require that beneficiaries try certain types of (often less costly) treatment and demonstrate that it does not work, before being approved for another type of treatment. These policies interfere with a comprehensive approach to BH treatment in which, for example, psychosocial and medical treatments combined may be necessary to support recovery. Treatment plan requirements also can be a hindrance to patients trying to receive care, especially when it is required that treatment plans be fully in place before addiction treatment is started. By extending parity to SUDs and ensuring that NQTLs are included explicitly in the comparability requirements for parity, MHPAEA has the opportunity to greatly affect coverage of SUD treatment.
One challenge in understanding the impact of MHPAEA on SUD treatment is that the timeline for the opioid crisis roughly corresponds to the timeline for MHPAEA implementation. Little research has been done to understand the impact of MHPAEA on utilization of and spending on specific types of SUD treatment at a national level. A 2013 American Society of Addiction Medicine (ASAM) report on medication-assisted treatment (MAT) and parity suggested that some insurance plans still had policies in place that violated MHPAEA regulations. Here, the Treatment Research Institute surveyed insurance plans in the ten largest states. The authors found that restrictions such as prior authorization, quantity limitations, step therapy, duration limits, and network requirements were limiting access to medications for those particular individuals.[19, 20] However, one unpublished pilot study analyzed the total number of buprenorphine prescriptions from 2010 to 2014, comparing the states that did not have prior parity laws compared with states that did as a control.[21] States that did not have prior parity laws had a noticeable increase in the number of prescriptions compared with the control states, suggesting that MHPAEA implementation could have expanded MAT access.
Parity and In-Network Versus Out-of-Network Treatment
Another advance of the 2008 parity law was to require insurers to apply parity regulations to out-of-network outpatient visits and inpatient visits. Without explicitly requiring that out-of-network MH and SUD benefits were comparable to out-of-network medical/surgical benefits, there were concerns that insurance companies could create so-called "phantom networks" that would not be subject to parity protections.[22, 23] A study by Kyanko and colleagues indicated that out-of-network provider use is more likely in MH care compared with general health care providers, with approximately 18 percent of individuals having contact with at least one out-of-network MH provider.[24]
Research on the impact of parity on in-network and out-of-network service utilization and spending has found opposite effects for MH and SUD services. McGinty and colleagues used claims from large self-insured employers to assess the impact of MHPAEA on both in-network and out-of-network services for SUD services and found that the parity law was associated with an 8.7 percent increase in out-of-network inpatient SUD services use and a 4.3 percent increase in the use of outpatient SUD services compared with what would have been expected without parity.[25] Other studies have found that MHPAEA increased the average total spending on out-of-network SUD services and the average number of out-of-network SUD visits.[26] However, Busch and colleagues recently examined trends from 2007 to 2012 and found that, although parity was associated with a one-time increase in number of visits per month and total spending per month among out-of-network MH service users in 2010, this trend attenuated in 2011-2012.[27] These authors concluded that overall MHPAEA led to a contraction in out-of-network MH service utilization. The reasons for this opposite directionality of effects across in-network and out-of-network treatment for MH and SUD is not immediately clear. It is important to track these trends over more years and to examine whether the opioid crisis was a driver of SUD out-of-network spending, independent of parity impacts. We examine both of these issues in this study.
Expanding Previous Understanding About the Impact of Parity
Research on the actual outcomes of MHPAEA is limited. Although we know that many health plans have shifted their coverage patterns, particularly eliminating QTLs, only recently has there been enough time following the law's implementation to look at longer-term impacts of these changes on actual service delivery and spending. This work advances the field by: (1) examining a broad range of outcomes potentially impacted by parity; (2) highlighting the impact of parity on particular population groups; and (3) incorporating several methodological advances.
-
Outcomes of Parity. We consider a broad set of outcome variables to comprehensively assess the impact of parity on outpatient insurer spending, any use (access), frequency of use (utilization), and costs for MH and SUD; enrollee out-of-pocket spending and costs for outpatient MH and SUD treatment; and outpatient out-of-network utilization and spending for MH and SUD.
-
Population Groups. We stratify analyses according to specific population subgroups to better understand how parity affects individuals with an MH condition versus an SUD, including stratifying the SUD group into opioid use disorder (OUD) and non-OUD disorders, examining the population of high BH service utilizers (upper 95 percentile), and examining outcomes for those with a serious mental illness (SMI) or OUD diagnosis.
-
Methodological Advances. We incorporate a number of methodological advances including adding more years of data both pre-parity and post-parity in order to observe the long-term trends and analyzing a transition period from 2009 to 2010 to better assess changes over the course of the parity implementation process.
Taken together, the analyses reported here allowed us to test our hypotheses that parity will increase outpatient service utilization and spending, both at the average and for those with greater BH needs who are more likely to be affected by the elimination of quantitative limits. In addition, to the degree that MHPAEA increased coinsurance rates, lowered out-of-pocket payments, or improved coverage in other ways (e.g., network adequacy), we also hypothesized an impact on access and reimbursement levels. Our time series design using many years of data allowed us to make causal implications that our findings are attributed to the parity law. This design increased our confidence that our findings are not the result of outside trends (e.g., general changes in the health care environment unrelated to MHPAEA). In particular, we examine separately the outcomes related to OUDs and to other non-opioid-related SUDs (e.g., alcohol use disorder). By doing so, we address concerns that impacts on SUD outcomes may be related to the opioid epidemic, given that the opioid epidemic is associated with increases in the overall demand for OUD treatment during a similar time frame as the implementation of parity.
3. METHODS
Study Period
Our period of study was from January 2005 through September 2015. We selected these years to have an adequate number of pre-parity and post-parity months for analysis.[28] Within the full study period, we defined three separate time periods to assess the impact of MHPAEA based on the timeline of MHPAEA's implementation:
-
Pre-Period: January 2005-December 2008. This period approximately corresponds to the time frame before MHPAEA was signed into law. MHPAEA was signed into law on October 3, 2008.
-
Interim Period: 2009-2010. This period corresponds to the time frame during which health plans knew that the law had been passed and were provided with the implementation standards and requirements for parity, including treatment classification categories, criteria for applying the predominant and substantially all requirements, and clarification of the requirements for NQTLs.
-
Post-Period: January 1, 2011-2015. To examine the impact of MHPAEA, we consider January 1, 2011, as the start of MHPAEA's large group commercial implementation. This is because MHPAEA's interim final rule, that was passed on February 2, 2010, required most large group employer plans to comply with the law at the start of 2011.
Our primary analyses identify the interim period (2009-2010) as part of the pre-parity period. Therefore, our primary analyses use a pre-parity period of January 2005-December 2010 and a post-parity period of January 2011-September 2015. In a separate sensitivity analysis, we include the years 2009 and 2010 as a separate interim period to test whether large group employer plans responded to the law prior to the effective compliance of the start of 2011.
Data Source
Our primary data source was the Truven Health MarketScan® Commercial Claims and Encounters Database (CCAE). The MarketScan CCAE Database contains private insurance claims from approximately 150 large employers for employees, their dependents, and early retirees. The database includes claims from roughly 50 million lives per year. Although MarketScan is a convenience sample that has fluctuated in size and contributors over time, the database has maintained the same age and sex distribution as reported by the U.S. Census Bureau for individuals with employer-sponsored insurance. To further confirm that the trends were not being influenced by changes in the sample of employers, we ran analyses on a subset of 65 employers that continuously contributed to MarketScan in the study time period.
We used four MarketScan files in our assessment of MHPAEA's impact on the employer-sponsored insurance market: (1) the inpatient file; (2) the outpatient file; (3) the outpatient drug claims file; and (4) the enrollment file. All service claims, including prescription drugs, had an enrollee identification, allowing us to link services between files and across years. We also linked monthly enrollment information to identify enrollees with continuous enrollment.
Study Population
In this study, we examined enrollees younger than 65 years with continuous enrollment who were covered under large group employer-sponsored insurance plans. We chose to include children and adults under age 65 in order to capture the full population covered by private insurance, where we could be reasonably sure that the employer-sponsored insurance was the primary source of coverage. For adults 65 and older, individuals are more likely to have Medicare as their primary insurance coverage, and hence we excluded this group. In initial analyses, we explored whether there may be differences in parity's impact on outcomes for children and adolescents, compared to adults. We produced separate annual spending trends for children and adolescents aged 0-17 years and adults aged 18-64 years. These results did not show any major differences in the trends between the two age groups. We therefore chose to focus our monthly trend and regression analysis on the full population under age 65. Table 2 is an attrition table that presents the total number of enrollees and the total number of contributing employers after each of several exclusion criteria were applied.
First, we excluded enrollees covered under any plans that were not fully insured by the employer. Second, because we were interested in having data on the complete set of health care services used by enrollees, we excluded enrollees covered under plans that did not provide prescription drug data. There were very few employer-sponsored insurance plans that did not provide prescription drug data. Third, we required continuous enrollment, meaning that enrollment data on enrollees must indicate that the enrollee was enrolled for all 12 months in each calendar year.
| TABLE 2. Attrition Table for Sample Used in Study | |||||||||||
|---|---|---|---|---|---|---|---|---|---|---|---|
| Variable | 2005 | 2006 | 2007 | 2008 | 2009 | 2010 | 2011 | 2012 | 2013 | 2014 | 2015 |
| All Individuals in Truven Health MarketScan CCAE Database (enrollees in millions) | 25.0 | 31.9 | 35.0 | 49.3 | 53.1 | 51.7 | 55.6 | 56.5 | 45.1 | 47.4 | 28.3 |
| I. Restrict to self-insured employers (enrollees in millions) | 13.6 | 14.1 | 15.0 | 18.0 | 18.3 | 19.5 | 21.2 | 22.1 | 22.5 | 20.8 | 19.6 |
| No. of employers submitting data that meet restriction | 123 | 133 | 140 | 146 | 151 | 157 | 163 | 162 | 160 | 151 | 147 |
| II. Restrict to enrollees with prescription drug data (enrollees in millions) | 13.3 | 14.1 | 15.0 | 18.0 | 18.3 | 19.5 | 21.2 | 22.0 | 22.5 | 20.8 | 19.6 |
| No. of employers submitting data that meet restrictions I and II | 122 | 132 | 139 | 146 | 151 | 157 | 163 | 162 | 160 | 151 | 147 |
| III. Restrict to individuals enrolled for at least 12 out of 12 months (enrollees in millions) | 10.2 | 10.6 | 11.3 | 13.7 | 14.2 | 15.1 | 16.6 | 17.3 | 17.5 | 15.9 | 14.8 |
| No. of employers continuously contributing across all years | 65 | 65 | 65 | 65 | 65 | 65 | 65 | 65 | 65 | 65 | 65 |
In sensitivity analyses, we explored whether results were sensitive to the inclusion of plans with capitated payments. The plan types with capitated payments include health maintenance organization plans and point of service with capitation plans. We performed this sensitivity analysis because plan types with capitated payments may have missing payment information for some claims. However, results were very stable across these sensitivity analyses, leading us to present results including plans with capitated payments. We also performed sensitivity analyses for the set of 65 employers that continuously contributed to MarketScan CCAE data during the study period. We conducted these analyses to test whether our findings varied because of plans cycling in and out of the MarketScan CCAE Database. We discuss sensitivity analyses in more detail at the end of the results section on primary outcomes and in Appendix B.
Analytic Approach
We took a population-level analytic approach in this study. First, we graphically present population-level outcomes over the study period, during which time parity was implemented. We then use a regression model to estimate the size of the parity impact and the statistical significance of the estimated impacts for each outcome.
Focus on Outpatient Services
The outpatient service category used in this report includes all services in the MarketScan CCAE Outpatient file, with the exceptions of treat-and-release emergency department visits and laboratory and radiology tests. The MarketScan CCAE Outpatient file does not include inpatient admissions or prescription drug fills, both of which are included in separate analytic files. Thus, our outpatient service category is broad in scope and by definition incorporates an array of provider types and service settings (see Appendix B for service setting details). For example, this broad service category includes both office-based physician visits and outpatient surgery in a hospital. Important to MH and SUD services, the outpatient service category also includes intensive outpatient, partial hospitalization, and outpatient residential services.
We made the decision to present outpatient service results in this report after performing an extensive preliminary assessment of impact of MHPAEA on a full set of service categories using regression analysis. Given expectations from prior literature that MHPAEA would not have a strong impact on average, and that the greatest impacts would be for high utilizers,[29] we first examined impacts at the mean for all service categories. In addition to outpatient services, the preliminary assessment included the following service categories: inpatient admissions, emergency department visits, prescription drug fills, and laboratory and radiology services. Summary results for the full set of service categories is included in Appendix E. Our preliminary assessment showed that parity impacts at the mean were, in fact, evident in the outpatient service category. Therefore, we selected the outpatient service category as the primary focus for our subsequent regression analyses presented here.
We selected a monthly time interval for outcomes in our analysis in this report because it gave us a sufficient number of data points to model the pre-parity and post-parity periods.
Specific Outcomes of Interest
Outcomes of interest were utilization outcomes and financial (i.e., spending-related) outcomes. The financial outcomes were further broken down by those related to spending by the insurer (i.e., the employer-sponsored insurance health plan) and spending by the enrollee. The following are specific outcomes of interest considered in this report:
-
Utilization outcomes:
-
Percentage of enrollees with any service use.
-
Number of services used per service user.
-
-
Financial outcomes (insurer):
-
Average insurer spending per service user (over 1-month period).
-
Average insurer reimbursement amount paid per service use (visit).
-
-
Financial outcomes (enrollee):
-
Average enrollee out-of-pocket spending per service user (over 1-month period).
-
Average enrollee out-of-pocket amount paid per service use (visit).
-
-
Other spending outcome (including insurer AND enrollee spending):
-
Ratio of total out-of-network spending to total overall spending.
-
Spending Decomposition Framework
A spending decomposition framework provides a useful theoretical structure for interpreting results. This framework is based on the understanding that health care spending for an individual in a specified period (e.g., a month) is composed of several parts. The first part is whether an enrollee uses any services in the specified period. The second part is the number of services used in the specified period. The third part is the amount paid per service.
Similarly, looking at this framework at the population level, we are able to decompose population-level spending (e.g., average insurer spending per enrollee) into its relevant parts. This type of analysis allowed us to examine what is driving any changes in spending at the population level. It separates the components of population-level spending per service user into three parts:
-
Percentage of enrollees with any service use.
-
Average number of services used per service user.
-
Average insurer reimbursement paid per service use.
For example, if we find that parity affects average insurer spending per enrollee, we can use this framework to analyze whether that impact is due to changes in the number of enrollees using any services, changes in the frequency of services used, or changes in the reimbursement amount paid by the insurer per service use.
Alternatively, the same spending decomposition framework may be used to understand changes in average enrollee out-of-pocket spending per enrollee. The only difference in the framework for out-of-pocket spending is that the out-of-pocket amount paid is considered in the analysis rather than the insurer reimbursement amount paid. We examined both insurer spending and out-of-pocket spending in this study.
Primary Results Versus Secondary Results
We separated our results into primary and secondary results. Our primary results include population-level outcomes at the average for the full population that meets our inclusion criteria. Secondary results include population outcomes at the 95th percentile, as well as average outcomes for two subpopulations, individuals with an SMI and individuals with an OUD.
In our primary results focused on average outcomes for the full population, we examined changes in outpatient services for the full set of outcomes by diagnosis group. First, we assessed parity's impact on MH and SUD utilization and spending outcomes, including non-BH services as a comparison. For each of these analyses, we also separated SUD services into those that have OUD diagnoses and those that have other SUD diagnoses (i.e., non-OUD diagnoses). For our final analysis in the primary results, we examined parity's impact on the percentage of total outpatient spending that is out-of-network.
Our first set of secondary results focused on the 95thpercentile of service utilizers. These results demonstrate parity's impact on outcomes for those who use a higher frequency of services and those who incur higher levels of spending, both for the insurer and for the enrollee. Because one of parity's requirements is to eliminate quantitative limits on services, we expected that service users with more frequent service use would be more likely to be affected following implementation of the law. We expected that elimination of quantitative service limits (e.g., the number of allowable outpatient SUD services in a calendar year) would be more likely to occur for SUD services than for MH services because the prior 1996 Mental Health Parity Act required comparable annual and lifetime limit on MH services and not SUD services.
Our second set of secondary results focus on the subpopulations of SMI and OUD. These results help us understand how parity has affected health care use and spending among two of the most vulnerable groups with MH and SUD diagnoses. For this part of the analysis, we first identified individuals in the MarketScan data who had either one inpatient admission with a primary diagnosis of the associated disorder or two outpatient visits for any listed diagnosis with the associated disorder. The set of diagnoses used to identify each subpopulation is detailed in Appendix B. After identifying the two subpopulations, we examined outpatient average service use and spending outcomes by diagnosis group, for MH, SUD, and the comparison non-BH services.
Descriptive Approach
We first present graphs that show how each population-level outcome measure changed over time between 2005 and 2015. To assess descriptively whether parity had an impact from the trend graphs, we conducted visual examinations to see whether there were changes in the trend line that corresponded with our expected timing of parity implementation. For most of our results presented in the next chapter, we used the start of 2011 as the beginning of the post-parity period and all months prior in the years 2005-2010 as the pre-parity period. In all trend graphs presented, a vertical red line demarcates where the pre-parity period ends and the post-parity period begins. We do however consider whether large employer-sponsored plans responded earlier to the parity law, prior to the 2011 effective date. In the additional analysis to assess early response to the parity law, we considered calendar years 2009 and 2010 as an interim period and calendar years 2005-2008 as the pre-parity period.
In the trend graphs, we were interested in whether there was a change in the level (up or down) of the trend line for each outcome at the start (or close to the start) of the pre-parity period. An impact on the level of the trend line indicates a one-time impact. We also were interested in whether there was a change in the slope of the trend line between the pre-parity and post-parity periods. The slope of the trend line is a measure of the change in the outcome level over time. A more horizontal trend line indicates a smaller rate of change over time, whereas a more vertical line indicates a higher rate of change over time. Parity has the potential to not only have a one-time effect on the trend level, as described above, but also affect the outcome over time. This second impact will show up in the trend graph as a difference in the slope (i.e., the change in the outcome level over time) between the pre-parity and post-parity periods. The first section of the results looks in detail at the outcome of any use of outpatient services and presents a description of how to interpret the descriptive trend graphs presented here (see Chapter 4).
Regression Approach
Our approach to our regression models is to use a population-level interrupted time series (ITS) regression to estimate the impact of parity on each outcome, similar to methods used in other recent parity analyses.[30] This ITS regression approach uses as the dependent variable population-level summarized measures at regular intervals (i.e., months), similar to the trend analyses. We include three predictor variables: (1) a linear time variable month; (2) a binary parity pre-post indicator that distinguishes between the pre-parity and post-parity periods (0=2005-2010; 1=2011-2015); and (3) a Parity*Month interaction variable. The month linear time variable measures the overall slope of the trend line, whereas the parity pre-post indictor measures the one-time parity impact on the level of the trend line and the Parity*Month variable measures the impact of parity on the trend line over time.
ITS is most applicable to impacts that occur relatively quickly following the measured change. We believe that the evaluation of the impact of MHPAEA, where the interim rules were effective for most large employer-sponsored plans by January 1, 2011, is a good candidate for ITS.
In addition to the three predictor variables described above, we also controlled for seasonality by including indicators for each month. In all spending-related outcomes, we controlled for inflation by including a quarterly measure of inflation, the Gross Domestic Product (GDP) deflator. We also tested all regression analyses for serial correlation. More details on ITS regression specification and sensitivity analyses are described in Appendix B and Appendix E.
Because MHPAEA is federal legislation that affected all large group employer-sponsored insurance plans nationally, it is difficult to find a suitable comparison population (e.g., a population enrolled in health plans that were similar but not subject to parity). Instead of using a comparison group, we chose to compare trends in BH services with trends in non-BH services. The logic for this comparison is that parity was expected to influence MH/SUD outcomes, but not necessarily medical/surgical outcomes.[31] This is an approach that we took in prior MarketScan analyses that proved useful in distinguishing BH trends from other broader health care trends in similar analyses.[32, 33, 34]
4. RESULTS
We divide our results into several sections:
For most MH and SUD primary outcomes (Sections 1-4), we present a graph of the primary outcome trend, followed by the time series regression results. We also present the ITS regression results for the OUD versus non-OUD comparison for each outcome. In later sections for secondary outcomes (Section 5), we present graphs of the trends for spending only followed by related ITS regression results.
To ground the reader in the analyses and to provide a framework for interpretation for all findings in later sections of this results chapter, we introduce this chapter with a detailed description of the impact of MHPAEA on any MH and SUD outpatient services in Section 1. Supplemental information about the impact of MHPAEA on multiple service outcomes are included in Appendix B and Appendix E.
Primary Outcomes--Utilization
In this section, we focus on the following primary outcomes: percentage of enrollees with any use of services and average number of services used per service user. We present results for non-BH services, as a comparison to MH and SUD results. For each primary outcome, we also stratify SUD services into services for OUD and services for all other SUDs (non-OUD).
Percentage of Enrollees with Any Use of Outpatient Services
| Summary of Findings: Any Use of Outpatient Services |
| MHPAEA did not have an impact on percentage of enrollees with any use of MH outpatient services (the percentage of enrollees who used one or more service). However, MHPAEA did have a small but meaningful effect on any use of SUD outpatient services. We observed a similar significant impact of MHPAEA on any use of outpatient SUD services for those receiving treatment for OUD compared with those receiving treatment for other SUD condition (non-OUD). |
We examined MHPAEA's impact on percentage of any use of outpatient services to understand whether the percentage of the population accessing outpatient MH and SUD services has changed as a result of parity. If the parity law resulted in improved coverage of MH and SUD services overall, we would expect that parity would make access to treatment (e.g., seeking any treatment) easier for enrollees with BH conditions who previously had not sought treatment. Additionally, given that parity may have led to improved coverage of MH and SUD services, some enrollees who previously paid for certain MH/SUD treatments out-of-pocket now may be covered under their insurance plan. This second scenario is more likely to be the case with SUD services, because MHPAEA extended parity provisions to include SUD services. In both scenarios, if parity improved coverage, we would expect to see an increase in the percentage of enrollees accessing MH and SUD outpatient services.
Trend Analysis
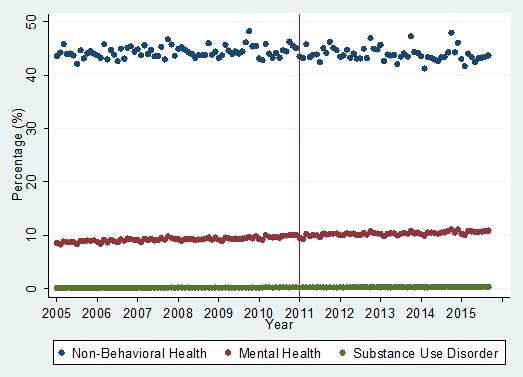
Figure 1 presents our trend analysis for the outcome percentage of enrollees with any use of services. There are three separate trends that are plotted over time--for non-BH, MH, and SUD outpatient services. We plotted a data point for each month from January 2005 through September 2015. Each data point represents the percentage of enrollees with at least one outpatient service use of the relevant service type (i.e., non-BH, MH, or SUD). Thus, the percentage with any outpatient use is separated by MH, SUD, and other non-BH outpatient services. For example, the first data point in the SUD trend is approximately 0.4 percent, which represents the percentage of enrollees with at least one (i.e., one or more) outpatient SUD service use in January 2015.
In this trend analysis, we were interested in seeing how trends change over time, with particular focus on comparing the pre-parity years (2005-2010) with the post-parity years (2011-2015). The post-parity period in this analysis begins at the start of 2011, indicated in the graph by the red vertical line. We considered January 1, 2011, to be the beginning of the post-parity period because MHPAEA compliance was required for calendar year employer-sponsored insurance plans effective at the beginning of 2011, and most employer-sponsored insurance plans are on a calendar year.
We also were interested in comparing BH services (both MH and SUD services) with non-BH services. Because non-BH services are not subject to the parity law specifically, we do not expect the law to have major impacts on this category of services. In our analysis, we were generally concerned about being able to attribute impacts to the parity law, separate from general health care trends. In part, we were able to do this by examining the timing of the observed change with our understanding of the law's implementation. A second step was to examine non-BH trends where we do not expect parity to have an effect. If we find similar impacts for non-BH services, that would suggest that our results were driven by overall health care trends. However, if we do not observe similar effects for non-BH services, that finding would strengthen our ability to conclude that impacts were due to the parity law.
When examining changes in trends between the pre-parity and post-parity periods, we looked for changes in both the level and the slope of the trend. An observed change in the level, the slope, or both at the time of parity's effective compliance date is evidence that the change is attributable to the law. A change in the level suggests an immediate impact of the law, whereas a change in the slope suggests an impact that occurs over time.
-
An analysis of parity's impact on the level of the outcome (in this case, percentage of enrollees with any use) is graphically represented by a change in the level of the trend line in the pre-parity period (i.e., 2005-2010) versus the post-parity period (i.e., 2011-2015). This is would be seen in the graph as a vertical shift at the start of the post-parity period (2011); the red vertical line indicates the start of the post-parity period.
-
An analysis of parity's impact on the slope of the outcome (in this case, percentage of enrollees with any use) is graphically represented by a change in the slope of the trend line in the pre-parity period (i.e., 2005-2010) versus the post-parity period (i.e., 2011-2015). The slope of the trend line refers to the steepness of the curve.
We are interested in whether there was a change in the level of the trend line at the start of parity implementation or whether there was a change in the slope of each trend line between the pre-parity years (2005-2010) and the post-parity years (2011-2015). All three of the trend lines in Figure 2 have a relatively flat slope (meaning neither a large increase nor a large decrease in the level of the trend line over time), and there was no noticeable change for either MH or SUD outpatient services in the level at the beginning of 2011 or in the slope between the pre-parity and post-parity periods. This finding suggests that parity did not have a strong impact on the percentage of enrollees who used any MH or SUD outpatient services. However, the ITS regression results allowed us to empirically test this observation.
| FIGURE 1. Percentage of Enrollees with Any Outpatient Service Use by Non-BH, MH, and SUD |
|---|
 |
We then used ITS regression analysis to estimate the magnitude of any change in the level and slope on the outcome and to test the significance of the measured change for each (see Table 3).
We performed an ITS regression for each of three outcomes: average monthly percentage of enrollees with any use of non-BH outpatient services, MH outpatient services, and SUD outpatient services. In each ITS regression, we included three primary independent variables (in addition to the GDP variable to control for inflation).
-
The parity (pre-post) binary indicator was equal to zero in 2005-2010 year-months and one in 2011-2015 year-months. The parity (pre-post indicator) measured the change in the level of the outcome trend at the start of the post-parity period.
-
A Parity*Month interaction term measured the change in the slope of the outcome trend in the post-parity period.
-
The linear time trend variable (called month, row 3 in Table 3) controlled for changes in the monthly percentage with any use due to general trends in the marketplace during this time period.
The ITS regression results for any use of outpatient services, by diagnosis group, confirmed our observations from the trend analysis for MH in Figure 1 that there were no large changes in any use of MH services due to parity (see Table 3). Neither of the two estimated coefficients on our two MH variables of interest, parity (pre-post indicator) and Parity*Month, were significantly different from 0 (p-values=0.291 and 0.570, respectively), meaning that parity had no impact on any use of MH services.
However, the results for SUD show a nominally small but meaningful impact. Both variables of interest, the parity (pre-post indicator) and Parity*Month results had p-values that were <0.001, which means the coefficients were significantly different from 0. Both coefficients were positive, meaning that parity did lead to an increase in the number of enrollees with any use of SUD services. The coefficient of 0.011 on the Parity (pre-post indicator) variable means that the parity law was estimated to have increased the level of any use of SUD services by 0.011 percentage points. For the Parity*Month variable, the coefficient was 0.001, which means that the parity law was estimated to have increased the slope by 0.001 percentage points per month. These results together suggest that parity increased the percentage of enrollees with any use of outpatient SUD services by 0.023 percentage points in the first year following parity's implementation.
| TABLE 3. Monthly ITS Regressions on Any Use of Outpatient Services by Diagnosis Category | ||||||
|---|---|---|---|---|---|---|
| Variable | Non-BH Coefficient | Non-BH p-value | MH Coefficient | MH p-value | SUD Coefficient | SUD p-value |
| Parity (pre-post indicator) | -0.483 | 0.245 | 0.093 | 0.291 | 0.011 | <0.001 |
| Parity*Month | -0.025 | 0.028 | -0.001 | 0.570 | 0.001 | <0.001 |
| Month (linear time variable) | 0.012 | 0.073 | 0.016 | <0.001 | 0.001 | <0.001 |
Although the impact on any use of outpatient SUD services was nominally very small, it is helpful to put that finding into context. Among enrollees, 0.1927 percent had any SUD outpatient service use in the last month of 2010. If parity increased the percentage with any use by 0.023 percentage points in the next year, that represents an 11.9 percent increase. It is difficult to see this increase in the trend line for SUD in Figure 2 because the monthly SUD percentage with any use of services was so small to begin with. We can infer that this change was due to parity (and not just general health care trends unrelated to parity) because: (1) there was a measured change at the time that parity was implemented; (2) the linear time trend (which is a measure of general health care trends) controls for the general change over the time period; and (3) we did not see any similar impacts on non-BH outpatient services, for which we did not expect to see impacts due to parity.
OUD Compared with Non-OUD--Percentage With Any Use of Services
For each primary outcome, we also examine findings in the SUD group, separating service use for OUD and non-OUD SUDs. We observed a positive increase in the percentage of any outpatient service use for both groups (Table 4). The coefficients for both the level and slope for the OUD and non-OUD SUD results were very similar, suggesting a similar impact of parity on the use of both types of SUD services.
| TABLE 4. Monthly ITS Regressions on Any Use of Outpatient Services by SUD Diagnosis Category | ||||
|---|---|---|---|---|
| Variable | OUD SUD Coefficient | OUD SUD p-value | Non-OUD SUD Coefficient | Non-OUD SUD p-value |
| Parity (pre-post indicator) | 0.007 | <0.001 | 0.006 | 0.007 |
| Parity*Month | 0.000 | <0.001 | 0.001 | <0.001 |
| Month (linear time variable) | 0.001 | <0.001 | 0.001 | <0.001 |
Average Number of Services Used per Service User
| Summary of Findings: Frequency of Outpatient Services |
| MHPAEA had a significant impact on the frequency of outpatient services for both MH and SUD (average number of outpatient services used per service user). The magnitude of the impact of MHPAEA on SUD outpatient services was roughly 10 times larger than the magnitude for MH outpatient services. The impact of parity on SUD outpatient services continued well into year 2015, and translates to an estimated increase of more than 3 additional SUD outpatient monthly services per service user, over the entire post-parity period. We observed a similar significant impact on frequency of outpatient services for both OUD and other SUD conditions, although the average number of outpatient services used per service user was slightly higher for the OUD diagnosis group than for the non-OUD diagnosis group. |
A second potential driver of spending is the number of outpatient services used per service user. If we again assume that parity positively improved coverage of MH and SUD services in large group commercial plans, we would expect an increase in the frequency of outpatient service use (i.e., the number of services used per service user). Examining Figure 2, for MH and non-BH services, we see a very similar pattern to Figure 1 in which there is not much evident change in either trend line. For SUD services, however, there is a discernable change in the slope of the SUD trend line between the pre-parity and post-parity periods for the average number of monthly outpatient services used per service user.
| FIGURE 2. Average Number of Outpatient Services Used per Service User by Non-BH, MH, and SUD |
|---|
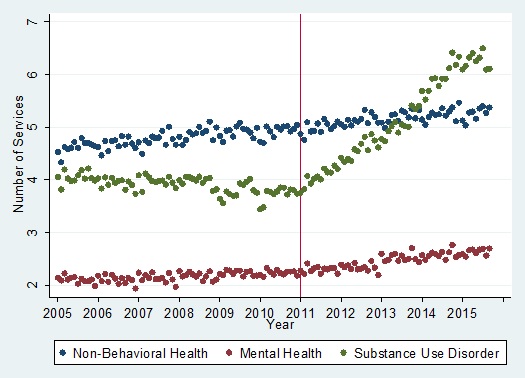 |
Looking at the Parity (pre-post indicator) coefficients, the ITS regression results show no change in the level as a result of parity for either the MH or SUD in the average number of outpatient services (see Table 5). However, the Parity*Month variable estimated coefficients were significantly different than 0 for both MH (coefficient=0.005) and SUD (coefficient=0.054), with p<0.001. Looking further at the magnitude of the differences in average number of outpatient services, we see differences between SUD services and MH services. The magnitude of the SUD Parity*Month coefficient, was roughly ten times the size of the same MH coefficient. This means that parity had a small impact on MH frequency of service use, whereas it had a large impact on the SUD frequency of service use. For example, in a 1-year period following parity's implementation, the average monthly number of outpatient services used per service user was expected to increase by 0.06 services for MH services due to parity (0.005 times 12), whereas the impact on SUD services was roughly 0.65 services (0.054×12). As we see from the SUD trend in Figure 2, the impact of parity continued well into year 2015, which translates to an estimated increase of more than three additional SUD outpatient monthly services per service user, over the entire post-parity period. A similar analysis for MH indicates that the changes would amount to less than a 0.3 increase in outpatient monthly service use over same the post-parity period.
| TABLE 5. Monthly ITS Regressions on Average Monthly Number of Outpatient Services Used per Service User by Diagnosis Category | ||||||
|---|---|---|---|---|---|---|
| Variable | Non-BH Coefficient | Non-BH p-value | MH Coefficient | MH p-value | SUD Coefficient | SUD p-value |
| Parity (pre-post indicator) | -0.025 | 0.504 | 0.000 | 0.993 | -0.059 | 0.247 |
| Parity*Month | 0.001 | 0.621 | 0.005 | <0.001 | 0.054 | <0.001 |
| Month (linear time variable) | 0.006 | <0.001 | 0.002 | <0.001 | -0.005 | <0.001 |
OUD Compared with Non-OUD--Average Number of Services Used per Service User
Looking next at the number of services used comparing OUD with non-OUD services, here we again see significant increases in the slope for both the OUD and non-OUD groups (Table 6). The change in the slope for average number of outpatient services used per service user was slightly higher for the OUD diagnosis group than for the non-OUD diagnosis group (0.062 vs. 0.050). In a 1-year period following parity's implementation, parity's effect on the average monthly number of outpatient services used per service user for OUD was an increase of 0.744 compared with 0.60 for non-OUD services.
| TABLE 6. Monthly ITS Regressions on Number of Outpatient Services Used by SUD Diagnosis Category | ||||
|---|---|---|---|---|
| Variable | OUD SUD Coefficient | OUD SUD p-value | Non-OUD SUD Coefficient | Non-OUD SUD p-value |
| Parity (pre-post indicator) | 0.008 | 0.909 | -0.052 | 0.353 |
| Parity*Month | 0.062 | <0.001 | 0.050 | <0.001 |
| Month (linear time variable) | -0.005 | <0.001 | -0.003 | 0.002 |
Primary Outcomes--Average Insurer and Enrollee Spending
In this section of the report, we present our findings for the spending outcomes, focusing on average monthly spending for outpatient services. We first present the average monthly outpatient spending by insurer and then by the enrollee. As above, we compare the MH and SUD spending to non-BH spending, and also stratify the SUD findings by those with OUD and those with other SUD disorders (non-OUD).
Average Monthly Outpatient Insurer Spending per Service User
| Summary of Findings: Average Monthly Insurer Spending |
| MHPAEA had a significant positive impact on average monthly insurer spending on MH and SUD outpatient services. For insurer spending on MH outpatient services, the impact was moderate, but the impact on SUD outpatient services was greater. The patterns for OUD and non-OUD spending were essentially the same, although the magnitude of this change was slightly larger for the OUD category. |
Our findings for Average Monthly Outpatient Insurer Spending per Service User demonstrate a significant impact of MHPAEA on both MH and SUD insurer spending. However, the impact on MH insurer spending was very moderate, whereas the impact on SUD insurer spending was larger. To draw this conclusion, we looked first at the trend analysis of average spending for non-BH, MH, and SUD outpatient services. Then, we examined the coefficient results of the ITS regression analysis, which test the significance of the impact of parity on outpatient insurer spending.
Trend Analysis
In Figure 3, the average monthly outpatient insurer spending per service user is plotted over time for non-BH, MH, and SUD services, separately. For both non-BH and MH services, average monthly outpatient insurer spending per service user increased gradually over time, but there was little to no noticeable change in either the level of the trend or the slope of the trend in the post-parity period. However, for SUD services, the pre-parity slope of the trend was similar to both the non-BH and MH trends, but there was a noticeable increase in the slope of the SUD trend at the start of the post-parity period.
| FIGURE 3. Average Monthly Insurer Spending (in dollars) on Outpatient Services per Service User by Non-BH, MH, and SUD |
|---|
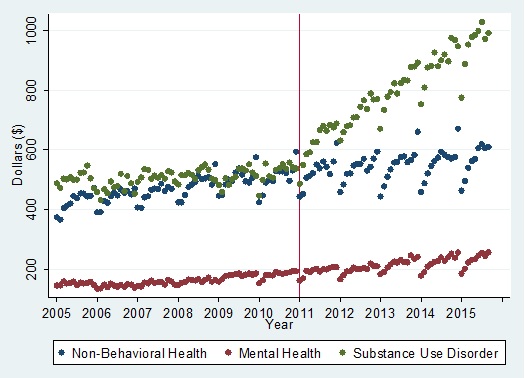 |
Interrupted Time Series Regression Analysis
Looking at the results of the ITS regression analyses, our findings reinforce what we observed in the trend graphs. For SUD outpatient services, Table 7 results indicate almost a $48 increase in the level of average monthly insurer spending per service user. The Parity*Month meaning that the post-parity slope increased by $6.88 per month in the post-parity period, above the linear trend captured by the month variable. This means that over a 1-year period, parity was expected to increase the average monthly insurer spending per service user for SUDs by $82.56.
Table 7 results for MH services were much smaller in magnitude than those for SUD services. The parity pre-post indicator indicated no statistically significant change in the level associated with MHPAEA, but the Parity*Month interaction term showed a small increase in the post-parity slope. The estimated increase in the slope was $0.35 per month, which over a 1-year period, amounts to a $4.20 increase.
Comparing both the MH and SUD results with non-BH results, we see in Table 7 that MHPAEA was associated with a slight decrease in the slope of non-BH average outpatient insurer spending per service user. These findings demonstrate that the implementation of parity did not have the same effect on average monthly outpatient insurer spending for non-BH services as it did for the same outcome for the MH and SUD service groups.
| TABLE 7. ITS Regression Results on Average Monthly Outpatient Insurer Spending per Service User by Diagnosis Category | ||||||
|---|---|---|---|---|---|---|
| Variable | Non-BH Coefficient | Non-BH p-value | MH Coefficient | MH p-value | SUD Coefficient | SUD p-value |
| Parity (pre-post indicator) | -18.303 | 0.179 | -3.674 | 0.413 | 47.674 | <0.001 |
| Parity*Month | -0.320 | 0.394 | 0.348 | 0.005 | 6.879 | <0.001 |
| Month (linear time variable) | 1.646 | 0.066 | 1.519 | <0.001 | 0.372 | 0.643 |
Thus, taken together, these findings show that parity had a large and significant impact on average monthly outpatient insurer spending for SUD services and a significant but moderate impact on average monthly outpatient insurer spending for MH services. We can infer that this change was due to parity (and not just general health care trends unrelated to parity) because: (1) there was a distinct change at the time that parity was implemented; (2) the linear time trend (which is a measure of general health care trends) controls for the general change over the time period; and (3) we also controlled for inflation in these models by including a variable for the quarterly measure of the GDP deflator. In addition, we controlled for seasonality in spending by including monthly indicators.
OUD Compared with Non-OUD--Average Monthly Insurer Outpatient Spending per Service User
The trend graph presented in Figure 4 illustrates that the patterns for average monthly insurer outpatient spending per user were essentially the same for OUD and non-OUD diagnosis groups. Both OUD and non-OUD diagnosis groups experienced an increase in spending around the time of parity implementation and continued to trend upward during each post-period month. In these descriptive results, however, it appeared that the difference in the slope of the trend pre-parity versus post-parity was larger for the OUD group because of the downward sloping trend in the pre-parity period.
| FIGURE 4. Average Monthly Insurer Outpatient Spending by Diagnosis Category |
|---|
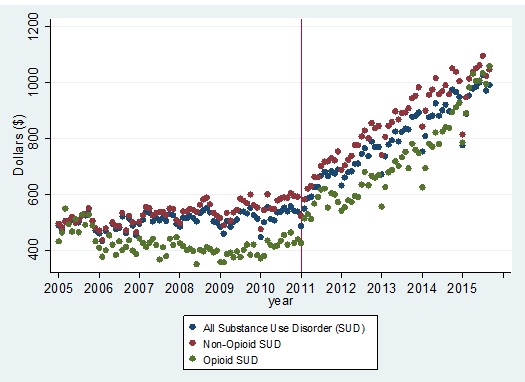 |
The ITS regression model for average monthly outpatient spending by insurer showed that, in fact, there were significant changes in both the level and the slope for both OUD and non-OUD SUD (Table 8). However, the magnitude of this change was larger for the OUD category. The impact on the level of average monthly spending was $65.32 for OUD versus $47.36 for non-OUD, with an impact on the slope for OUD of $9.58 versus $6.71.
| TABLE 8. Monthly ITS Regressions on Average Monthly Insurer Outpatient Spending By SUD Diagnosis Category | ||||
|---|---|---|---|---|
| Variable | OUD SUD Coefficient | OUD SUD p-value | Non-OUD SUD Coefficient | Non-OUD SUD p-value |
| Parity (pre-post indicator) | 65.32 | <0.001 | 47.36 | <0.001 |
| Parity*Month | 9.58 | <0.001 | 6.71 | <0.001 |
| Month (linear time variable) | 3.32 | <0.001 | 0.88 | 0.33 |
Average Monthly Out-of-Pocket Enrollee Spending
| Summary of Findings: Enrollee Out-of-Pocket Spending |
| We observed no impact of MHPAEA on average monthly out-of-pocket enrollee spending for outpatient MH services. However, results for SUD outpatient services do indicate a small but non-trivial impact of MHPAEA on the average enrollee spending for SUD outpatient visits. The impact of MHPAEA on OUD and non-OUD outpatient services was virtually identical. |
Results from the trend analyses for out-of-pocket spending reveal that out-of-pocket spending has been increasing over the full study period across all service categories (Figure 5). For MH outpatient services, parity does not appear to have substantially affected the level or slope of the out-of-pocket spending trend. For SUD outpatient services, we saw some indication that parity may have affected the level and slope of SUD outpatient services, particularly during some outlier months.
We also see in Figure 5 that there is substantial seasonal variation in average monthly out-of-pocket spending. Out-of-pocket spending includes the deductible, copayment, and coinsurance amounts paid over the course of the month. This seasonal variation is evident in the shape of the line within each year, which has a downward slope over the course of the year. This pattern corresponds to the restarting of deductibles at the beginning of each calendar year. Recall that when the deductible resets at the beginning of the calendar year, average monthly out-of-pocket spending is higher and subsequently falls over the course of the year as enrollees meet the deductible.
| FIGURE 5. Average Monthly Out-of-Pocket Spending on Outpatient Services by Non-BH, MH and SUD |
|---|
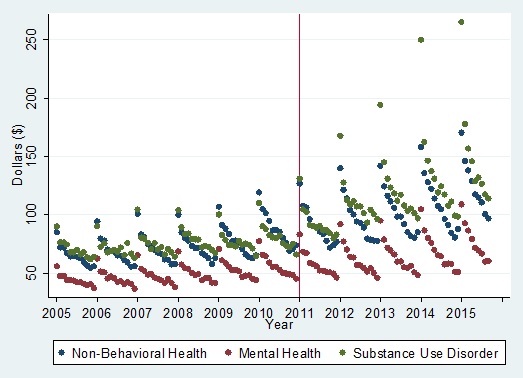 |
The trends in Figure 5 show that some average monthly out-of-pocket spending amounts at the beginning of the calendar year in the post-parity period were very high for SUD services. For example, average monthly out-of-pocket spending was $168 in the first month of 2012, $194 in the first month of 2013, and $250 in the first month of 2014. Spending in subsequent months in the calendar year (February-December) was, however, lower than in January. This result suggests that although the general health care trend is toward higher deductibles and as a result higher average out-of-pocket spending in our full study period, parity appears to have increased SUD service average out-of-pocket spending above the general health care trend level.
Regression results (see Table 9) for MH outpatient services indicate no impact of parity on average monthly out-of-pocket spending. However, results for SUD outpatient services do indicate an impact on the level of SUD services of $16.78 and a small but non-trivial impact on the slope of SUD services of $0.76 per month. In the first year following parity, this impact on SUD outpatient services amounted to an increase of $25.90, and in subsequent years, the increase was $9.12 per year. From Figure 5, we know that a substantial portion of that impact was occurring for SUD outpatient service users in the first month of service use in the calendar year when the plan deductible had not yet been met.
| TABLE 9. Monthly ITS Regressions on Average Monthly Outpatient Out-of-Pocket Spending by Diagnosis Category | ||||||
|---|---|---|---|---|---|---|
| Variable | Non-BH Coefficient | Non-BH p-value | MH Coefficient | MH p-value | SUD Coefficient | SUD p-value |
| Parity (pre-post indicator) | 9.091 | 0.150 | 4.223 | 0.299 | 16.781 | 0.046 |
| Parity*Month | 0.158 | 0.363 | 0.070 | 0.534 | 0.757 | 0.001 |
| Month (linear time variable) | 0.437 | 0.289 | 0.164 | 0.537 | -0.150 | 0.784 |
OUD Compared with Non-OUD--Average Monthly Out-of-Pocket Spending on Outpatient Services
Comparing OUD with non-OUD found that average monthly out-of-pocket outpatient spending was similar between these two diagnosis groups. The trend analyses presented in Figure 6 illustrate very similar patterns for the OUD and non-OUD SUD average out-of-pocket outpatient spending. We saw the same pattern for both OUD and non-OUD services of much higher average out-of-pocket spending in the beginning of the calendar year in the post-parity period and in general continued increasing average monthly out-of-pocket spending over the full post-parity period.
| FIGURE 6. OUD Versus Non-OUD Average Monthly Out-of-Pocket Spending on Outpatient Services by Diagnosis Category |
|---|
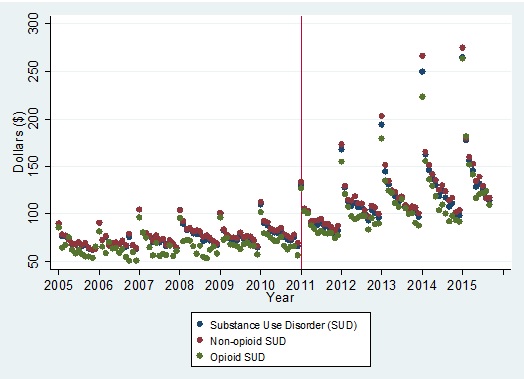 |
The regression analyses confirm the initial descriptive findings (see Table 10). Both OUD and non-OUD diagnosis groups experienced a significant increase in the level and the slope of the average monthly out-of-pocket spending on outpatient services by enrollees and the magnitude of the effects were nearly identical.
| TABLE 10. Monthly ITS Regressions on Average Monthly Outpatient Out-of-Pocket Spending by SUD Diagnosis Category | ||||
|---|---|---|---|---|
| Variable | OUD SUD Coefficient | OUD SUD p-value | Non-OUD SUD Coefficient | Non-OUD SUD p-value |
| Parity (pre-post indicator) | 18.211 | 0.030 | 17.126 | 0.050 |
| Parity*Month | 0.741 | 0.002 | 0.769 | 0.002 |
| Month (linear time variable) | 0.190 | 0.726 | -0.157 | 0.783 |
Primary Outcomes--Insurer Reimbursement and Enrollee Spending per Outpatient Visit
Average Insurer Reimbursement Amount Paid per Outpatient Visit
| Summary of Findings: Insurer Reimbursement Paid per Outpatient Visit |
| There was no statistically significant effect of parity on the average reimbursement amount paid per outpatient visit for SUD services. There was a statistically significant positive impact of MHPAEA on reimbursement rate paid per MH outpatient visit. But, there was a similar statistically significant coefficient for non-BH services suggesting that this impact was not in fact due to parity but was a result of general health care trends not otherwise captured in our linear time variable. |
| FIGURE 7. Average Insurer Reimbursement Among Paid per Outpatient Visit by Non-BH, MH, and SUD |
|---|
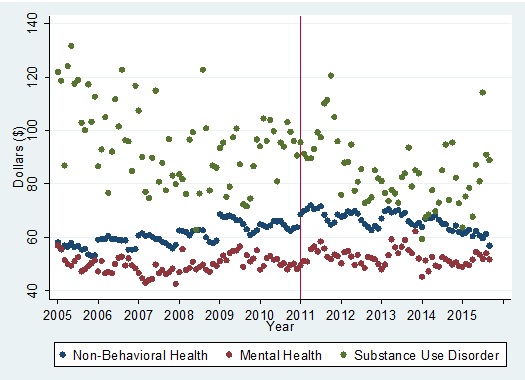 |
In addition to any use of outpatient services, and frequency of service use, the third potential driver of changes in average insurer spending is changes in the average amount paid to the provider per outpatient service over time. Figure 7 displays the three trend lines for non-BH, MH, and SUD services. There was no discernable impact of parity on the average reimbursement amount paid per outpatient visit from the trend lines. SUD services on average had more variation in the average reimbursement paid per outpatient visit over time than Non-BH and MH trends, as indicated by the dispersion of the green dots in Figure 7. This outcome was higher in almost all months for SUD than Non-BH and MH services. Note that the outpatient visit category is broad and includes intermediate care such as intensive outpatient and partial hospitalization (see Appendix B for outpatient service category coding). These modalities often are components of outpatient SUD treatment and help explain the higher mean costs for the SUD group.
ITS regression results confirm that there was no statistically significant effect of parity on either the level or the slope of the average insurer reimbursement amount paid per outpatient visit for SUD services (see Table 11). There was a statistically significant estimated coefficient for the parity (pre-post indicator) variable for MH services (coefficient=$2.55, p=0.019). Yet, there also was a similar statistically significant coefficient for non-BH services (coefficient=$4.98, p<0.001). This result suggests that the statistically significant impact for MH services was not in fact due to parity but was a result of general health care trends not otherwise captured in our linear time variable.
| TABLE 11. Monthly ITS Regressions on Average Insurer Reimbursement Amount per Outpatient Visit by Diagnosis Category | ||||||
|---|---|---|---|---|---|---|
| Variable | Non-BH Coefficient | Non-BH p-value | MH Coefficient | MH p-value | SUD Coefficient | SUD p-value |
| Parity (pre-post indicator) | 4.982 | <0.001 | 2.548 | 0.019 | 5.954 | 0.180 |
| Parity*Month | -0.297 | <0.001 | -0.072 | 0.015 | -0.074 | 0.548 |
| Month (linear time variable) | 0.102 | 0.080 | 0.273 | <0.001 | 0.851 | 0.004 |
OUD Compared with Non-OUD--Average Insurer Reimbursement Amount Paid per Outpatient Visit
For both SUD diagnosis groups, parity had no impact on average insurer reimbursement amount paid per outpatient visit (Table 12).
| TABLE 12. Monthly ITS Regressions on Average Insurer Reimbursement Amount Paid per Outpatient Visit by SUD Diagnosis Category | ||||
|---|---|---|---|---|
| Variable | OUD SUD Coefficient | OUD SUD p-value | Non-OUD SUD Coefficient | Non-OUD SUD p-value |
| Parity (pre-post indicator) | 2.655 | 0.828 | 6.381 | 0.217 |
| Parity*Month | 0.554 | 0.102 | -0.211 | 0.140 |
| Month (linear time variable) | 0.267 | 0.738 | 0.947 | 0.006 |
Average Outpatient Out-of-Pocket Paid by Enrollee per Visit
| Summary of Findings: Enrollee Outpatient Out-of-Pocket Paid per Visit |
| There was no statistically significant effect of parity on the average out-of-pocket amount paid per service by the enrollee for MH or SUD outpatient services. These results indicate that increases in spending were not due to increased cost sharing by the enrollee. We did not find an impact of parity on enrollee out-of-pocket amount paid per visit for either OUD or other non-OUD SUD services. |
Our analysis further considers the drivers of increased SUD out-of-pocket spending as a result of parity. In Table 9, we examine whether parity also had an effect on the average outpatient out-of-pocket amount paid per visit. We see that there were no statistically significant impacts on MH or SUD services for this outcome. We already found that parity had an effect on the number of enrollees with any SUD service use (see Table 3) and the average number of services used per service user (see Table 5). The null results in Table 13 indicate that parity's impact on average out-of-pocket spending (see Table 9) was not driven by an effect on the amount paid per outpatient visit (e.g., actual value of the cost sharing). Rather, this impact was driven by effects on the number of enrollees with any outpatient service use and the average number of outpatient services used per service user.
| TABLE 13. Monthly ITS Regressions on Average Outpatient Out-of-Pocket Amount Paid per Visit by Diagnosis Category | ||||||
|---|---|---|---|---|---|---|
| Variable | Non-BH Coefficient | Non-BH p-value | MH Coefficient | MH p-value | SUD Coefficient | SUD p-value |
| Parity (pre-post indicator) | 1.812 | 0.205 | 1.781 | 0.178 | 1.156 | 0.423 |
| Parity*Month | 0.018 | 0.656 | 0.017 | 0.650 | -0.030 | 0.449 |
| Month (linear time variable) | -0.036 | 0.702 | -0.064 | 0.458 | -0.060 | 0.525 |
OUD Compared with Non-OUD--Average Outpatient Out-of-Pocket Amount Paid per Service
As illustrated in our regression analyses (Table 14), we did not find effects from parity on the average out-of-pocket spending by enrollees comparing OUD with non-OUD. As in the primary analysis above, across both types of SUD diagnosis groups, we concluded that increases in average out-of-pocket SUD outpatient spending were being driven by effects on the percentage of enrollees with any use of services and the average number of outpatient services used per service user.
| TABLE 14. Monthly ITS Regressions on Average Outpatient Amount Paid per Visit by SUD Diagnosis Category | ||||
|---|---|---|---|---|
| Variable | OUD SUD Coefficient | OUD SUD p-value | Non-OUD SUD Coefficient | Non-OUD SUD p-value |
| Parity (pre-post indicator) | 1.781 | 0.503 | 1.064 | 0.507 |
| Parity*Month | 0.092 | 0.211 | -0.069 | 0.120 |
| Month (linear time variable) | 0.130 | 0.456 | -0.073 | 0.486 |
Primary Outcomes--In-Network Versus Out-of-Network Outpatient Spending
| Summary of Findings: Ratio of Out-of-Network Spending to Total Spending |
| There has been a general trend shifting spending to in-network for MH outpatient services as well as non-BH services. These findings suggest that this shift is due to general health trends, and not the impact of MHPAEA. However, for SUD services, we observe a strong impact of MHPAEA on out-of-network spending for outpatient services, as depicted by the negative coefficient of the month time variable. We observed a large and significant positive impact on out-of-network spending for both OUD and non-OUD outpatient services as well, indicating that this impact was not driven exclusively by the opioid crisis. |
In order to better understand the impact of parity on MH/SUD service delivery, we also examined patterns of spending by insurer on in-network and out-of-network services. Here, we present our findings, first for the overall population and then comparing the OUD and non-OUD groups.
Ratio of Total Out-of-Network Outpatient Spending to Total Spending
The trend analyses presented in Figure 8 demonstrated that for non-BH services and MH services there has been a decrease in the ratio of out-of-network over in-network spending over time. The decrease is evident over all pre-parity and post-parity years. In contrast, we saw a very different pattern for SUD services. For these services, we observed a similar decrease in the years 2005-2009, but starting at the beginning of 2010, we saw that pattern start to reverse. By 2012, there was a discernable and quite dramatic reversal, which continues throughout the remainder of the post-period. These findings suggest a strong impact of parity on spending for out-of-network SUD services due to parity.
| FIGURE 8. Ratio of Out-of-Network Outpatient Spending to Total Outpatient Spending, by Non-BH, MH, and SUD |
|---|
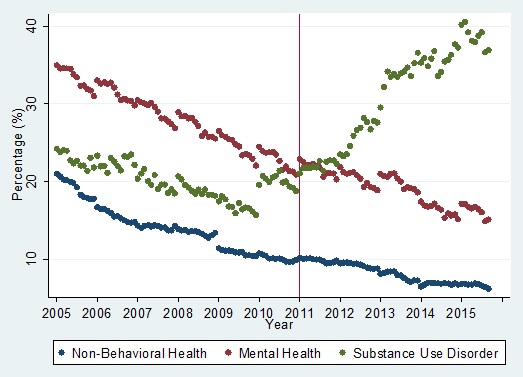 |
In Table 15, we present the ITS results for these analyses. Those results show that there has been a general trend shifting spending to in-network, as depicted by the negative coefficient of the month time variable. The positive and significant coefficients for MH services initially suggested that parity had a small impact on the level and slope of the MH out-of-network trend. It is worth noting that the size of the positive coefficient on the Parity*Month variable was much smaller than the size of the negative coefficient on the month linear time variable. Therefore, the suggested impact of parity on the slope of the MH services percentage of out-of-network spending was only a small lessening of the downward trend in the outcome. However, because we saw very similar results for non-BH services, meaning that there were similar small positive coefficients on the parity and Parity*Month variables, we suspect that this is evidence of a general health care trend not otherwise captured by the linear time variable. Therefore, we are unable to assert that the impact on MH services is in fact due to parity.
However, the size of the coefficient on the Parity*Month variable was much larger for SUD services. In effect, it canceled out the downward trajectory in the pre-parity period of shifting SUD service spending to in-network services to a strong upward trajectory in the post-parity period that is shifting SUD services to out-of-network. Although results for MH and SUD coefficients in the regression results were similar in size and statistical significance, the magnitude of the Parity*Month variable for SUD services was close to ten times the estimated effect for MH services. This difference in magnitude sets the SUD results apart from both the MH and Non-BH results and gives us confidence that the result was due to parity's implementation.
The regression result, in particular the coefficient on the Parity*Month variable, is evidence of parity's large and positive effect on the ratio of total out-of-network spending to total overall spending. We found similar trends when assessing the ratio of total monthly out-of-network services used of total overall services used.
| TABLE 15. ITS Regression Results on the Impact of Parity on the Ratio of Out-of-Network Outpatient Spending to Total Outpatient Spending by Diagnosis Category | ||||||
|---|---|---|---|---|---|---|
| Variable | Non-BH Coefficient | Non-BH p-value | MH Coefficient | MH p-value | SUD Coefficient | SUD p-value |
| Parity (pre-post indicator) | 1.602 | 0.000 | 1.418 | 0.000 | 2.826 | 0.000 |
| Parity*Month | 0.068 | 0.000 | 0.054 | 0.000 | 0.443 | 0.000 |
| Month (linear time variable) | -0.144 | 0.000 | -0.185 | 0.000 | -0.078 | 0.000 |
Stratifying the OUD and non-OUD groups, we saw identical patterns for both groups in the trend analyses of the impact of parity on the ratio of total out-of-network spending of total overall spending (see Figure 9). Having similar trends in the OUD and Non-OUD diagnosis groups gives us confidence that the effect was in fact due to parity and not due to outside trends associated with the rise of the opioid crisis.
| FIGURE 9. Ratio of Out-of-Network Outpatient Spending to Total Outpatient Spending, by OUD and Non-OUD |
|---|
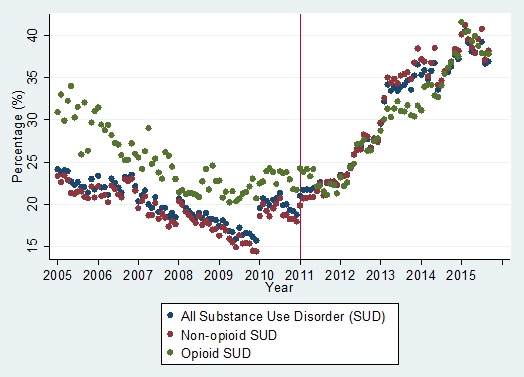 |
Our regression analyses support the patterns evident from the trend depicted in Figure 9 (see Table 16). One difference in the results between OUD and non-OUD services was a significant increase in the level for the ratio of total out-of-network spending to total outpatient spending for non-OUD SUD services but not for OUD services. However, the more important effect was on the slope of the trend, for which there was a significant change in the slope for both OUD and non-OUD services post-parity. These findings demonstrate that the dramatic shift in the slope of the ratio of out-of-network spending for SUD services in Figure 8 was not driven only by the opioid crisis. It is important also to note that the timeline for the increase in the shift for both OUD and non-OUD services began at the start of 2010. This observation may reflect changes in employer-sponsored insurance plans prior to the interim effective date of compliance for most plans.
| TABLE 16. ITS Regression Results on the Impact of Parity on the Ratio of Out-of-Network Outpatient Spending to Total Outpatient Spending by SUD Diagnosis Category | ||||
|---|---|---|---|---|
| Variable | OUD SUD Coefficient | OUD SUD p-value | Non-OUD SUD Coefficient | Non-OUD SUD p-value |
| Parity (pre-post indicator) | 0.021 | 0.976 | 3.292 | 0.000 |
| Parity*Month | 0.491 | 0.000 | 0.476 | 0.000 |
| Month (linear time variable) | -0.140 | 0.000 | -0.080 | 0.000 |
Sensitivity Analyses on Primary Outcomes
Two supplemental sensitivity analyses were conducted as part of these analyses: (1) an analysis of the interim period 2009-2010 to assess our confidence in using 2011 as the time for measuring the effect of MHPAEA; and (2) a standard statistical test of first order serial correlation.
Interim Results
A full set of regression analyses were performed that included an additional indicator for the interim period, years 2009-2010, and an additional month*interim period variable. This alternative specification allowed us to test whether parity impacts on use and spending were evident in the 2-year interim period prior to the 2011 effective compliance date. Our results indicated some small effects in the interim period, however, overall there was little evidence of changes in outcomes as a result of parity in the interim period. While we selected not to present results from interim regressions, they are available on request.
The one outcome in which we did find sizeable and significant effects of parity was on the ratio of out-of-network spending of total outpatient spending. Coefficients in the interim period for this outcome were of similar magnitude to the results presented in Table 13 and Table 14. These results confirm what is evident in the Figure 8 SUD trend and Figure 9 trends, that the shift toward out-of-network SUD services began in 2010.
First Order Serial Correlation
The other sensitivity analysis that was performed for all primary outcomes was controlling for first order serial correlation. Tests of serial correlation using a Durbin-Watson test statistic were marginally significant, signifying the presence of some serial correlation. However, upon comparison of coefficients for results with and without controls for first order serial correlation, the decision was made to present unadjusted results because results were very similar across the full set of outcomes.
Secondary Outcomes--95th Percentile and Subpopulations
In this last section, we consider the impact of parity on high utilizers, examining outcomes at the 95th percentile, and also consider outcomes for individuals with SMI, and those with an OUD.
95th Percentile Outcomes
| Summary of Findings: Outcomes at the 95th Percentile |
| Outcomes were similar to the analyses at the mean presented above, with much higher magnitude of effect. MHPAEA had a positive and significant impact on frequency of outpatient visits and total spending at the 95th percentile by the insurer for both MH and SUD treatment increased. However, there was no significant impact of parity on out-of-pocket costs to the enrollee for MH outpatient visits. For high utilizers of SUD services, there was a modest increase in out-of-pocket costs following parity. Similar to results at the mean, we expect that this increase is primarily driven by increased frequency of use though the shift to out-of-network spending may also be a factor. |
Regression analyses examining outcomes at the 95thpercentile demonstrate that parity had an impact that was similar to that observed in the population as a whole, but the impact was greater, as we would expect (see Table 17). Interestingly, there was an initial decrease in the level of the number of outpatient visits at the 95th percentile for both MH and SUD. However, over time, the positive effect on the slope canceled out this one-time decrease in the first post-parity year. There was a much larger effect on SUD service use at the 95th percentile than for MH services.
As before, we saw an increase in the slope for monthly spending by insurer due to parity for both MH and SUD with no similar increase for non-BH. The magnitude of increase was higher for both MH and SUD compared with the outcomes at the average. Here, as well, the effect on the slope was much larger for SUD than that for MH ($26.56 compared to $1.2).
For out-of-pocket spending, it is reassuring that we did not see significant impacts of parity overall on MH out-of-pocket spending at the 95th percentile. For SUD services, however, the picture was different. There was not a statistically significant change in the level of SUD out-of-pocket spending at the 95th percentile; however, the slope for SUD out-of-pocket spending at the 95th percentile did increase by $2.76 per month. These findings are consistent with the analyses presented above on average SUD out-of-pocket spending.
| TABLE 17. ITS Regression Results on Average Monthly Outpatient Visits, Average Monthly Outpatient Insurer Spending, and Average Out-of-Pocket Spending per Enrollee for the 95th Percentile Group by Non-BH, MH, and SUD Groups | ||||||
|---|---|---|---|---|---|---|
| Variable | Non-BH Coefficient | Non-BH p-value | MH Coefficient | MH p-value | SUD Coefficient | SUD p-value |
| Outpatient visits at 95th percentile | ||||||
| Parity (pre-post indicator) | -0.142 | 0.353 | -0.313 | 0.004 | -0.849 | 0.000 |
| Parity*Month | 0.015 | 0.000 | 0.016 | 0.000 | 0.174 | 0.000 |
| Month (linear time variable) | 0.012 | 0.000 | 0.015 | 0.000 | 0.003 | 0.332 |
| Outpatient spending at 95th percentile by insurer | ||||||
| Parity (pre-post indicator) | -111.345 | 0.074 | -6.157 | 0.560 | 65.262 | 0.286 |
| Parity*Month | -1.893 | 0.269 | 1.199 | 0.000 | 26.561 | 0.000 |
| Month (linear time variable) | 2.722 | 0.502 | 3.768 | 0.000 | 0.313 | 0.938 |
| Outpatient out-of-pocket spending at 95th percentile by enrollee | ||||||
| Parity (pre-post indicator) | 43.259 | 0.138 | 16.559 | 0.355 | 44.752 | 0.264 |
| Parity*Month | 0.787 | 0.327 | 0.588 | 0.235 | 2.763 | 0.013 |
| Month (linear time variable) | 1.471 | 0.439 | -0.022 | 0.985 | -0.920 | 0.725 |
SMI Subpopulation
| Summary of Findings: SMI Subpopulation |
| For those with SMI, we observed an increase in average spending, primarily for SUD outpatient services. However, importantly, for this group, there was no impact on average out-of-pocket spending per outpatient visits. |
Trend analyses for the SMI subpopulation indicated that parity had a somewhat positive impact on average spending by insurer on SUD outpatient services but no evident impact on average spending for MH outpatient services (see Figure 10). The effect on average spending for SUD outpatient services for this subpopulation appears to be much less dramatic than was found in analyses on average SUD outpatient spending for the full population.
| FIGURE 10. Average Spending by Insurer for Outpatient Services for the SMI Subpopulation |
|---|
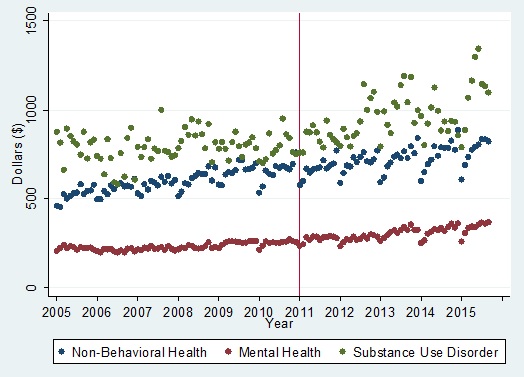 |
The ITS regression results confirm the effect of parity on the slope of average spending for SUD outpatient services by insurer (see Table 18). They also show an effect on average MH outpatient spending for the SMI subpopulation. The findings demonstrate that the magnitude of the impact on the slope for SUD outpatient spending for this subpopulation was larger than the impact on the slope for MH outpatient spending but that parity had a positive effect on average outpatient spending for BH services in general for individuals with SMI.
| TABLE 18. ITS Regression Results Estimating the Impact of Parity on Average Spending by Insurer for Outpatient Services for the Subpopulation of Individuals With SMI by Diagnosis Category | ||||||
|---|---|---|---|---|---|---|
| Variable | Non-BH Coefficient | Non-BH p-value | MH Coefficient | MH p-value | SUD Coefficient | SUD p-value |
| Parity (pre-post indicator) | -44.857 | 0.010 | -2.613 | 0.680 | 18.373 | 0.608 |
| Parity*Month | 0.098 | 0.836 | 0.884 | 0.000 | 4.093 | 0.000 |
| Month (linear time variable) | 2.653 | 0.019 | 2.001 | 0.000 | -0.417 | 0.859 |
In Table 19, we present findings for average monthly out-of-pocket spending by enrollee for the SMI population. There were no significant impacts on out-of-pocket spending by enrollee for this high utilizer group, suggesting that despite increases in utilization and associated increases in insurer spending due to parity, cost sharing did not increase among this subpopulation. This supports our hypotheses that parity may have a protective effect on financial burden among those with the greatest need. However, it also suggests that the 2008 parity law may not have made a substantial difference among this group, who were probably most likely to be protected already by the original 1996 law.
| TABLE 19. ITS Regression Results Estimating the Impact of Parity for the Subpopulation of Individuals with SMI on Average Out-of-Pocket Spending by Enrollee by Diagnosis Category | ||||||
|---|---|---|---|---|---|---|
| Variable | Non-BH Coefficient | Non-BH p-value | MH Coefficient | MH p-value | SUD Coefficient | SUD p-value |
| Parity (pre-post indicator) | 12.232 | 0.154 | 5.449 | 0.229 | 13.084 | 0.208 |
| Parity*Month | 0.031 | 0.629 | 0.122 | 0.330 | 0.198 | 0.489 |
| Month (linear time variable) | 0.270 | 0.897 | 0.336 | 0.257 | -0.028 | 0.967 |
OUD Subpopulation
| Summary of Findings: OUD Subpopulation |
| For those with an OUD, we observed a similar increase in outpatient spending following parity as we observed for those with SMI, with a much larger magnitude of increased spending for SUD. However, here we saw a substantial increase in out-of-pocket spending for those receiving SUD outpatient services. We also saw a significant increase in the level of out-of-pocket spending on MH services for this population at the point of MHPAEA implementation. |
Looking at the OUD subpopulation in Figure 11, we see an expected large increase in overall spending for SUD outpatient services by insurer, but we also see a less dramatic increase in the slope for spending on MH outpatient services. These results are consistent with our overall analysis of SUD outpatient spending for the full population.
| FIGURE 11. Average Outpatient Insurer Spending for the OUD Subpopulation |
|---|
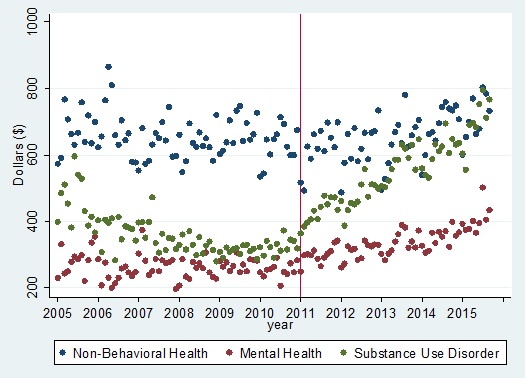 |
In Table 20 we present the ITS findings for outpatient spending by insurer for the OUD subpopulation. As evident in the trend analysis, for this population, parity has had a very large impact on SUD average outpatient insurer spending. Interestingly, compared with the SMI subpopulation, parity has had a larger effect on average outpatient spending for MH services for the OUD subpopulation. We can only speculate on why this is the case; however, one possible explanation is that the increase in SUD service use has also resulted in increased referrals to receive care for MH conditions, which are often a comorbidity for individuals with OUD.
| TABLE 20. ITS Regression Results Estimating the Impact of Parity of Average Outpatient Spending by Insurer, for the Subpopulation of Individuals with OUD, by Non-BH, MH, and SUD | ||||||
|---|---|---|---|---|---|---|
| Variable | Non-BH Coefficient | Non-BH p-value | MH Coefficient | MH p-value | SUD Coefficient | SUD p-value |
| Parity (pre-post indicator) | -57.968 | 0.011 | 14.679 | 0.202 | 88.042 | 0.000 |
| Parity*Month | 2.915 | 0.000 | 2.310 | 0.000 | 7.780 | 0.000 |
| Month (linear time variable) | 1.198 | 0.419 | 0.648 | 0.388 | 1.327 | 0.184 |
In Table 21, we present the findings for average out-of-pocket outpatient spending for the OUD population. There was a significant impact on the level of out-of-pocket spending for MH outpatient services and a quite dramatic impact on the level and slope of SUD out-of-pocket outpatient spending. It is important to note two things. First, these findings are consistent with our findings that parity had an effect on average out-of-pocket outpatient spending for SUD services for the full population. Second, in our overall analyses, average out-of-pocket spending for MH outpatient spending did not increase. The fact that out-of-pocket spending for MH outpatient services increased for the OUD group is noteworthy and may be linked to the higher effect of parity on access to MH outpatient services for this subpopulation.
| TABLE 21. ITS Regression Results Estimating the Impact of Parity, for the Subpopulation of Individuals With OUD, on Average Out-of-Pocket Spending by Enrollee by Diagnosis Category | ||||||
|---|---|---|---|---|---|---|
| Variable | Non-BH Coefficient | Non-BH p-value | MH Coefficient | MH p-value | SUD Coefficient | SUD p-value |
| Parity (pre-post indicator) | 11.786 | 0.122 | 10.681 | 0.019 | 19.620 | 0.003 |
| Parity*Month | 0.310 | 0.141 | 0.201 | 0.109 | 0.902 | 0.000 |
| Month (linear time variable) | -0.059 | 0.906 | -0.306 | 0.302 | 0.104 | 0.810 |
5. CONCLUSIONS
MHPAEA Had a Positive Impact on Utilization of Outpatient Behavioral Health Services at the Mean
Overall, the findings demonstrate a significant impact of MHPAEA on average utilization of MH and SUD outpatient services. We observed a significant impact on access to SUD outpatient services, demonstrated by a greater percentage of individuals utilizing one or more service. We also observed a significant impact on frequency of service use for both MH and SUD outpatient services. What is important about these results is that these effects were not isolated to high utilizers (as demonstrated by our analyses of outcomes at the 95thpercentile). Because we found effects for outcomes at the mean, we can conclude that the impacts of MHPAEA on outpatient service utilization were broad in scope and evident for the average user of outpatient BH services.
The Impact of MHPAEA Was Particularly Strong for SUD Outpatient Services
Although the impact of MHPAEA on utilization was evident for both MH and SUD outpatient services, we observed a far larger impact on SUD services. For example, the impact of MHPAEA on the frequency of SUD outpatient services was roughly ten times larger than the impact on MH outpatient services. For SUD services, the increase in spending also was due primarily to an increase in the average number of outpatient visits, although here there was also a modest effect of parity on any use of services. This impact on any use of services is not unexpected, given that MHPAEA expanded parity to include SUD services, and thus some insurance companies may have added SUD coverage where previously there was none.
Although these impacts suggest that parity has played a role in eliminating the treatment gap for SUD services, it is important to note that in this study sample in 2014, only 1.2 percent used any SUD services, and only 0.9 percent used outpatient SUD services. The most recent data from the National Survey on Drug Use and Health estimated that one in 12 individuals needed specialty treatment for SUD and only 10.8 percent of these individuals got it.[35] Hence, despite measurable impacts of MHPAEA on SUD service use, there is still a long way to go to eliminate the SUD treatment gap.
Impact of MHPAEA on Utilization of SUD Outpatient Services Was Not Due to the Opioid Use Disorder Epidemic
To assess whether these findings for SUD treatment primarily were due to MHAPEA or were driven instead by the OUD epidemic, we stratified our SUD analyses into treatment for OUD diagnoses compared with treatment for non-OUD SUD diagnoses. These analyses demonstrated identical patterns across the two groups, increasing our confidence that the overall changes in utilization post-parity were due to parity. However, we did observe a greater magnitude of impact for OUD outpatient treatment, suggesting that the influx of individuals with OUD diagnoses during the same time frame as parity implementation interacted to some extent.
We saw very little in terms of clear differences between the OUD and non-OUD diagnosis groups, increasing our confidence that the changes that we saw at the point of parity implementation were due to parity and not to an increase resulting from the OUD crisis.
There Was No Evidence That MHPAEA Resulted in Increased Costs per Service for the Enrollee or the Provider
Although we found that MHPAEA had a positive impact on both insurer and enrollee spending on outpatient BH services, the overall impact of parity on reimbursement rates and out-of-pocket spending per visit was negligible. The average price paid per outpatient service did not increase for the enrollee or the insurer. Parity's impact on increased outpatient service utilization was the driver of the impact on spending for BH outpatient services (for both the insurer and the enrollee).
MHPAEA Led to a Dramatic Shift to Out-of-Network Spending for Outpatient Services Due to Parity
Our analyses of in-network and out-of-network spending demonstrated that the increases in the ratio of out-of-network spending to total outpatient spending were not due primarily to the opioid epidemic. Prior to MHPAEA, the ratio of out-of-network spending to total outpatient spending was declining for non-BH, MH, and SUD. Following MHPAEA, this declining trend continued for non-BH and MH, but the trend for SUD switched directions and began to increase quite substantially. These findings are consistent with McGinty et al.,[36] who found a similar shift to out-of-network spending following MHPAEA. We advanced her findings by exploring whether the opioid use epidemic was driving these differences by isolating the transition period for these findings and by examining the trends over a longer period of time.
We saw a positive and substantial increase in the level of out-of-network spending for non-OUD services, but no significant impact on the level of OUD services at the point of MHPAEA implementation. However, we saw a similar increase over time in the ratio of out-of-network spending to total outpatient spending for both OUD and non-OUD treatment categories. Further, our analysis of the transition period illustrates that the shift to out-of-network spending began well in advance of the implementation of the Interim Final Rules in 2011. These findings suggest the importance of further analyses of provider incentives for providing SUD services in-network versus out-of-network, as well as analyses to determine whether limited capacity or narrower insurer networks are driving these results.
Differential Impacts of MHPAEA on Enrollee Spending for Outpatient Visits for Those with SMI and OUD
Our subpopulation analyses found no impact of MHPAEA on enrollee spending for the SMI population group, suggesting that it continues to constrain cost sharing for those with SMI. The 1996 parity law applied to annual and lifetime limits for those with an MH condition. These findings suggest that the impact of that law on individuals with SMI, and the subsequent MHPAEA legislation, effectively constrained total out-of-pocket spending for both MH and SUD services. We also can assume that the continued patterns of decreased out-of-network spending for those with an MH condition also kept out-of-pocket spending in check for this population.
However, for those with OUD, we observed higher enrollee spending for SUD outpatient services. Perhaps more important, we found that enrollee spending for MH outpatient services among those with OUD also were positively affected post-MHPAEA. These findings suggest that the shift to out-of-network delivery of SUD care also extended to MH services among this population and could potentially be a barrier to care.
We Found No Evidence That Effects of MHPAEA Are Leveling Off Over Time
One methodological advantage of this study is that it extends the post-period to the third quarter of 2015, well beyond the point of other published studies in this area. Our analyses demonstrate that in the large employer-sponsored insurance market, the impact of parity, particularly on SUD outpatient services, is continuing to grow. The trend lines show no evidence that they are leveling off, and impact on these services is evident into 2015. The early focus of changes due to MHPAEA was on QTLs and FRs. This continuing impact into later years may be due to increasing monitoring and compliance with respect to NQTLs, as well as disclosure requirements over time.
Next Steps
Greater access to BH services due to MHPAEA has also resulted in increased spending. This increase in spending is driven primarily by this increased utilization of services. Although spending for SUD services increased substantially, it is important to note that use of SUD services is a small fraction of overall BH service use. Because the effects on spending for MH outpatient services were very moderate, the effects of an increase of SUD insurer spending on overall insurer spending should not be a significant policy concern.
What is important to address and requires further analysis is the dramatic shift toward out-of-network providers for SUD services. Future research should investigate the reasons for this shift and the implication that SUD provider networks are inadequate. Patients may find it increasingly difficult to find in-network providers. Important questions include whether these patterns suggest provider shortages or use of more narrow provider networks by insurers following parity. We also need a better understanding of provider incentives for in-network versus out-of-network SUD services. It will be important to consider whether the rates that insurers pay are insufficient to attract providers to accept insurance. Qualitative and quantitative work is needed to understand why SUD providers opt out of insurance networks.
Similarly, future analyses need to consider why parity has increased out-of-pocket spending for SUD services. Our results suggest that this is due primarily to increased service use and that parity did not increase the average amount paid per visit. Yet general health care trends, for example, through increased use of high-deductible plans, have trended toward higher out-of-pocket spending. More research is needed on the additional burden of the out-of-pocket spending attributed to the increased service use that parity has facilitated, particularly for OUDs to assess whether this cost sharing is a barrier to adequate receipt of SUD treatment.
The following are some next steps for future research:
-
More research is needed on insurer SUD networks, including SUD provider decision making, to better understand the shift to out-of-network spending for SUD outpatient services.
-
Further analysis of the impact of MHPAEA on utilization and spending outcomes, stratified across in-network and out-of-network services is needed.
-
Next steps also could include a deeper dive to examine the impact of MHPAEA on isolated outcomes of interest beyond outpatient services, such as utilization and spending on prescription drugs for SUD.
-
This research focused on large employer-sponsored insurance; it is important to investigate the impact of parity laws on other types of private insurance and other payers such as Medicaid.
APPENDIX A: Definitions of Acronyms and Abbreviations
| Acronym | Definition |
|---|---|
| ASAM | American Society of Addiction Medicine |
| ASPE | HHS Office of the Assistant Secretary for Planning and Evaluation |
| AUD | Alcohol Use Disorder |
| BH | Behavioral Health |
| CCAE | Truven Health MarketScan® Commercial Claims and Encounters |
| CCS | Clinical Classifications Softward |
| ED | Emergency Department |
| FIL | Buccal Film |
| FR | Financial Requirement |
| GDP | Gross Domestic Product |
| GER | Glutealextended Release |
| HHS | U.S. Department of Health and Human Services |
| ICD-9-CM | International Classification of Diseases, 9th Revision, Clinical Modification |
| IM | Intramuscular |
| ITS | Interrupted Time Series |
| MAT | Medication-Assisted Treatment |
| MH | Mental Health |
| MHPAEA | Paul Wellstone and Pete Domenici Mental Health Parity and Addiction Equity Act of 2008 |
| MM | Mucous Membrane |
| NDC | National Drug Code |
| NQTL | Non-Quantitative Treatment Limit |
| OUD | Opioid Use Disorder |
| QTL | Quantitative Treatment Limit |
| SL | Sublingual |
| SMI | Serious Mental Illness |
| SUD | Substance Use Disorder |
| TAB | Tablet |
APPENDIX B: Methods
Introduction
The purpose of this appendix is to provide additional details on the methodology and analytic approach used in the study to obtain the results presented in the main section of the report. This includes details on specific codes used in data from the MarketScan CCAE Database, such as International Classification of Diseases, Ninth Revision, Clinical Modification (ICD-9-CM) codes used to identify diagnosis groups, and additional detail on the theoretical framework and regressions tests.
In Appendix E, we provide details on our decision process that led to the report's focus on outpatient services. We initially performed a broad set of descriptive analyses on yearly outcomes for the full set of service categories. From our initial survey of trends across all service categories and from simple regression analyses, the greatest change in use and spending was occurring in the outpatient service category, in correspondence with parity's implementation time frame. In the simple regression analyses, we statistically tested the significance of parity's impact in the annual outcomes using a basic ITS regression model with a linear time trend, parity indicator, and parity*year interaction term. Using a summarized table of all outcomes, we found that the clearest indication of impacts from parity appeared to be occurring in the outpatient service category, leading us to focus on outpatient services for our monthly descriptive and regression analyses.
Diagnosis Groups
For outpatient BH services, we relied on ICD-9-CM diagnosis codes. In the outpatient claims data, there are four fields that a physician or service provider can use to indicate a diagnosis related to the service claim. None of the fields is designated as the primary diagnosis. Therefore, we are unable to know which diagnosis of the possible four listed is the primary diagnosis being treated; for this reason, we use "any listed" diagnosis to determine the diagnosis group. This means that if any of the outpatient diagnosis fields has a MH or SUD diagnosis code, we identify the outpatient service as a BH service. We based MH and SUD diagnosis codes on HHS Agency for Healthcare Quality and Research Clinical Classifications Software (CCS) categories, with minor modifications. For example, we did not include diagnosis codes from the CCS category 653, Delirium, dementia, amnestic and other cognitive disorders. Table B1 contains the list of CCS categories that form the basis of the MH and SUD diagnosis groups. A full list of ICD-9-CM codes used to define the MH and SUD diagnosis groups is available in Appendix C. The outpatient non-BH diagnosis group then was defined by the lack of a MH or SUD diagnosis code on the service claim. We used this strategy of identifying BH services and non-BH services in numerous past studies.[37, 38]
| TABLE B1. MH, SUD, and Non-BH Diagnosis Group Definitions | ||
|---|---|---|
| Diagnosis Group | Description | Code |
| Mental Health (MH) | Includes ICD-9-CM codes from the following CCS categories: Adjustment disorders; anxiety disorders; attention-deficit, conduct and disruptive behavior disorders; developmental disorders; autism and other childhood development disorders; impulse control disorders; mood disorders; personality disorders; schizophrenia and other psychotic disorders; suicide and intentional self-inflicted injury; screening and history of MH; miscellaneous MH conditions | See Appendix C for a full list of ICD-9-CM codes used |
| Substance Use Disorder (SUD) | Includes ICD-9-CM codes from the following CCS categories: alcohol-related disorders; substance-related disorders, including OUD | See Appendix C for a full list of ICD-9-CM codes used |
| Non-Behavioral Health (Non-BH) | Includes all ICD-9-CM codes NOT used to identify MH and SUD diagnosis groups | All ICD-9-CM not Used for MH or SUD |
In addition to examining the MH, SUD, and non-BH diagnosis groups, we further classified the SUD diagnosis group into two groups: (1) SUD diagnoses that relate to OUD; and (2) SUD diagnoses that do NOT relate to OUD. Table B2 lists the ICD-9-CM diagnosis codes used to identify outpatient services that fall into the OUD diagnosis group. Outpatient service claims with any listed OUD ICD-9-CM diagnosis code were classified into the OUD diagnosis group, whereas all other outpatient services originally identified as being SUD were classified into the non-OUD SUD diagnosis group. By splitting the SUD diagnosis group into OUD and non-OUD diagnosis groups, we were able to assess the impacts of parity on use and spending specifically for opioid-related SUD treatments.
| TABLE B2. OUD and Non-OUD SUD Diagnosis Group Definitions | ||
|---|---|---|
| Diagnosis Group | Description | Code |
| Opioid Use Disorder (OUD) Substance Use Disorder (SUD) | Opioid dependence-unspec | 30400 |
| Opioid dependence-contin | 30401 | |
| Opioid dependence-episod | 30402 | |
| Opioid type dependence in remission | 30403 | |
| Opioid/other dep-unspec | 30470 | |
| Opioid/other dep-contin | 30471 | |
| Opioid/other dep-episod | 30472 | |
| Opioid w/other drug dependence in remission | 30473 | |
| Opioid abuse-unspec | 30550 | |
| Opioid abuse-continuous | 30551 | |
| Opioid abuse-episodic | 30552 | |
| Opioid abuse in remission | 30553 | |
| Poisoning by opium (alkaloids), unspecified | 96500 | |
| Poisoning by heroin | 96501 | |
| Poisoning by methadone | 96502 | |
| Poisoning by other opiates | 96509 | |
| Accidental poisoning by heroin | E8500 | |
| Accidental poisoning by methadone | E8501 | |
| Accidental poisoning by other opiates and related narcotics | E8502 | |
| Undetermined cause poisoning by opiates | E9800 | |
| Non-Opioid Use Disorder (Non-OUD) Substance Use Disorder (SUD) | Includes all SUD diagnosis codes, except for the OUD codes | See Appendix C for a full list of ICD-9-CM codes used. |
Subpopulation Definitions
In addition to looking at the full population's use and spending for MH and SUD outpatient services, we examined overall MH and SUD service use and spending for two subpopulations: individuals with a SMI diagnosis and individuals with an OUD diagnosis. Our subpopulation analysis is different from our analysis of the full population in several ways. First, in our subpopulation analysis, we limited our analysis to the services used by the specific subpopulation identified. Thus, for the subpopulation SMI, we first identified the individuals in the MarketScan data that met our criteria for having an SMI, and then we proceeded with our comparison of MH, SUD, and non-BH use and spending trends ONLY for that subpopulation. Second, in contrast to the analysis of the full population in which we focused on outpatient services only, we included the full set of service categories in the subpopulation analysis. This means that our analysis of spending and use trends as affected by parity included, in addition to outpatient services, emergency department visits, inpatient admissions, prescription drug fills, and laboratory and radiology services. The SMI and OUD subpopulations are two of the most vulnerable groups of individuals with either an MH or SUD diagnosis. In this subpopulation analysis, we therefore were able to assess the impact of parity on each group's full use of MH and SUD services.
To define the SMI subpopulation, we used a strategy of requiring either one inpatient admission or two outpatient visits with a diagnosis from the following list of ICD-9-CM codes (also see Table B3). The ICD-9-CM codes used for identifying the SMI subpopulation were 295.x, 296.24, 296.34, 296.4, 296.5, 296.6, 296.7, and 296.8.
For the OUD population, we used a more complex strategy that used diagnosis codes, prescription drug fills, and selected service administration codes. We used additional identifiers for the OUD subpopulation to capture individuals receiving treatment for OUD (e.g., buprenorphine prescription fill for OUD treatment) who may not have been given an associated diagnosis. In other unpublished work, we have found that relying only on a diagnosis code for OUD population identification will miss some individuals who clearly are receiving treatment for OUD. We can only speculate why individuals who are receiving OUD treatment are not always given an OUD diagnosis; however, it does appear that this issue is less prominent in more recent years. We believe our method for identifying individuals with OUD is robust and alleviates worries of missing individuals in this subpopulation.
There were three possible ways that an individual could be identified as part of the OUD subpopulation. First, we identified individuals who had either a primary inpatient diagnosis or two any listed outpatient diagnoses using the same list of ICD-9-CM codes listed in Table B2. Second, we identified individuals who had a prescription drug fill either for certain buprenorphine prescriptions that are primarily used for OUD treatment or for naltrexone prescriptions. A full list of National Drug Codes (NDCs) for the buprenorphine and naltrexone prescriptions is included in Appendix D. Third, although buprenorphine is received most often through a physician prescription, samples also may be given by the physician. In the latter case, a service administration code can be used that will appear in the outpatient service claim. Individuals receiving methadone treatment also can be identified through outpatient service claims by a methadone service administration procedure code. Outpatient buprenorphine and methadone service administration codes are listed in Table B4.
| TABLE B3. SMI and OUD Subpopulation Definitions | ||
|---|---|---|
| Subpopulation | Definition | Code Notes |
| Serious Mental Illness (SMI) | Serious mental illness (includes schizophrenia disorders, delusional psychoses and other psychotic disorders, schizotypal or borderline personality disorders, bipolar disorders, and major depressive disorders) | All 295 ICD-9 codes, 296.4, 296.5, 296.6, 296.7, 296.8, 296.24, 296.34 |
| Opioid Use Disorder (OUD) | Opioid use disorder | Enrollees who have either: (1) 2 outpatient services with any listed OUD diagnosis, or (2) 1 inpatient service with any listed OUD diagnosis, or (3) any prescription from list of NDCs in outpatient drug file, or (4) methadone service administration procedure code in outpatient file, or (5) buprenorphine and naltrexone service administration procedure code in outpatient file |
It is important to note that when identifying subpopulations, all claims and prescription drug data available within the full study period were used for individuals who met the general population criteria.
| TABLE B4. Buprenorphine and Methadone Service Administration Codes | ||
|---|---|---|
| Category | Description | Code |
| Outpatient methadone | Methadone administration oral and injection for MarketScan CCAE outpatient data | S0109, H0020, J230 |
| Outpatient buprenorphine | Buprenorphine/naloxone oral administration for MarketScan CCAE outpatient data | J0571, J0572, J0573, J0574, J0575 |
Service Categories: Outpatient and Other Service Category Definitions
Outpatient Service Category
The outpatient service category that was the primary focus of the main results included a wide range of service settings and levels of treatment. In fact, the only services that were excluded from the outpatient service category were inpatient admissions, emergency department visits, and laboratory and radiology services. Thus, the outpatient service category included intensive outpatient services, partial hospitalizations, and residential treatment services. In MarketScan data, inpatient admissions are identified by the existence of a room and board revenue code. We identified services all related to an inpatient admission and placed them into a separate inpatient analytic file. In the outpatient analytic file, we identified emergency department visits using the last two digits of a MarketScan variable called SVCSCAT that identifies the detailed service type. Only emergency department visits that ended in a discharge from the emergency department rather than an admission to the hospital were included in the MarketScan outpatient analytic file. Emergency department visits that led to an inpatient admission were included in the inpatient analytic file. Other than treat-and-release emergency department visits, it was important to identify laboratory and radiology services, which often do not contain diagnosis codes and therefore do not differentiate which services are related to BH. We identified laboratory and radiology services using the MarketScan variable STDPLAC, which identifies the place of service. We also placed prescription drug claims in a separate analytic file, similar to inpatient admissions. To identify the set of services included in the outpatient service category, we used the MarketScan outpatient file and excluded emergency department visits and laboratory and radiology services (see Table B5).
Other Service Categories
Although we decided to focus on the outpatient service category for our main analysis, including monthly descriptive and regression analyses, we did examine the full set of service categories in a preliminary analysis on annual spending and use trends. Results from this preliminary analysis are discussed in Appendix E. The full set of service category definitions are detailed in Table B5.
| TABLE B5. Service Category Definitions | ||
|---|---|---|
| Category | Definition | Code Notes |
| All services | Includes all service categories, prescription drugs, and lab/radiology claims | Inpatient, outpatient, and outpatient drug claims files |
| Total inpatient | Inpatient stays | Inpatient file; units defined as 1 per stay |
| Inpatient, with preceding EDa | Inpatient stays preceded by an ED visit | Inpatient file; units defined as 1 per stay |
| Inpatient, no preceding EDa | Inpatient stays with no preceding ED visit | Inpatient file; units defined as 1 per stay. |
| Outpatient | Outpatient visits (excludes ED visits and lab and radiology) | Outpatient file; defined using detailed service category (SVCSCAT) and place of service (STDPLAC) variables; units defined as 1 per claim |
| ED visits | Treat-and-release, meaning the visit does not result in an inpatient admission | Outpatient file; defined using detailed service category (SVCSCAT); units defined as 1 per day |
| Pharmacy | Prescription drugs | Outpatient drug claims file; therapeutic class 69-77; units defined as 1 per claim |
| Lab and radiology | Lab tests (e.g., blood work) and radiology | Outpatient file; defined using place of service variable STDPLAC; units defined as 1 per claim |
|
||
When identifying which inpatient admissions were BH (MH or SUD), we used any listed diagnosis field out of 16 total possible fields in the MarketScan inpatient analytic file. Similarly, for emergency department visits we used any listed diagnosis out of the four possible fields in the outpatient analytic file. Because laboratory and radiology services often do not have populated diagnosis fields, we categorized all laboratory and radiology services as non-BH.
For prescription drug claims, we used a MarketScan variable indicating the therapeutic class to identify MH prescription drugs and a list of NDC codes to identify SUD prescription drugs. The following is a list of MH therapeutic classes: antidepressants, antipsychotics, stimulants, stimulants non-amphetamine, anxiolytic/sedative/hypnotics (barbituates, benzodiazepines, not elsewhere classified), antimanic agents not elsewhere classified, and certain central nervous system agents.
For SUD medications, the full list of NDC codes is detailed in Appendix F.
The methodology used to categorize service categories resulted in mutually exclusive service categories whereby each service or prescription drug fill fell into one service category only. Similarly, services and prescription drug fills were identified as either BH or non-BH.
Spending Decomposition Framework
We used a spending decomposition framework in this report as a theoretical structure to analyze the spending and use outcomes. A spending decomposition framework uses the following spending decomposition equation to break health spending per enrollee into the relevant components that drive spending changes. We expressed the spending decomposition equation in terms of BH spending per enrollee:
BH spending per enrollee [spending] =
(% enrollees using BH services) [access] × (average units used per user) [intensity of service utilization] × (average cost per unit) [reimbursement]
In addition to the three components that make up spending in this equation, another factor that could be incorporated into the spending decomposition framework is whether services used are in-network or out-of-network. For insurers, prices of in-network services are contractually negotiated and generally are lower than those charged by out-of-network providers. For enrollees, out-of-network services often impose higher out-of-pocket cost sharing incentivizing enrollees to use in-network providers.
Interrupted Time Series Regression First Order Serial Correlation Tests
First Order Serial Correlation
One important statistical issue with ITS regression is serial correlation. We tested for first order serial correlation using a Durbin-Watson test statistic for all regressions. Test statistics across various ITS regressions showed some evidence of first order serial correlation, leading us to estimate the full set of ITS regressions correcting for first order series correlation. Comparing results of coefficients, we found that coefficient signs and magnitudes were very similar for all regression results. We therefore opted to present results that do not correct for first order serial correlation.
APPENDIX C: Mental Health and Substance Use Disorder Diagnosis Codes
| ICD-9-CM Diagnosis Code | Description of ICD-9-CM Diagnosis Code | MH or SUD Diagnosis Group | Related CCS Category |
|---|---|---|---|
| 3090 | Adjustment disorder with depressed mood | MH | 650 Adjustment disorders |
| 3091 | Prolonged depressive reaction | MH | 650 Adjustment disorders |
| 30922 | Emancipation disorder of adolescence and early adult life | MH | 650 Adjustment disorders |
| 30923 | Specific academic or work inhibition | MH | 650 Adjustment disorders |
| 30924 | Adjustment disorder with anxiety | MH | 650 Adjustment disorders |
| 30928 | Adjustment disorder with mixed anxiety and depressed mood | MH | 650 Adjustment disorders |
| 30929 | Other adjustment reactions with predominant disturbance of other emotions | MH | 650 Adjustment disorders |
| 3093 | Adjustment disorder with disturbance of conduct | MH | 650 Adjustment disorders |
| 3094 | Adjustment disorder with mixed disturbance of emotions and conduct | MH | 650 Adjustment disorders |
| 30982 | Adjustment reaction with physical symptoms | MH | 650 Adjustment disorders |
| 30983 | Adjustment reaction with withdrawal | MH | 650 Adjustment disorders |
| 30989 | Other specified adjustment reactions | MH | 650 Adjustment disorders |
| 3099 | Unspecified adjustment reaction | MH | 650 Adjustment disorders |
| 30000 | Anxiety state, unspecified | MH | 650 Adjustment disorders |
| 30001 | Panic disorder without agoraphobia | MH | 650 Adjustment disorders |
| 30002 | Generalized anxiety disorder | MH | 650 Adjustment disorders |
| 30009 | Other anxiety states | MH | 650 Adjustment disorders |
| 30010 | Hysteria, unspecified | MH | 650 Adjustment disorders |
| 30020 | Phobia, unspecified | MH | 650 Adjustment disorders |
| 30021 | Agoraphobia with panic disorder | MH | 650 Adjustment disorders |
| 30022 | Agoraphobia without mention of panic attacks | MH | 650 Adjustment disorders |
| 30023 | Social phobia | MH | 650 Adjustment disorders |
| 30029 | Other isolated or specific phobias | MH | 650 Adjustment disorders |
| 3003 | Obsessive-compulsive disorders | MH | 650 Adjustment disorders |
| 3005 | Neurasthenia | MH | 650 Adjustment disorders |
| 30089 | Other somatoform disorders | MH | 650 Adjustment disorders |
| 3009 | Unspecified non-psychotic mental disorder | MH | 650 Adjustment disorders |
| 3080 | Predominant disturbance of emotions | MH | 650 Adjustment disorders |
| 3081 | Predominant disturbance of consciousness | MH | 650 Adjustment disorders |
| 3082 | Predominant psychomotor disturbance | MH | 650 Adjustment disorders |
| 3083 | Other acute reactions to stress | MH | 650 Adjustment disorders |
| 3084 | Mixed disorders as reaction to stress | MH | 650 Adjustment disorders |
| 3089 | Unspecified acute reaction to stress | MH | 650 Adjustment disorders |
| 30981 | Posttraumatic stress disorder | MH | 650 Adjustment disorders |
| 3130 | Overanxious disorder specific to childhood and adolescence | MH | 650 Adjustment disorders |
| 3131 | Misery and unhappiness disorder specific to childhood and adolescence | MH | 650 Adjustment disorders |
| 31321 | Shyness disorder of childhood | MH | 650 Adjustment disorders |
| 31322 | Introverted disorder of childhood | MH | 650 Adjustment disorders |
| 3133 | Relationship problems specific to childhood and adolescence | MH | 650 Adjustment disorders |
| 31382 | Identity disorder of childhood or adolescence | MH | 650 Adjustment disorders |
| 31383 | Academic underachievement disorder of childhood or adolescence | MH | 650 Adjustment disorders |
| 30000 | Anxiety state, unspecified | MH | 651 Anxiety disorders |
| 30001 | Panic disorder without agoraphobia | MH | 651 Anxiety disorders |
| 30002 | Generalized anxiety disorder | MH | 651 Anxiety disorders |
| 30009 | Other anxiety states | MH | 651 Anxiety disorders |
| 30010 | Hysteria, unspecified | MH | 651 Anxiety disorders |
| 30020 | Phobia, unspecified | MH | 651 Anxiety disorders |
| 30021 | Agoraphobia with panic disorder | MH | 651 Anxiety disorders |
| 30022 | Agoraphobia without mention of panic attacks | MH | 651 Anxiety disorders |
| 30023 | Social phobia | MH | 651 Anxiety disorders |
| 30029 | Other isolated or specific phobias | MH | 651 Anxiety disorders |
| 3003 | Obsessive-compulsive disorders | MH | 651 Anxiety disorders |
| 3005 | Neurasthenia | MH | 651 Anxiety disorders |
| 30089 | Other somatoform disorders | MH | 651 Anxiety disorders |
| 3009 | Unspecified non-psychotic mental disorder | MH | 651 Anxiety disorders |
| 3080 | Predominant disturbance of emotions | MH | 651 Anxiety disorders |
| 3081 | Predominant disturbance of consciousness | MH | 651 Anxiety disorders |
| 3082 | Predominant psychomotor disturbance | MH | 651 Anxiety disorders |
| 3083 | Other acute reactions to stress | MH | 651 Anxiety disorders |
| 3084 | Mixed disorders as reaction to stress | MH | 651 Anxiety disorders |
| 3089 | Unspecified acute reaction to stress | MH | 651 Anxiety disorders |
| 30981 | Posttraumatic stress disorder | MH | 651 Anxiety disorders |
| 3130 | Overanxious disorder specific to childhood and adolescence | MH | 651 Anxiety disorders |
| 3131 | Misery and unhappiness disorder specific to childhood and adolescence | MH | 651 Anxiety disorders |
| 31321 | Shyness disorder of childhood | MH | 651 Anxiety disorders |
| 31322 | Introverted disorder of childhood | MH | 651 Anxiety disorders |
| 3133 | Relationship problems specific to childhood and adolescence | MH | 651 Anxiety disorders |
| 31382 | Identity disorder of childhood or adolescence | MH | 651 Anxiety disorders |
| 31383 | Academic underachievement disorder of childhood or adolescence | MH | 651 Anxiety disorders |
| 29384 | Anxiety disorder in conditions classified elsewhere | MH | 651 Anxiety disorders |
| 31200 | Undersocialized conduct disorder, aggressive type, unspecified | MH | 652 Attention-deficit, conduct, and disruptive behavior disorders |
| 31201 | Undersocialized conduct disorder, aggressive type, mild | MH | 652 Attention-deficit, conduct, and disruptive behavior disorders |
| 31202 | Undersocialized conduct disorder, aggressive type, moderate | MH | 652 Attention-deficit, conduct, and disruptive behavior disorders |
| 31203 | Undersocialized conduct disorder, aggressive type, severe | MH | 652 Attention-deficit, conduct, and disruptive behavior disorders |
| 31210 | Undersocialized conduct disorder, unaggressive type, unspecified | MH | 652 Attention-deficit, conduct, and disruptive behavior disorders |
| 31211 | Undersocialized conduct disorder, unaggressive type, mild | MH | 652 Attention-deficit, conduct, and disruptive behavior disorders |
| 31212 | Undersocialized conduct disorder, unaggressive type, moderate | MH | 652 Attention-deficit, conduct, and disruptive behavior disorders |
| 31213 | Undersocialized conduct disorder, unaggressive type, severe | MH | 652 Attention-deficit, conduct, and disruptive behavior disorders |
| 31220 | Socialized conduct disorder, unspecified | MH | 652 Attention-deficit, conduct, and disruptive behavior disorders |
| 31221 | Socialized conduct disorder, mild | MH | 652 Attention-deficit, conduct, and disruptive behavior disorders |
| 31222 | Socialized conduct disorder, moderate | MH | 652 Attention-deficit, conduct, and disruptive behavior disorders |
| 31223 | Socialized conduct disorder, severe | MH | 652 Attention-deficit, conduct, and disruptive behavior disorders |
| 3124 | Mixed disturbance of conduct and emotions | MH | 652 Attention-deficit, conduct, and disruptive behavior disorders |
| 3128 | Other specified disturbances of conduct, not elsewhere classified | MH | 652 Attention-deficit, conduct, and disruptive behavior disorders |
| 31281 | Conduct disorder, childhood onset type | MH | 652 Attention-deficit, conduct, and disruptive behavior disorders |
| 31282 | Conduct disorder, adolescent onset type | MH | 652 Attention-deficit, conduct, and disruptive behavior disorders |
| 31289 | Other conduct disorder | MH | 652 Attention-deficit, conduct, and disruptive behavior disorders |
| 3129 | Unspecified disturbance of conduct | MH | 652 Attention-deficit, conduct, and disruptive behavior disorders |
| 31381 | Oppositional defiant disorder | MH | 652 Attention-deficit, conduct, and disruptive behavior disorders |
| 31400 | Attention-deficit disorder without mention of hyperactivity | MH | 652 Attention-deficit, conduct, and disruptive behavior disorders |
| 31401 | Attention-deficit disorder with hyperactivity | MH | 652 Attention-deficit, conduct, and disruptive behavior disorders |
| 3141 | Hyperkinesis with developmental delay | MH | 652 Attention-deficit, conduct, and disruptive behavior disorders |
| 3142 | Hyperkinetic conduct disorder | MH | 652 Attention-deficit, conduct, and disruptive behavior disorders |
| 3148 | Other specified manifestations of hyperkinetic syndrome | MH | 652 Attention-deficit, conduct, and disruptive behavior disorders |
| 3149 | Unspecified hyperkinetic syndrome | MH | 652 Attention-deficit, conduct, and disruptive behavior disorders |
| 2900 | Senile dementia, uncomplicated | Non-BH | 653 Delirium, dementia, and amnestic and other cognitive disorders |
| 29010 | Presenile dementia, uncomplicated | Non-BH | 653 Delirium, dementia, and amnestic and other cognitive disorders |
| 29011 | Presenile dementia with delirium | Non-BH | 653 Delirium, dementia, and amnestic and other cognitive disorders |
| 29012 | Presenile dementia with delusional features | Non-BH | 653 Delirium, dementia, and amnestic and other cognitive disorders |
| 29013 | Presenile dementia with depressive features | Non-BH | 653 Delirium, dementia, and amnestic and other cognitive disorders |
| 29020 | Senile dementia with delusional features | Non-BH | 653 Delirium, dementia, and amnestic and other cognitive disorders |
| 29021 | Senile dementia with depressive features | Non-BH | 653 Delirium, dementia, and amnestic and other cognitive disorders |
| 2903 | Senile dementia with delirium | Non-BH | 653 Delirium, dementia, and amnestic and other cognitive disorders |
| 29040 | Vascular dementia, uncomplicated | Non-BH | 653 Delirium, dementia, and amnestic and other cognitive disorders |
| 29041 | Vascular dementia, with delirium | Non-BH | 653 Delirium, dementia, and amnestic and other cognitive disorders |
| 29042 | Vascular dementia, with delusions | Non-BH | 653 Delirium, dementia, and amnestic and other cognitive disorders |
| 29043 | Vascular dementia, with depressed mood | Non-BH | 653 Delirium, dementia, and amnestic and other cognitive disorders |
| 2908 | Other specified senile psychotic conditions | Non-BH | 653 Delirium, dementia, and amnestic and other cognitive disorders |
| 2909 | Unspecified senile psychotic condition | Non-BH | 653 Delirium, dementia, and amnestic and other cognitive disorders |
| 2930 | Delirium due to conditions classified elsewhere | Non-BH | 653 Delirium, dementia, and amnestic and other cognitive disorders |
| 2931 | Subacute delirium | Non-BH | 653 Delirium, dementia, and amnestic and other cognitive disorders |
| 2940 | Amnestic disorder in conditions classified elsewhere | Non-BH | 653 Delirium, dementia, and amnestic and other cognitive disorders |
| 29410 | Dementia in conditions classified elsewhere without behavioral disturbance | Non-BH | 653 Delirium, dementia, and amnestic and other cognitive disorders |
| 29411 | Dementia in conditions classified elsewhere with behavioral disturbance | Non-BH | 653 Delirium, dementia, and amnestic and other cognitive disorders |
| 29420 | Dementia, unspecified, without behavioral disturbance | Non-BH | 653 Delirium, dementia, and amnestic and other cognitive disorders |
| 29421 | Dementia, unspecified, with behavioral disturbance | Non-BH | 653 Delirium, dementia, and amnestic and other cognitive disorders |
| 2948 | Other persistent mental disorders due to conditions classified elsewhere | Non-BH | 653 Delirium, dementia, and amnestic and other cognitive disorders |
| 2949 | Unspecified persistent mental disorders due to conditions classified elsewhere | Non-BH | 653 Delirium, dementia, and amnestic and other cognitive disorders |
| 3310 | Alzheimer's disease | Non-BH | 653 Delirium, dementia, and amnestic and other cognitive disorders |
| 3311 | Frontotemporal dementia | Non-BH | 653 Delirium, dementia, and amnestic and other cognitive disorders |
| 33111 | Pick's disease | Non-BH | 653 Delirium, dementia, and amnestic and other cognitive disorders |
| 33119 | Other frontotemporal dementia | Non-BH | 653 Delirium, dementia, and amnestic and other cognitive disorders |
| 3312 | Senile degeneration of brain | Non-BH | 653 Delirium, dementia, and amnestic and other cognitive disorders |
| 33182 | Dementia with lewy bodies | Non-BH | 653 Delirium, dementia, and amnestic and other cognitive disorders |
| 797 | Senility without mention of psychosis | Non-BH | 653 Delirium, dementia, and amnestic and other cognitive disorders |
| 3100 | Frontal lobe syndrome | Non-BH | 653 Delirium, dementia, and amnestic and other cognitive disorders |
| 3102 | Postconcussion syndrome | Non-BH | 653 Delirium, dementia, and amnestic and other cognitive disorders |
| 3108 | Other specified non-psychotic mental disorders following organic brain damage | Non-BH | 653 Delirium, dementia, and amnestic and other cognitive disorders |
| 31081 | Pseudobulbar affect | Non-BH | 653 Delirium, dementia, and amnestic and other cognitive disorders |
| 31089 | Other specified non-psychotic mental disorders following organic brain damage | Non-BH | 653 Delirium, dementia, and amnestic and other cognitive disorders |
| 3109 | Unspecified non-psychotic mental disorder following organic brain damage | Non-BH | 653 Delirium, dementia, and amnestic and other cognitive disorders |
| 3070 | Adult onset fluency disorder | MH | 654 Developmental disorders |
| 3079 | Other and unspecified special symptoms or syndromes, not elsewhere classified | MH | 654 Developmental disorders |
| 31500 | Developmental reading disorder, unspecified | MH | 654 Developmental disorders |
| 31501 | Alexia | MH | 654 Developmental disorders |
| 31502 | Developmental dyslexia | MH | 654 Developmental disorders |
| 31509 | Other specific developmental reading disorder | MH | 654 Developmental disorders |
| 3151 | Mathematics disorder | MH | 654 Developmental disorders |
| 3152 | Other specific developmental learning difficulties | MH | 654 Developmental disorders |
| 31531 | Expressive language disorder | MH | 654 Developmental disorders |
| 31532 | Mixed receptive-expressive language disorder | MH | 654 Developmental disorders |
| 31534 | Speech and language developmental delay due to hearing loss | MH | 654 Developmental disorders |
| 31535 | Childhood onset fluency disorder | MH | 654 Developmental disorders |
| 31539 | Other developmental speech or language disorder | MH | 654 Developmental disorders |
| 3154 | Developmental coordination disorder | MH | 654 Developmental disorders |
| 3155 | Mixed development disorder | MH | 654 Developmental disorders |
| 3158 | Other specified delays in development | MH | 654 Developmental disorders |
| 3159 | Unspecified delay in development | MH | 654 Developmental disorders |
| 317 | Mild intellectual disabilities | MH | 654 Developmental disorders |
| 3180 | Moderate intellectual disabilities | MH | 654 Developmental disorders |
| 3181 | Severe intellectual disabilities | MH | 654 Developmental disorders |
| 3182 | Profound intellectual disabilities | MH | 654 Developmental disorders |
| 319 | Unspecified intellectual disabilities | MH | 654 Developmental disorders |
| V400 | Mental and behavioral problems with learning | MH | 654 Developmental disorders |
| V401 | Mental and behavioral problems with communication [including speech] | MH | 654 Developmental disorders |
| 29900 | Autistic disorder, current or active state | MH | 655 Disorders usually diagnosed in infancy, childhood, or adolescence |
| 29901 | Autistic disorder, residual state | MH | 655 Disorders usually diagnosed in infancy, childhood, or adolescence |
| 29910 | Childhood disintegrative disorder, current or active state | MH | 655 Disorders usually diagnosed in infancy, childhood, or adolescence |
| 29911 | Childhood disintegrative disorder, residual state | MH | 655 Disorders usually diagnosed in infancy, childhood, or adolescence |
| 29980 | Other specified pervasive developmental disorders, current or active state | MH | 655 Disorders usually diagnosed in infancy, childhood, or adolescence |
| 29981 | Other specified pervasive developmental disorders, residual state | MH | 655 Disorders usually diagnosed in infancy, childhood, or adolescence |
| 29990 | Unspecified pervasive developmental disorder, current or active state | MH | 655 Disorders usually diagnosed in infancy, childhood, or adolescence |
| 29991 | Unspecified pervasive developmental disorder, residual state | MH | 655 Disorders usually diagnosed in infancy, childhood, or adolescence |
| 30720 | Tic disorder, unspecified | MH | 655 Disorders usually diagnosed in infancy, childhood, or adolescence |
| 30721 | Transient tic disorder | MH | 655 Disorders usually diagnosed in infancy, childhood, or adolescence |
| 30722 | Chronic motor or vocal tic disorder | MH | 655 Disorders usually diagnosed in infancy, childhood, or adolescence |
| 30723 | Tourette's disorder | MH | 655 Disorders usually diagnosed in infancy, childhood, or adolescence |
| 3073 | Stereotypic movement disorder | MH | 655 Disorders usually diagnosed in infancy, childhood, or adolescence |
| 3076 | Enuresis | MH | 655 Disorders usually diagnosed in infancy, childhood, or adolescence |
| 3077 | Encopresis | MH | 655 Disorders usually diagnosed in infancy, childhood, or adolescence |
| 30921 | Separation anxiety disorder | MH | 655 Disorders usually diagnosed in infancy, childhood, or adolescence |
| 31323 | Specific academic or work inhibition | MH | 655 Disorders usually diagnosed in infancy, childhood, or adolescence |
| 31389 | Other emotional disturbances of childhood or adolescence | MH | 655 Disorders usually diagnosed in infancy, childhood, or adolescence |
| 3139 | Unspecified emotional disturbance of childhood or adolescence | MH | 655 Disorders usually diagnosed in infancy, childhood, or adolescence |
| 31230 | Impulse control disorder, unspecified | MH | 656 Impulse control disorders, NEC |
| 31231 | Pathological gambling | MH | 656 Impulse control disorders, NEC |
| 31232 | Kleptomania | MH | 656 Impulse control disorders, NEC |
| 31233 | Pyromania | MH | 656 Impulse control disorders, NEC |
| 31234 | Intermittent explosive disorder | MH | 656 Impulse control disorders, NEC |
| 31235 | Isolated explosive disorder | MH | 656 Impulse control disorders, NEC |
| 31239 | Other disorders of impulse control | MH | 656 Impulse control disorders, NEC |
| 29600 | Bipolar I disorder, single manic episode, unspecified | MH | 657 Mood disorders |
| 29601 | Bipolar I disorder, single manic episode, mild | MH | 657 Mood disorders |
| 29602 | Bipolar I disorder, single manic episode, moderate | MH | 657 Mood disorders |
| 29603 | Bipolar I disorder, single manic episode, severe, without mention of psychotic behavior | MH | 657 Mood disorders |
| 29604 | Bipolar I disorder, single manic episode, severe, specified as with psychotic behavior | MH | 657 Mood disorders |
| 29605 | Bipolar I disorder, single manic episode, in partial or unspecified remission | MH | 657 Mood disorders |
| 29606 | Bipolar I disorder, single manic episode, in full remission | MH | 657 Mood disorders |
| 29610 | Manic affective disorder, recurrent episode, unspecified | MH | 657 Mood disorders |
| 29611 | Manic affective disorder, recurrent episode, mild | MH | 657 Mood disorders |
| 29612 | Manic affective disorder, recurrent episode, moderate | MH | 657 Mood disorders |
| 29613 | Manic affective disorder, recurrent episode, severe, without mention of psychotic behavior | MH | 657 Mood disorders |
| 29614 | Manic affective disorder, recurrent episode, severe, specified as with psychotic behavior | MH | 657 Mood disorders |
| 29615 | Manic affective disorder, recurrent episode, in partial or unspecified remission | MH | 657 Mood disorders |
| 29616 | Manic affective disorder, recurrent episode, in full remission | MH | 657 Mood disorders |
| 29620 | Major depressive affective disorder, single episode, unspecified | MH | 657 Mood disorders |
| 29621 | Major depressive affective disorder, single episode, mild | MH | 657 Mood disorders |
| 29622 | Major depressive affective disorder, single episode, moderate | MH | 657 Mood disorders |
| 29623 | Major depressive affective disorder, single episode, severe, without mention of psychotic behavior | MH | 657 Mood disorders |
| 29624 | Major depressive affective disorder, single episode, severe, specified as with psychotic behavior | MH | 657 Mood disorders |
| 29625 | Major depressive affective disorder, single episode, in partial or unspecified remission | MH | 657 Mood disorders |
| 29626 | Major depressive affective disorder, single episode, in full remission | MH | 657 Mood disorders |
| 29630 | Major depressive affective disorder, recurrent episode, unspecified | MH | 657 Mood disorders |
| 29631 | Major depressive affective disorder, recurrent episode, mild | MH | 657 Mood disorders |
| 29632 | Major depressive affective disorder, recurrent episode, moderate | MH | 657 Mood disorders |
| 29633 | Major depressive affective disorder, recurrent episode, severe, without mention of psychotic behavior | MH | 657 Mood disorders |
| 29634 | Major depressive affective disorder, recurrent episode, severe, specified as with psychotic behavior | MH | 657 Mood disorders |
| 29635 | Major depressive affective disorder, recurrent episode, in partial or unspecified remission | MH | 657 Mood disorders |
| 29636 | Major depressive affective disorder, recurrent episode, in full remission | MH | 657 Mood disorders |
| 29640 | Bipolar I disorder, most recent episode (or current) manic, unspecified | MH | 657 Mood disorders |
| 29641 | Bipolar I disorder, most recent episode (or current) manic, mild | MH | 657 Mood disorders |
| 29642 | Bipolar I disorder, most recent episode (or current) manic, moderate | MH | 657 Mood disorders |
| 29643 | Bipolar I disorder, most recent episode (or current) manic, severe, without mention of psychotic behavior | MH | 657 Mood disorders |
| 29644 | Bipolar I disorder, most recent episode (or current) manic, severe, specified as with psychotic behavior | MH | 657 Mood disorders |
| 29645 | Bipolar I disorder, most recent episode (or current) manic, in partial or unspecified remission | MH | 657 Mood disorders |
| 29646 | Bipolar I disorder, most recent episode (or current) manic, in full remission | MH | 657 Mood disorders |
| 29650 | Bipolar I disorder, most recent episode (or current) depressed, unspecified | MH | 657 Mood disorders |
| 29651 | Bipolar I disorder, most recent episode (or current) depressed, mild | MH | 657 Mood disorders |
| 29652 | Bipolar I disorder, most recent episode (or current) depressed, moderate | MH | 657 Mood disorders |
| 29653 | Bipolar I disorder, most recent episode (or current) depressed, severe, without mention of psychotic behavior | MH | 657 Mood disorders |
| 29654 | Bipolar I disorder, most recent episode (or current) depressed, severe, specified as with psychotic behavior | MH | 657 Mood disorders |
| 29655 | Bipolar I disorder, most recent episode (or current) depressed, in partial or unspecified remission | MH | 657 Mood disorders |
| 29656 | Bipolar I disorder, most recent episode (or current) depressed, in full remission | MH | 657 Mood disorders |
| 29660 | Bipolar I disorder, most recent episode (or current) mixed, unspecified | MH | 657 Mood disorders |
| 29661 | Bipolar I disorder, most recent episode (or current) mixed, mild | MH | 657 Mood disorders |
| 29662 | Bipolar I disorder, most recent episode (or current) mixed, moderate | MH | 657 Mood disorders |
| 29663 | Bipolar I disorder, most recent episode (or current) mixed, severe, without mention of psychotic behavior | MH | 657 Mood disorders |
| 29664 | Bipolar I disorder, most recent episode (or current) mixed, severe, specified as with psychotic behavior | MH | 657 Mood disorders |
| 29665 | Bipolar I disorder, most recent episode (or current) mixed, in partial or unspecified remission | MH | 657 Mood disorders |
| 29666 | Bipolar I disorder, most recent episode (or current) mixed, in full remission | MH | 657 Mood disorders |
| 2967 | Bipolar I disorder, most recent episode (or current) unspecified | MH | 657 Mood disorders |
| 29680 | Bipolar disorder, unspecified | MH | 657 Mood disorders |
| 29681 | Atypical manic disorder | MH | 657 Mood disorders |
| 29682 | Atypical depressive disorder | MH | 657 Mood disorders |
| 29689 | Other bipolar disorders | MH | 657 Mood disorders |
| 29690 | Unspecified episodic mood disorder | MH | 657 Mood disorders |
| 29699 | Other specified episodic mood disorder | MH | 657 Mood disorders |
| 3004 | Dysthymic disorder | MH | 657 Mood disorders |
| 311 | Depressive disorder, not elsewhere classified | MH | 657 Mood disorders |
| 29383 | Mood disorder in conditions classified elsewhere | MH | 657 Mood disorders |
| 3010 | Paranoid personality disorder | MH | 658 Personality disorders |
| 30110 | Affective personality disorder, unspecified | MH | 658 Personality disorders |
| 30111 | Chronic hypomanic personality disorder | MH | 658 Personality disorders |
| 30112 | Chronic depressive personality disorder | MH | 658 Personality disorders |
| 30113 | Cyclothymic disorder | MH | 658 Personality disorders |
| 30120 | Schizoid personality disorder, unspecified | MH | 658 Personality disorders |
| 30121 | Introverted personality | MH | 658 Personality disorders |
| 30122 | Schizotypal personality disorder | MH | 658 Personality disorders |
| 3013 | Explosive personality disorder | MH | 658 Personality disorders |
| 3014 | Obsessive-compulsive personality disorder | MH | 658 Personality disorders |
| 30150 | Histrionic personality disorder, unspecified | MH | 658 Personality disorders |
| 30151 | Chronic factitious illness with physical symptoms | MH | 658 Personality disorders |
| 30159 | Other histrionic personality disorder | MH | 658 Personality disorders |
| 3016 | Dependent personality disorder | MH | 658 Personality disorders |
| 3017 | Antisocial personality disorder | MH | 658 Personality disorders |
| 30181 | Narcissistic personality disorder | MH | 658 Personality disorders |
| 30182 | Avoidant personality disorder | MH | 658 Personality disorders |
| 30183 | Borderline personality disorder | MH | 658 Personality disorders |
| 30184 | Passive-aggressive personality | MH | 658 Personality disorders |
| 30189 | Other personality disorders | MH | 658 Personality disorders |
| 3019 | Unspecified personality disorder | MH | 658 Personality disorders |
| 29500 | Simple type schizophrenia, unspecified | MH | 659 Schizophrenia and other psychotic disorders |
| 29501 | Simple type schizophrenia, subchronic | MH | 659 Schizophrenia and other psychotic disorders |
| 29502 | Simple type schizophrenia, chronic | MH | 659 Schizophrenia and other psychotic disorders |
| 29503 | Simple type schizophrenia, subchronic with acute exacerbation | MH | 659 Schizophrenia and other psychotic disorders |
| 29504 | Simple type schizophrenia, chronic with acute exacerbation | MH | 659 Schizophrenia and other psychotic disorders |
| 29505 | Simple type schizophrenia, in remission | MH | 659 Schizophrenia and other psychotic disorders |
| 29510 | Disorganized type schizophrenia, unspecified | MH | 659 Schizophrenia and other psychotic disorders |
| 29511 | Disorganized type schizophrenia, subchronic | MH | 659 Schizophrenia and other psychotic disorders |
| 29512 | Disorganized type schizophrenia, chronic | MH | 659 Schizophrenia and other psychotic disorders |
| 29513 | Disorganized type schizophrenia, subchronic with acute exacerbation | MH | 659 Schizophrenia and other psychotic disorders |
| 29514 | Disorganized type schizophrenia, chronic with acute exacerbation | MH | 659 Schizophrenia and other psychotic disorders |
| 29515 | Disorganized type schizophrenia, in remission | MH | 659 Schizophrenia and other psychotic disorders |
| 29520 | Catatonic type schizophrenia, unspecified | MH | 659 Schizophrenia and other psychotic disorders |
| 29521 | Catatonic type schizophrenia, subchronic | MH | 659 Schizophrenia and other psychotic disorders |
| 29522 | Catatonic type schizophrenia, chronic | MH | 659 Schizophrenia and other psychotic disorders |
| 29523 | Catatonic type schizophrenia, subchronic with acute exacerbation | MH | 659 Schizophrenia and other psychotic disorders |
| 29524 | Catatonic type schizophrenia, chronic with acute exacerbation | MH | 659 Schizophrenia and other psychotic disorders |
| 29525 | Catatonic type schizophrenia, in remission | MH | 659 Schizophrenia and other psychotic disorders |
| 29530 | Paranoid type schizophrenia, unspecified | MH | 659 Schizophrenia and other psychotic disorders |
| 29531 | Paranoid type schizophrenia, subchronic | MH | 659 Schizophrenia and other psychotic disorders |
| 29532 | Paranoid type schizophrenia, chronic | MH | 659 Schizophrenia and other psychotic disorders |
| 29533 | Paranoid type schizophrenia, subchronic with acute exacerbation | MH | 659 Schizophrenia and other psychotic disorders |
| 29534 | Paranoid type schizophrenia, chronic with acute exacerbation | MH | 659 Schizophrenia and other psychotic disorders |
| 29535 | Paranoid type schizophrenia, in remission | MH | 659 Schizophrenia and other psychotic disorders |
| 29540 | Schizophreniform disorder, unspecified | MH | 659 Schizophrenia and other psychotic disorders |
| 29541 | Schizophreniform disorder, subchronic | MH | 659 Schizophrenia and other psychotic disorders |
| 29542 | Schizophreniform disorder, chronic | MH | 659 Schizophrenia and other psychotic disorders |
| 29543 | Schizophreniform disorder, subchronic with acute exacerbation | MH | 659 Schizophrenia and other psychotic disorders |
| 29544 | Schizophreniform disorder, chronic with acute exacerbation | MH | 659 Schizophrenia and other psychotic disorders |
| 29545 | Schizophreniform disorder, in remission | MH | 659 Schizophrenia and other psychotic disorders |
| 29550 | Latent schizophrenia, unspecified | MH | 659 Schizophrenia and other psychotic disorders |
| 29551 | Latent schizophrenia, subchronic | MH | 659 Schizophrenia and other psychotic disorders |
| 29552 | Latent schizophrenia, chronic | MH | 659 Schizophrenia and other psychotic disorders |
| 29553 | Latent schizophrenia, subchronic with acute exacerbation | MH | 659 Schizophrenia and other psychotic disorders |
| 29554 | Latent schizophrenia, chronic with acute exacerbation | MH | 659 Schizophrenia and other psychotic disorders |
| 29555 | Latent schizophrenia, in remission | MH | 659 Schizophrenia and other psychotic disorders |
| 29560 | Schizophrenic disorders, residual type, unspecified | MH | 659 Schizophrenia and other psychotic disorders |
| 29561 | Schizophrenic disorders, residual type, subchronic | MH | 659 Schizophrenia and other psychotic disorders |
| 29562 | Schizophrenic disorders, residual type, chronic | MH | 659 Schizophrenia and other psychotic disorders |
| 29563 | Schizophrenic disorders, residual type, subchronic with acute exacerbation | MH | 659 Schizophrenia and other psychotic disorders |
| 29564 | Schizophrenic disorders, residual type, chronic with acute exacerbation | MH | 659 Schizophrenia and other psychotic disorders |
| 29565 | Schizophrenic disorders, residual type, in remission | MH | 659 Schizophrenia and other psychotic disorders |
| 29570 | Schizoaffective disorder, unspecified | MH | 659 Schizophrenia and other psychotic disorders |
| 29571 | Schizoaffective disorder, subchronic | MH | 659 Schizophrenia and other psychotic disorders |
| 29572 | Schizoaffective disorder, chronic | MH | 659 Schizophrenia and other psychotic disorders |
| 29573 | Schizoaffective disorder, subchronic with acute exacerbation | MH | 659 Schizophrenia and other psychotic disorders |
| 29574 | Schizoaffective disorder, chronic with acute exacerbation | MH | 659 Schizophrenia and other psychotic disorders |
| 29575 | Schizoaffective disorder, in remission | MH | 659 Schizophrenia and other psychotic disorders |
| 29580 | Other specified types of schizophrenia, unspecified | MH | 659 Schizophrenia and other psychotic disorders |
| 29581 | Other specified types of schizophrenia, subchronic | MH | 659 Schizophrenia and other psychotic disorders |
| 29582 | Other specified types of schizophrenia, chronic | MH | 659 Schizophrenia and other psychotic disorders |
| 29583 | Other specified types of schizophrenia, subchronic with acute exacerbation | MH | 659 Schizophrenia and other psychotic disorders |
| 29584 | Other specified types of schizophrenia, chronic with acute exacerbation | MH | 659 Schizophrenia and other psychotic disorders |
| 29585 | Other specified types of schizophrenia, in remission | MH | 659 Schizophrenia and other psychotic disorders |
| 29590 | Unspecified schizophrenia, unspecified | MH | 659 Schizophrenia and other psychotic disorders |
| 29591 | Unspecified schizophrenia, subchronic | MH | 659 Schizophrenia and other psychotic disorders |
| 29592 | Unspecified schizophrenia, chronic | MH | 659 Schizophrenia and other psychotic disorders |
| 29593 | Unspecified schizophrenia, subchronic with acute exacerbation | MH | 659 Schizophrenia and other psychotic disorders |
| 29594 | Unspecified schizophrenia, chronic with acute exacerbation | MH | 659 Schizophrenia and other psychotic disorders |
| 29595 | Unspecified schizophrenia, in remission | MH | 659 Schizophrenia and other psychotic disorders |
| 2970 | Paranoid state, simple | MH | 659 Schizophrenia and other psychotic disorders |
| 2971 | Delusional disorder | MH | 659 Schizophrenia and other psychotic disorders |
| 2972 | Paraphrenia | MH | 659 Schizophrenia and other psychotic disorders |
| 2973 | Shared psychotic disorder | MH | 659 Schizophrenia and other psychotic disorders |
| 2978 | Other specified paranoid states | MH | 659 Schizophrenia and other psychotic disorders |
| 2979 | Unspecified paranoid state | MH | 659 Schizophrenia and other psychotic disorders |
| 2980 | Depressive type psychosis | MH | 659 Schizophrenia and other psychotic disorders |
| 2981 | Excitative type psychosis | MH | 659 Schizophrenia and other psychotic disorders |
| 2982 | Reactive confusion | MH | 659 Schizophrenia and other psychotic disorders |
| 2983 | Acute paranoid reaction | MH | 659 Schizophrenia and other psychotic disorders |
| 2984 | Psychogenic paranoid psychosis | MH | 659 Schizophrenia and other psychotic disorders |
| 2988 | Other and unspecified reactive psychosis | MH | 659 Schizophrenia and other psychotic disorders |
| 2989 | Unspecified psychosis | MH | 659 Schizophrenia and other psychotic disorders |
| 29381 | Psychotic disorder with delusions in conditions classified elsewhere | MH | 659 Schizophrenia and other psychotic disorders |
| 29382 | Psychotic disorder with hallucinations in conditions classified elsewhere | MH | 659 Schizophrenia and other psychotic disorders |
| 2910 | Alcohol withdrawal delirium | SUD | 660 Alcohol-related disorders |
| 2911 | Alcohol-induced persisting amnestic disorder | SUD | 660 Alcohol-related disorders |
| 2912 | Alcohol-induced persisting dementia | SUD | 660 Alcohol-related disorders |
| 2913 | Alcohol-induced psychotic disorder with hallucinations | SUD | 660 Alcohol-related disorders |
| 2914 | Idiosyncratic alcohol intoxication | SUD | 660 Alcohol-related disorders |
| 2915 | Alcohol-induced psychotic disorder with delusions | SUD | 660 Alcohol-related disorders |
| 2918 | Other specified alcohol-induced mental disorders | SUD | 660 Alcohol-related disorders |
| 29181 | Alcohol withdrawal | SUD | 660 Alcohol-related disorders |
| 29182 | Alcohol induced sleep disorders | SUD | 660 Alcohol-related disorders |
| 29189 | Other alcohol-induced mental disorders | SUD | 660 Alcohol-related disorders |
| 2919 | Unspecified alcohol-induced mental disorders | SUD | 660 Alcohol-related disorders |
| 30300 | Acute alcoholic intoxication in alcoholism, unspecified | SUD | 660 Alcohol-related disorders |
| 30301 | Acute alcoholic intoxication in alcoholism, continuous | SUD | 660 Alcohol-related disorders |
| 30302 | Acute alcoholic intoxication in alcoholism, episodic | SUD | 660 Alcohol-related disorders |
| 30303 | Acute alcoholic intoxication in alcoholism, in remission | SUD | 660 Alcohol-related disorders |
| 30390 | Other and unspecified alcohol dependence, unspecified | SUD | 660 Alcohol-related disorders |
| 30391 | Other and unspecified alcohol dependence, continuous | SUD | 660 Alcohol-related disorders |
| 30392 | Other and unspecified alcohol dependence, episodic | SUD | 660 Alcohol-related disorders |
| 30393 | Other and unspecified alcohol dependence, in remission | SUD | 660 Alcohol-related disorders |
| 30500 | Alcohol abuse, unspecified | SUD | 660 Alcohol-related disorders |
| 30501 | Alcohol abuse, continuous | SUD | 660 Alcohol-related disorders |
| 30502 | Alcohol abuse, episodic | SUD | 660 Alcohol-related disorders |
| 30503 | Alcohol abuse, in remission | SUD | 660 Alcohol-related disorders |
| 3575 | Alcoholic polyneuropathy | SUD | 660 Alcohol-related disorders |
| 4255 | Alcoholic cardiomyopathy | SUD | 660 Alcohol-related disorders |
| 5353 | Alcoholic gastritis | SUD | 660 Alcohol-related disorders |
| 53530 | Alcoholic gastritis, without mention of hemorrhage | SUD | 660 Alcohol-related disorders |
| 53531 | Alcoholic gastritis, with hemorrhage | SUD | 660 Alcohol-related disorders |
| 5710 | Alcoholic fatty liver | SUD | 660 Alcohol-related disorders |
| 5711 | Acute alcoholic hepatitis | SUD | 660 Alcohol-related disorders |
| 5712 | Alcoholic cirrhosis of liver | SUD | 660 Alcohol-related disorders |
| 5713 | Alcoholic liver damage, unspecified | SUD | 660 Alcohol-related disorders |
| 76071 | Alcohol affecting fetus or newborn via placenta or breast milk | SUD | 660 Alcohol-related disorders |
| 9800 | Toxic effect of ethyl alcohol | SUD | 660 Alcohol-related disorders |
| 9808 | Toxic effect of other specified alcohols | SUD | 660 Alcohol-related disorders |
| 2920 | Drug withdrawal | SUD | 661 Substance-related disorders |
| 29211 | Drug-induced psychotic disorder with delusions | SUD | 661 Substance-related disorders |
| 29212 | Drug-induced psychotic disorder with hallucinations | SUD | 661 Substance-related disorders |
| 2922 | Pathological drug intoxication | SUD | 661 Substance-related disorders |
| 29281 | Drug-induced delirium | SUD | 661 Substance-related disorders |
| 29282 | Drug-induced persisting dementia | SUD | 661 Substance-related disorders |
| 29283 | Drug-induced persisting amnestic disorder | SUD | 661 Substance-related disorders |
| 29284 | Drug-induced mood disorder | SUD | 661 Substance-related disorders |
| 29285 | Drug induced sleep disorders | SUD | 661 Substance-related disorders |
| 29289 | Other specified drug-induced mental disorders | SUD | 661 Substance-related disorders |
| 2929 | Unspecified drug-induced mental disorder | SUD | 661 Substance-related disorders |
| 30400 | Opioid type dependence, unspecified | SUD | 661 Substance-related disorders |
| 30401 | Opioid type dependence, continuous | SUD | 661 Substance-related disorders |
| 30402 | Opioid type dependence, episodic | SUD | 661 Substance-related disorders |
| 30403 | Opioid type dependence, in remission | SUD | 661 Substance-related disorders |
| 30410 | Sedative, hypnotic or anxiolytic dependence, unspecified | SUD | 661 Substance-related disorders |
| 30411 | Sedative, hypnotic or anxiolytic dependence, continuous | SUD | 661 Substance-related disorders |
| 30412 | Sedative, hypnotic or anxiolytic dependence, episodic | SUD | 661 Substance-related disorders |
| 30413 | Sedative, hypnotic or anxiolytic dependence, in remission | SUD | 661 Substance-related disorders |
| 30420 | Cocaine dependence, unspecified | SUD | 661 Substance-related disorders |
| 30421 | Cocaine dependence, continuous | SUD | 661 Substance-related disorders |
| 30422 | Cocaine dependence, episodic | SUD | 661 Substance-related disorders |
| 30423 | Cocaine dependence, in remission | SUD | 661 Substance-related disorders |
| 30430 | Cannabis dependence, unspecified | SUD | 661 Substance-related disorders |
| 30431 | Cannabis dependence, continuous | SUD | 661 Substance-related disorders |
| 30432 | Cannabis dependence, episodic | SUD | 661 Substance-related disorders |
| 30433 | Cannabis dependence, in remission | SUD | 661 Substance-related disorders |
| 30440 | Amphetamine and other psychostimulant dependence, unspecified | SUD | 661 Substance-related disorders |
| 30441 | Amphetamine and other psychostimulant dependence, continuous | SUD | 661 Substance-related disorders |
| 30442 | Amphetamine and other psychostimulant dependence, episodic | SUD | 661 Substance-related disorders |
| 30443 | Amphetamine and other psychostimulant dependence, in remission | SUD | 661 Substance-related disorders |
| 30450 | Hallucinogen dependence, unspecified | SUD | 661 Substance-related disorders |
| 30451 | Hallucinogen dependence, continuous | SUD | 661 Substance-related disorders |
| 30452 | Hallucinogen dependence, episodic | SUD | 661 Substance-related disorders |
| 30453 | Hallucinogen dependence, in remission | SUD | 661 Substance-related disorders |
| 30460 | Other specified drug dependence, unspecified | SUD | 661 Substance-related disorders |
| 30461 | Other specified drug dependence, continuous | SUD | 661 Substance-related disorders |
| 30462 | Other specified drug dependence, episodic | SUD | 661 Substance-related disorders |
| 30463 | Other specified drug dependence, in remission | SUD | 661 Substance-related disorders |
| 30470 | Combinations of opioid type drug with any other drug dependence, unspecified | SUD | 661 Substance-related disorders |
| 30471 | Combinations of opioid type drug with any other drug dependence, continuous | SUD | 661 Substance-related disorders |
| 30472 | Combinations of opioid type drug with any other drug dependence, episodic | SUD | 661 Substance-related disorders |
| 30473 | Combinations of opioid type drug with any other drug dependence, in remission | SUD | 661 Substance-related disorders |
| 30480 | Combinations of drug dependence excluding opioid type drug, unspecified | SUD | 661 Substance-related disorders |
| 30481 | Combinations of drug dependence excluding opioid type drug, continuous | SUD | 661 Substance-related disorders |
| 30482 | Combinations of drug dependence excluding opioid type drug, episodic | SUD | 661 Substance-related disorders |
| 30483 | Combinations of drug dependence excluding opioid type drug, in remission | SUD | 661 Substance-related disorders |
| 30490 | Unspecified drug dependence, unspecified | SUD | 661 Substance-related disorders |
| 30491 | Unspecified drug dependence, continuous | SUD | 661 Substance-related disorders |
| 30492 | Unspecified drug dependence, episodic | SUD | 661 Substance-related disorders |
| 30493 | Unspecified drug dependence, in remission | SUD | 661 Substance-related disorders |
| 30520 | Cannabis abuse, unspecified | SUD | 661 Substance-related disorders |
| 30521 | Cannabis abuse, continuous | SUD | 661 Substance-related disorders |
| 30522 | Cannabis abuse, episodic | SUD | 661 Substance-related disorders |
| 30523 | Cannabis abuse, in remission | SUD | 661 Substance-related disorders |
| 30530 | Hallucinogen abuse, unspecified | SUD | 661 Substance-related disorders |
| 30531 | Hallucinogen abuse, continuous | SUD | 661 Substance-related disorders |
| 30532 | Hallucinogen abuse, episodic | SUD | 661 Substance-related disorders |
| 30533 | Hallucinogen abuse, in remission | SUD | 661 Substance-related disorders |
| 30540 | Sedative, hypnotic or anxiolytic abuse, unspecified | SUD | 661 Substance-related disorders |
| 30541 | Sedative, hypnotic or anxiolytic abuse, continuous | SUD | 661 Substance-related disorders |
| 30542 | Sedative, hypnotic or anxiolytic abuse, episodic | SUD | 661 Substance-related disorders |
| 30543 | Sedative, hypnotic or anxiolytic abuse, in remission | SUD | 661 Substance-related disorders |
| 30550 | Opioid abuse, unspecified | SUD | 661 Substance-related disorders |
| 30551 | Opioid abuse, continuous | SUD | 661 Substance-related disorders |
| 30552 | Opioid abuse, episodic | SUD | 661 Substance-related disorders |
| 30553 | Opioid abuse, in remission | SUD | 661 Substance-related disorders |
| 30560 | Cocaine abuse, unspecified | SUD | 661 Substance-related disorders |
| 30561 | Cocaine abuse, continuous | SUD | 661 Substance-related disorders |
| 30562 | Cocaine abuse, episodic | SUD | 661 Substance-related disorders |
| 30563 | Cocaine abuse, in remission | SUD | 661 Substance-related disorders |
| 30570 | Amphetamine or related acting sympathomimetic abuse, unspecified | SUD | 661 Substance-related disorders |
| 30571 | Amphetamine or related acting sympathomimetic abuse, continuous | SUD | 661 Substance-related disorders |
| 30572 | Amphetamine or related acting sympathomimetic abuse, episodic | SUD | 661 Substance-related disorders |
| 30573 | Amphetamine or related acting sympathomimetic abuse, in remission | SUD | 661 Substance-related disorders |
| 30580 | Antidepressant type abuse, unspecified | SUD | 661 Substance-related disorders |
| 30581 | Antidepressant type abuse, continuous | SUD | 661 Substance-related disorders |
| 30582 | Antidepressant type abuse, episodic | SUD | 661 Substance-related disorders |
| 30583 | Antidepressant type abuse, in remission | SUD | 661 Substance-related disorders |
| 30590 | Other, mixed, or unspecified drug abuse, unspecified | SUD | 661 Substance-related disorders |
| 30591 | Other, mixed, or unspecified drug abuse, continuous | SUD | 661 Substance-related disorders |
| 30592 | Other, mixed, or unspecified drug abuse, episodic | SUD | 661 Substance-related disorders |
| 30593 | Other, mixed, or unspecified drug abuse, in remission | SUD | 661 Substance-related disorders |
| 64830 | Drug dependence of mother, unspecified as to episode of care or not applicable | SUD | 661 Substance-related disorders |
| 64831 | Drug dependence of mother, delivered, with or without mention of antepartum condition | SUD | 661 Substance-related disorders |
| 64832 | Drug dependence of mother, delivered, with mention of postpartum complication | SUD | 661 Substance-related disorders |
| 64833 | Drug dependence of mother, antepartum condition or complication | SUD | 661 Substance-related disorders |
| 64834 | Drug dependence of mother, postpartum condition or complication | SUD | 661 Substance-related disorders |
| 65550 | Suspected damage to fetus from drugs, affecting management of mother, unspecified as to episode of care or not applicable | SUD | 661 Substance-related disorders |
| 65551 | Suspected damage to fetus from drugs, affecting management of mother, delivered, with or without mention of antepartum condition | SUD | 661 Substance-related disorders |
| 65553 | Suspected damage to fetus from drugs, affecting management of mother, antepartum condition or complication | SUD | 661 Substance-related disorders |
| 76072 | Narcotics affecting fetus or newborn via placenta or breast milk | SUD | 661 Substance-related disorders |
| 76073 | Hallucinogenic agents affecting fetus or newborn via placenta or breast milk | SUD | 661 Substance-related disorders |
| 76075 | Cocaine affecting fetus or newborn via placenta or breast milk | SUD | 661 Substance-related disorders |
| 7795 | Drug withdrawal syndrome in newborn | SUD | 661 Substance-related disorders |
| 96500 | Poisoning by opium (alkaloids), unspecified | SUD | 661 Substance-related disorders |
| 96501 | Poisoning by heroin | SUD | 661 Substance-related disorders |
| 96502 | Poisoning by methadone | SUD | 661 Substance-related disorders |
| 96509 | Poisoning by other opiates and related narcotics | SUD | 661 Substance-related disorders |
| V6542 | Counseling on substance use and abuse | SUD | 661 Substance-related disorders |
| E9500 | Suicide and self-inflicted poisoning by analgesics, antipyretics, and antirheumatics | MH | 662 Suicide and intentional self-inflicted injury |
| E9501 | Suicide and self-inflicted poisoning by barbiturates | MH | 662 Suicide and intentional self-inflicted injury |
| E9502 | Suicide and self-inflicted poisoning by other sedatives and hypnotics | MH | 662 Suicide and intentional self-inflicted injury |
| E9503 | Suicide and self-inflicted poisoning by tranquilizers and other psychotropic agents | MH | 662 Suicide and intentional self-inflicted injury |
| E9504 | Suicide and self-inflicted poisoning by other specified drugs and medicinal substances | MH | 662 Suicide and intentional self-inflicted injury |
| E9505 | Suicide and self-inflicted poisoning by unspecified drug or medicinal substance | MH | 662 Suicide and intentional self-inflicted injury |
| E9506 | Suicide and self-inflicted poisoning by agricultural and horticultural chemical and pharmaceutical preparations other than plant foods and fertilizers | MH | 662 Suicide and intentional self-inflicted injury |
| E9507 | Suicide and self-inflicted poisoning by corrosive and caustic substances | MH | 662 Suicide and intentional self-inflicted injury |
| E9508 | Suicide and self-inflicted poisoning by arsenic and its compounds | MH | 662 Suicide and intentional self-inflicted injury |
| E9509 | Suicide and self-inflicted poisoning by other and unspecified solid and liquid substances | MH | 662 Suicide and intentional self-inflicted injury |
| E9510 | Suicide and self-inflicted poisoning by gas distributed by pipeline | MH | 662 Suicide and intentional self-inflicted injury |
| E9511 | Suicide and self-inflicted poisoning by liquefied petroleum gas distributed in mobile containers | MH | 662 Suicide and intentional self-inflicted injury |
| E9518 | Suicide and self-inflicted poisoning by other utility gas | MH | 662 Suicide and intentional self-inflicted injury |
| E9520 | Suicide and self-inflicted poisoning by motor vehicle exhaust gas | MH | 662 Suicide and intentional self-inflicted injury |
| E9521 | Suicide and self-inflicted poisoning by other carbon monoxide | MH | 662 Suicide and intentional self-inflicted injury |
| E9528 | Suicide and self-inflicted poisoning by other specified gases and vapors | MH | 662 Suicide and intentional self-inflicted injury |
| E9529 | Suicide and self-inflicted poisoning by unspecified gases and vapors | MH | 662 Suicide and intentional self-inflicted injury |
| E9530 | Suicide and self-inflicted injury by hanging | MH | 662 Suicide and intentional self-inflicted injury |
| E9531 | Suicide and self-inflicted injury by suffocation by plastic bag | MH | 662 Suicide and intentional self-inflicted injury |
| E9538 | Suicide and self-inflicted injury by other specified means | MH | 662 Suicide and intentional self-inflicted injury |
| E9539 | Suicide and self-inflicted injury by unspecified means | MH | 662 Suicide and intentional self-inflicted injury |
| E954 | Suicide and self-inflicted injury by submersion [drowning] | MH | 662 Suicide and intentional self-inflicted injury |
| E9550 | Suicide and self-inflicted injury by handgun | MH | 662 Suicide and intentional self-inflicted injury |
| E9551 | Suicide and self-inflicted injury by shotgun | MH | 662 Suicide and intentional self-inflicted injury |
| E9552 | Suicide and self-inflicted injury by hunting rifle | MH | 662 Suicide and intentional self-inflicted injury |
| E9553 | Suicide and self-inflicted injury by military firearms | MH | 662 Suicide and intentional self-inflicted injury |
| E9554 | Suicide and self-inflicted injury by other and unspecified firearm | MH | 662 Suicide and intentional self-inflicted injury |
| E9555 | Suicide and self-inflicted injury by explosives | MH | 662 Suicide and intentional self-inflicted injury |
| E9556 | Suicide and self-inflicted injury by air gun | MH | 662 Suicide and intentional self-inflicted injury |
| E9557 | Suicide and self-inflicted injury by paintball gun | MH | 662 Suicide and intentional self-inflicted injury |
| E9559 | Suicide and self-inflicted injury by firearms and explosives, unspecified | MH | 662 Suicide and intentional self-inflicted injury |
| E956 | Suicide and self-inflicted injury by cutting and piercing instrument | MH | 662 Suicide and intentional self-inflicted injury |
| E9570 | Suicide and self-inflicted injuries by jumping from residential premises | MH | 662 Suicide and intentional self-inflicted injury |
| E9571 | Suicide and self-inflicted injuries by jumping from other man-made structures | MH | 662 Suicide and intentional self-inflicted injury |
| E9572 | Suicide and self-inflicted injuries by jumping from natural sites | MH | 662 Suicide and intentional self-inflicted injury |
| E9579 | Suicide and self-inflicted injuries by jumping from unspecified site | MH | 662 Suicide and intentional self-inflicted injury |
| E9580 | Suicide and self-inflicted injury by jumping or lying before moving object | MH | 662 Suicide and intentional self-inflicted injury |
| E9581 | Suicide and self-inflicted injury by burns, fire | MH | 662 Suicide and intentional self-inflicted injury |
| E9582 | Suicide and self-inflicted injury by scald | MH | 662 Suicide and intentional self-inflicted injury |
| E9583 | Suicide and self-inflicted injury by extremes of cold | MH | 662 Suicide and intentional self-inflicted injury |
| E9584 | Suicide and self-inflicted injury by electrocution | MH | 662 Suicide and intentional self-inflicted injury |
| E9585 | Suicide and self-inflicted injury by crashing of motor vehicle | MH | 662 Suicide and intentional self-inflicted injury |
| E9586 | Suicide and self-inflicted injury by crashing of aircraft | MH | 662 Suicide and intentional self-inflicted injury |
| E9587 | Suicide and self-inflicted injury by caustic substances, except poisoning | MH | 662 Suicide and intentional self-inflicted injury |
| E9588 | Suicide and self-inflicted injury by other specified means | MH | 662 Suicide and intentional self-inflicted injury |
| E9589 | Suicide and self-inflicted injury by unspecified means | MH | 662 Suicide and intentional self-inflicted injury |
| E959 | Late effects of self-inflicted injury | MH | 662 Suicide and intentional self-inflicted injury |
| V6284 | Suicidal ideation | MH | 662 Suicide and intentional self-inflicted injury |
| 3051 | Tobacco use disorder | Non-BH | 663 Screening and history of MH and substance abuse codes |
| 30510 | Non-dependent abuse of drugs, tobacco use, disorder unspecified | Non-BH | 663 Screening and history of MH and substance abuse codes |
| 30511 | Non-dependent abuse of drugs, tobacco use, disorder continuous | Non-BH | 663 Screening and history of MH and substance abuse codes |
| 30512 | Non-dependent abuse drugs, tobacco use, disorder episodic | Non-BH | 663 Screening and history of MH and substance abuse codes |
| 30513 | Non-dependent use of drugs, tobacco use, disorder-in remission | Non-BH | 663 Screening and history of MH and substance abuse codes |
| 33392 | Neuroleptic malignant syndrome | Non-BH | 663 Screening and history of MH and substance abuse codes |
| 7903 | Excessive blood level of alcohol | Non-BH | 663 Screening and history of MH and substance abuse codes |
| V110 | Personal history of schizophrenia | Non-BH | 663 Screening and history of MH and substance abuse codes |
| V111 | Personal history of affective disorders | Non-BH | 663 Screening and history of MH and substance abuse codes |
| V112 | Personal history of neurosis | Non-BH | 663 Screening and history of MH and substance abuse codes |
| V113 | Personal history of alcoholism | Non-BH | 663 Screening and history of MH and substance abuse codes |
| V114 | Personal history of combat and operational stress reaction | Non-BH | 663 Screening and history of MH and substance abuse codes |
| V118 | Personal history of other mental disorders | Non-BH | 663 Screening and history of MH and substance abuse codes |
| V119 | Personal history of unspecified mental disorder | Non-BH | 663 Screening and history of MH and substance abuse codes |
| V154 | Personal history of psychological trauma | Non-BH | 663 Screening and history of MH and substance abuse codes |
| V1541 | History of physical abuse | Non-BH | 663 Screening and history of MH and substance abuse codes |
| V1542 | History of emotional abuse | Non-BH | 663 Screening and history of MH and substance abuse codes |
| V1549 | Other psychological trauma | Non-BH | 663 Screening and history of MH and substance abuse codes |
| V1582 | Personal history of tobacco use | Non-BH | 663 Screening and history of MH and substance abuse codes |
| V6285 | Homicidal ideation | Non-BH | 663 Screening and history of MH and substance abuse codes |
| V663 | Convalescence following psychotherapy and other treatment for mental disorder | Non-BH | 663 Screening and history of MH and substance abuse codes |
| V701 | General psychiatric examination, requested by the authority | MH | 663 Screening and history of MH and substance abuse codes |
| V702 | General psychiatric examination, other and unspecified | MH | 663 Screening and history of MH and substance abuse codes |
| V7101 | Observation for adult antisocial behavior | MH | 663 Screening and history of MH and substance abuse codes |
| V7102 | Observation for childhood or adolescent antisocial behavior | MH | 663 Screening and history of MH and substance abuse codes |
| V7109 | Observation for other suspected mental condition | MH | 663 Screening and history of MH and substance abuse codes |
| V790 | Screening for depression | Non-BH | 663 Screening and history of MH and substance abuse codes |
| V791 | Screening for alcoholism | Non-BH | 663 Screening and history of MH and substance abuse codes |
| V792 | Special screening for intellectual disabilities | Non-BH | 663 Screening and history of MH and substance abuse codes |
| V793 | Screening for developmental handicaps in early childhood | Non-BH | 663 Screening and history of MH and substance abuse codes |
| V798 | Screening for other specified mental disorders and developmental handicaps | Non-BH | 663 Screening and history of MH and substance abuse codes |
| V799 | Screening for unspecified mental disorder and developmental handicap | Non-BH | 663 Screening and history of MH and substance abuse codes |
| 30011 | Conversion disorder | MH | 670 Miscellaneous MH disorders |
| 30012 | Dissociative amnesia | MH | 670 Miscellaneous MH disorders |
| 30013 | Dissociative fugue | MH | 670 Miscellaneous MH disorders |
| 30014 | Dissociative identity disorder | MH | 670 Miscellaneous MH disorders |
| 30015 | Dissociative disorder or reaction, unspecified | MH | 670 Miscellaneous MH disorders |
| 30016 | Factitious disorder with predominantly psychological signs and symptoms | MH | 670 Miscellaneous MH disorders |
| 30019 | Other and unspecified factitious illness | MH | 670 Miscellaneous MH disorders |
| 3006 | Depersonalization disorder | MH | 670 Miscellaneous MH disorders |
| 3007 | Hypochondriasis | MH | 670 Miscellaneous MH disorders |
| 30081 | Somatization disorder | MH | 670 Miscellaneous MH disorders |
| 30082 | Undifferentiated somatoform disorder | MH | 670 Miscellaneous MH disorders |
| 3021 | Zoophilia | MH | 670 Miscellaneous MH disorders |
| 3022 | Pedophilia | MH | 670 Miscellaneous MH disorders |
| 3023 | Transvestic fetishism | MH | 670 Miscellaneous MH disorders |
| 3024 | Exhibitionism | MH | 670 Miscellaneous MH disorders |
| 30250 | Trans-sexualism with unspecified sexual history | MH | 670 Miscellaneous MH disorders |
| 30251 | Trans-sexualism with asexual history | MH | 670 Miscellaneous MH disorders |
| 30252 | Trans-sexualism with homosexual history | MH | 670 Miscellaneous MH disorders |
| 30253 | Trans-sexualism with heterosexual history | MH | 670 Miscellaneous MH disorders |
| 3026 | Gender identity disorder in children | MH | 670 Miscellaneous MH disorders |
| 30270 | Psychosexual dysfunction, unspecified | MH | 670 Miscellaneous MH disorders |
| 30271 | Hypoactive sexual desire disorder | MH | 670 Miscellaneous MH disorders |
| 30272 | Psychosexual dysfunction with inhibited sexual excitement | MH | 670 Miscellaneous MH disorders |
| 30273 | Female orgasmic disorder | MH | 670 Miscellaneous MH disorders |
| 30274 | Male orgasmic disorder | MH | 670 Miscellaneous MH disorders |
| 30275 | Premature ejaculation | MH | 670 Miscellaneous MH disorders |
| 30276 | Dyspareunia, psychogenic | MH | 670 Miscellaneous MH disorders |
| 30279 | Psychosexual dysfunction with other specified psychosexual dysfunctions | MH | 670 Miscellaneous MH disorders |
| 30281 | Fetishism | MH | 670 Miscellaneous MH disorders |
| 30282 | Voyeurism | MH | 670 Miscellaneous MH disorders |
| 30283 | Sexual masochism | MH | 670 Miscellaneous MH disorders |
| 30284 | Sexual sadism | MH | 670 Miscellaneous MH disorders |
| 30285 | Gender identity disorder in adolescents or adults | MH | 670 Miscellaneous MH disorders |
| 30289 | Other specified psychosexual disorders | MH | 670 Miscellaneous MH disorders |
| 3029 | Unspecified psychosexual disorder | MH | 670 Miscellaneous MH disorders |
| 3060 | Musculoskeletal malfunction arising from mental factors | MH | 670 Miscellaneous MH disorders |
| 3061 | Respiratory malfunction arising from mental factors | MH | 670 Miscellaneous MH disorders |
| 3062 | Cardiovascular malfunction arising from mental factors | MH | 670 Miscellaneous MH disorders |
| 3063 | Skin disorder arising from mental factors | MH | 670 Miscellaneous MH disorders |
| 3064 | Gastrointestinal malfunction arising from mental factors | MH | 670 Miscellaneous MH disorders |
| 30650 | Psychogenic genitourinary malfunction, unspecified | MH | 670 Miscellaneous MH disorders |
| 30651 | Psychogenic vaginismus | MH | 670 Miscellaneous MH disorders |
| 30652 | Psychogenic dysmenorrhea | MH | 670 Miscellaneous MH disorders |
| 30653 | Psychogenic dysuria | MH | 670 Miscellaneous MH disorders |
| 30659 | Other genitourinary malfunction arising from mental factors | MH | 670 Miscellaneous MH disorders |
| 3066 | Endocrine disorder arising from mental factors | MH | 670 Miscellaneous MH disorders |
| 3067 | Disorder of organs of special sense arising from mental factors | MH | 670 Miscellaneous MH disorders |
| 3068 | Other specified psychophysiological malfunction | MH | 670 Miscellaneous MH disorders |
| 3069 | Unspecified psychophysiological malfunction | MH | 670 Miscellaneous MH disorders |
| 3071 | Anorexia nervosa | MH | 670 Miscellaneous MH disorders |
| 30740 | Non-organic sleep disorder, unspecified | MH | 670 Miscellaneous MH disorders |
| 30741 | Transient disorder of initiating or maintaining sleep | MH | 670 Miscellaneous MH disorders |
| 30742 | Persistent disorder of initiating or maintaining sleep | MH | 670 Miscellaneous MH disorders |
| 30743 | Transient disorder of initiating or maintaining wakefulness | MH | 670 Miscellaneous MH disorders |
| 30744 | Persistent disorder of initiating or maintaining wakefulness | MH | 670 Miscellaneous MH disorders |
| 30745 | Circadian rhythm sleep disorder of non-organic origin | MH | 670 Miscellaneous MH disorders |
| 30746 | Sleep arousal disorder | MH | 670 Miscellaneous MH disorders |
| 30747 | Other dysfunctions of sleep stages or arousal from sleep | MH | 670 Miscellaneous MH disorders |
| 30748 | Repetitive intrusions of sleep | MH | 670 Miscellaneous MH disorders |
| 30749 | Other specific disorders of sleep of non-organic origin | MH | 670 Miscellaneous MH disorders |
| 30750 | Eating disorder, unspecified | MH | 670 Miscellaneous MH disorders |
| 30751 | Bulimia nervosa | MH | 670 Miscellaneous MH disorders |
| 30752 | Pica | MH | 670 Miscellaneous MH disorders |
| 30753 | Rumination disorder | MH | 670 Miscellaneous MH disorders |
| 30754 | Psychogenic vomiting | MH | 670 Miscellaneous MH disorders |
| 30759 | Other disorders of eating | MH | 670 Miscellaneous MH disorders |
| 30780 | Psychogenic pain, site unspecified | MH | 670 Miscellaneous MH disorders |
| 30781 | Tension headache | MH | 670 Miscellaneous MH disorders |
| 30789 | Other pain disorders related to psychological factors | MH | 670 Miscellaneous MH disorders |
| 3101 | Personality change due to conditions classified elsewhere | MH | 670 Miscellaneous MH disorders |
| 64840 | Mental disorders of mother, unspecified as to episode of care or not applicable | MH | 670 Miscellaneous MH disorders |
| 64841 | Mental disorders of mother, delivered, with or without mention of antepartum condition | MH | 670 Miscellaneous MH disorders |
| 64842 | Mental disorders of mother, delivered, with mention of postpartum complication | MH | 670 Miscellaneous MH disorders |
| 64843 | Mental disorders of mother, antepartum condition or complication | MH | 670 Miscellaneous MH disorders |
| 64844 | Mental disorders of mother, postpartum condition or complication | MH | 670 Miscellaneous MH disorders |
| V402 | Other mental problems | MH | 670 Miscellaneous MH disorders |
| V403 | other behavioral problems | MH | 670 Miscellaneous MH disorders |
| V4031 | Wandering in diseases classified elsewhere | MH | 670 Miscellaneous MH disorders |
| V4039 | Other specified behavioral problem | MH | 670 Miscellaneous MH disorders |
| V409 | Unspecified mental or behavioral problem | MH | 670 Miscellaneous MH disorders |
| V673 | Follow-up examination, following psychotherapy and other treatment for mental disorder | MH | 670 Miscellaneous MH disorders |
| 29389 | Other specified transient mental disorders due to conditions classified elsewhere, other | MH | 670 Miscellaneous MH disorders |
| 2939 | Unspecified transient mental disorder in conditions classified elsewhere | MH | 670 Miscellaneous MH disorders |
| 316 | Psychic factors associated with diseases classified elsewhere | MH | 670 Miscellaneous MH disorders |
APPENDIX D: Prescription Drug National Drug Codes Used to Identify Opioid Use Disorder Subpopulation
| NDC | Prod_Name | Route of Admin | Master Form Code | Strength in MG | Generic Name |
|---|---|---|---|---|---|
| 00054-0188-13 | BUPRENORPHINE-NALOXONE | SL | TAB | 2–0.5 | Buprenorphine/Naloxone |
| 00054-0189-13 | BUPRENORPHINE-NALOXONE | SL | TAB | 8–2 | Buprenorphine/Naloxone |
| 00093-5720-56 | BUPRENORPHINE-NALOXONE | SL | TAB | 2–0.5 | Buprenorphine/Naloxone |
| 00093-5721-56 | BUPRENORPHINE-NALOXONE | SL | TAB | 8–2 | Buprenorphine/Naloxone |
| 00228-3154-03 | BUPRENORPHINE-NALOXONE | SL | TAB | 2–0.5 | Buprenorphine/Naloxone |
| 00228-3154-73 | BUPRENORPHINE-NALOXONE | SL | TAB | 2–0.5 | Buprenorphine/Naloxone |
| 00228-3155-03 | BUPRENORPHINE-NALOXONE | SL | TAB | 8–2 | Buprenorphine/Naloxone |
| 00228-3155-73 | BUPRENORPHINE-NALOXONE | SL | TAB | 8–2 | Buprenorphine/Naloxone |
| 00406-1923-03 | BUPRENORPHINE-NALOXONE | SL | TAB | 2–0.5 | Buprenorphine/Naloxone |
| 00406-1924-03 | BUPRENORPHINE-NALOXONE | SL | TAB | 8–2 | Buprenorphine/Naloxone |
| 00490-0051-00 | SUBOXONE | SL | TAB | 2–0.5 | Buprenorphine/Naloxone |
| 00490-0051-30 | SUBOXONE | SL | TAB | 2–0.5 | Buprenorphine/Naloxone |
| 00490-0051-60 | SUBOXONE | SL | TAB | 2–0.5 | Buprenorphine/Naloxone |
| 00490-0051-90 | SUBOXONE | SL | TAB | 2–0.5 | Buprenorphine/Naloxone |
| 12496-1202-01 | SUBOXONE | SL | FIL | 2–0.5 | Buprenorphine/Naloxone |
| 12496-1202-03 | SUBOXONE | SL | FIL | 2–0.5 | Buprenorphine/Naloxone |
| 12496-1204-01 | SUBOXONE | SL | FIL | 4–1 | Buprenorphine/Naloxone |
| 12496-1204-03 | SUBOXONE | SL | FIL | 4–1 | Buprenorphine/Naloxone |
| 12496-1208-01 | SUBOXONE | SL | FIL | 8–2 | Buprenorphine/Naloxone |
| 12496-1208-03 | SUBOXONE | SL | FIL | 8–2 | Buprenorphine/Naloxone |
| 12496-1212-01 | SUBOXONE | SL | FIL | 12–3 | Buprenorphine/Naloxone |
| 12496-1212-03 | SUBOXONE | SL | FIL | 12–3 | Buprenorphine/Naloxone |
| 12496-1278-02 | SUBUTEX | SL | TAB | 2 | Buprenorphine |
| 12496-1283-02 | SUBOXONE | SL | TAB | 2–0.5 | Buprenorphine/Naloxone |
| 12496-1306-02 | SUBOXONE | SL | TAB | 8–2 | Buprenorphine/Naloxone |
| 12496-1310-02 | SUBUTEX | SL | TAB | 8 | Buprenorphine |
| 16590-0666-05 | SUBOXONE | SL | TAB | 2–0.5 | Buprenorphine/Naloxone |
| 16590-0666-30 | SUBOXONE | SL | TAB | 2–0.5 | Buprenorphine/Naloxone |
| 16590-0667-05 | SUBOXONE | SL | TAB | 8–2 | Buprenorphine/Naloxone |
| 16590-0667-30 | SUBOXONE | SL | TAB | 8–2 | Buprenorphine/Naloxone |
| 16590-0667-90 | SUBOXONE | SL | TAB | 8–2 | Buprenorphine/Naloxone |
| 23490-9270-03 | SUBOXONE | SL | TAB | 8–2 | Buprenorphine/Naloxone |
| 23490-9270-06 | SUBOXONE | SL | TAB | 8–2 | Buprenorphine/Naloxone |
| 23490-9270-09 | SUBOXONE | SL | TAB | 8–2 | Buprenorphine/Naloxone |
| 35356-0004-07 | SUBOXONE | SL | TAB | 8–2 | Buprenorphine/Naloxone |
| 35356-0004-30 | SUBOXONE | SL | TAB | 8–2 | Buprenorphine/Naloxone |
| 42291-0174-30 | BUPRENORPHINE-NALOXONE | SL | TAB | 2–0.5 | Buprenorphine/Naloxone |
| 42291-0175-30 | BUPRENORPHINE-NALOXONE | SL | TAB | 8–2 | Buprenorphine/Naloxone |
| 43063-0184-07 | SUBOXONE | SL | TAB | 8–2 | Buprenorphine/Naloxone |
| 43063-0184-30 | SUBOXONE | SL | TAB | 8–2 | Buprenorphine/Naloxone |
| 49999-0395-07 | SUBOXONE | SL | TAB | 2–0.5 | Buprenorphine/Naloxone |
| 49999-0395-15 | SUBOXONE | SL | TAB | 2–0.5 | Buprenorphine/Naloxone |
| 49999-0395-30 | SUBOXONE | SL | TAB | 2–0.5 | Buprenorphine/Naloxone |
| 49999-0638-30 | SUBUTEX | SL | TAB | 2 | Buprenorphine |
| 49999-0639-30 | SUBUTEX | SL | TAB | 8 | Buprenorphine |
| 50383-0287-93 | BUPRENORPHINE-NALOXONE | SL | TAB | 8–2 | Buprenorphine/Naloxone |
| 50383-0294-93 | BUPRENORPHINE-NALOXONE | SL | TAB | 2–0.5 | Buprenorphine/Naloxone |
| 52959-0304-30 | SUBOXONE | SL | TAB | 8–2 | Buprenorphine/Naloxone |
| 52959-0749-30 | SUBOXONE | SL | TAB | 2–0.5 | Buprenorphine/Naloxone |
| 53217-0138-30 | BUPRENORPHINE-NALOXONE | SL | TAB | 8–2 | Buprenorphine/Naloxone |
| 54123-0114-30 | ZUBSOLV | SL | TAB | 11.4–2.9 | Buprenorphine/Naloxone |
| 54123-0914-30 | ZUBSOLV | SL | TAB | 1.4–0.36 | Buprenorphine/Naloxone |
| 54123-0929-30 | ZUBSOLV | SL | TAB | 2.9–0.71 | Buprenorphine/Naloxone |
| 54123-0957-30 | ZUBSOLV | SL | TAB | 5.7–1.4 | Buprenorphine/Naloxone |
| 54123-0986-30 | ZUBSOLV | SL | TAB | 8.6–2.1 | Buprenorphine/Naloxone |
| 54569-5496-00 | SUBOXONE | SL | TAB | 2–0.5 | Buprenorphine/Naloxone |
| 54569-5739-00 | SUBOXONE | SL | TAB | 8–2 | Buprenorphine/Naloxone |
| 54569-5739-01 | SUBOXONE | SL | TAB | 8–2 | Buprenorphine/Naloxone |
| 54569-5739-02 | SUBOXONE | SL | TAB | 8–2 | Buprenorphine/Naloxone |
| 54569-6399-00 | SUBOXONE | SL | FIL | 8–2 | Buprenorphine/Naloxone |
| 54569-6408-00 | BUPRENORPHINE-NALOXONE | SL | TAB | 8–2 | Buprenorphine/Naloxone |
| 54868-5707-00 | SUBOXONE | SL | TAB | 8–2 | Buprenorphine/Naloxone |
| 54868-5707-01 | SUBOXONE | SL | TAB | 8–2 | Buprenorphine/Naloxone |
| 54868-5707-02 | SUBOXONE | SL | TAB | 8–2 | Buprenorphine/Naloxone |
| 54868-5707-03 | SUBOXONE | SL | TAB | 8–2 | Buprenorphine/Naloxone |
| 54868-5707-04 | SUBOXONE | SL | TAB | 8–2 | Buprenorphine/Naloxone |
| 54868-5750-00 | SUBOXONE | SL | TAB | 2–0.5 | Buprenorphine/Naloxone |
| 55045-3784-03 | SUBOXONE | SL | TAB | 8–2 | Buprenorphine/Naloxone |
| 55700-0147-30 | SUBOXONE | SL | FIL | 8–2 | Buprenorphine/Naloxone |
| 55700-0184-30 | BUPRENORPHINE-NALOXONE | SL | TAB | 2–0.5 | Buprenorphine/Naloxone |
| 55887-0312-04 | SUBOXONE | SL | TAB | 8–2 | Buprenorphine/Naloxone |
| 55887-0312-15 | SUBOXONE | SL | TAB | 8–2 | Buprenorphine/Naloxone |
| 59385-0012-01 | BUNAVAIL | MM | FIL | 2.1–0.3 | Buprenorphine/Naloxone |
| 59385-0012-30 | BUNAVAIL | MM | FIL | 2.1–0.3 | Buprenorphine/Naloxone |
| 59385-0014-01 | BUNAVAIL | MM | FIL | 4.2–0.7 | Buprenorphine/Naloxone |
| 59385-0014-30 | BUNAVAIL | MM | FIL | 4.2–0.7 | Buprenorphine/Naloxone |
| 59385-0016-01 | BUNAVAIL | MM | FIL | 6.3–1 | Buprenorphine/Naloxone |
| 59385-0016-30 | BUNAVAIL | MM | FIL | 6.3–1 | Buprenorphine/Naloxone |
| 63629-4028-01 | SUBOXONE | SL | TAB | 2–0.5 | Buprenorphine/Naloxone |
| 63629-4034-01 | SUBOXONE | SL | TAB | 8–2 | Buprenorphine/Naloxone |
| 63629-4034-02 | SUBOXONE | SL | TAB | 8–2 | Buprenorphine/Naloxone |
| 63629-4034-03 | SUBOXONE | SL | TAB | 8–2 | Buprenorphine/Naloxone |
| 63629-4092-01 | SUBUTEX | SL | TAB | 8 | Buprenorphine |
| 63874-1084-03 | SUBOXONE | SL | TAB | 8–2 | Buprenorphine/Naloxone |
| 63874-1085-03 | SUBOXONE | SL | TAB | 2–0.5 | Buprenorphine/Naloxone |
| 63874-1173-03 | SUBUTEX | SL | TAB | 8 | Buprenorphine |
| 63874-1174-03 | SUBUTEX | SL | TAB | 2 | Buprenorphine |
| 65162-0415-03 | BUPRENORPHINE-NALOXONE | SL | TAB | 8–2 | Buprenorphine/Naloxone |
| 65162-0416-03 | BUPRENORPHINE-NALOXONE | SL | TAB | 2–0.5 | Buprenorphine/Naloxone |
| 66336-0015-30 | SUBOXONE | SL | TAB | 2–0.5 | Buprenorphine/Naloxone |
| 66336-0016-30 | SUBOXONE | SL | TAB | 8–2 | Buprenorphine/Naloxone |
| 68071-1380-03 | SUBOXONE | SL | TAB | 8–2 | Buprenorphine/Naloxone |
| 68071-1510-03 | SUBOXONE | SL | TAB | 2–0.5 | Buprenorphine/Naloxone |
| 68258-2999-03 | SUBOXONE | SL | TAB | 2–0.5 | Buprenorphine/Naloxone |
| 63459-0300-42 | VIVITROL | IM | GER | 380 | VIVITROL |
| 65757-0300-01 | VIVITROL | IM | GER | 380 | VIVITROL |
APPENDIX E: Supplemental Regression Analyses Results
Annual Descriptive Trends and Simple Regression Analysis
We produced annual outcome trends for the average and 95thpercentile for all service categories, comparing non-BH, MH, and SUD diagnosis groups as well as OUD and non-OUD SUD trends. We then produced plotted graphs to visually assess whether there were distinct patterns in results or discontinuities in trends. We quickly could see that the largest impacts of parity were for SUD services. However, it was important that we narrowed our focus as we moved toward monthly regression analyses.
To narrow our focus, we performed a multitude of simple ITS regression analyses on both the average and 95th percentile annual trends. For each regression analysis, we had ten data points for years 2005-2014, six of which were pre-parity trends and four of which were post-parity trends. We reasoned that we were less likely to find statistical significance with so few data points, but that using the sign of coefficients and statistical significance where present would allow us to better identify where our monthly regression resources would be best spent. In each simple regression, we included a parity indicator (0=2005-2010; 1=2011-2014), an annual linear time variable, and a parity*annual linear time variable interaction term.
We then compiled results of the full set of simple regressions into two sets of tables--one for the average results and a second for the 95th percentile results. We present the simple regression average results below.
Results for Simple Regressions
We present the results from the full set of regression analyses in Table E1. The signs of the parity and parity*year interaction coefficients are represented by "+" and "–" symbols, and statistical significance at the 0.05 level also is indicated by blue shading and two "+" symbols in the case of a positive coefficient and yellow shading and two "–" symbols in the case of a negative coefficient. We present the primary outcomes from these analyses across the six service categories, including inpatient admissions with and without a preceding emergency department visit, treat-and-release emergency department visits, outpatient, pharmacy, and an overall service category. As stated in the Methods, we do not present laboratory and radiology services separately because diagnosis codes often are not included on service claims.
The strongest evidence of an impact of parity across all service categories was for all services and outpatient services. For almost every outcome in these two service categories, non-BH services decreased or did not change significantly in the post-period, whereas at least one or more BH categories increased significantly in the post-period. Because the results for all services and outpatient services were very similar (and results for other services categories were not), we concluded that outpatient services, which constitute the bulk of utilization and spending, were driving the results for all services.
| TABLE E1. Summary Table of Simple Regression Results for Specific Service Types, by Diagnosis Group | ||||||||||
|---|---|---|---|---|---|---|---|---|---|---|
| Non-BH Parity coeff. | Non-BH Parity*yr coeff. | MH Parity coeff. | MH Parity*yr coeff. | SUD Parity coeff. | SUD Parity*yr coeff. | Non-OUD Parity coeff. | Non-OUD Parity*yr coeff. | OUD Parity coeff. | OUD Parity*yr coeff. | |
| Access (percentage of enrollees with any service use) | ||||||||||
| All Services | – | – – | + | – | + | + | + | + | + | ++ |
| Inpatient with ED | + | – – | + | – | ++ | – | + | – | ++ | – |
| Inpatient with No ED | – | + | + | + | ++ | ++ | ++ | ++ | ++ | – |
| Outpatient | – | – – | – | ++ | – | + | – | + | + | ++ |
| Treat-and-Release ED | + | – | + | + | ++ | – | ++ | – | ++ | + |
| Pharmacy | + | – | + | – | + | – – | – | + | ++ | – – |
| Utilization (number of services) | ||||||||||
| All Services | – | – | – – | ++ | – | ++ | – – | ++ | – | ++ |
| Inpatient Preceded by ED | – | – | + | – | + | – | + | – | – | + |
| Inpatient with No ED | + | + | – | – | + | – | – | – | + | – |
| Outpatient | – | – | + | + | – | ++ | – | ++ | – | ++ |
| Treat-and-Release ED | + | + | + | + | + | – | + | – | + | – |
| Pharmacy | – | ++ | – | – | + | – – | – – | ++ | – | – – |
| Inpatient Days Utilization | ||||||||||
| Number of Days | + | ++ | + | + | + | + | + | – | + | – |
| Insurer Spending | ||||||||||
| All Services | – | – | + | + | + | ++ | + | ++ | ++ | ++ |
| Inpatient Preceded by ED | + | – – | + | – | – | – | – | – | – | + |
| Inpatient with No ED | + | – | ++ | – – | + | + | + | + | ++ | ++ |
| Outpatient | – | – – | + | + | + | ++ | + | ++ | + | ++ |
| Treat-and-Release ED | + | – | + | – | + | – | + | – | + | – |
| Pharmacy | – | ++ | + | – – | + | – – | – | – | + | – – |
| Enrollee Spending | ||||||||||
| All Services | + | + | – | + | + | ++ | + | ++ | + | + |
| Inpatient Preceded by ED | + | ++ | + | + | – | ++ | – | ++ | – | ++ |
| Inpatient with No ED | + | + | – | ++ | – | ++ | – | ++ | – | ++ |
| Outpatient | + | + | + | – | + | ++ | + | ++ | + | ++ |
| Treat-and-Release ED | + | + | + | + | – | + | – | + | + | + |
| Pharmacy | + | – – | + | – – | + | – – | + | – – | + | – – |
| Insurer Reimbursement | ||||||||||
| All Services | + | – – | ++ | – – | ++ | – – | + | – – | ++ | – – |
| Inpatient Preceded by ED | + | – – | + | – – | – | – | – | – | – | + |
| Inpatient with No ED | + | – | ++ | – – | + | ++ | + | + | + | ++ |
| Outpatient | + | – – | + | – | ++ | – – | ++ | – | ++ | – |
| Treat-and-Release ED | + | – | + | – | + | – | + | – | + | – |
| Pharmacy | – | ++ | + | – – | + | – – | – | – – | + | – – |
| Enrollee Reimbursement | ||||||||||
| All Services | + | + | + | – – | ++ | – – | + | – – | + | – – |
| Inpatient Preceded by ED | + | + | + | + | – | ++ | – | ++ | – | ++ |
| Inpatient with No ED | + | + | – | ++ | – | ++ | – | ++ | – | ++ |
| Outpatient | + | + | + | – | ++ | – – | + | – – | + | – – |
| Treat-and-Release ED | + | + | + | + | – | + | – | + | – | + |
| Pharmacy | + | – – | + | – – | + | – – | + | – – | + | – – |
| NOTES: The Parity coeff. (i.e., the parity pre-post indicator coefficient) measures the effect on the level of the outcomes, and the Parity*yr coeff. (i.e., the parity indicator * the yearly linear time variable) measures the effect of parity on the slope of the outcome over time. The signs ++ and – – indicate the sign of the coefficient from the ITS regression. A significant effect for a negative coefficient is indicated by orange shading and 2 minus signs; a significant effect for a positive coefficient is indicated by blue shading and 2 plus signs. | ||||||||||
APPENDIX F: National Drug Codes Used to Identify Prescription Drug Fills for Substance Use Disorders in Preliminary Analysis
| National Drug Code | Product Name | Use | Dosage in MG |
|---|---|---|---|
| 00456-3330-01 | CAMPRAL | AUD | 333 |
| 00258-4000-60 | Acamprosate | AUD | 333 |
| 55045-3296-01 | CAMPRAL | AUD | 333 |
| 00456-3330-60 | CAMPRAL | AUD | 333 |
| 00456-3330-63 | CAMPRAL | AUD | 333 |
| 54569-5767-00 | CAMPRAL | AUD | 333 |
| 51079-0241-01 | Acamprosate | AUD | 333 |
| 00378-6333-80 | Acamprosate | AUD | 333 |
| 68462-0435-18 | Acamprosate | AUD | 333 |
| 51079-0241-06 | Acamprosate | AUD | 333 |
| 60687-0121-25 | Acamprosate | AUD | 333 |
| 54868-5293-00 | CAMPRAL | AUD | 333 |
| 60687-0121-95 | Acamprosate | AUD | 333 |
| 0037-86333-80 | Acamprosate Calcium | AUD | 333 |
| 12496-1278-02 | SUBUTEX | OUD | 2 |
| 12496-1310-02 | SUBUTEX | OUD | 8 |
| 68258-2991-03 | Buprenorphine | OUD | 8 |
| 49999-0638-30 | SUBUTEX | OUD | 2 |
| 49999-0639-30 | SUBUTEX | OUD | 8 |
| 63629-4092-01 | SUBUTEX | OUD | 8 |
| 63874-1173-03 | SUBUTEX | OUD | 8 |
| 68308-0202-30 | Buprenorphine | OUD | 2 |
| 68308-0208-30 | Buprenorphine | OUD | 8 |
| 35356-0556-30 | Buprenorphine | OUD | 8 |
| 00378-0924-93 | Buprenorphine | OUD | 8 |
| 00054-0176-13 | Buprenorphine | OUD | 2 |
| 00228-3153-03 | Buprenorphine | OUD | 8 |
| 00093-5379-56 | Buprenorphine | OUD | 8 |
| 00093-5378-56 | Buprenorphine | OUD | 2 |
| 00378-0923-93 | Buprenorphine | OUD | 2 |
| 00054-0177-13 | Buprenorphine | OUD | 8 |
| 54569-6578-00 | Buprenorphine | OUD | 8 |
| 50383-0924-93 | Buprenorphine | OUD | 2 |
| 50383-0930-93 | Buprenorphine | OUD | 8 |
| 63874-1174-03 | SUBUTEX | OUD | 2 |
| 55700-0302-30 | Buprenorphine | OUD | 2 |
| 55700-0303-30 | Buprenorphine | OUD | 8 |
| 35356-0555-30 | Buprenorphine | OUD | 2 |
| 00228-3156-03 | Buprenorphine | OUD | 2 |
| 59385-0012-30 | BUNAVAIL | OUD | 2.1–0.3 |
| 59385-0012-01 | BUNAVAIL | OUD | 2.1–0.3 |
| 59385-0016-01 | BUNAVAIL | OUD | 6.3–1 |
| 59385-0014-30 | BUNAVAIL | OUD | 4.2–0.7 |
| 59385-0014-01 | BUNAVAIL | OUD | 4.2–0.7 |
| 59385-0016-30 | BUNAVAIL | OUD | 6.3–1 |
| 00228-3154-03 | BUPRENORPHINE-NALOXONE | OUD | 2–0.5 |
| 00228-3155-03 | BUPRENORPHINE-NALOXONE | OUD | 8–2 |
| 00490-0051-00 | SUBOXONE | OUD | 2–0.5 |
| 00490-0051-30 | SUBOXONE | OUD | 2–0.5 |
| 00490-0051-60 | SUBOXONE | OUD | 2–0.5 |
| 00490-0051-90 | SUBOXONE | OUD | 2–0.5 |
| 12496-1202-01 | SUBOXONE | OUD | 2–0.5 |
| 12496-1202-03 | SUBOXONE | OUD | 2–0.5 |
| 12496-1204-01 | SUBOXONE | OUD | 4–1 |
| 12496-1204-03 | SUBOXONE | OUD | 4–1 |
| 12496-1208-01 | SUBOXONE | OUD | 8–2 |
| 12496-1208-03 | SUBOXONE | OUD | 8–2 |
| 12496-1212-01 | SUBOXONE | OUD | 12–3 |
| 12496-1212-03 | SUBOXONE | OUD | 12–3 |
| 12496-1283-02 | SUBOXONE | OUD | 2–0.5 |
| 12496-1306-02 | SUBOXONE | OUD | 8–2 |
| 16590-0666-05 | SUBOXONE | OUD | 2–0.5 |
| 16590-0666-30 | SUBOXONE | OUD | 2–0.5 |
| 16590-0667-05 | SUBOXONE | OUD | 8–2 |
| 16590-0667-30 | SUBOXONE | OUD | 8–2 |
| 16590-0667-90 | SUBOXONE | OUD | 8–2 |
| 23490-9270-03 | SUBOXONE | OUD | 8–2 |
| 23490-9270-06 | SUBOXONE | OUD | 8–2 |
| 23490-9270-09 | SUBOXONE | OUD | 8–2 |
| 35356-0004-07 | SUBOXONE | OUD | 8–2 |
| 35356-0004-30 | SUBOXONE | OUD | 8–2 |
| 43063-0184-07 | SUBOXONE | OUD | 8–2 |
| 43063-0184-30 | SUBOXONE | OUD | 8–2 |
| 49999-0395-07 | SUBOXONE | OUD | 2–0.5 |
| 49999-0395-15 | SUBOXONE | OUD | 2–0.5 |
| 49999-0395-30 | SUBOXONE | OUD | 2–0.5 |
| 52959-0304-30 | SUBOXONE | OUD | 8–2 |
| 52959-0749-30 | SUBOXONE | OUD | 2–0.5 |
| 54569-5496-00 | SUBOXONE | OUD | 2–0.5 |
| 54569-5739-00 | SUBOXONE | OUD | 8–2 |
| 54569-5739-01 | SUBOXONE | OUD | 8–2 |
| 63629-4028-01 | SUBOXONE | OUD | 2–0.5 |
| 54569-6408-00 | BUPRENORPHINE-NALOXONE | OUD | 8–2 |
| 54123-0114-30 | ZUBSOLV | OUD | 11.4–2.9 |
| 54123-0914-30 | ZUBSOLV | OUD | 1.4–0.36 |
| 54569-5739-02 | SUBOXONE | OUD | 8–2 |
| 54569-6399-00 | SUBOXONE | OUD | 8–2 |
| 54868-5707-00 | SUBOXONE | OUD | 8–2 |
| 53217-0138-30 | BUPRENORPHINE-NALOXONE | OUD | 8–2 |
| 65162-0416-03 | BUPRENORPHINE-NALOXONE | OUD | 2–0.5 |
| 54868-5707-01 | SUBOXONE | OUD | 8–2 |
| 54868-5707-02 | SUBOXONE | OUD | 8–2 |
| 50383-0287-93 | BUPRENORPHINE-NALOXONE | OUD | 8–2 |
| 65162-0415-03 | BUPRENORPHINE-NALOXONE | OUD | 8–2 |
| 54868-5707-03 | SUBOXONE | OUD | 8–2 |
| 00093-5720-56 | BUPRENORPHINE-NALOXONE | OUD | 2–0.5 |
| 00093-5721-56 | BUPRENORPHINE-NALOXONE | OUD | 8–2 |
| 00228-3154-73 | BUPRENORPHINE-NALOXONE | OUD | 2–0.5 |
| 55700-0184-30 | BUPRENORPHINE-NALOXONE | OUD | 2–0.5 |
| 00406-1923-03 | BUPRENORPHINE-NALOXONE | OUD | 2–0.5 |
| 54123-0929-30 | ZUBSOLV | OUD | 2.9–0.71 |
| 00054-0189-13 | BUPRENORPHINE-NALOXONE | OUD | 8–2 |
| 54868-5707-04 | SUBOXONE | OUD | 8–2 |
| 00228-3155-73 | BUPRENORPHINE-NALOXONE | OUD | 8–2 |
| 54868-5750-00 | SUBOXONE | OUD | 2–0.5 |
| 55045-3784-03 | SUBOXONE | OUD | 8–2 |
| 55700-0147-30 | SUBOXONE | OUD | 8–2 |
| 55887-0312-04 | SUBOXONE | OUD | 8–2 |
| 00406-1924-03 | BUPRENORPHINE-NALOXONE | OUD | 8–2 |
| 55887-0312-15 | SUBOXONE | OUD | 8–2 |
| 63629-4034-01 | SUBOXONE | OUD | 8–2 |
| 63629-4034-02 | SUBOXONE | OUD | 8–2 |
| 54123-0957-30 | ZUBSOLV | OUD | 5.7–1.4 |
| 63629-4034-03 | SUBOXONE | OUD | 8–2 |
| 00054-0188-13 | BUPRENORPHINE-NALOXONE | OUD | 2–0.5 |
| 50383-0294-93 | BUPRENORPHINE-NALOXONE | OUD | 2–0.5 |
| 54123-0986-30 | ZUBSOLV | OUD | 8.6–2.1 |
| 63874-1084-03 | SUBOXONE | OUD | 8–2 |
| 42291-0174-30 | BUPRENORPHINE-NALOXONE | OUD | 2–0.5 |
| 42291-0175-30 | BUPRENORPHINE-NALOXONE | OUD | 8–2 |
| 63874-1085-03 | SUBOXONE | OUD | 2–0.5 |
| 66336-0015-30 | SUBOXONE | OUD | 2–0.5 |
| 66336-0016-30 | SUBOXONE | OUD | 8–2 |
| 68071-1380-03 | SUBOXONE | OUD | 8–2 |
| 68071-1510-03 | SUBOXONE | OUD | 2–0.5 |
| 68258-2999-03 | SUBOXONE | OUD | 2–0.5 |
| 65473-0706-01 | ANTABUSE | AUD | 250 |
| 54569-1790-02 | ANTABUSE | AUD | 250 |
| 00054-0356-13 | DISULFIRAM | AUD | 250 |
| 00054-0356-25 | DISULFIRAM | AUD | 250 |
| 00054-0357-13 | DISULFIRAM | AUD | 500 |
| 00054-0357-25 | DISULFIRAM | AUD | 500 |
| 00093-5035-01 | DISULFIRAM | AUD | 250 |
| 51285-0523-02 | ANTABUSE | AUD | 250 |
| 00093-5036-01 | DISULFIRAM | AUD | 500 |
| 51285-0524-02 | ANTABUSE | AUD | 500 |
| 65473-0707-01 | ANTABUSE | AUD | 500 |
| 00378-4140-01 | DISULFIRAM | AUD | 250 |
| 54868-5034-01 | ANTABUSE | AUD | 250 |
| 00378-4141-01 | DISULFIRAM | AUD | 500 |
| 54868-5034-00 | ANTABUSE | AUD | 250 |
| 00603-3431-21 | DISULFIRAM | AUD | 250 |
| 00603-3433-21 | DISULFIRAM | AUD | 250 |
| 00904-1180-60 | DISULFIRAM | AUD | 250 |
| 54868-5034-02 | ANTABUSE | AUD | 250 |
| 47781-0607-30 | DISULFIRAM | AUD | 250 |
| 50111-0331-01 | DISULFIRAM | AUD | 250 |
| 50111-0332-01 | DISULFIRAM | AUD | 500 |
| 60429-0196-01 | DISULFIRAM | AUD | 250 |
| 60429-0196-30 | DISULFIRAM | AUD | 250 |
| 64980-0171-01 | DISULFIRAM | AUD | 250 |
| 64980-0172-01 | DISULFIRAM | AUD | 500 |
| 63459-0300-42 | VIVITROL | AUD, OUD | 380 |
| 65757-0300-01 | VIVITROL | AUD, OUD | 380 |
| 51285-0275-01 | REVIA | AUD, OUD | 50 |
| 52152-0105-30 | NALTREXONE HCL | AUD, OUD | 50 |
| 52152-0105-02 | NALTREXONE HCL | AUD, OUD | 50 |
| 68115-0680-30 | NALTREXONE HCL | AUD, OUD | 50 |
| 00056-0011-30 | REVIA | AUD, OUD | 50 |
| 00056-0011-70 | REVIA | AUD, OUD | 50 |
| 65694-0100-03 | NALTREXONE HCL | AUD, OUD | 50 |
| 65694-0100-10 | NALTREXONE HCL | AUD, OUD | 50 |
| 00555-0902-01 | NALTREXONE HCL | AUD, OUD | 50 |
| 54868-5574-00 | NALTREXONE | AUD, OUD | 50 |
| 43063-0591-15 | NALTREXONE HCL | AUD, OUD | 50 |
| 42291-0632-30 | NALTREXONE HCL | AUD, OUD | 50 |
| 00555-0902-02 | NALTREXONE HCL | AUD, OUD | 50 |
| 51224-0206-30 | NALTREXONE HCL | AUD, OUD | 50 |
| 51224-0206-50 | NALTREXONE HCL | AUD, OUD | 50 |
| 51285-0275-02 | REVIA | AUD, OUD | 50 |
| 00406-1170-03 | NALTREXONE HCL | AUD, OUD | 50 |
| 47335-0326-83 | NALTREXONE HCL | AUD, OUD | 50 |
| 00406-1170-01 | NALTREXONE HCL | AUD, OUD | 50 |
| 16729-0081-10 | NALTREXONE HCL | AUD, OUD | 50 |
| 16729-0081-01 | NALTREXONE HCL | AUD, OUD | 50 |
| 50436-0105-01 | NALTREXONE HCL | AUD, OUD | 50 |
| 47335-0326-88 | NALTREXONE HCL | AUD, OUD | 50 |
| 00185-0039-30 | NALTREXONE HCL | AUD, OUD | 50 |
| 68094-0853-62 | NALTREXONE HCL | AUD, OUD | 50 |
| 68084-0291-11 | NALTREXONE HCL | AUD, OUD | 50 |
| 68084-0291-21 | NALTREXONE HCL | AUD, OUD | 50 |
| 00185-0039-01 | NALTREXONE HCL | AUD, OUD | 50 |
| 00406-0092-03 | DEPADE | AUD, OUD | 50 |
NOTES
-
Stuart EA, McGinty EE, Kalb L, et al. Increased service use among children with autism spectrum disorder associated with Mental Health Parity Law. Health Affairs. 2017; 36(2): 337-345.
-
For more information on the federal rulemaking process refer to: https://www.federalregister.gov/uploads/2011/01/the_rulemaking_process.pdf.
-
Wen H, Cummings JR, Hockenberry JM, et al. State parity laws and access to treatment for substance use disorder in the United States: Implications for federal parity legislation. JAMA Psychiatry. 2013; 70(12): 1355-1362.
-
Barry CL, Huskamp HA, Goldman HH. A political history of Federal Mental Health and Addiction Insurance Parity. Milbank Quarterly. 2010; 88(3): 404-433.
-
Thalmayer AG, Friedman SA, Azocar F, et al. The Mental Health Parity and Addiction Equity Act (MHPAEA) Evaluation Study: Impact on quantitative treatment limits. Psychiatric Services. 2016. doi: 10.1176/appi.ps.201600110 [epub ahead of print].
-
Horgan CM, Hodgkin D, Stewart MT, et al. Health plans' early response to federal parity legislation for mental health and addiction services. Psychiatric Services. 2015; 67(2): 162-168.
-
Goplerud EN. Consistency of Large Employer and Group Health Plan Benefits With Requirements of the Paul Wellstone and Pete Domenici Mental Health Parity and Addition Equity Act of 2008. ASPE. 2013. https://aspe.hhs.gov/report/consistency-large-employer-and-group-health-plan-benefits-requirements-paul-wellstone-and-pete-domenici-mental-health-parity-and-addiction-equity-act-2008.
-
Friedman SA, Thalmayer AG, Azocar F, et al. The Mental Health Parity and Addiction Equity Act evaluation study: Impact on mental health financial requirements among commercial "carve-in" plans. Health Services Research. 2016. doi: 10.1111/1475-6773.12614 [epub ahead of print].
-
Goplerud EN. Consistency of Large Employer and Group Health Plan Benefits With Requirements of the Paul Wellstone and Pete Domenici Mental Health Parity and Addition Equity Act of 2008. ASPE. 2013. https://aspe.hhs.gov/report/consistency-large-employer-and-group-health-plan-benefits-requirements-paul-wellstone-and-pete-domenici-mental-health-parity-and-addiction-equity-act-2008.
-
Horgan CM, Hodgkin D, Stewart MT, et al. Health plans' early response to federal parity legislation for mental health and addiction services. Psychiatric Services. 2015; 67(2): 162-168.
-
Mark TL, Vandivort-Warren R, Miller K. Mental health spending by private insurance: Implications for the Mental Health Parity and Addiction Equity Act. Psychiatric Services. 2012; 63(4): 313-318.
-
Beronio K, Glied S, Frank R. How the Affordable Care Act and Mental Health Parity and Addiction Equity Act greatly expand coverage of behavioral health care. Journal of Behavioral Health Services and Research. 2014; 41(4): 410-428.
-
Grazier KL, Eisenberg D, Jedele JM, et al. Effects of mental health parity on high utilizers of services: Pre-post evidence from a large, self-insured employer. Psychiatric Services. 2016; 67(4): 448-451.
-
Stuart EA, McGinty EE, Kalb L, et al. Increased service use among children with autism spectrum disorder associated with Mental Health Parity Law. Health Affairs. 2017; 36(2): 337-345.
-
Busch AB, Yoon F, Barry CL, et al. The effects of parity on mental health and substance use disorder spending and utilization: Does diagnosis matter? American Journal of Psychiatry. 2013; 170(2): 180-187.
-
Busch SH, Epstein AJ, Harhay MO, et al. The effects of federal parity on substance use disorder treatment running title: Federal parity. American Journal of Managed Care. 2014; 20(1): 76-82.
-
National Center on Addiction and Substance Abuse. Guide to Implementation and Enforcing the Mental Health Parity and Addiction Equity Act (MHPAEA) Requirements for Addiction Prevention and Treatment Benefits. 2014. https://www.centeronaddiction.org/sites/default/files/files/8_3%20Guide-to-implementing-and-enforcing-mhpaea-requirements.pdf.
-
Knopf A. ASAM report on MAT shows egregious parity violations. Alcoholism & Drug Abuse Weekly. 2013. http://www.alcoholismdrugabuseweekly.com/m-article-detail/asam-report-on-mat-shows-egregious-parity-violations.aspx.
-
ASAM. Advancing Access to Addiction Medications: Implications for Opioid Addiction Treatment. 2013. https://www.asam.org/docs/default-source/advocacy/aaam_implications-for-opioid-addiction-treatment_final.
-
Maksabedian E. The effects of MHPAEA on Access of Medication-Assisted Treatment for Opioid Use Disorders. Addiction Health Services Research Conference. 2016. http://ahsr2016.org/pdf/poster_MAKSABEDIAN.pdf.
-
Barry CL, Huskamp HA, Goldman HH. A political history of federal mental health and addiction insurance parity. Milbank Quarterly. 2010; 88(3): 404-433.
-
McGinty EE, Busch SH, Stuart EA, et al. Federal parity law associated with increased probability of using out-of-network substance use disorder treatment services. Health Affairs. 2015; 34(8): 1331-1339.
-
Kyanko KA, Curry LA, Busch SH. Out-of-network provider use more likely in mental health than general health care among privately insured. Medical Care. 2013; 51(8): 699-705.
-
Busch SH, Epstein AJ, Harhay MO, et al. The effects of federal parity on substance use disorder treatment running title: Federal parity. American Journal of Managed Care. 2014; 20(1): 76-82.
-
Ettner SL, Harwood JM, Thalmayer A, et al. The Mental Health Parity and Addiction Equity Act evaluation study: Impact on specialty behavioral health utilization and expenditures among "carve-out" enrollees. Journal of Health Economics. 2016; 50: 131-143.
-
Busch SH, McGinty EE, Stuat EA, et al. Was federal parity associated with changes in out-of-network mental health care use and spending? BMC health Services Research. 2017; 17(1): 315.
-
We did not incorporate the last quarter of 2015 because the classification system of diseases changed from ICD-9-CM to ICD-10-CM starting in October 2015.
-
Mark TL, Vandivort-Warren R, Miller K. Mental health spending by private insurance: Implications for the Mental Health Parity and Addiction Equity Act. Psychiatric Services. 2012; 63(4): 313-338.
-
Stuart EA, McGinty EE, Kalb L, et al. Increased service use among children with autism spectrum disorder associated with Mental Health Parity Law. Health Affairs. 2017; 36(2): 337-345.
-
Theoretically, parity requirements for comparability could affect general medical/surgical care. But the focus of the comparability analysis starts with behavioral health services. So, for example, if a plan has no NQTLs that apply to MH/SUD, then they do not have to assess possible NQTLs on the medical/surgical side. To date we are not aware of any evidence that plans have increased FRs or QTLs on the medical/surgical side, in order to justify continuing these limits for MH/SUD treatments.
-
Goplerud EN. Consistency of Large Employer and Group Health Plan Benefits With Requirements of the Paul Wellstone and Pete Domenici Mental Health Parity and Addition Equity Act of 2008. ASPE. 2013. https://aspe.hhs.gov/report/consistency-large-employer-and-group-health-plan-benefits-requirements-paul-wellstone-and-pete-domenici-mental-health-parity-and-addiction-equity-act-2008.
-
Mark TL, Yee T, Levit KR, et al. Insurance financing increased for mental health conditions but not for substance use disorders, 1986-2014. Health Affairs. 2016; 35(6): 958-965.
-
Levit KR, Mark TL, Coffey RM, et al. Federal spending on behavioral health accelerated during recession as individuals lost employer insurance. Health Affairs. 2013; 32(5): 952-962.
-
Center for Behavioral Health Statistics and Quality. Key Substance Use and Mental Health Indicators in the United States: Results From the 2015 National Survey on Drug Use and Health. HHS Publication No. SMA 16-4984, NSDUH Series H-51. 2016. http://www.samhsa.gov/data/.
-
McGinty EE, Busch SH, Stuart EA, et al. Federal parity law associated with increased probability of using out-of-network substance use disorder treatment services. Health Affairs. 2015; 34(8): 1331-1339.
-
Mark TL, Vandivort-Warren R, Miller K. Mental health spending by private insurance: Implications for the Mental Health Parity and Addiction Equity Act. Psychiatric Services. 2012; 63(4): 313-318.
-
Mark TL, Hodgkin D, Levit KR, Thomas CP. Growth in spending on and use of services for mental and substance use disorders after the Great Recession among individuals with private insurance. Psychiatric Services. 2016;67(5): 504-509.