
Has Treatment for Substance Use Disorders Increased?
ASPE ISSUE BRIEF
Ellen Bouchery
Mathematica
March 2021
Link to Printer Friendly Version in PDF Format (10 PDF pages)
ABSTRACT: This brief presents an overview of trends in substance use disorder treatment between 2015 and 2018 using data from two national surveys sponsored by the Substance Abuse and Mental Health Services Administration (SAMHSA)--the National Survey of Substance Abuse Treatment Services (N-SSATS) and the National Survey on Drug Use and Health (NSDUH). Overall, results suggest increases in the delivery of substance use disorder treatment provided in private doctor's offices and specialty outpatient settings, and the delivery of medication assisted treatment. However, rates of unmet need for substance use disorder remain very high.
This brief was prepared under contract #HHSP233201600021I between the U.S. Department of Health and Human Services, Office of the Assistant Secretary for Planning and Evaluation, Office of Behavioral Health, Disability, and Aging Policy (BHDAP) and Mathematica. For additional information about this subject, you can visit the BHDAP home page at https://aspe.hhs.gov/bhdap or contact the ASPE Project Officers at HHS/ASPE/BHDAP, Room 424E, H.H. Humphrey Building, 200 Independence Avenue, S.W., Washington, D.C. 20201; Judith.Dey@hhs.gov, Laura.Jacobus-Kantor@hhs.gov, Helen.Lamont@hhs.gov.
DISCLAIMER: The opinions and views expressed in this brief are those of the authors. They do not reflect the views of the Department of Health and Human Services, the contractor or any other funding organization. This brief was completed and submitted on March 2020.
| National survey data (2015-2018) collected by Substance Abuse and Mental Health Services Administration provides evidence that recent efforts to improve access to substance use disorder (SUD) treatment have increased access to SUD treatment in private doctor's offices and specialty facility outpatient settings. There were also substantial increases in use of medication-assisted treatment for opioid use disorders. However, the findings also indicate that substantial unmet need for treatment remains among individuals with opioid use disorders and other SUDs. |
Background
Rates of substance use disorder (SUD) treatment were stagnant for the decade from 2004 to 2014 despite high rates of unmet need and expansions in insurance coverage for SUD treatment (Bouchery 2017). The Affordable Care Act specifically required subsidized marketplace insurance plans, individual and small group market plans, and Medicaid expansion programs to cover SUD treatment. The 2008 Mental Health Parity and Addiction Equity Act also required private insurance plans that included behavioral health benefits and were offered through large group insurers to cover those services on par with medical/surgical care. Notwithstanding the increases in insurance coverage that resulted, the number of individuals using SUD treatment was generally constant through 2014 (Bouchery 2017). This suggests that factors other than the cost of care including lack of motivation to change, limited knowledge about the value of treatment, and the stigma associated with seeking treatment may have been limiting increases in use of treatment.
From 2015 to 2018, government officials at all levels implemented policies and programs to address the opioid epidemic. These policies and programs used a multi-faceted approach to address the epidemic but a key pillar of the federal strategy was expanding the use of treatment and recovery support services to help those with opioid use disorders achieve long-term recovery (Volkow 2017). For this purpose, the Substance Abuse and Mental Health Services Administration (SAMHSA) administered approximately $1 billion in grants spread over two years through the State Targeted Response to the Opioid Crisis (Opioid STR) grant program funded in fiscal years (FYs) 2017 and 2018. The additional funding provided through the Opioid STR program represents about a 1.5% increase in total SUD treatment expenditures nationally for FY 2017 and FY 2018.[1] SAMHSA also implemented programs to expand the use of medication-assisted treatment (MAT) for opioid use disorders, as this type of treatment is highly effective but underutilized. One component of the effort to expand MAT use has been to increase the number of providers trained and certified to prescribe buprenorphine in office-based primary care settings.
Population-Based Estimates of Any Treatment Use in the Past Year
SAMHSA's National Survey of Drug Use and Health (NSDUH) is the most comprehensive survey of SUD prevalence and treatment in the United States. It is an annual sample survey of the civilian, noninstitutionalized population of the United States ages 12 or older. Based on NSDUH, Figure 1 shows the number of persons who were treated for a SUD at a specialty facility or by a nonspecialty treatment provider[2] in the past year for each year from 2015 to 2018.
For each type of treatment, the differences between the 2018 estimate and the estimates for each of the prior three years are small, and none are statistically significant. The year-to-year changes in this period are also not statistically significant. Thus, the estimates from NSDUH indicate that nationwide, the number of persons treated for a SUD during this period is generally level.[3]
Likewise, based on NSDUH, there were no significant changes in the number of persons treated in specific treatment locations except for two nonspecialty treatment locations:
-
Self-help groups. The number of persons who received services at a self-help group for a SUD related to illicit drug use declined significantly from 1,204,000 in 2017 to 949,000 in 2018. However, the 2018 estimate was not significantly different from the 2015 and 2016 estimates.
-
Private doctor's office. The number of persons treated for a SUD at a private doctor's office was significantly higher in 2018 than in 2015, increasing 37% from 686,000 in 2015 to 943,000 in 2018.
The change in the number of persons receiving treatment at a private doctor's office may be related to efforts to train and certify primary care providers to prescribe buprenorphine in office-based primary care settings.
The NSDUH also indicates that overall rates of SUD specialty treatment use among persons with a SUD were extremely low and did not change significantly from 2015 to 2018 (Table 1). The only exception was a significantly higher rate of specialty treatment for persons with illicit drug use disorders only and opioid use disorder in 2017 relative to 2018.
Facility-Based Estimates of Clients in Treatment at a Point-in-Time
In contrast to the consistency from 2015 to 2018 in the findings from NSDUH on treatment use, an analysis of estimates from the National Survey of Substance Abuse Treatment Services (N-SSATS), a survey of all specialty SUD treatment facilities[4] nationwide, indicates notable shifts from 2015 to 2017 in the number of clients served, by type of care (Table 2). Overall, N-SSATS indicates that there was a small increase in the total number of clients in care from 2015 to 2017 (3.9%). This increase was driven by a rise in the number of clients in outpatient treatment (6.6%), whereas the number of clients in inpatient and residential treatment declined substantially.
N-SSATS collects counts of clients receiving outpatient care during March of each survey year. Although clients may have received more than one type of outpatient care in March, facilities are asked to report each client they served in only one outpatient type of care category, giving priority to the MAT category for clients who received methadone, buprenorphine maintenance, or naltrexone.
From 2015 to 2017, the number of clients who used regular outpatient and outpatient detoxification services declined and the number of clients who used day treatment and partial hospitalization was constant. In contrast, the number of clients who used intensive outpatient and MAT increased (Table 3).
Interpreting the Findings from NSDUH and N-SSATS in Tandem
Discrepancies between trends in N-SSATS and NSDUH may be a result of differences in the survey methods. Because NSDUH estimates are based on responses from a representative sample of individuals, we expect differences between the samples selected for each survey year. Because we expect these small year-to-year differences, a small increase in treatment use will be indistinguishable from expected annual fluctuations and we are likely to conclude there was no statistically significant change. In contrast, since N-SSATS surveys the universe of facilities, it can detect small changes in outcomes, but its estimates are affected by measurement error as a result of facilities that do not respond to the survey and the estimates are not corrected for this error. The response rate to the N-SSATS was 92% in 2015 and 89% in 2017. Overall, we might expect to find no statistically significant change in the NSDUH, when a small change is identified in the N-SSATS.
Differences in the trends between the two surveys may also be due to differences in the scope of the surveys and the measures of service use (Batts 2014). Although both NSDUH and N-SSATS collect information on the number of individuals in care at specialty SUD treatment facilities, they differ in how they measure this population. NSDUH measures the number of persons who reported that they received any treatment in the past year in a specialty setting, whereas for N-SSATS, specialty facilities report the number of clients in treatment on a single day in each year (the last working day in March of each survey year). The number of outpatient clients in N-SSATS includes individuals who received services during March and who were still enrolled in treatment on the last working day in March. If the average length of treatment for outpatient clients increases, the number of clients who used services in the year which is measured by NSDUH will not show a change; N-SSATS, on the other hand, will show an increase in clients under these circumstances, because clients who began receiving outpatient treatment prior to the last working day in March will be more likely to still be enrolled on that date.
Thus, the lack of change in the population that used specialty services in the past year in NSDUH, paired with the increase in the number of clients observed in N-SSATS, could indicate that the increase in outpatient clients observed in N-SSATS stems from a longer average duration of care for each person who received care rather than an increase in the total number of individuals receiving treatment in the course of a year. Research indicates that longer lengths of treatment improve outcomes and continuing care for up to 12 months increases stability of recovery (Proctor and Herschman 2014).
Increases in the average duration of care may result from the substantial increase (20.5%) from 2015 to 2017 in clients participating in MAT. Guidelines and research on MAT support long-term treatment because the risk of relapse is high when MAT is discontinued and the risk of relapse is the highest in the first 6-12 months after the start of opioid abstinence (ASAM 2015; Hser et al. 2015). Moreover, studies that include long-term follow-up suggest that ongoing pharmacotherapy is associated with better odds of opioid abstinence (Hser et al. 2015; Weiss et al. 2015).
Discussion
Overall, the evidence suggests that recent efforts to improve access to treatment for opioid use disorders increased access to treatment in private doctor's offices and in intensive and regular outpatient treatment in specialty SUD treatment facilities. They have also substantially increased MAT use and may have increased the duration of care for those who receive treatment. These improvements are likely to have positive ramifications for long-term outcomes. The observed increases in MAT are an important step toward reducing opioid overdose deaths and helping those with an opioid use disorder achieve long-term recovery, which is a focus of federal efforts to combat the opioid epidemic.
However, it should be noted that overall SUD treatment use rates remain extremely low. In 2018, only 4.6% and 9.2% of those with an alcohol use disorder or other drug use disorder in the past year, respectively, received any treatment at a specialty facility (SAMHSA 2019b). Rates of treatment for those with an opioid use disorder were somewhat higher at 19.7% (SAMHSA 2019b). Thus, although the findings indicate progress, substantial unmet need for treatment remains among individuals with opioid use disorders and other SUDs.
| FIGURE 1. Number of Persons Treated for a SUD at a Specialty Facility or a Nonspecialty Provider in the Past Year, NSDUH 2015-2018 |
|---|
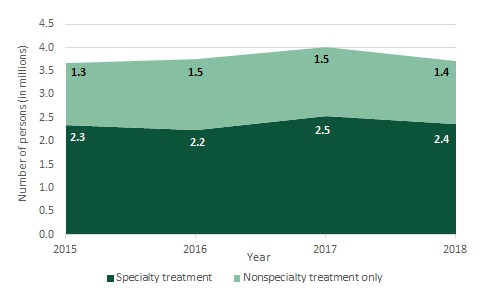 |
| SOURCE: Estimates from 2018 NSDUH Detailed Tables (SAMHSA 2019c). NOTE: Year-to-year differences are not statistically significant at the 0.5 level. Estimates are weighted to estimate values for the survey's full target population. Specialty treatment facilities include hospitals (inpatient only), drug or alcohol rehabilitation facilities (inpatient or outpatient), and mental health centers. |
| TABLE 1. Percent of Persons Aged 12 or Older with Disorder Receiving Specialty Treatment in the Past Year, 2015-2018 | ||||
|---|---|---|---|---|
| Type of Disorder | 2015 | 2016 | 2017 | 2018 |
| Comorbid alcohol and illicit drug use | ||||
| Alcohol use disorder only | 1.0 | 0.7 | 0.4 | 0.4 |
| Illicit drug use disorder only | 11.3 | 9.6 | 14.3a | 9.5 |
| Both illicit drug and alcohol use disorder | 10.4 | 8.2 | 10.0 | 8.6 |
| Select illicit drug use disorder type | ||||
| Marijuana use disorder | 5.0 | 5.1 | 6.7 | 5.1 |
| Cocaine use disorder | 17.7 | 16.7 | 26.9 | 19.0 |
| Methamphetamine use disorder | 25.4 | 17.8 | 23.5 | 18.1 |
| Opioid use disorder | 20.7 | 21.1 | 28.6a | 19.7 |
| Pain reliever use disorder | 18.2 | 17.5 | 20.6 | 15.6 |
| Heroin use disorder | 40.9 | 37.5 | 54.9 | * |
| SOURCE: NSDUH 2015-2018 (SAMHSA 2019c). NOTE: A specialty treatment facility is defined as a hospital (inpatient only), drug or alcohol rehabilitation facility (inpatient or outpatient), or a mental health center.
* Low precision. | ||||
| TABLE 2. Clients in Treatment, by Type of Care Received, Number, 2015-2017 | |||
|---|---|---|---|
| Type of Care | 2015 | 2017 | Percent Increase |
| Total | 1,305,647 | 1,356,015 | 3.9% |
| Outpatient treatment | 1,161,456 | 1,238,654 | 6.6% |
| Residential treatment | 119,900 | 99,881 | -16.7% |
| Inpatient treatment | 24,291 | 17,480 | -28.0% |
| SOURCE: N-SSATS 2015, Table 3.2 (SAMHSA 2017) and N-SSATS 2017, Table 3.2 (SAMHSA 2018). NOTE: For outpatient, clients in treatment are clients who received a treatment services during March and were still enrolled with the facility on the last working day in March of the survey year. For residential and inpatient, clients in treatment are clients receiving services on the last working day in March of the survey year. The response rate for the survey was 92% for 2015 and 89% for 2017. Estimates are not adjusted for nonresponse. | |||
| TABLE 3. Clients in Outpatient Treatment, by Type of Care Received, Number, 2015-2017 | |||
|---|---|---|---|
| Type of Care | 2015 | 2017 | Percent Increase |
| Total | 1,161,456 | 1,238,654 | 6.6% |
| Regular outpatient (ASAM level I) | 604,819 | 599,290 | -0.9% |
| Intensive outpatient (ASAM level II.1) | 128,536 | 133,850 | 4.1% |
| Outpatient detoxification (ASAM levels I-D or II-D) | 14,457 | 11,839 | -18.1% |
| Day treatment/partial hospitalization (ASAM level II.5) | 23,138 | 23,310 | 0.7% |
| Outpatient MAT (Clients receiving methadone/buprenorphine/naltrexone) | 390,506 | 470,365 | 20.5% |
| SOURCE: N-SSATS 2015, Table 3.2 (SAMHSA 2017) and N-SSATS 2017, Table 3.2 (SAMHSA 2018). NOTE: Categories are mutually exclusive. Responding facilities are instructed to report clients in only 1 of the listed categories even if they receive more than 1 service and that clients receiving methadone, buprenorphine maintenance, or naltrexone should be reported in the MAT category. Clients in outpatient treatment are clients who received treatment services during March and were still enrolled with the facility on the last working day in March of the survey year. The response rate for the survey was 92% for 2015 and 89% for 2017. Estimates are not adjusted for nonresponse. | |||
References
American Society of Addiction Medicine (ASAM). "National Practice Guideline for the Use of Medications in the Treatment of Addiction Involving Opioid Use." June 1, 2015. Available at https://www.asam.org/docs/default-source/practice-support/guidelines-and-consensus-docs/asam-national-practice-guideline-supplement.pdf. Accessed April 6, 2020.
Batts, K., M. Pemberton, J. Bose, B. Weimer, L. Henderson, M. Penne, J. Gfroerer, D. Trunzo, and A. Strashny. "Comparing and Evaluating Substance Use Treatment Utilization Estimates from the National Survey on Drug Use and Health and Other Data Sources." Rockville, MD: Substance Abuse and Mental Health Services Administration, 2014.
Bouchery, E. "Examining Substance Use Disorder Treatment Demand and Provider Capacity in a Changing Health Care System: Final Report." Washington, DC: U.S. Department of Health and Human Services, Office of the Assistant Secretary for Planning and Evaluation, 2017.
Hser, Y.I., E. Evans, C. Grella, W. Ling, and D. Anglin. "Long-Term Course of Opioid Addiction." Harvard Review of Psychiatry, vol. 23, no. 2, 2015, pp. 76-89.
Pietras, S., M. Azur, and J. Brown. "Review of Medication-Assisted Treatment Guidelines and Measures for Opioid and Alcohol Use." Washington, DC: U.S. Department of Health and Human Services, Office of the Assistant Secretary for Planning and Evaluation, 2015. Available at https://aspe.hhs.gov/report/review-medication-assisted-treatment-guidelines-and-measures-opioid-and-alcohol-use. Accessed November 9, 2016.
Proctor, S.L., and P.L. Herschman. "The Continuing Care Model of Substance Use Treatment: What Works, and When Is ‘Enough,' ‘Enough?'" Psychiatry Journal, vol. 2014, no. 692423, 2014, pp. 1-16.
Substance Abuse and Mental Health Services Administration (SAMHSA). "National Survey of Substance Abuse Treatment Services (N-SSATS): 2015. Data on Substance Abuse Treatment Facilities." BHSIS Series S-88, HHS Publication No. (SMA) 17-5031. Rockville, MD: SAMHSA, Center for Behavioral Health Statistics and Quality, 2017.
Substance Abuse and Mental Health Services Administration (SAMHSA). "National Survey of Substance Abuse Treatment Services (N-SSATS): 2017. Data on Substance Abuse Treatment Facilities." Rockville, MD: Rockville, MD: SAMHSA, Center for Behavioral Health Statistics and Quality, 2018.
Substance Abuse and Mental Health Services Administration (SAMHSA). "Results from the 2018 National Survey on Drug Use and Health: Detailed Tables Prevalence Estimates, Standard Errors, P Values, and Sample Sizes." Table 7.50A and Table 7.55A. Rockville, MD: SAMHSA, Center for Behavioral Health Statistics and Quality, 2019a. Available at https://www.samhsa.gov/data/sites/default/files/cbhsq-reports/NSDUHDetailedTabs2018R2/NSDUHDetTabsSect7pe2018.htm. Accessed February 16, 2020.
Substance Abuse and Mental Health Services Administration (SAMHSA). "Results from the 2018 National Survey on Drug Use and Health: Detailed Tables Prevalence Estimates, Standard Errors, P Values, and Sample Sizes." Table 7.57B. Rockville, MD: SAMHSA, Center for Behavioral Health Statistics and Quality, 2019b. Available at https://www.samhsa.gov/data/sites/default/files/cbhsq-reports/NSDUHDetailedTabs2018R2/NSDUHDetTabsSect7pe2018.htm. Accessed February 16, 2020.
Substance Abuse and Mental Health Services Administration (SAMHSA). "Key Substance Use and Mental Health Indicators in the United States: Results from the 2018 National Survey on Drug Use and Health." HHS Publication No. PEP19-5068, NSDUH Series H-54. Rockville, MD: SAMHSA, Center for Behavioral Health Statistics and Quality, 2019c.
Volkow, Nora. "Federal Efforts to Combat the Opioid Crisis: A Status Update on CARA and Other Initiatives." October 25, 2017. Available at https://www.drugabuse.gov/about-nida/legislative-activities/testimony-to-congress/2017/federal-efforts-to-combat-opioid-crisis-status-update-cara-other-initiatives. Accessed February 15, 2020.
Weiss, R.D., J.S. Potter, M.L. Griffin, S.E. Provost, G.M. Fitzmaurice, K.A. McDermott, E.N. Srisarajivakul, D.R. Dodd, J.A. Dreifuss, R.K. McHugh, K.M. Carroll. "Long-Term Outcomes from the National Drug Abuse Treatment Clinical Trials Network Prescription Opioid Addiction Treatment Study." Drug and Alcohol Dependence, vol. 150, 2015, pp. 112-119.
Endnotes
-
Mathematica calculated this estimate by dividing $0.5 billion (Opioid STR grant funding for each year) by $34 billion (annual SUD treatment spending for the United States). The most recent available estimate of spending for SUD treatment nationwide indicates that $34 billion was spent in 2014. This estimate is from SAMHSA's Behavioral Health Spending and Use Accounts, 1986-2014 (HHS Publication No. SMA-16-4975.
-
Specialty treatment facilities consist of hospitals (inpatient only), drug or alcohol rehabilitation facilities (inpatient or outpatient), and mental health centers. Nonspecialty treatment facilities consist of emergency rooms, private doctor's offices, self-help groups, and jail or prison treatment.
-
Because NSDUH is a sample survey, it cannot detect small changes in treatment use that are within the margin of error.
-
The The definition of a specialty treatment facility in NSDUH includes hospitals (inpatient only), drug or alcohol rehabilitation facilities (inpatient or outpatient), and mental health centers. The definition of a specialty treatment facility in N-SSATS differs and is based on the facility having units or programs that focus on providing SUD treatment. Thus, a given facility may be defined as "specialty" in one of the surveys, but not in the other. For example, a general hospital or mental health center would not be included in N-SSATS universe unless it has a treatment program or unit designated for SUD treatment. These settings are, however, always considered specialty treatment in NSDUH.
Analyses of Disability, Aging and Long-Term Care Policy and Data
These reports summarize results from BHDAP work examining recent trends in mental health (MH) and substance use disorder (SUD) treatment needs, unmet needs, and system capacity to provide treatment. The reports synthesize data from a variety of existing sources including the National Mental Health Services Survey (N-MHSS), the National Survey of Substance Abuse Treatment Services (N-SSATS), the Treatment Episode Data Set (TEDS), and quality measurement data submitted to the Centers for Medicaid & Medicare Services. Overall, results indicate increasing numbers of individuals with unmet need for MH treatment, very high utilization rates for inpatient and residential MH treatment, and low rates of follow-up for individuals after hospitalization for mental illness. Taken together, these findings suggest that the MH treatment system may not have sufficient capacity to treat current rates of treatment need. The reports also highlight recent increases in the delivery of SUD treatment provided in private doctor’s offices and specialty outpatient settings, and the delivery of medication assisted treatment. Analyses also suggest that SUD prevalence rates have declined among adolescents and young adults, while rates have remained constant, or increased, among adults aged 26 or older. However, rates of unmet need for SUD treatment also remain very high.
Reports were prepared under contract #HHSP233201600021I between the U.S. Department of Health and Human Services, Office of the Assistant Secretary for Planning and Evaluation, Office of Behavioral Health, Disability, and Aging Policy (BHDAP) and Mathematica. For additional information about this subject, you can visit the BHDAP home page at https://aspe.hhs.gov/bhdap or contact the ASPE Project Officers at HHS/ASPE/BHDAP, Room 424E, H.H. Humphrey Building, 200 Independence Avenue, S.W., Washington, D.C. 20201; Judith.Dey@hhs.gov, Laura.Jacobus-Kantor@hhs.gov, Helen.Lamont@hhs.gov.
Reports Available
Has Treatment for Substance Use Disorders Increased? Issue Brief
Chartbook on Behavioral Health Treatment Demand and Provider Capacity in the United States
Mental Health Treatment Need and Treatment System Capacity Issue Brief
Age Group Differences in Progress toward Reducing Substance Use Disorders, 2015-2018 Issue Brief