
Lisa Alecxih and John Corea
The Lewin Group
David Marker
Westat, Inc.
"This report was prepared under contract #HHS-100-96-0012 between U.S. Department of Health and Human Services (HHS), Office of Disability, Aging and Long-Term Care Policy (DALTCP) and the Lewin Group. For additional information about this subject, you can visit the DALTCP home page at http://aspe.hhs.gov/_/office_specific/daltcp.cfm or contact the office at HHS/ASPE/DALTCP, Room 424E, H.H. Humphrey Building, 200 Independence Avenue, S.W., Washington, D.C. 20201. The e-mail address is: webmaster.DALTCP@hhs.gov. The Project Officer was William Marton.
The opinions and views expressed in this report are those of the authors. They do not necessarily reflect the views of the Department of Health and Human Services, the contractor or any other funding organization.
I. INTRODUCTION
This report assesses the statistical issues involved in the production of state-level estimates related to health and welfare issues from three national surveys: the Current Population Survey (CPS), the Survey of Income and Program Participation (SIPP), and the National Health Interview Survey (NHIS). With the devolution of many welfare programs from the Federal Government to the states, there is a strong interest in being able to track the health and welfare of the population in each state. This would allow for examination of the effect of various state welfare initiatives that are to be implemented in the next few years.
Section II provides an overview of the relevant statistical issues involved in making state-level estimates from these surveys, including state stratification, nonsampling errors, and precision of the estimates (see Glossary for additional explanation of these and other highlighted statistical terms used in this report). Section III assesses the abilities of the CPS and SIPP surveys to produce four specific estimates, all expressed as percent of the total population: individuals in households with income below the poverty line, individuals receiving Aid to Families with Dependent Children (AFDC) individuals covered by employer-provided health insurance, and individuals with a disability. Each estimate is examined for the total population, and also for subpopulations of blacks, Hispanics, children, and the elderly.
The most current publicly available databases for each of the three surveys were examined. For the CPS, the most current data are from the March 1996 survey. For the NHIS the most recent data are for 1994. In 1995, the NHIS sample was completely redesigned, so examining the 1994 data would yield little information on the ability of future years to provide state-level estimates. Thus, while no NHIS data are examined, general discussions of the ability of the NHIS to provide the desired estimates are included.
For SIPP the 1993 panel data are available. Like the NHIS, the SIPP was also redesigned in 1996. The 1996 SIPP is about one-and-a-half times as large as the 1993 SIPP. However, the sample design is broadly the same, so the 1993 SIPP provides some useful indicators of the ability of the 1996 SIPP to produce state-level estimates. In addition to the 1996 SIPP, the Bureau of the Census is continuing to follow the 1992 and 1993 SIPP panels in the newly introduced Survey of Program Dynamics (SPD). The SPD will include all of the low-income households from these two SIPP panels, along with a subsample of the panels' other respondents. As shown in Section III, the sample size of each of these surveys severely limits the capability of the surveys to produce state-level estimates, particularly for subpopulations.
All three surveys are multi-stage national probability surveys of households, with questions asked about all or some members of the household. The CPS is a monthly survey of approximately 60,000 households, with a special income-related supplement asked each March. The NHIS is an annual survey of approximately 100,000 individuals in 40,000 households (sample sizes can fluctuate from year to year) with interviews spread out across the entire year. Both of these surveys are redesigned every 10 years to incorporate the latest Decennial Census information. Beginning in 1995, both surveys contain separate strata for each state, separately for metropolitan and non-metropolitan areas. The SIPP is a panel survey with households interviewed three times a year for multiple years. The 1993 SIPP panel had approximately 21,000 households while the 1996 panel has 35,000 households. Unlike the other two surveys, SIPP strata cross state boundaries.
Finally, Section IV examines alternative approaches to overcome the sample size limitations identified in Section III. These approaches include supplementary state samples, combining data from multiple years of the same survey, combining data from the three surveys, and using indirect model-dependent estimators.
II. STATISTICAL ISSUES
A. Accurate Direct Estimates for Every State
Ideally, the CPS, SIPP, and NHIS would be able to provide direct estimates of adequate precision for every state. Direct estimates are the standard survey design-based estimates, such as the sample mean, traditionally produced by government agencies. They are design-based, as opposed to the indirect estimates that are dependent on statistical models (Schaible et al., 1993). As discussed below, these surveys are not large enough to produce accurate direct estimates for every state.
A key factor in producing direct estimates for states is the need to select the sample from strata that respect state boundaries. When strata cross state boundaries, state estimators must either use respondents from other states to represent part of the desired state, or must make assumptions about the relationships across strata within the state. Both of these procedures are problematic. CPS and NHIS use state boundaries in defining sampling strata; however, SIPP does not use state stratification. A project is currently underway at Westat to produce a methodology that will allow the Bureau of the Census to make state estimates from all waves of SIPP and from the SPD for all states. However, except for the largest states, these estimates will be subject to potentially large variances. The methodology is based on a set of assumptions about the strata within each state, and therefore may produce significant bias in the estimates for any state, even large ones.
It should be noted that the precision of state estimates (i.e., standard errors) obtained for these surveys will vary considerably from state-to-state. This is because precision is directly proportional to the square root of the sample size in the state. Thus, estimates will be twice as precise for a state with four times the sample size (assuming the same underlying distribution in both states). While the CPS and NHIS use state stratification, the states are not all allocated the same sample size. Rather, the allocation of sample size to the states is made with the aim of balancing the precision requirements of both state and national estimates. As a result, there are great disparities in sample size by state. The March 1996 CPS interviewed almost 13,000 persons in California, but less than 1,200 in the District of Columbia. The 1993 SIPP panel has over 6,000 and barely 100 persons in the same two jurisdictions. While the 1996 SIPP panel is appreciably larger, it has similar differences. Thus, the precision of CPS estimates for California is 3.5 times greater than for DC, and for SIPP it is 7.5 times greater.
In considering the use of the CPS, NHIS, and SIPP to produce the desired estimates, it needs to be recognized that the estimates produced by the three surveys will differ. These differences are in part due to the different ways the underlying concepts such as poverty and disability are measured and partly due to the differing data measurement procedures. For example, the estimates of percent of households in poverty differ for SIPP and CPS because of the difference in the methods of data collection (SIPP by repeated interviews, CPS by annual recall), particularly for the income data (Ruggles, 1990). Kalton and Mohadjer (1994) examined the differences in disability rates under the distinct definitions used by the three surveys.
B. Precision of Estimates
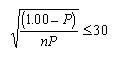
It is impossible to define a single level of precision that is necessary for all estimates. The level of precision that is necessary depends on the use of the estimates. Different Federal agencies have different standards for their data. Some have standards that only determine the level of precision for estimates to be used in analyses, while others have standards for precision for publication. For example, the National Center for Health Statistics has a requirement that coefficients of variation (the standard error of an estimate divided by the mean) not exceed 30 percent. The Center reports and interprets the estimates that have at least this level of precision. Less precise estimates may be reported but are not interpreted.
The precision of a direct estimator is a function of two parameters, the standard deviation of the population distribution and the effective sample size. The precision of an estimate for a characteristic that is highly variable in the population will be less than that for a characteristic that is fairly consistent across the population. The variability of the characteristic is measured by the standard deviation. Similarly, a larger effective sample size will provide more accurate estimates than a smaller effective sample size.
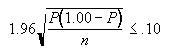
When estimating percentages (as for all four variables examined in Section III of this report), the characteristic is dichotomous, a binomial variable (e.g., in poverty, not in poverty). In this case the standard deviation is a simple function of the percentage with the characteristic. The standard deviation is,

where P is the percentage with the characteristic in the population. The closer the true percentage (e.g., percent in poverty) is to 50 percent, the larger the standard deviation. The closer the percentage is to either 0 or 100 percent, the smaller the standard deviation. For example, the standard deviation when P = 50 percent is 0.50, while the standard deviation when P = 1 percent is 0.10.
The effective sample size is the actual sample size divided by the design effect. The design effect is a factor that reflects the effect on the precision of a survey estimate due to the difference between the sample design actually used to collect the data and a simple random sample of respondents. National in-person household surveys, such as the three considered here, are conducted as stratified, multi-stage, clustered, area-probability surveys. By clustering the sampled households in a limited number of geographic areas, the cost of data collection is significantly reduced. However, respondents in the same cluster are likely to be somewhat similar to one another. As a result, a clustered sample will generally not reflect the entire population as "effectively." Before selecting the sample of clusters, the country is stratified based on characteristics believed to be correlated with the survey variables of greatest interest. This stratification produces more precise survey estimates for targeted domains than an unstratified design. The design effect reflects all aspects of the complex sample design. While the design effect is different for each variable, experience with these surveys indicates that the variables under study will have reasonably similar design effects.
III. ABILITY OF THE THREE NATIONAL SURVEYS TO PRODUCE STATE ESTIMATES
The most current databases for each of the three surveys were examined to assess their ability to provide state-level estimates. For the CPS, the most current data are from the March 1996 survey. For SIPP the 1993 panel data are available.
In future years there will be data from the 1996 SIPP panel and from the SPD. The SPD combines the respondents from the 1992 and 1993 SIPP. However, since only approximately three-quarters of the original respondents to these two waves remain in the SPD, there is a strong potential for bias in some of the estimates produced from this survey. While a larger sample will be available from the 1996 SIPP panel, the basic structure will be similar to the 1993 panel. The new panel assures the inclusion of every state in the survey, but the procedure that was implemented still uses strata that cross state boundaries and does not improve the ability to produce direct estimates for every state. Low-income households have in general been oversampled, resulting in a larger number of poor persons being included in the survey. However, the differential weights resulting from the oversampling may significantly affect the gains in precision that would be expected to result from the oversampling. Thus, it is not possible to make clear generalizations from the 1993 panel to the newer data series based solely on the changes in sample sizes.
Because the most recent NHIS data are for 1993 and the NHIS sample was completely redesigned in 1995, no NHIS data are examined. However, some discussion of the ability of the NHIS to provide the desired estimates is included.
The Bureau of the Census is making plans to introduce the American Community Survey (ACS) beginning around 2002. This survey will collect information from more than one million households annually, using a revised versions of the Census Long Form. If questions of interest to ASPE are included in the ACS, it can be expected to provide more accurate state-level estimates than those described below from the three smaller existing surveys. It is our understanding, however, that it is not certain that this survey will be annual.
A. The Proportion Nationally with the Characteristic
As mentioned in Section II, the accuracy of state-level estimates of proportions is a function of the proportion of the population with the characteristic and the effective sample size. Table 1 shows the proportion of the population in each state estimated by the March 1996 CPS to live below poverty, and the actual sample sizes from which the proportions are estimated. In general, approximately 15 percent of the population are estimated to live in poverty, with approximately double that rate for minorities. The overall rates vary across states, from six percent in New Hampshire to 27 percent in New Mexico. However, many of the state estimates for minorities that differ greatly from the national numbers may be a result of extremely small sample sizes. For example, all state estimates with less than 10 percent or 50 percent or more of their black or Hispanic populations living below the poverty line are based on samples of fewer than 50 minority respondents. The estimate of zero percent of blacks in North Dakota is based on a sample of only two blacks. This demonstrates why great caution is needed before using any state-level estimates. For purposes of this assessment we will use the national proportions, rather than the very unstable state estimates, when calculating precision for each state. For example, rather than using state-specific poverty rates to determine the minimum cell counts for each subpopulation for each state, we use the national poverty rate to determine the threshold applied to each subpopulation across all states. Detailed tables for each of the states are provided in the appendices.
Table 2 provides the national estimates of the proportions with each characteristic based on the CPS and the SIPP. It is important to remember that the estimates reflected in this table do not cover the same time period. These are the values used in the assessment of the surveys' ability to produce accurate state-level estimates.
B. Effective Sample Size
The effective sample size is the sample size from a simple random sample of respondents that would have equivalent precision to that achieved by the complex sample design actually used for the survey. Since standard statistical formulas assume simple random sampling, when using them to estimate the precision of estimates it is important to replace the actual sample size with the effective sample size.
The effective sample size is computed by dividing the actual sample size by a design effect that reflects the effect of the deviations from simple random sampling. Design effects may vary by subgroup (e.g., blacks versus whites) but will generally be fairly consistent across states for each subgroup. This is because in large national surveys, such as the three examined here, a similar sample design, including the number sampled form each PSU, is used in all states. Design effects will also vary by type of question; for example, respondents who live near each other (in the same sampled cluster) are likely to have similar poverty characteristics but are not likely to have similar disability characteristics.
From Westat's experience with these and similar surveys, we have estimated the state-level design effects shown in Table 3 for each of the four characteristics being estimated. National design effects for the CPS are higher than these because they take into account the oversampling of small states by each survey to increase the accuracy of state estimates. This assessment is only examining state estimates, and therefore is only concerned with the survey design within each state.2
Design effects are a function of the average number of completed interviews for the domain of interest that are completed in each cluster. Thus, design effects for subpopulations tend to be smaller than for the entire population, assuming the subpopulations are spread fairly evenly throughout the population. Design effects for children and the elderly may therefore be smaller than those in Table 3. Given that blacks and Hispanics are not evenly distributed across the population, their design effects are not likely to differ from those in the table. For purposes of this assessment, we have assumed that the design effects in the table apply to all subpopulations.
The CPS does no oversampling within states, so there is no additional design effect from differential weighting. (The one exception is that on the March supplement Hispanics are oversampled at twice their normal rate. Given that they represent a small proportion of the total sample, the increase in design effect is not significant.) An absence of oversampling is also true of the 1993 and 1996 SIPP panels. However, the 1996 SPD will oversample low-income populations, resulting in an additional design effect for analyses from that survey. Beginning with the 1995 sample, the NHIS is oversampling blacks and Hispanics, so any analyses of the NHIS will also have to incorporate that design effect. Oversampling in these surveys will also result in larger sample sizes for these subpopulations than would otherwise be observed.
The sample sizes for the 1996 CPS and 1993 SIPP panel vary across states for all of the populations of interest. Table 4 provides the minimum and maximum actual state sample sizes for each survey for each of the populations of interest. These CPS sample sizes are based on respondents to the 1996 March supplement. Sample sizes for the main CPS questionnaire are a little larger since approximately 10 percent of respondents to the main questionnaire do not participate in the supplement, but Hispanic respondents to the previous November's CPS are asked the supplement questions in March. Thus, for questions asked on the main questionnaire (which does not include any of the four questions used in this assessment) the CPS sample sizes will be somewhat larger than used in this assessment. SIPP only asks those under age 70 about work disability, so for this question the minimum and maximum elderly SIPP sizes are 4 and 220. The appendices provide state level detail for sample sizes.
C. Necessary State Sample Sizes
The desired precision of estimates, and therefore the necessary sample size, is a function of the planned use of the estimates. It is therefore impossible to make a general statement on how big a sample is necessary in each state. Instead, it is possible to look at a few illustrative characteristics for each subgroup and examine how often the precision will meet an arbitrary cut-off.
As mentioned earlier, the National Center for Health Statistics (NCHS) tries to ensure that all of its reported values that are analyzed in NCHS reports have a coefficient of variation (cv) less than or equal to 30 percent. Thus, for estimating fairly rare diseases with incidence rates of around 1.0 percent, this rule ensures that the standard error is no greater than 0.30 percentage points, yielding a 95 percent confidence interval of 1.0% ± 0.60%. For proportions closer to 50 percent this rule allows for much larger standard errors. A cv of 30 percent on such an estimate yields a 95 percent confidence interval of 50% ± 30%. Thus, depending on the size of the proportion estimated from the CPS and SIPP, it may be preferable to use different cut-offs for different characteristics.
Table 2 provided the estimated proportions for characteristics in question. The proportion receiving AFDC and the proportion with a work disability (except for the elderly) are both generally around 10 percent or less. For these two characteristics, we used the NCHS rule of a cv not greater than 30 percent. For the other two characteristics and disabled elderly, a smaller cv would be desirable. The estimates for poverty and employer-provided health insurance range from 11 to 60 percent. We chose an arbitrary confidence interval width of less than or equal to ±10 percent on these estimates.
As an alternative, all cut-offs could be specified in terms of standard errors, with larger standard errors acceptable for larger estimated percentages. For example, estimates under 10 percent could have a confidence interval width of ±2 percent, estimates of 20-40 percent a width of ±4 percent, and larger percents a width of ±5 percent. Another alternative for each population and characteristic would be to examine the distribution of standard errors achieved by the existing state samples.
D. Summary Results for the Selected Subgroups and Variables
The estimated proportions in Table 2 are very similar for both the CPS and SIPP. Therefore, the following analyses apply to both surveys. Poverty and health insurance both use the "confidence interval width of ±10 percent or less" rule and are therefore discussed before the two characteristics using the "cv of less than or equal to 30 percent" rule. Please note that the SIPP data combine information for nine states. Therefore, we assessed the 41 states and the District of Columbia for a total of 42 possible "states" from the SIPP.3
Poverty -- The minimum effective sample sizes necessary to achieve a 95 percent confidence interval width of ±10 percent or less for each sample proportion, p, can be calculated by solving the following formula for the effective sample size n. (where P is the population proportion with the characteristic):
To convert to the actual sample size, it is necessary to multiply n by the design effect shown in Table 3. For poverty this is 1.3. This leads to a minimum actual number of approximately 70 respondents for the total population, 110 for blacks or Hispanics, 95 children, and 55 elderly. The criteria differ slightly for the SIPP and the CPS. Both are presented in the appendices.
From the CPS, every state meets these minima for the total population, children, and the elderly (Table 5). Only 24 of the states have a sufficient sample for blacks and 19 states for Hispanics. From SIPP, every state assessed meets these minima only for the total population. The minima are also met for blacks in 20 states, Hispanics in 7 states, children in 35 states, and the elderly in 32 states.
Health Insurance -- The minimum actual sizes necessary to achieve a 95 percent confidence interval width of ±10 percent or less for the percentage receiving employer-provided health insurance is approximately 100 respondents for the total population and for each subpopulation. For the CPS, this is achieved for all states for the total population and children. The minimum is also met for blacks in 25 states, Hispanics in 20 states, and the elderly in 50 states. For the SIPP, this is achieved for all assessed states only for the total population. The minimum is also met for blacks in 20 states, Hispanics in 7 states, children in 34 states, and the elderly in 24 states.
AFDC -- The minimum effective sample size necessary to achieve a cv of less than or equal to 30 percent for each proportion, p, can be calculated by solving the following formula for n:
Note that on AFDC rates near 10 percent, this cv rule results in confidence intervals of ±6 percent. To convert to the actual sample size, it is necessary to multiply n by the design effect shown in Table 3. For AFDC this is 1.2. For the two surveys this leads to a minimum actual number of between 240 (for the SIPP) and 303 (for the CPS) respondents in a state for the total population and between 73 (for blacks from the SIPP) and 133 (for Hispanics from the CPS) for each of the subgroups. AFDC is generally not available to the elderly and therefore that subgroup is not considered for this characteristic.
From the CPS, every state meets these minima for the total population and children. Only 28 of the states have a sufficient sample for blacks and 16 states for Hispanics. From SIPP, the minima are met for the total population in 35 of the 42 assessed states, blacks in 20 states, Hispanics in 7 states, and children in 35 states.
Work Disability -- The minimum actual sizes necessary to achieve a cv of less than or equal to 30 percent for each proportion with a work disability ranges from 100 to 175 for all populations except the elderly and for children. Given that most children under 18 are not in the work force, their proportion with a work disability is also very small. Thus, while few states have the necessary completed interviews with more than 1,000 children, it is unlikely that such estimates will be necessary.
Given their relatively high frequency of disability, the necessary number of completes for the elderly is only 30. This number of completes is available from all states for the CPS and 24 states for SIPP. However, the resulting cv of 30 percent yields a confidence interval of 27% ± 16%. To achieve a confidence interval on this estimate that is no wider than ±10 percent would require 76 elderly respondents, a level reached in all CPS states other than Alaska, but only in 9 of the assessed SIPP states.
For the remaining populations, a cv of less than or equal to 30 percent requires from 100 to 175 completes. For the CPS, this is achieved for the total population in all states and for 27 states for blacks and 14 states for Hispanics. For the SIPP, a large enough number of completes for the total population is found in all of the assessed states except New Mexico and the District of Columbia, while it is only achieved for blacks in 20 states, and in 6 states for Hispanics.
It is worth noting that the work disability question on the CPS is being redesigned to correspond with the more extensive disability questions planned for the 2000 Census long form. Work disability will still be asked, but other types of disability will also be captured. Once wording for the new questions is finalized, they could be compared against other sources to predict the proportion with that type of disability and, by using the formulas in this section, to estimate the number of states that would support accurate estimates.
E. Generalization of the Ability to Produce Accurate Direct Estimates at the State Level Using a Single Time Period
By examining the results of the previous section and the distribution of sample sizes across the states, it is possible to make some general comments on the ability to produce accurate state estimates from a single time period's data for the CPS and SIPP. Unfortunately, the lack of data from the redesigned NHIS makes it impossible to make statements about that survey, beyond the fact that for many states the NHIS sample sizes are so small that direct estimates from a single time period would be subject to large variability. This assessment has also not taken into consideration the effect that the lack of state-stratification has on SIPP estimates. Research is currently being conducted on how that will affect state estimates. Table 5 summarizes the results found in the previous section. It is important to remember that the actual number of completes in a state is a random variable that will change with each round of data collection. Therefore, the exact numbers shown in Table 5 are only approximations for future survey rounds. This is particularly true for subpopulations. Again, the SIPP data combine information for nine states. Therefore, we assessed the 41 states and the District of Columbia for a total of 42 possible "states."
Given the relatively low precision requirements used in the previous section, it is possible to estimate the proportion of the total population in a state with a characteristic for almost all states from either survey. For the CPS, this is also true for children and, except for Alaska, the elderly. The CPS is only able to support estimates for blacks for about half of the states and 30 to 40 percent of the states for Hispanics, depending upon the measure. Given the smaller sample size of the SIPP, its ability to support such estimates for subpopulations is more limited than the CPS. For children and the elderly, the SIPP can support estimates for the majority of states. For blacks, it can produce estimates that meet these levels of precision for around 20 states and for Hispanics in less than 10 states.
If other characteristics of interest to ASPE are contained in the core CPS interview, it would be possible to increase the sample size in each state significantly by combining data from different months of the survey. (CPS respondents are interviewed in four successive months, then dropped for eight months, then interviewed again for the following four months.) Even when this is true, the respondents in a given state are generally all from just a few primary sampling units (PSUs). This results in state-level standard error estimates that are quite unstable. To accurately estimate the accuracy of the estimates, it would be necessary to use some form of generalized variance function model that smoothes precision estimates derived from the different states.
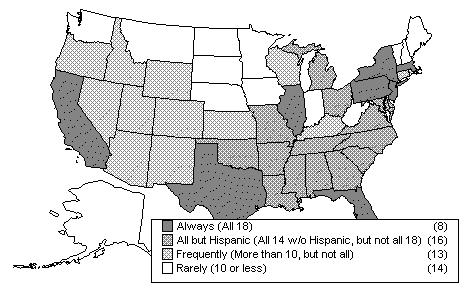
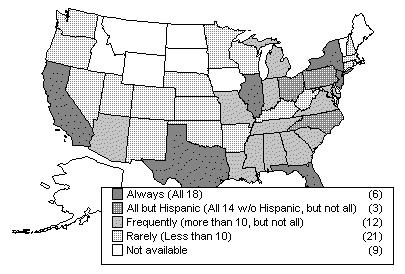
In terms of specific states, the 1996 CPS permits analyses of all of the selected characteristics for the subgroups examined at the specified precision criteria for eight states - California, Florida, Illinois, Massachusetts, New Jersey, New York, Pennsylvania, and Texas. The SIPP permits analyses for six states -- California, Florida, Illinois, New Jersey, New York, and Texas. The binding constraint for the data for a number of states is the sample size for Hispanics. If the selected characteristics for Hispanics are not included in assessing which states meet all of the criteria, 16 states are added for the CPS and three states are added for the SIPP. For the SIPP, work disability among those aged 65 to 69 also caused several states to fail to meet all of the criteria. Table 6 and the two maps (Exhibit 1 and Exhibit 2) provide summary information regarding the number of criteria met for the states. The appendices provide state level detail for each of the selected characteristics and criteria.
It is important to repeat that the precision requirements used in Table 5 and Table 6 are quite arbitrary. If narrower confidence intervals are desired, the number of states meeting the cut-off will obviously be reduced.
| TABLE 1. Percent Living in Poverty and Actual Sample Size by State, March 1996 CPS | ||||||||
|---|---|---|---|---|---|---|---|---|
| Percent Living in Poverty | Actual Sample Size | |||||||
| Black | Hispanic | Other | Total | Black | Hispanic | Other | Total | |
| Alabama | 41% | 25% | 11% | 21% | 507 | 23 | 1,190 | 1,720 |
| Alaska | 21% | 8% | 7% | 8% | 64 | 48 | 1,405 | 1,517 |
| Arizona | 49% | 31% | 12% | 18% | 64 | 747 | 1,325 | 2,136 |
| Arkansas | 38% | 32% | 12% | 17% | 254 | 23 | 1,483 | 1,760 |
| California | 30% | 34% | 11% | 19% | 677 | 5,601 | 6,626 | 12,904 |
| Colorado | 28% | 25% | 7% | 10% | 55 | 311 | 1,418 | 1,784 |
| Connecticut | 32% | 48% | 4% | 11% | 102 | 187 | 1,016 | 1,305 |
| Delaware | 16% | 28% | 10% | 11% | 208 | 61 | 982 | 1,251 |
| District of Columbia | 31% | 21% | 9% | 25% | 761 | 80 | 320 | 1,161 |
| Florida | 36% | 29% | 11% | 18% | 772 | 1,599 | 4,169 | 6,540 |
| Georgia | 23% | 20% | 9% | 14% | 593 | 63 | 1,432 | 2,088 |
| Hawaii | 6% | 17% | 14% | 13% | 44 | 52 | 1,286 | 1,382 |
| Idaho | 0% | 43% | 13% | 15% | 12 | 207 | 1,623 | 1,842 |
| Illinois | 41% | 19% | 8% | 14% | 785 | 767 | 3,806 | 5,358 |
| Indiana | 23% | 17% | 10% | 11% | 91 | 46 | 1,461 | 1,598 |
| Iowa | 28% | 11% | 12% | 13% | 41 | 40 | 1,577 | 1,658 |
| Kansas | 21% | 26% | 11% | 12% | 99 | 89 | 1,447 | 1,635 |
| Kentucky | 44% | 8% | 14% | 16% | 108 | 20 | 1,465 | 1,593 |
| Louisiana | 41% | 28% | 13% | 22% | 458 | 45 | 1,152 | 1,655 |
| Maine | 0% | 31% | 12% | 12% | 3 | 7 | 1,278 | 1,288 |
| Maryland | 24% | 26% | 6% | 12% | 369 | 68 | 1,049 | 1,486 |
| Massachusetts | 31% | 49% | 8% | 11% | 168 | 215 | 2,498 | 2,881 |
| Michigan | 34% | 32% | 9% | 13% | 542 | 126 | 3,663 | 4,331 |
| Minnesota | 33% | 39% | 8% | 10% | 41 | 60 | 1,678 | 1,779 |
| Mississippi | 43% | 50% | 14% | 26% | 621 | 19 | 977 | 1,617 |
| Missouri | 26% | 16% | 10% | 12% | 128 | 40 | 1,316 | 1,484 |
| Montana | 32% | 30% | 16% | 16% | 6 | 41 | 1,660 | 1,707 |
| Nebraska | 31% | 28% | 10% | 11% | 51 | 89 | 1,537 | 1,677 |
| Nevada | 31% | 29% | 8% | 13% | 78 | 291 | 1,110 | 1,479 |
| New Hampshire | 0% | 18% | 6% | 6% | 7 | 20 | 1,202 | 1,229 |
| New Jersey | 18% | 27% | 6% | 9% | 363 | 677 | 2,965 | 4,005 |
| New Mexico | 37% | 35% | 22% | 27% | 24 | 1,206 | 1,137 | 2,367 |
| New York | 35% | 41% | 9% | 18% | 1,128 | 1,907 | 5,781 | 8,816 |
| North Carolina | 31% | 39% | 9% | 14% | 575 | 85 | 2,256 | 2,916 |
| North Dakota | 0% | 21% | 13% | 13% | 2 | 22 | 1,535 | 1,559 |
| Ohio | 33% | 25% | 10% | 13% | 530 | 104 | 4,040 | 4,674 |
| Oklahoma | 44% | 24% | 15% | 18% | 142 | 75 | 1,614 | 1,831 |
| Oregon | 14% | 32% | 11% | 13% | 16 | 138 | 1,455 | 1,609 |
| Pennsylvania | 39% | 36% | 10% | 13% | 526 | 214 | 4,673 | 5,413 |
| Rhode Island | 21% | 35% | 10% | 12% | 43 | 130 | 1,156 | 1,329 |
| South Carolina | 41% | 50% | 11% | 21% | 445 | 16 | 911 | 1,372 |
| South Dakota | 42% | 7% | 15% | 15% | 14 | 13 | 1,748 | 1,775 |
| Tennessee | 29% | 25% | 15% | 18% | 273 | 23 | 1,306 | 1,602 |
| Texas | 24% | 36% | 10% | 19% | 553 | 3,209 | 3,721 | 7,483 |
| Utah | 22% | 42% | 7% | 10% | 11 | 188 | 1,718 | 1,917 |
| Vermont | 0% | 51% | 11% | 11% | 3 | 10 | 1,261 | 1,274 |
| Virginia | 14% | 16% | 11% | 12% | 355 | 80 | 1,375 | 1,810 |
| Washington | 19% | 33% | 13% | 14% | 46 | 85 | 1,467 | 1,598 |
| West Virginia | 55% | 0% | 18% | 18% | 27 | 14 | 1,683 | 1,724 |
| Wisconsin | 49% | 48% | 8% | 11% | 92 | 49 | 1,769 | 1,910 |
| Wyoming | 6% | 4% | 11% | 13% | 16 | 131 | 1,500 | 1,647 |
| United States | 32% | 33% | 10% | 15% | 12,893 | 19,361 | 98,222 | 130,476 |
| TABLE 2. National Estimates of the Proportions with each Characteristic Based on the CPS and the SIPP | ||||||
|---|---|---|---|---|---|---|
| Variable | Total (%) |
Black (%) |
Hispanic (%) |
Children (%) |
Elderly (%) |
|
| 1996 CPS | Income below poverty | 15 | 32 | 33 | 24 | 11 |
| Receiving AFDC | 4 | 13 | 9 | 11 | 0 | |
| Employer-provided health insurance | 60 | 45 | 39 | 59 | 35 | |
| Work disability | 8 | 10 | 6 | 0 | 27 | |
| 1993 SIPP | Income below poverty | 17 | 34 | 35 | 26 | 13 |
| Receiving AFDC | 5 | 15 | 13 | 12 | 0 | |
| Employer-provided health insurance | 59 | 46 | 39 | 56 | 39 | |
| Work disability | 7 | 9 | 6 | 1 | 27 | |
|
||||||
| TABLE 3. Estimated State-Level Design Effects for the CPS and SIPP | |
|---|---|
| Characteristic | Design Effect |
| Income below poverty | 1.3 |
| Receiving AFDC | 1.2 |
| Employer-provided health insurance | 1.1 |
| Work disability | 1.0 |
| TABLE 4. Minimum and Maximum State Sample Sizes for Populations of Interest from the 1996 CPS and 1993 SIPP | ||||||
|---|---|---|---|---|---|---|
| Total | Black | Hispanic | Children | Elderly | ||
| CPS | Minimum | 1,161 (DC) | 2 (ND) | 7 (ME) | 276 (DC) | 59 (AK) |
| Maximum | 12,904 (CA) | 1,128 (NY) | 5,601 (CA) | 4,046 (CA) | 1,212 (CA) | |
| SIPP | Minimum | 104 (DC) | 0 (*) | 0 (*) | 25 (DC) | 14 (*) |
| Maximum | 6,454 (CA) | 435 (TX) | 1,752 (CA) | 1,990 (CA) | 685 (CA) | |
| * Multiple states. | ||||||
| TABLE 5. Number of States with the Sufficient Number of Completes to Provide Estimates of the Desired Level of Precision for Four Characteristics from the 1996 CPS and 1993 SIPP | ||||||
|---|---|---|---|---|---|---|
| Variable | Total | Black | Hispanic | Children | Elderly | |
| CPS | Income below poverty | 51 | 24 | 19 | 51 | 51 |
| Receiving AFDC | 51 | 28 | 16 | 51 | N/A | |
| Employer-provided health insurance | 51 | 25 | 20 | 51 | 50 | |
| Work disability | 51 | 27 | 14 | N/A | 50 | |
| # of States Meeting Criteria for: | ||||||
| All 4 characteristics | 51 | 24 | 14 | N/A | N/A | |
| Only 3 characteristics | -- | 1 | 2 | 51 | 50 | |
| Only 2 characteristics | -- | 2 | 3 | -- | -- | |
| Only 1 characteristic | -- | 1 | 1 | -- | 1 | |
| No characteristics | 11 | 23 | 31 | -- | -- | |
| SIPPa | Income below poverty | 42 | 20 | 7 | 35 | 32 |
| Receiving AFDC | 35 | 20 | 7 | 35 | N/A | |
| Employer-provided health insurance | 42 | 20 | 7 | 34 | 24 | |
| Work disability | 40 | 20 | 6 | N/A | 9b | |
| # of States Meeting Criteria for: | ||||||
| All 4 characteristics | 35 | 20 | 6 | N/A | N/A | |
| Only 3 characteristics | 5 | -- | 1 | 34 | 9 | |
| Only 2 characteristics | 2 | -- | -- | 1 | 15 | |
| Only 1 characteristic | -- | -- | -- | -- | 8 | |
| No characteristics | -- | 22 | 35 | 7 | 10 | |
|
||||||
| TABLE 6. Number of Selected Characteristics and Subgroup Combinations States Meeta | ||||
|---|---|---|---|---|
| March 1996 CPF | 1993 SIPPb | |||
| All Groups Max=18 |
Excluding Hispanics Max=14 |
All Groups Max=18 |
Excluding Hispanics Max=14 |
|
| Alabama | 14 | 14 | 12 | 12 |
| Alaska | 8 | 8 | NA | NA |
| Arizona | 14 | 10 | 12 | 9 |
| Arkansas | 14 | 14 | 7 | 7 |
| California | 18 | 14 | 18 | 14 |
| Colorado | 14 | 10 | 7 | 7 |
| Connecticut | 15 | 12 | 9 | 9 |
| Delaware | 14 | 14 | 3 | 3 |
| District of Columbia | 14 | 14 | 2 | 2 |
| Florida | 18 | 14 | 18 | 14 |
| Georgia | 14 | 14 | 13 | 13 |
| Hawaii | 10 | 10 | 3 | 3 |
| Idaho | 14 | 10 | NA | NA |
| Illinois | 18 | 14 | 18 | 14 |
| Indiana | 10 | 10 | 13 | 13 |
| Iowa | 10 | 10 | NA | NA |
| Kansas | 12 | 12 | 9 | 9 |
| Kentucky | 13 | 13 | 8 | 8 |
| Louisiana | 14 | 14 | 12 | 12 |
| Maine | 10 | 10 | NA | NA |
| Maryland | 14 | 14 | 13 | 13 |
| Massachusetts | 18 | 14 | 9 | 9 |
| Michigan | 16 | 14 | 13 | 13 |
| Minnesota | 10 | 10 | 9 | 9 |
| Mississippi | 14 | 14 | 12 | 12 |
| Missouri | 14 | 14 | 13 | 13 |
| Montana | 10 | 10 | NA | NA |
| Nebraska | 10 | 10 | 7 | 7 |
| Nevada | 14 | 10 | 3 | 3 |
| New Hampshire | 10 | 10 | 3 | 3 |
| New Jersey | 18 | 14 | 18 | 14 |
| New Mexico | 14 | 10 | 2 | 2 |
| New York | 18 | 14 | 18 | 14 |
| North Carolina | 14 | 14 | 14 | 14 |
| North Dakota | 10 | 10 | NA | NA |
| Ohio | 15 | 14 | 14 | 14 |
| Oklahoma | 14 | 14 | 9 | 9 |
| Oregon | 13 | 10 | 9 | 9 |
| Pennsylvania | 18 | 14 | 14 | 14 |
| Rhode Island | 12 | 10 | 3 | 3 |
| South Carolina | 14 | 14 | 12 | 12 |
| South Dakota | 10 | 10 | NA | NA |
| Tennessee | 14 | 14 | 13 | 13 |
| Texas | 18 | 14 | 18 | 14 |
| Utah | 14 | 10 | 7 | 7 |
| Vermont | 10 | 10 | NA | NA |
| Virginia | 14 | 14 | 13 | 13 |
| Washington | 10 | 10 | 9 | 9 |
| West Virginia | 10 | 10 | 8 | 8 |
| Wisconsin | 11 | 11 | 8 | 8 |
| Wyoming | 12 | 10 | NA | NA |
|
||||
| EXHIBIT 1. Number of Estimates for Each State from CPS Data |
 |
| EXHIBIT 2. Number of Estimates for Each State from SIPP Data |
 |
IV. OTHER APPROACHES
There are a variety of procedures that could be followed to increase the number of states for which estimates with a desired level of accuracy can be achieved. These procedures include supplementing the national samples with state samples, combining data from multiple rounds of the same survey, combining data from the three surveys, and the use of indirect model-dependent estimators. The pros and cons of each of these procedures are discussed briefly in the following sections.
A. Supplement the State Samples
We identified three methods of increasing state sample sizes. Each requires advanced planning and additional funding, but, if designed correctly, would permit direct estimation for states with insufficient samples in the current surveys. States could be offered the opportunity to pay the incremental cost of additional data collection in their state.
1. Increase Existing Samples
The most straightforward procedure is to increase the sample sizes for existing surveys in the states, which currently have insufficient sample sizes. (Given the increased interest resulting from devolution in measuring outcomes at the state level, ASPE could also encourage the sponsoring agencies to put more emphasis on state sample sizes in future survey redesigns.)
These additional interviews would most likely be collected from the same primary sampling units (PSUs) currently used by the national survey. This avoids the significant additional costs associated with listing and interviewing in new PSUs. The Bureau of the Census (which conducts the data collection for these three surveys) may place additional restrictions on the within-PSU locations of the supplemental interviews in order to respect their complex rules that attempt to minimize the chance of respondents being interviewed for multiple Census surveys. For most states, this means that the data would continue to be collected from only a few parts of the state. For characteristics that vary significantly from one part of the state to another, point estimates, and their estimated precision, will both be subject to considerable variability. For example, in California, the proportion of the population that is Hispanic drops significantly as one moves from the southern to northern parts of the state. If states were willing to absorb the additional costs, it might be possible to work out an arrangement with the Bureau of the Census whereby additional PSUs could be included in the sample to improve the precision of the estimates.
2. Dual Frame Approach
Alternatively, state sample sizes can be increased using a dual-frame approach. Such a procedure would most likely involve a separate telephone survey that would ask (hopefully) identical questions as those posed in the in-person surveys. (Mail surveys of the general population tend to have response rates that are too low for Government surveys.) These telephone interviews would not be restricted to the PSUs of the in-person survey, rather they could be spread across the entire state. Sirken and Marker (1993) examined the possibility of combining the NHIS with state-level telephone surveys of various sizes. The telephone supplement would obviously be restricted to households with telephones. While only 5 percent of the United States population live in houses without telephones, the rate can be above 15 percent in some states. Many characteristics of interest to the Government are very different for households with and without telephones (Thornberry and Massey, 1986). In such cases, a decision would have to be made as to whether to use an unbiased estimator that weights households separately by whether or not they have a telephone, or a biased estimator with smaller variance that disregards this factor.
3. Add Questions to National Immunization Survey
A third procedure is to add questions to other existing Government surveys, for example, the National Immunization Survey (NIS). The NIS is a telephone survey that screens 900,000 households per year across the entire country to locate children aged 19-35 months and find out about their immunization rates (Ezzati-Rice et al., 1995). If the need for state estimates can be satisfied by the addition of a few questions, it may be economical to try and add them to the NIS screener. The incremental cost of including the few questions is likely to be much less than any attempt to conduct separate supplementary surveys. However, just like with the other dual-frame approaches described above, the extra households obtained from the NIS would be limited to those with telephones, requiring special weighting to retain unbiased estimates. Also, if many additional questions need to be asked, it is unlikely that the NIS or any other survey would be willing to include them in its questionnaire. The National Center for Health Statistics (NCHS) has conducted a pilot test for a State and Local Area Integrated Telephone Survey (SLAITS). SLAITS collects additional information from households screened for the NIS to produce state or local estimates. This June, NCHS plans to conduct another pilot SLAITS that will collect information of interest to ASPE for two states.
In general, the three surveys examined in this report have made great efforts to minimize nonsampling errors (e.g., Jabine et al., 1990). The questions used by the Bureau of the Census have been carefully pretested and the interviewers received detailed training. Given the common procedures used throughout the country for these surveys, nonsampling errors that do exist are likely to be similar across all states, rather than concentrated in a few. States with few PSUs, however, may be subject to interviewer effects because usually a single interviewer is assigned to a PSU. Nonsampling errors may be a more important issue when comparing, or combining, estimates from these three surveys with other surveys conducted by individual states subject to a distinct set of quality controls.
B. Combining Data from Multiple Rounds of the Same Survey
A relatively inexpensive method for improving the accuracy of state estimates is to combine data from multiple years of the same survey. The precision of estimates isn't quite doubled when two years of data are combined, since the sample will typically make use of the same PSUs. This additional clustering will somewhat limit the gains in precision that would otherwise be expected.
With SIPP it is also important to assure that different panels are used in different years, rather than asking the same respondent the same question at two time periods. For questions that appear in the CPS core questionnaire, it is possible to carefully combine samples across months as well as years, but one must take into account the complex pattern CPS uses for re-interviewing respondents. The NHIS uses the same questionnaire throughout the year, so an entire year's interviews can be used.
Another issue in combining data across years is that the question of interest must be asked in each year. Many interesting questions appear on NHIS supplements or SIPP topical modules that are not asked every year. Also, combining multiple years limits how quickly the estimates can detect changes over time. Thus, this procedure may not be ideal if one is interested in measuring the affect of policy changes such as welfare reform.
C. Combining Data from Two or More Surveys
An alternative approach is to use the data from two or more surveys to produce a combined estimate. Unbiased estimates can be produced for each state from the CPS and NHIS. State weights are being produced for SIPP that will hopefully have minimal bias. These can be combined to produce a single estimator. While there are a number of methods for producing such a combined estimator, the most logical procedure is to weight the three estimators in inverse proportion to their mean square errors. This gives greatest strength to the estimate from the survey with the most precise estimate for that state.
For specific characteristics of interest, there may be surveys other than the CPS, SIPP, and NHIS that collect the desired information. For example, Westat is currently collecting the National Survey of America's Families for the Urban Institute in 14 states and the remainder of the country. This study will be redone at the end of the decade to measure the change with devolution of programs to the states.
When combining data from multiple surveys it is very important to examine nonsampling errors. Data from one survey may not be asked in quite the same manner as another survey, or may only be asked of a subset of the population. For example, definitions of disability are not exactly consistent across the three surveys (Kalton and Mohadjer, 1994). The sequence in which questions are asked can also affect the survey estimates. Also, work disability questions are asked of all elderly on the CPS, but only for those under age 70 on SIPP. Income definitions can vary dramatically from one survey to another, for example, by whether or not, and how, they attempt to include non-cash income. The CPS asks for income for an entire year, while SIPP combines reported income from multiple interviews covering one year. On the NHIS, many questions are only asked of a single member of the household, while others are asked for all household members. Each survey has its own rules regarding proxy respondents as well. If proxy responses are allowed the response rates will be higher, but an additional possible source of bias is introduced.
D. Possible Indirect Model-Dependent Estimators
The vast majority of Federal statistics are produced using direct estimates. In some situations, the Government finds it necessary to produce indirect estimates of characteristics for which there are insufficient data at the desired level of aggregation. Schaible et al. (1993) discuss eight current Federal Government programs that use indirect estimators. Two of these programs involve income estimation (state, metropolitan area, and county per capita income estimation by the Bureau of Economic Analysis (BEA) and median income for four-person families by state by the Bureau of the Census), and another uses the NHIS (model-based state estimates).
Fay's (1993) write-up of the Bureau of the Census' estimates of median family income describes how indirect estimators are used to determine inter-censal eligibility for the Low Income Home Energy Assistance Program (LIHEAP). Multivariate regression estimators combine data from the most recent census, the most recent March supplement to the CPS, and BEA data on per capita income.
Malec's (1993) write-up of model-based estimates from NHIS describes how state disability estimates have been published from the NHIS three times, always using indirect estimators. These estimators have involved synthetic estimation, ratio and regression adjustments, and composite estimation. It then describes an ongoing effort to produce estimates of physician visits in the last year using a Bayesian hierarchical approach.
Malec also mentions two other efforts to improve the NHIS' ability to produce state-level estimates. Elston, Koch, and Weissert (1990) used a regression model to stabilize the subgroup means used in synthetic estimates of disability rates. Marker (1995) and Marker and Waksberg (1994) placed a Bayesian prior distribution on the subgroup means to improve synthetic estimates of number of doctor visits in the past year and of self-reported poor health.
Some of these indirect estimators make use of a variety of administrative records maintained by government agencies. For example, the Bureau of the Census has recently developed sub-state poverty estimates that incorporate food stamp and IRS records. To be useful, such administrative records must be available for all states.
An advantage of indirect estimators is that sometimes when it is impossible to accurately produce estimates for individual states, it is still possible to develop useful models that describe the differences observed across a set of states. Thus, if groups of states implement similar programs it may be possible to model the effect of different types of programs, even while not being able to make accurate state-level estimates.
A limitation on the current use of indirect estimators for measuring the effect of the devolution of programs is that the only data that can be used in developing the models is pre-devolution. Models are much better at predicting the future in a steady-state environment. Thus, the utility of indirect estimators may increase in the future as states have a few year's experience implementing their new programs.
There are a wide range of indirect estimators that could be examined for producing state-level estimates. It would be very important for ASPE to evaluate any models that are used to produce indirect estimates, including determining measures of accuracy for these estimators.
V. IMPLICATIONS OF THE FINDINGS
Given the relatively low precision requirements used in the previous section, it is possible to estimate the proportion of the total population in a state with a characteristic for almost all states from either survey. For the CPS, this is also true for children and, except for Alaska, the elderly. The CPS is only able to support estimates for blacks for about half of the states, and for Hispanics in 30 to 40 percent of the states. Given the smaller sample size of the SIPP, its ability to support such estimates for subpopulations is more limited than the CPS. For children and the elderly, the SIPP can support estimates for the majority of states. It can produce estimates for blacks that meet the specified levels of precision for about 20 states and for Hispanics in less than 10 states.
The 1996 CPS permits analyses of all of the selected characteristics for the subgroups examined at the specified levels of precision for eight states -- California, Florida, Illinois, Massachusetts, New Jersey, New York, Pennsylvania, and Texas. The SIPP permits analyses for six states -- California, Florida, Illinois, New Jersey, New York, and Texas. The binding constraint for the data for a number of states is the sample size for Hispanics. If the selected characteristics for Hispanics are not included in assessing which states meet all of the criteria, 16 states are added for the CPS and three states are added for the SIPP. For the SIPP, work disability among those aged 65 to 69 also caused several states to fail to meet all of the criteria.
It is important to repeat that these precision requirements, used in this document are quite arbitrary. If more precise estimates are desired, the number of states meeting the cut-off will obviously be reduced.
We also examined a variety of approaches that could be used to improve state-level estimates. These include supplementing the state samples for states with insufficient samples; combining data from multiple rounds of the same survey; combining data from the three surveys; and using indirect model-dependent estimators.
For several reasons, it may be misleading, or even counterproductive, to require an estimate to meet a standard level of precision to be considered useful. First, using a standard may create the illusion that estimates just meeting the standard are error free, and those that fall just below the standard are entirely uninformative. Second, decision makers often have little choice but to use the best information available, even if it is poor, and an estimate that has "substandard" precision may be the best available. Third, estimates that have low precision can sometimes be usefully combined with other imprecise information to obtain more useful results. The most obvious way to combine imprecise estimates is to combine two separate estimates of the same statistic from different surveys or different rounds of the same survey, as we discussed in Section IV.B and Section IV.C. An alternative method is to use econometric modeling to understand the variable's determinants rather than measuring the variable itself.4
To illustrate this last point, consider an analysis of state poverty rates for children using survey-based state time series on the estimated child poverty rate. For smaller states, much of the variation in the estimates over time will be due to measurement imprecision, and the individual estimates for these states would be of little interest in themselves. Nonetheless, the data series for all states can provide information to the modeling effort, which would focus on understanding how various state-level factors (demographic, economic, and program) affect child poverty rates. This effort would improve our understanding of how specific program changes affect child poverty even if we cannot precisely determine how a specific change in a specific state affected that state's child poverty rate.
In sum, the use of the statistic must be considered in combination with the level of precision to determine the validity of an estimate. This observation lends itself to "rules of thumb" for different types of analyses, but precludes ironclad standards.
VI. REFERENCES
Elston, J.M.; Koch, G.G.; and Weissert, W.G. (1990), "Regression-Adjusted Small Area Estimates of Functional Dependency in the Noninstitutionalized American Population Age 65 and Over." American Journal of Public Health, 81, p 335-43.
Ezzati-Rice, T.M.; Zell, E.R.; Battaglia, M.P.; Ching, P.L.Y.H.; and Wright, R.A. (1995), "The Design of the National Immunization Survey." Proceedings of the Section on Survey Research Methods, American Statistical Association, p 668-72.
Fay, R.E.; Nelson, C.T.; and Litow, L. (1993), "Estimation of Median Income for 4-Person Families by State." In Statistical Policy Working Paper 21: Indirect Estimators in Federal Programs, Federal Committee on Statistical Methodology, Office of Management and Budget, p 9-1 to 9-17.
Jabine, T.B. King, K.E., and Petronoi. R.J. (1990), "Survey of Income and Program Participation: Quality Profile." U.S. Department of Commerce, Bureau of the Census.
Kalton, G. and Mohadjer, L. (1994), "Planning and Developing a Protocol for the Medical Evaluation Study, Subtask 3 Report: Sample Design Options." Submitted to the Social Security Administration Office of Research and Statistics.
Malec, D. (1993), "Model-Based State Estimates From the National Health Interview Survey." In Statistical Policy Working Paper 21: Indirect Estimators in Federal Programs, Federal Committee on Statistical Methodology, Office of Management and Budget, p 8-1 to 8-25.
Marker, D.A. (1995) "Small Area Estimation: A Bayesian Perspective." Unpublished Ph.D. dissertation, University of Michigan.
Marker, D.A. and Waksberg, J. (1994) "Small Area Estimation for the U.S. National Health Interview Survey." Statistics in Transition, 1:6, p 747-68.
Ruggles, P. (1990), Drawing the Line. The Urban Institute Press, Washington DC.
Schaible, W.L.; Fay, R.E.; Gonzalez, J.F.; Hazen, L; Iwig, W.C.; Long, J.F.; Malec, D.J.; and Tupek, A.R. (1993) Statistical Policy Working Paper 21: Indirect Estimators in Federal Programs, Federal Committee on Statistical Methodology, Office of Management and Budget.
Sirken, M.G. and Marker, D.A. (1993), "Dual frame sample surveys based on NHIS and state RDD surveys." Proceedings of the 1993 Public Health Conference on Records and Statistics.
Thornberry, O. and Massey, J. (1986), In Telephone Survey Methodology, Biemer et al. editors, John Wiley & Sons, New York.
Tobin, J. (1994) "Poverty in Relation to Macroeconomic Trends, Cycles, and Policies," in S.H. Danziger, G.D. Sandefur, and D.H. Weinberg (eds.), Confronting Poverty: Prescriptions for Change. Cambridge, MA: Harvard University Press, pp. 147-167.
VII. GLOSSARY
Bias -- The difference between the sample statistic and the population statistic caused by factors other than random error. If a sample statistic is biased, then repeating the survey many times would produce a distribution of sample statistics that would be centered around something other than the population value for the statistic. Thus, a biased sample statistic would have a tendency to be either too small or too large as an estimate of the population statistic. One common source of bias in all surveys occurs when the nonrespondents have different characteristics from the respondents.
Cluster -- A naturally occurring unit like a school (which has many classrooms, students, and teachers). Other clusters include universities, hospitals, cities, states, Census blocks, and living quarters. The clusters are randomly selected, and all members, or a random sample, of the selected cluster are included in the sample.
Coefficient of variation -- The standard error of an estimate divided by the mean.
Composite estimation -- Use of an estimator that is a weighted average of two other estimators. Frequently a composite is constructed from a direct sample-based estimator and a model-based estimator.
Confidence interval -- A range of values used to predict the location of the true population parameter. The probability of the true parameter values falling within the intervals is specified.
Design effect -- The sampling variance of the actual complex design used to select a sample divided by the sampling variance of a simple random sample of the same size. This measure reflects the effect on the precision of a survey estimate due to the difference between the sample design actually used to collect data and a simple random sample.
Effective sample size -- The actual sample size divided by the design effect that reflects the effect of the deviations from simple random sampling.
Estimator (biased, unbiased) -- A random variable used to estimate the value of a population parameter from sample data. Its value depends on the particular sample involved. If the expected value of the estimator over all possible samples is equal to the quantity it estimates, the estimator is unbiased. If it does not, it is biased.
Mean square error -- Measure of accuracy computed by squaring the individual errors (error is the difference between an actual value in a dataset and its expected value) and taking the mean of these squared values.
Multi-stage probability sample -- A sample drawn in successive stages. The population is first divided into primary groups (called primary sampling units or PSUs), some of which are selected (for example, with a probability proportional to their population size). Selected PSUs are then divided into clusters (e.g., of blocks), from which a sample (e.g., of households) is drawn.
Nonsampling error -- The discrepancy between a sample statistic and the true population parameter that results from factors other than the sampling process. Common sources of nonsampling errors include noncoverage of certain subpopulations, questionnaire wording, and recall errors.
Panel survey -- A survey that follows a given sample of individuals over time, thus providing multiple observations on each individual in the sample.
Precision -- The precision is the inverse of the amount of random error in an estimate. It indicates how close an estimate is likely to be to the true population value (see standard error).
Primary sampling unit (PSU) -- Groups selected as the first stage of a multi-stage sample. For example, for the CPS sample, the United States is divided into approximately 1,900 geographic areas, or PSUs, of which 729 are selected for the sample.
Ratio adjustment -- Potentially biased indirect state-level estimates can be ratio adjusted to regional totals so that the sum across states matches regional estimates. This eliminates bias at the regional level and attempts to remove bias from the state-level indirect estimator.
Sampling error -- The discrepancy between a sample statistic and the true population parameter that results from the sampling process. Sampling error can have a random component (sampling variance) and fixed component (bias).
Sampling variance -- Random error (discrepancy between a sample statistic and the true population parameter) that arises because a random process is used to select the survey sample. If the sampling process is repeated several times, a different group of respondents would be selected each time and the sample distributions of answers to the survey questions would be somewhat different in each sample.
Standard deviation -- Common measure of dispersion or spread of data about the mean.
Standard error -- The most commonly used measure of the precision of an estimate. A gauge of how close an estimate is likely to be to the population value in the absence of any bias.
Strata, State stratification -- Stratification is a sampling method whereby the population is divided into subgroups (or "strata"), based on characteristics believed to be correlated with the survey variables of greatest interest, and a sample is then selected from each subgroup. Stratification produces survey estimates of a desired precision within the chosen subgroups, which cannot be assured with an unstratified design. State stratified samples will allow for unbiased state-level estimates and estimates of precision.
Synthetic estimates -- A class of model-dependent estimates generally formed by dividing the population into subgroups (e.g., by age/race/sex) and assuming that national estimates for each subgroup can be applied to the local populations.
NOTES
-
AFDC has now been replaced by Transitional Assistance for Needy Families. This report refers to AFDC since all existing data from these three surveys reports on this program.
-
National design effects are also higher than state-level design effects for the NHIS.
-
The nine states for which the SIPP does not provide individual identifiers are: Alaska, Idaho, Iowa, Maine, Montana, North Dakota, South Dakota, Vermont, and Wyoming.
-
Nobel laureate James Tobin has applied this methodology in an analysis of the relationship between business cycles and adult poverty rates (Tobin, 1994).
APPENDIX A: CPS Tables
| TABLE A-1. States Meeting Preceision Criteria States Meeting Precision Criteria for Selected Characteristics March 1996 CPS |
||||||||
|---|---|---|---|---|---|---|---|---|
| Total Population | ||||||||
| Poverty | AFDC | Employer Ins. | Work Disab. | # Criteria Met (Max=4) |
||||
| Criteria for Cell Count | 65 | 303 | 101 | 125 | ||||
| Alabama | X | X | X | X | 4 | |||
| Alaska | X | X | X | X | 4 | |||
| Arizona | X | X | X | X | 4 | |||
| Arkansas | X | X | X | X | 4 | |||
| California | X | X | X | X | 4 | |||
| Colorado | X | X | X | X | 4 | |||
| Connecticut | X | X | X | X | 4 | |||
| Delaware | X | X | X | X | 4 | |||
| District of Columbia | X | X | X | X | 4 | |||
| Florida | X | X | X | X | 4 | |||
| Georgia | X | X | X | X | 4 | |||
| Hawaii | X | X | X | X | 4 | |||
| Idaho | X | X | X | X | 4 | |||
| Illinois | X | X | X | X | 4 | |||
| Indiana | X | X | X | X | 4 | |||
| Iowa | X | X | X | X | 4 | |||
| Kansas | X | X | X | X | 4 | |||
| Kentucky | X | X | X | X | 4 | |||
| Louisiana | X | X | X | X | 4 | |||
| Maine | X | X | X | X | 4 | |||
| Maryland | X | X | X | X | 4 | |||
| Massachusetts | X | X | X | X | 4 | |||
| Michigan | X | X | X | X | 4 | |||
| Minnesota | X | X | X | X | 4 | |||
| Mississippi | X | X | X | X | 4 | |||
| Missouri | X | X | X | X | 4 | |||
| Montana | X | X | X | X | 4 | |||
| Nebraska | X | X | X | X | 4 | |||
| Nevada | X | X | X | X | 4 | |||
| New Hampshire | X | X | X | X | 4 | |||
| New Jersey | X | X | X | X | 4 | |||
| New Mexico | X | X | X | X | 4 | |||
| New York | X | X | X | X | 4 | |||
| North Carolina | X | X | X | X | 4 | |||
| North Dakota | X | X | X | X | 4 | |||
| Ohio | X | X | X | X | 4 | |||
| Oklahoma | X | X | X | X | 4 | |||
| Oregon | X | X | X | X | 4 | |||
| Pennsylvania | X | X | X | X | 4 | |||
| Rhode Island | X | X | X | X | 4 | |||
| South Carolina | X | X | X | X | 4 | |||
| South Dakota | X | X | X | X | 4 | |||
| Tennessee | X | X | X | X | 4 | |||
| Texas | X | X | X | X | 4 | |||
| Utah | X | X | X | X | 4 | |||
| Vermont | X | X | X | X | 4 | |||
| Virginia | X | X | X | X | 4 | |||
| Washington | X | X | X | X | 4 | |||
| West Virginia | X | X | X | X | 4 | |||
| Wisconsin | X | X | X | X | 4 | |||
| Wyoming | X | X | X | X | 4 | |||
| United States | 51 | 51 | 51 | 51 | ||||
| TABLE A-1. States Meeting Preceision Criteria States Meeting Precision Criteria for Selected Characteristics March 1996 CPS |
||||||||
|---|---|---|---|---|---|---|---|---|
| Under Age 18 | ||||||||
| Poverty | AFDC | Employer Ins. | # Criteria Met (Max=3) |
|||||
| Criteria for Cell Count | 91 | 113 | 103 | |||||
| Alabama | X | X | X | 3 | ||||
| Alaska | X | X | X | 3 | ||||
| Arizona | X | X | X | 3 | ||||
| Arkansas | X | X | X | 3 | ||||
| California | X | X | X | 3 | ||||
| Colorado | X | X | X | 3 | ||||
| Connecticut | X | X | X | 3 | ||||
| Delaware | X | X | X | 3 | ||||
| District of Columbia | X | X | X | 3 | ||||
| Florida | X | X | X | 3 | ||||
| Georgia | X | X | X | 3 | ||||
| Hawaii | X | X | X | 3 | ||||
| Idaho | X | X | X | 3 | ||||
| Illinois | X | X | X | 3 | ||||
| Indiana | X | X | X | 3 | ||||
| Iowa | X | X | X | 3 | ||||
| Kansas | X | X | X | 3 | ||||
| Kentucky | X | X | X | 3 | ||||
| Louisiana | X | X | X | 3 | ||||
| Maine | X | X | X | 3 | ||||
| Maryland | X | X | X | 3 | ||||
| Massachusetts | X | X | X | 3 | ||||
| Michigan | X | X | X | 3 | ||||
| Minnesota | X | X | X | 3 | ||||
| Mississippi | X | X | X | 3 | ||||
| Missouri | X | X | X | 3 | ||||
| Montana | X | X | X | 3 | ||||
| Nebraska | X | X | X | 3 | ||||
| Nevada | X | X | X | 3 | ||||
| New Hampshire | X | X | X | 3 | ||||
| New Jersey | X | X | X | 3 | ||||
| New Mexico | X | X | X | 3 | ||||
| New York | X | X | X | 3 | ||||
| North Carolina | X | X | X | 3 | ||||
| North Dakota | X | X | X | 3 | ||||
| Ohio | X | X | X | 3 | ||||
| Oklahoma | X | X | X | 3 | ||||
| Oregon | X | X | X | 3 | ||||
| Pennsylvania | X | X | X | 3 | ||||
| Rhode Island | X | X | X | 3 | ||||
| South Carolina | X | X | X | 3 | ||||
| South Dakota | X | X | X | 3 | ||||
| Tennessee | X | X | X | 3 | ||||
| Texas | X | X | X | 3 | ||||
| Utah | X | X | X | 3 | ||||
| Vermont | X | X | X | 3 | ||||
| Virginia | X | X | X | 3 | ||||
| Washington | X | X | X | 3 | ||||
| West Virginia | X | X | X | 3 | ||||
| Wisconsin | X | X | X | 3 | ||||
| Wyoming | X | X | X | 3 | ||||
| United States | 51 | 51 | 51 | |||||
| TABLE A-1. States Meeting Preceision Criteria States Meeting Precision Criteria for Selected Characteristics March 1996 CPS |
||||||||
|---|---|---|---|---|---|---|---|---|
| Age 65 and Over | ||||||||
| Poverty | Employer Ins. | Work Disab. | # Criteria Met (Max=3) |
|||||
| Criteria for Cell Count | 48 | 96 | 77 | |||||
| Alabama | X | X | X | 3 | ||||
| Alaska | X | 1 | ||||||
| Arizona | X | X | X | 3 | ||||
| Arkansas | X | X | X | 3 | ||||
| California | X | X | X | 3 | ||||
| Colorado | X | X | X | 3 | ||||
| Connecticut | X | X | X | 3 | ||||
| Delaware | X | X | X | 3 | ||||
| District of Columbia | X | X | X | 3 | ||||
| Florida | X | X | X | 3 | ||||
| Georgia | X | X | X | 3 | ||||
| Hawaii | X | X | X | 3 | ||||
| Idaho | X | X | X | 3 | ||||
| Illinois | X | X | X | 3 | ||||
| Indiana | X | X | X | 3 | ||||
| Iowa | X | X | X | 3 | ||||
| Kansas | X | X | X | 3 | ||||
| Kentucky | X | X | X | 3 | ||||
| Louisiana | X | X | X | 3 | ||||
| Maine | X | X | X | 3 | ||||
| Maryland | X | X | X | 3 | ||||
| Massachusetts | X | X | X | 3 | ||||
| Michigan | X | X | X | 3 | ||||
| Minnesota | X | X | X | 3 | ||||
| Mississippi | X | X | X | 3 | ||||
| Missouri | X | X | X | 3 | ||||
| Montana | X | X | X | 3 | ||||
| Nebraska | X | X | X | 3 | ||||
| Nevada | X | X | X | 3 | ||||
| New Hampshire | X | X | X | 3 | ||||
| New Jersey | X | X | X | 3 | ||||
| New Mexico | X | X | X | 3 | ||||
| New York | X | X | X | 3 | ||||
| North Carolina | X | X | X | 3 | ||||
| North Dakota | X | X | X | 3 | ||||
| Ohio | X | X | X | 3 | ||||
| Oklahoma | X | X | X | 3 | ||||
| Oregon | X | X | X | 3 | ||||
| Pennsylvania | X | X | X | 3 | ||||
| Rhode Island | X | X | X | 3 | ||||
| South Carolina | X | X | X | 3 | ||||
| South Dakota | X | X | X | 3 | ||||
| Tennessee | X | X | X | 3 | ||||
| Texas | X | X | X | 3 | ||||
| Utah | X | X | X | 3 | ||||
| Vermont | X | X | X | 3 | ||||
| Virginia | X | X | X | 3 | ||||
| Washington | X | X | X | 3 | ||||
| West Virginia | X | X | X | 3 | ||||
| Wisconsin | X | X | X | 3 | ||||
| Wyoming | X | X | X | 3 | ||||
| United States | 51 | 50 | 50 | |||||
| TABLE A-1. States Meeting Preceision Criteria States Meeting Precision Criteria for Selected Characteristics March 1996 CPS |
||||||||
|---|---|---|---|---|---|---|---|---|
| Black | ||||||||
| Poverty | AFDC | Employer Ins. | Work Disab. | # Criteria Met (Max=4) |
||||
| Criteria for Cell Count | 109 | 92 | 105 | 97 | ||||
| Alabama | X | X | X | X | 4 | |||
| Alaska | - | |||||||
| Arizona | - | |||||||
| Arkansas | X | X | X | X | 4 | |||
| California | X | X | X | X | 4 | |||
| Colorado | - | |||||||
| Connecticut | X | X | 2 | |||||
| Delaware | X | X | X | X | 4 | |||
| District of Columbia | X | X | X | X | 4 | |||
| Florida | X | X | X | X | 4 | |||
| Georgia | X | X | X | X | 4 | |||
| Hawaii | - | |||||||
| Idaho | - | |||||||
| Illinois | X | X | X | X | 4 | |||
| Indiana | - | |||||||
| Iowa | - | |||||||
| Kansas | X | X | 2 | |||||
| Kentucky | X | X | X | 3 | ||||
| Louisiana | X | X | X | X | 4 | |||
| Maine | -4 | |||||||
| Maryland | X | X | X | X | 4 | |||
| Massachusetts | X | X | X | X | 4 | |||
| Michigan | X | X | X | X | 4 | |||
| Minnesota | - | |||||||
| Mississippi | X | X | X | X | 4 | |||
| Missouri | X | X | X | X | 4 | |||
| Montana | - | |||||||
| Nebraska | - | |||||||
| Nevada | - | |||||||
| New Hampshire | - | |||||||
| New Jersey | X | X | X | X | 4 | |||
| New Mexico | - | |||||||
| New York | X | X | X | X | 4 | |||
| North Carolina | X | X | X | X | 4 | |||
| North Dakota | - | |||||||
| Ohio | X | X | X | X | 4 | |||
| Oklahoma | X | X | X | X | 4 | |||
| Oregon | - | |||||||
| Pennsylvania | X | X | X | X | 4 | |||
| Rhode Island | - | |||||||
| South Carolina | X | X | X | X | 4 | |||
| South Dakota | - | |||||||
| Tennessee | X | X | X | X | 4 | |||
| Texas | X | X | X | X | 4 | |||
| Utah | - | |||||||
| Vermont | - | |||||||
| Virginia | X | X | X | X | 4 | |||
| Washington | - | |||||||
| West Virginia | - | |||||||
| Wisconsin | X | 1 | ||||||
| Wyoming | - | |||||||
| United States | 24 | 28 | 25 | 27 | ||||
| TABLE A-1. States Meeting Preceision Criteria States Meeting Precision Criteria for Selected Characteristics March 1996 CPS |
||||||||
|---|---|---|---|---|---|---|---|---|
| Hispanic | ||||||||
| Poverty | AFDC | Employer Ins. | Work Disab. | # Criteria Met (Max=4) |
||||
| Criteria for Cell Count | 111 | 133 | 101 | 188 | ||||
| Alabama | - | |||||||
| Alaska | - | |||||||
| Arizona | X | X | X | X | 4 | |||
| Arkansas | - | |||||||
| California | X | X | X | X | 4 | |||
| Colorado | X | X | X | X | 4 | |||
| Connecticut | X | X | X | 3 | ||||
| Delaware | - | |||||||
| District of Columbia | - | |||||||
| Florida | X | X | X | X | 4 | |||
| Georgia | - | |||||||
| Hawaii | - | |||||||
| Idaho | X | X | X | X | 4 | |||
| Illinois | X | X | X | X | 4 | |||
| Indiana | - | |||||||
| Iowa | - | |||||||
| Kansas | - | |||||||
| Kentucky | - | |||||||
| Louisiana | - | |||||||
| Maine | - | |||||||
| Maryland | - | |||||||
| Massachusetts | X | X | X | X | 4 | |||
| Michigan | X | X | 2 | |||||
| Minnesota | - | |||||||
| Mississippi | - | |||||||
| Missouri | - | |||||||
| Montana | - | |||||||
| Nebraska | - | |||||||
| Nevada | X | X | X | X | 4 | |||
| New Hampshire | - | |||||||
| New Jersey | X | X | X | X | 4 | |||
| New Mexico | X | X | X | X | 4 | |||
| New York | X | X | X | X | 4 | |||
| North Carolina | - | |||||||
| North Dakota | - | |||||||
| Ohio | X | 1 | ||||||
| Oklahoma | - | |||||||
| Oregon | X | X | X | 3 | ||||
| Pennsylvania | X | X | X | X | 4 | |||
| Rhode Island | X | X | 2 | |||||
| South Carolina | - | |||||||
| South Dakota | - | |||||||
| Tennessee | - | |||||||
| Texas | X | X | X | X | 4 | |||
| Utah | X | X | X | X | 4 | |||
| Vermont | - | |||||||
| Virginia | - | |||||||
| Washington | - | |||||||
| West Virginia | - | |||||||
| Wisconsin | - | |||||||
| Wyoming | X | X | 2 | |||||
| United States | 19 | 16 | 20 | 14 | ||||
| TABLE A-2. Weighted Percent by Race Tabulations of the March 1996 CPS for Selected Characteristics Percent with Characteristics by Race |
||||||||
|---|---|---|---|---|---|---|---|---|
| Family Income Less than 100% of the Poverty Level | ||||||||
| Black | Hispanic | Other | Total | |||||
| Alabama | 41% | 25% | 11% | 21% | ||||
| Alaska | 21% | 8% | 7% | 8% | ||||
| Arizona | 49% | 31% | 12% | 18% | ||||
| Arkansas | 38% | 32% | 12% | 17% | ||||
| California | 30% | 34% | 11% | 19% | ||||
| Colorado | 28% | 25% | 7% | 10% | ||||
| Connecticut | 32% | 48% | 4% | 11% | ||||
| Delaware | 16% | 28% | 10% | 11% | ||||
| District of Columbia | 31% | 21% | 9% | 25% | ||||
| Florida | 36% | 29% | 11% | 18% | ||||
| Georgia | 23% | 20% | 9% | 14% | ||||
| Hawaii | 6% | 17% | 14% | 13% | ||||
| Idaho | 0% | 43% | 13% | 15% | ||||
| Illinois | 41% | 19% | 8% | 14% | ||||
| Indiana | 23% | 17% | 10% | 11% | ||||
| Iowa | 28% | 11% | 12% | 13% | ||||
| Kansas | 21% | 26% | 11% | 12% | ||||
| Kentucky | 44% | 8% | 14% | 16% | ||||
| Louisiana | 41% | 28% | 13% | 22% | ||||
| Maine | 0% | 31% | 12% | 12% | ||||
| Maryland | 24% | 26% | 6% | 12% | ||||
| Massachusetts | 31% | 49% | 8% | 11% | ||||
| Michigan | 34% | 32% | 9% | 13% | ||||
| Minnesota | 33% | 39% | 8% | 10% | ||||
| Mississippi | 43% | 50% | 14% | 26% | ||||
| Missouri | 26% | 16% | 10% | 12% | ||||
| Montana | 32% | 30% | 16% | 16% | ||||
| Nebraska | 31% | 28% | 10% | 11% | ||||
| Nevada | 31% | 29% | 8% | 13% | ||||
| New Hampshire | 0% | 18% | 6% | 6% | ||||
| New Jersey | 18% | 27% | 6% | 9% | ||||
| New Mexico | 37% | 35% | 22% | 27% | ||||
| New York | 35% | 41% | 9% | 18% | ||||
| North Carolina | 31% | 39% | 9% | 14% | ||||
| North Dakota | 0% | 21% | 13% | 13% | ||||
| Ohio | 33% | 25% | 10% | 13% | ||||
| Oklahoma | 44% | 24% | 15% | 18% | ||||
| Oregon | 14% | 32% | 11% | 13% | ||||
| Pennsylvania | 39% | 36% | 10% | 13% | ||||
| Rhode Island | 21% | 35% | 10% | 12% | ||||
| South Carolina | 41% | 50% | 11% | 21% | ||||
| South Dakota | 42% | 7% | 15% | 15% | ||||
| Tennessee | 29% | 25% | 15% | 18% | ||||
| Texas | 24% | 36% | 10% | 19% | ||||
| Utah | 22% | 42% | 7% | 10% | ||||
| Vermont | 0% | 51% | 11% | 11% | ||||
| Virginia | 14% | 16% | 11% | 12% | ||||
| Washington | 19% | 33% | 13% | 14% | ||||
| West Virginia | 55% | 0% | 18% | 18% | ||||
| Wisconsin | 49% | 48% | 8% | 11% | ||||
| Wyoming | 6% | 43% | 11% | 13% | ||||
| United States | 32% | 33% | 10% | 15% | ||||
| TABLE A-2. Weighted Percent by Race Tabulations of the March 1996 CPS for Selected Characteristics Percent with Characteristics by Race |
||||||||
|---|---|---|---|---|---|---|---|---|
| Persons Age 15+ Receiving AFDC | ||||||||
| Black | Hispanic | Other | Total | |||||
| Alabama | 3% | 0% | 0% | 1% | ||||
| Alaska | 4% | 0% | 1% | 1% | ||||
| Arizona | 9% | 1% | 1% | 1% | ||||
| Arkansas | 3% | 0% | 0% | 1% | ||||
| California | 5% | 3% | 1% | 2% | ||||
| Colorado | 5% | 3% | 0% | 1% | ||||
| Connecticut | 4% | 13% | 0% | 2% | ||||
| Delaware | 1% | 3% | 1% | 1% | ||||
| District of Columbia | 5% | 1% | 0% | 4% | ||||
| Florida | 4% | 2% | 1% | 1% | ||||
| Georgia | 3% | 0% | 1% | 1% | ||||
| Hawaii | 2% | 0% | 1% | 1% | ||||
| Idaho | 0% | 2% | 1% | 1% | ||||
| Illinois | 6% | 1% | 1% | 2% | ||||
| Indiana | 4% | 0% | 1% | 1% | ||||
| Iowa | 10% | 0% | 1% | 1% | ||||
| Kansas | 2% | 2% | 1% | 1% | ||||
| Kentucky | 5% | 0% | 1% | 2% | ||||
| Louisiana | 3% | 0% | 0% | 1% | ||||
| Maine | 0% | 19% | 1% | 1% | ||||
| Maryland | 3% | 0% | 0% | 1% | ||||
| Massachusetts | 3% | 9% | 1% | 1% | ||||
| Michigan | 6% | 4% | 1% | 2% | ||||
| Minnesota | 5% | 4% | 1% | 1% | ||||
| Mississippi | 6% | 0% | 1% | 3% | ||||
| Missouri | 3% | 0% | 1% | 1% | ||||
| Montana | 0% | 3% | 2% | 2% | ||||
| Nebraska | 8% | 5% | 1% | 1% | ||||
| Nevada | 2% | 1% | 0% | 1% | ||||
| New Hampshire | 0% | 5% | 1% | 1% | ||||
| New Jersey | 2% | 3% | 0% | 1% | ||||
| New Mexico | 9% | 3% | 1% | 2% | ||||
| New York | 5% | 6% | 1% | 2% | ||||
| North Carolina | 3% | 1% | 1% | 1% | ||||
| North Dakota | 0% | 0% | 1% | 1% | ||||
| Ohio | 5% | 3% | 1% | 1% | ||||
| Oklahoma | 6% | 1% | 1% | 1% | ||||
| Oregon | 4% | 3% | 2% | 2% | ||||
| Pennsylvania | 4% | 2% | 0% | 1% | ||||
| Rhode Island | 2% | 4% | 1% | 1% | ||||
| South Carolina | 4% | 0% | 1% | 2% | ||||
| South Dakota | 0% | 0% | 1% | 1% | ||||
| Tennessee | 3% | 4% | 1% | 1% | ||||
| Texas | 4% | 2% | 0% | 1% | ||||
| Utah | 0% | 1% | 0% | 0% | ||||
| Vermont | 0% | 0% | 1% | 1% | ||||
| Virginia | 1% | 0% | 1% | 1% | ||||
| Washington | 2% | 1% | 2% | 2% | ||||
| West Virginia | 4% | 0% | 2% | 2% | ||||
| Wisconsin | 6% | 6% | 1% | 1% | ||||
| Wyoming | 0% | 3% | 1% | 2% | ||||
| United States | 4% | 3% | 1% | 1% | ||||
| TABLE A-2. Weighted Percent by Race Tabulations of the March 1996 CPS for Selected Characteristics Percent with Characteristics by Race |
||||||||
|---|---|---|---|---|---|---|---|---|
| All Persons Receiving AFDC | ||||||||
| Black | Hispanic | Other | Total | |||||
| Alabama | 9% | 0% | 1% | 4% | ||||
| Alaska | 11% | 0% | 4% | 4% | ||||
| Arizona | 35% | 4% | 2% | 3% | ||||
| Arkansas | 10% | 0% | 1% | 2% | ||||
| California | 16% | 10% | 4% | 6% | ||||
| Colorado | 13% | 10% | 1% | 2% | ||||
| Connecticut | 17% | 37% | 1% | 6% | ||||
| Delaware | 3% | 18% | 2% | 3% | ||||
| District of Columbia | 15% | 2% | 0% | 11% | ||||
| Florida | 12% | 6% | 2% | 4% | ||||
| Georgia | 10% | 0% | 1% | 4% | ||||
| Hawaii | 12% | 0% | 3% | 3% | ||||
| Idaho | 0% | 12% | 3% | 3% | ||||
| Illinois | 22% | 6% | 2% | 6% | ||||
| Indiana | 8% | 0% | 3% | 3% | ||||
| Iowa | 36% | 0% | 2% | 3% | ||||
| Kansas | 5% | 7% | 3% | 3% | ||||
| Kentucky | 17% | 8% | 3% | 4% | ||||
| Louisiana | 12% | 3% | 1% | 4% | ||||
| Maine | 0% | 19% | 2% | 2% | ||||
| Maryland | 9% | 0% | 1% | 3% | ||||
| Massachusetts | 11% | 28% | 2% | 4% | ||||
| Michigan | 19% | 17% | 3% | 5% | ||||
| Minnesota | 28% | 16% | 2% | 3% | ||||
| Mississippi | 16% | 0% | 2% | 7% | ||||
| Missouri | 8% | 0% | 1% | 2% | ||||
| Montana | 0% | 12% | 4% | 5% | ||||
| Nebraska | 24% | 13% | 2% | 3% | ||||
| Nevada | 9% | 2% | 1% | 2% | ||||
| New Hampshire | 0% | 14% | 2% | 2% | ||||
| New Jersey | 5% | 9% | 1% | 2% | ||||
| New Mexico | 23% | 9% | 4% | 6% | ||||
| New York | 12% | 18% | 1% | 5% | ||||
| North Carolina | 10% | 4% | 1% | 3% | ||||
| North Dakota | 0% | 0% | 1% | 1% | ||||
| Ohio | 17% | 8% | 3% | 5% | ||||
| Oklahoma | 22% | 8% | 2% | 4% | ||||
| Oregon | 14% | 9% | 5% | 5% | ||||
| Pennsylvania | 12% | 9% | 1% | 3% | ||||
| Rhode Island | 7% | 13% | 2% | 3% | ||||
| South Carolina | 12% | 0% | 1% | 5% | ||||
| South Dakota | 1% | 0% | 3% | 3% | ||||
| Tennessee | 9% | 4% | 2% | 4% | ||||
| Texas | 11% | 6% | 1% | 4% | ||||
| Utah | 0% | 6% | 1% | 1% | ||||
| Vermont | 0% | 51% | 4% | 4% | ||||
| Virginia | 5% | 0% | 2% | 2% | ||||
| Washington | 13% | 6% | 5% | 5% | ||||
| West Virginia | 12% | 0% | 5% | 5% | ||||
| Wisconsin | 27% | 17% | 2% | 3% | ||||
| Wyoming | 0% | 7% | 3% | 3% | ||||
| United States | 13% | 9% | 2% | 4% | ||||
| TABLE A-2. Weighted Percent by Race Tabulations of the March 1996 CPS for Selected Characteristics Percent with Characteristics by Race |
||||||||
|---|---|---|---|---|---|---|---|---|
| Employer Provided Health Insurance | ||||||||
| Black | Hispanic | Other | Total | |||||
| Alabama | 43% | 64% | 60% | 59% | ||||
| Alaska | 58% | 50% | 62% | 62% | ||||
| Arizona | 44% | 42% | 59% | 54% | ||||
| Arkansas | 40% | 52% | 59% | 55% | ||||
| California | 43% | 37% | 61% | 53% | ||||
| Colorado | 50% | 54% | 69% | 66% | ||||
| Connecticut | 56% | 35% | 76% | 70% | ||||
| Delaware | 60% | 53% | 70% | 67% | ||||
| District of Columbia | 48% | 45% | 73% | 54% | ||||
| Florida | 41% | 40% | 57% | 52% | ||||
| Georgia | 44% | 44% | 68% | 60% | ||||
| Hawaii | 31% | 45% | 63% | 62% | ||||
| Idaho | 31% | 40% | 62% | 60% | ||||
| Illinois | 46% | 62% | 71% | 66% | ||||
| Indiana | 52% | 54% | 69% | 68% | ||||
| Iowa | 41% | 53% | 62% | 61% | ||||
| Kansas | 48% | 52% | 60% | 59% | ||||
| Kentucky | 42% | 85% | 61% | 60% | ||||
| Louisiana | 29% | 35% | 57% | 48% | ||||
| Maine | 73% | 59% | 64% | 64% | ||||
| Maryland | 54% | 52% | 71% | 66% | ||||
| Massachusetts | 53% | 30% | 70% | 67% | ||||
| Michigan | 48% | 47% | 74% | 71% | ||||
| Minnesota | 28% | 51% | 67% | 66% | ||||
| Mississippi | 40% | 59% | 61% | 53% | ||||
| Missouri | 53% | 38% | 65% | 63% | ||||
| Montana | 17% | 43% | 53% | 52% | ||||
| Nebraska | 45% | 49% | 63% | 62% | ||||
| Nevada | 46% | 43% | 68% | 63% | ||||
| New Hampshire | 28% | 68% | 71% | 71% | ||||
| New Jersey | 60% | 47% | 70% | 66% | ||||
| New Mexico | 47% | 37% | 48% | 44% | ||||
| New York | 44% | 35% | 68% | 60% | ||||
| North Carolina | 43% | 23% | 65% | 60% | ||||
| North Dakota | 100% | 31% | 56% | 56% | ||||
| Ohio | 49% | 63% | 69% | 67% | ||||
| Oklahoma | 26% | 44% | 55% | 52% | ||||
| Oregon | 72% | 45% | 64% | 63% | ||||
| Pennsylvania | 43% | 43% | 69% | 66% | ||||
| Rhode Island | 49% | 22% | 65% | 62% | ||||
| South Carolina | 48% | 15% | 63% | 58% | ||||
| South Dakota | 45% | 65% | 59% | 59% | ||||
| Tennessee | 46% | 32% | 60% | 57% | ||||
| Texas | 48% | 36% | 64% | 54% | ||||
| Utah | 78% | 41% | 72% | 70% | ||||
| Vermont | 100% | 29% | 64% | 64% | ||||
| Virginia | 55% | 52% | 64% | 62% | ||||
| Washington | 56% | 22% | 64% | 62% | ||||
| West Virginia | 25% | 49% | 59% | 59% | ||||
| Wisconsin | 36% | 40% | 75% | 72% | ||||
| Wyoming | 31% | 26% | 59% | 57% | ||||
| United States | 45% | 39% | 66% | 60% | ||||
| TABLE A-2. Weighted Percent by Race Tabulations of the March 1996 CPS for Selected Characteristics Percent with Characteristics by Race |
||||||||
|---|---|---|---|---|---|---|---|---|
| Work Disability | ||||||||
| Black | Hispanic | Other | Total | |||||
| Alabama | 15% | 0% | 10% | 11% | ||||
| Alaska | 3% | 9% | 4% | 4% | ||||
| Arizona | 7% | 4% | 9% | 7% | ||||
| Arkansas | 13% | 0% | 13% | 13% | ||||
| California | 12% | 4% | 8% | 7% | ||||
| Colorado | 7% | 5% | 7% | 7% | ||||
| Connecticut | 7% | 7% | 5% | 5% | ||||
| Delaware | 7% | 4% | 7% | 7% | ||||
| District of Columbia | 11% | 5% | 6% | 10% | ||||
| Florida | 9% | 8% | 9% | 9% | ||||
| Georgia | 11% | 1% | 9% | 10% | ||||
| Hawaii | 5% | 10% | 4% | 4% | ||||
| Idaho | 0% | 4% | 10% | 10% | ||||
| Illinois | 7% | 5% | 7% | 7% | ||||
| Indiana | 12% | 13% | 8% | 8% | ||||
| Iowa | 2% | 8% | 7% | 7% | ||||
| Kansas | 5% | 8% | 9% | 9% | ||||
| Kentucky | 11% | 4% | 15% | 14% | ||||
| Louisiana | 13% | 8% | 9% | 10% | ||||
| Maine | 27% | 12% | 8% | 9% | ||||
| Maryland | 10% | 3% | 6% | 7% | ||||
| Massachusetts | 9% | 11% | 8% | 8% | ||||
| Michigan | 13% | 9% | 8% | 9% | ||||
| Minnesota | 5% | 5% | 6% | 6% | ||||
| Mississippi | 10% | 5% | 10% | 10% | ||||
| Missouri | 14% | 6% | 6% | 7% | ||||
| Montana | 0% | 7% | 10% | 10% | ||||
| Nebraska | 13% | 9% | 7% | 7% | ||||
| Nevada | 14% | 3% | 9% | 8% | ||||
| New Hampshire | 28% | 14% | 9% | 9% | ||||
| New Jersey | 8% | 6% | 6% | 6% | ||||
| New Mexico | 6% | 9% | 9% | 9% | ||||
| New York | 9% | 7% | 8% | 8% | ||||
| North Carolina | 11% | 3% | 10% | 10% | ||||
| North Dakota | 0% | 0% | 6% | 6% | ||||
| Ohio | 13% | 10% | 8% | 9% | ||||
| Oklahoma | 8% | 8% | 9% | 8% | ||||
| Oregon | 10% | 5% | 9% | 9% | ||||
| Pennsylvania | 13% | 10% | 9% | 9% | ||||
| Rhode Island | 2% | 12% | 10% | 10% | ||||
| South Carolina | 8% | 0% | 8% | 8% | ||||
| South Dakota | 14% | 7% | 8% | 8% | ||||
| Tennessee | 12% | 15% | 10% | 10% | ||||
| Texas | 9% | 6% | 8% | 8% | ||||
| Utah | 0% | 3% | 6% | 6% | ||||
| Vermont | 0% | 14% | 7% | 7% | ||||
| Virginia | 10% | 2% | 10% | 9% | ||||
| Washington | 8% | 3% | 9% | 9% | ||||
| West Virginia | 14% | 8% | 14% | 14% | ||||
| Wisconsin | 8% | 5% | 6% | 6% | ||||
| Wyoming | 6% | 9% | 8% | 8% | ||||
| United States | 10% | 6% | 8% | 8% | ||||
| TABLE A-3. Unweighted Cell Counts by Race Tabulations of the March 1996 CPS for Selected Characteristics Unweighted Cell Counts by Race |
||||||||
|---|---|---|---|---|---|---|---|---|
| Total | ||||||||
| Black | Hispanic | Other | Total | |||||
| Alabama | 507 | 23 | 1,190 | 1,720 | ||||
| Alaska | 64 | 48 | 1,405 | 1,517 | ||||
| Arizona | 64 | 747 | 1,325 | 2,136 | ||||
| Arkansas | 254 | 23 | 1,483 | 1,760 | ||||
| California | 677 | 5,601 | 6,626 | 12,904 | ||||
| Colorado | 55 | 311 | 1,418 | 1,784 | ||||
| Connecticut | 102 | 187 | 1,016 | 1,305 | ||||
| Delaware | 208 | 61 | 982 | 1,251 | ||||
| District of Columbia | 761 | 80 | 320 | 1,161 | ||||
| Florida | 772 | 1,599 | 4,169 | 6,540 | ||||
| Georgia | 593 | 63 | 1,432 | 2,088 | ||||
| Hawaii | 44 | 52 | 1,286 | 1,382 | ||||
| Idaho | 12 | 207 | 1,623 | 1,842 | ||||
| Illinois | 785 | 767 | 3,806 | 5,358 | ||||
| Indiana | 91 | 46 | 1,461 | 1,598 | ||||
| Iowa | 41 | 40 | 1,577 | 1,658 | ||||
| Kansas | 99 | 89 | 1,447 | 1,635 | ||||
| Kentucky | 108 | 20 | 1,465 | 1,593 | ||||
| Louisiana | 458 | 45 | 1,152 | 1,655 | ||||
| Maine | 3 | 7 | 1,278 | 1,288 | ||||
| Maryland | 369 | 68 | 1,049 | 1,486 | ||||
| Massachusetts | 168 | 215 | 2,498 | 2,881 | ||||
| Michigan | 542 | 126 | 3,663 | 4,331 | ||||
| Minnesota | 41 | 60 | 1,678 | 1,779 | ||||
| Mississippi | 621 | 19 | 977 | 1,617 | ||||
| Missouri | 128 | 40 | 1,316 | 1,484 | ||||
| Montana | 6 | 41 | 1,660 | 1,707 | ||||
| Nebraska | 51 | 89 | 1,537 | 1,677 | ||||
| Nevada | 78 | 291 | 1,110 | 1,479 | ||||
| New Hampshire | 7 | 20 | 1,202 | 1,229 | ||||
| New Jersey | 363 | 677 | 2,965 | 4,005 | ||||
| New Mexico | 24 | 1,206 | 1,137 | 2,367 | ||||
| New York | 1,128 | 1,907 | 5,781 | 8,816 | ||||
| North Carolina | 575 | 85 | 2,256 | 2,916 | ||||
| North Dakota | 2 | 22 | 1,535 | 1,559 | ||||
| Ohio | 530 | 104 | 4,040 | 4,674 | ||||
| Oklahoma | 142 | 75 | 1,614 | 1,831 | ||||
| Oregon | 16 | 138 | 1,455 | 1,609 | ||||
| Pennsylvania | 526 | 214 | 4,673 | 5,413 | ||||
| Rhode Island | 43 | 130 | 1,156 | 1,329 | ||||
| South Carolina | 445 | 16 | 911 | 1,372 | ||||
| South Dakota | 14 | 13 | 1,748 | 1,775 | ||||
| Tennessee | 273 | 23 | 1,306 | 1,602 | ||||
| Texas | 553 | 3,209 | 3,721 | 7,483 | ||||
| Utah | 11 | 188 | 1,718 | 1,917 | ||||
| Vermont | 3 | 10 | 1,261 | 1,274 | ||||
| Virginia | 355 | 80 | 1,375 | 1,810 | ||||
| Washington | 46 | 85 | 1,467 | 1,598 | ||||
| West Virginia | 27 | 14 | 1,683 | 1,724 | ||||
| Wisconsin | 92 | 49 | 1,769 | 1,910 | ||||
| Wyoming | 16 | 131 | 1,500 | 1,647 | ||||
| United States | 12,893 | 19,361 | 98,222 | 130,476 | ||||
| TABLE A-3. Unweighted Cell Counts by Race Tabulations of the March 1996 CPS for Selected Characteristics Unweighted Cell Counts by Race |
||||||||
|---|---|---|---|---|---|---|---|---|
| Family Income Less than 100% of the Poverty Level | ||||||||
| Black | Hispanic | Other | Total | |||||
| Alabama | 212 | 5 | 126 | 343 | ||||
| Alaska | 13 | 4 | 95 | 112 | ||||
| Arizona | 31 | 227 | 159 | 417 | ||||
| Arkansas | 94 | 6 | 178 | 278 | ||||
| California | 202 | 1,954 | 712 | 2,868 | ||||
| Colorado | 16 | 68 | 91 | 175 | ||||
| Connecticut | 30 | 85 | 46 | 161 | ||||
| Delaware | 35 | 14 | 96 | 145 | ||||
| District of Columbia | 239 | 16 | 28 | 283 | ||||
| Florida | 276 | 444 | 479 | 1,199 | ||||
| Georgia | 143 | 11 | 128 | 282 | ||||
| Hawaii | 3 | 9 | 172 | 184 | ||||
| Idaho | - | 90 | 214 | 304 | ||||
| Illinois | 328 | 152 | 289 | 769 | ||||
| Indiana | 21 | 8 | 143 | 172 | ||||
| Iowa | 12 | 4 | 192 | 208 | ||||
| Kansas | 20 | 26 | 160 | 206 | ||||
| Kentucky | 48 | 1 | 206 | 255 | ||||
| Louisiana | 201 | 13 | 144 | 358 | ||||
| Maine | - | 2 | 153 | 155 | ||||
| Maryland | 91 | 17 | 62 | 170 | ||||
| Massachusetts | 52 | 109 | 199 | 360 | ||||
| Michigan | 183 | 36 | 338 | 557 | ||||
| Minnesota | 11 | 24 | 139 | 174 | ||||
| Mississippi | 271 | 10 | 138 | 419 | ||||
| Missouri | 32 | 5 | 133 | 170 | ||||
| Montana | 2 | 12 | 254 | 268 | ||||
| Nebraska | 16 | 23 | 157 | 196 | ||||
| Nevada | 25 | 76 | 94 | 195 | ||||
| New Hampshire | - | 4 | 75 | 79 | ||||
| New Jersey | 65 | 171 | 164 | 400 | ||||
| New Mexico | 9 | 406 | 235 | 650 | ||||
| New York | 401 | 769 | 560 | 1,730 | ||||
| North Carolina | 186 | 31 | 198 | 415 | ||||
| North Dakota | - | 3 | 192 | 195 | ||||
| Ohio | 174 | 33 | 383 | 590 | ||||
| Oklahoma | 63 | 17 | 241 | 321 | ||||
| Oregon | 3 | 46 | 162 | 211 | ||||
| Pennsylvania | 207 | 82 | 418 | 707 | ||||
| Rhode Island | 8 | 45 | 116 | 169 | ||||
| South Carolina | 182 | 7 | 97 | 286 | ||||
| South Dakota | 6 | 1 | 316 | 323 | ||||
| Tennessee | 81 | 5 | 179 | 265 | ||||
| Texas | 132 | 1,144 | 360 | 1,636 | ||||
| Utah | 2 | 63 | 119 | 184 | ||||
| Vermont | - | 3 | 134 | 137 | ||||
| Virginia | 52 | 16 | 148 | 216 | ||||
| Washington | 9 | 25 | 198 | 232 | ||||
| West Virginia | 14 | - | 298 | 312 | ||||
| Wisconsin | 43 | 20 | 141 | 204 | ||||
| Wyoming | 1 | 51 | 167 | 219 | ||||
| United States | 4,245 | 6,393 | 10,226 | 20,864 | ||||
| TABLE A-3. Unweighted Cell Counts by Race Tabulations of the March 1996 CPS for Selected Characteristics Unweighted Cell Counts by Race |
||||||||
|---|---|---|---|---|---|---|---|---|
| Persons Age 15+ Receiving AFDC | ||||||||
| Black | Hispanic | Other | Total | |||||
| Alabama | 15 | - | 5 | 20 | ||||
| Alaska | 2 | - | 19 | 21 | ||||
| Arizona | 5 | 8 | 8 | 21 | ||||
| Arkansas | 7 | - | 6 | 13 | ||||
| California | 30 | 180 | 93 | 303 | ||||
| Colorado | 3 | 10 | 4 | 17 | ||||
| Connecticut | 4 | 23 | 3 | 30 | ||||
| Delaware | 2 | 1 | 6 | 9 | ||||
| District of Columbia | 40 | 1 | 1 | 42 | ||||
| Florida | 28 | 23 | 30 | 81 | ||||
| Georgia | 16 | - | 7 | 23 | ||||
| Hawaii | 1 | - | 15 | 16 | ||||
| Idaho | - | 5 | 18 | 23 | ||||
| Illinois | 48 | 12 | 29 | 89 | ||||
| Indiana | 4 | - | 13 | 17 | ||||
| Iowa | 4 | - | 14 | 18 | ||||
| Kansas | 2 | 2 | 16 | 20 | ||||
| Kentucky | 5 | - | 17 | 22 | ||||
| Louisiana | 17 | - | 2 | 19 | ||||
| Maine | - | 1 | 11 | 12 | ||||
| Maryland | 11 | - | 4 | 15 | ||||
| Massachusetts | 5 | 20 | 21 | 46 | ||||
| Michigan | 36 | 5 | 34 | 75 | ||||
| Minnesota | 2 | 3 | 15 | 20 | ||||
| Mississippi | 35 | - | 6 | 41 | ||||
| Missouri | 3 | - | 7 | 10 | ||||
| Montana | - | 1 | 26 | 27 | ||||
| Nebraska | 4 | 5 | 9 | 18 | ||||
| Nevada | 2 | 2 | 4 | 8 | ||||
| New Hampshire | - | 1 | 11 | 12 | ||||
| New Jersey | 7 | 20 | 14 | 41 | ||||
| New Mexico | 2 | 32 | 12 | 46 | ||||
| New York | 50 | 114 | 30 | 194 | ||||
| North Carolina | 18 | 1 | 11 | 30 | ||||
| North Dakota | - | - | 9 | 9 | ||||
| Ohio | 25 | 4 | 42 | 71 | ||||
| Oklahoma | 8 | 1 | 12 | 21 | ||||
| Oregon | 1 | 5 | 22 | 28 | ||||
| Pennsylvania | 21 | 6 | 22 | 49 | ||||
| Rhode Island | 1 | 6 | 8 | 15 | ||||
| South Carolina | 17 | - | 5 | 22 | ||||
| South Dakota | - | - | 21 | 21 | ||||
| Tennessee | 7 | 1 | 11 | 19 | ||||
| Texas | 23 | 58 | 13 | 94 | ||||
| Utah | - | 2 | 5 | 7 | ||||
| Vermont | - | - | 16 | 16 | ||||
| Virginia | 5 | - | 8 | 13 | ||||
| Washington | 1 | 1 | 31 | 33 | ||||
| West Virginia | 1 | - | 28 | 29 | ||||
| Wisconsin | 6 | 3 | 12 | 21 | ||||
| Wyoming | - | 2 | 20 | 22 | ||||
| United States | 524 | 559 | 806 | 1,889 | ||||
| TABLE A-3. Unweighted Cell Counts by Race Tabulations of the March 1996 CPS for Selected Characteristics Unweighted Cell Counts by Race |
||||||||
|---|---|---|---|---|---|---|---|---|
| All Persons Receiving AFDC | ||||||||
| Black | Hispanic | Other | Total | |||||
| Alabama | 47 | - | 11 | 58 | ||||
| Alaska | 7 | - | 57 | 64 | ||||
| Arizona | 22 | 28 | 22 | 72 | ||||
| Arkansas | 24 | - | 14 | 38 | ||||
| California | 98 | 580 | 247 | 925 | ||||
| Colorado | 8 | 33 | 10 | 51 | ||||
| Connecticut | 15 | 67 | 8 | 90 | ||||
| Delaware | 7 | 7 | 19 | 33 | ||||
| District of Columbia | 116 | 2 | 1 | 119 | ||||
| Florida | 94 | 80 | 77 | 251 | ||||
| Georgia | 59 | - | 16 | 75 | ||||
| Hawaii | 6 | - | 37 | 43 | ||||
| Idaho | - | 21 | 44 | 65 | ||||
| Illinois | 173 | 46 | 82 | 301 | ||||
| Indiana | 8 | - | 39 | 47 | ||||
| Iowa | 16 | - | 35 | 51 | ||||
| Kansas | 5 | 6 | 45 | 56 | ||||
| Kentucky | 18 | 1 | 40 | 59 | ||||
| Louisiana | 59 | 1 | 7 | 67 | ||||
| Maine | - | 1 | 21 | 22 | ||||
| Maryland | 35 | - | 9 | 44 | ||||
| Massachusetts | 20 | 59 | 55 | 134 | ||||
| Michigan | 108 | 16 | 105 | 229 | ||||
| Minnesota | 11 | 10 | 35 | 56 | ||||
| Mississippi | 103 | - | 15 | 118 | ||||
| Missouri | 11 | - | 19 | 30 | ||||
| Montana | - | 5 | 67 | 72 | ||||
| Nebraska | 13 | 11 | 27 | 51 | ||||
| Nevada | 7 | 5 | 10 | 22 | ||||
| New Hampshire | - | 3 | 28 | 31 | ||||
| New Jersey | 19 | 66 | 34 | 119 | ||||
| New Mexico | 5 | 101 | 42 | 148 | ||||
| New York | 133 | 345 | 79 | 557 | ||||
| North Carolina | 57 | 4 | 22 | 83 | ||||
| North Dakota | - | - | 22 | 22 | ||||
| Ohio | 87 | 11 | 133 | 231 | ||||
| Oklahoma | 30 | 6 | 31 | 67 | ||||
| Oregon | 3 | 13 | 68 | 84 | ||||
| Pennsylvania | 67 | 20 | 62 | 149 | ||||
| Rhode Island | 3 | 17 | 21 | 41 | ||||
| South Carolina | 52 | - | 13 | 65 | ||||
| South Dakota | 1 | - | 67 | 68 | ||||
| Tennessee | 23 | 1 | 30 | 54 | ||||
| Texas | 62 | 190 | 34 | 286 | ||||
| Utah | - | 7 | 17 | 24 | ||||
| Vermont | - | 3 | 47 | 50 | ||||
| Virginia | 16 | - | 21 | 37 | ||||
| Washington | 6 | 6 | 73 | 85 | ||||
| West Virginia | 3 | - | 86 | 89 | ||||
| Wisconsin | 24 | 8 | 30 | 62 | ||||
| Wyoming | - | 5 | 47 | 52 | ||||
| United States | 1,681 | 1,785 | 2,181 | 5,647 | ||||
| TABLE A-3. Unweighted Cell Counts by Race Tabulations of the March 1996 CPS for Selected Characteristics Unweighted Cell Counts by Race |
||||||||
|---|---|---|---|---|---|---|---|---|
| Employer Provided Health Insurance | ||||||||
| Black | Hispanic | Other | Total | |||||
| Alabama | 223 | 15 | 785 | 1,023 | ||||
| Alaska | 38 | 24 | 884 | 946 | ||||
| Arizona | 29 | 327 | 779 | 1,135 | ||||
| Arkansas | 98 | 15 | 869 | 982 | ||||
| California | 305 | 2,084 | 4,004 | 6,393 | ||||
| Colorado | 27 | 171 | 980 | 1,178 | ||||
| Connecticut | 56 | 67 | 775 | 898 | ||||
| Delaware | 129 | 34 | 683 | 846 | ||||
| District of Columbia | 376 | 36 | 232 | 644 | ||||
| Florida | 318 | 672 | 2,384 | 3,374 | ||||
| Georgia | 269 | 27 | 979 | 1,275 | ||||
| Hawaii | 13 | 24 | 822 | 859 | ||||
| Idaho | 4 | 81 | 1,008 | 1,093 | ||||
| Illinois | 371 | 477 | 2,767 | 3,615 | ||||
| Indiana | 48 | 26 | 1,009 | 1,083 | ||||
| Iowa | 16 | 24 | 974 | 1,014 | ||||
| Kansas | 48 | 45 | 873 | 966 | ||||
| Kentucky | 48 | 17 | 898 | 963 | ||||
| Louisiana | 135 | 17 | 663 | 815 | ||||
| Maine | 2 | 4 | 815 | 821 | ||||
| Maryland | 200 | 34 | 745 | 979 | ||||
| Massachusetts | 88 | 66 | 1,745 | 1,899 | ||||
| Michigan | 264 | 66 | 2,779 | 3,109 | ||||
| Minnesota | 12 | 30 | 1,127 | 1,169 | ||||
| Mississippi | 244 | 11 | 596 | 851 | ||||
| Missouri | 67 | 17 | 848 | 932 | ||||
| Montana | 1 | 20 | 878 | 899 | ||||
| Nebraska | 23 | 42 | 955 | 1,020 | ||||
| Nevada | 35 | 141 | 757 | 933 | ||||
| New Hampshire | 2 | 14 | 855 | 871 | ||||
| New Jersey | 220 | 339 | 2,069 | 2,628 | ||||
| New Mexico | 11 | 473 | 570 | 1,054 | ||||
| New York | 516 | 688 | 3,943 | 5,147 | ||||
| North Carolina | 260 | 24 | 1,479 | 1,763 | ||||
| North Dakota | 2 | 7 | 868 | 877 | ||||
| Ohio | 271 | 65 | 2,813 | 3,149 | ||||
| Oklahoma | 42 | 34 | 892 | 968 | ||||
| Oregon | 11 | 61 | 941 | 1,013 | ||||
| Pennsylvania | 232 | 94 | 3,290 | 3,616 | ||||
| Rhode Island | 22 | 32 | 749 | 803 | ||||
| South Carolina | 214 | 3 | 578 | 795 | ||||
| South Dakota | 6 | 9 | 978 | 993 | ||||
| Tennessee | 132 | 8 | 789 | 929 | ||||
| Texas | 264 | 1,188 | 2,396 | 3,848 | ||||
| Utah | 9 | 94 | 1,255 | 1,358 | ||||
| Vermont | 3 | 4 | 807 | 814 | ||||
| Virginia | 195 | 38 | 888 | 1,121 | ||||
| Washington | 26 | 21 | 942 | 989 | ||||
| West Virginia | 8 | 7 | 1,001 | 1,016 | ||||
| Wisconsin | 34 | 22 | 1,324 | 1,380 | ||||
| Wyoming | 5 | 39 | 892 | 936 | ||||
| United States | 5,972 | 7,878 | 63,932 | 77,782 | ||||
| TABLE A-3. Unweighted Cell Counts by Race Tabulations of the March 1996 CPS for Selected Characteristics Unweighted Cell Counts by Race |
||||||||
|---|---|---|---|---|---|---|---|---|
| Work Disability | ||||||||
| Black | Hispanic | Other | Total | |||||
| Alabama | 78 | - | 121 | 199 | ||||
| Alaska | 2 | 4 | 56 | 62 | ||||
| Arizona | 4 | 26 | 111 | 141 | ||||
| Arkansas | 33 | - | 203 | 236 | ||||
| California | 74 | 216 | 516 | 806 | ||||
| Colorado | 4 | 17 | 100 | 121 | ||||
| Connecticut | 7 | 12 | 49 | 68 | ||||
| Delaware | 15 | 3 | 70 | 88 | ||||
| District of Columbia | 87 | 3 | 22 | 112 | ||||
| Florida | 69 | 121 | 369 | 559 | ||||
| Georgia | 59 | 1 | 134 | 194 | ||||
| Hawaii | 3 | 6 | 51 | 60 | ||||
| Idaho | - | 8 | 167 | 175 | ||||
| Illinois | 59 | 35 | 272 | 366 | ||||
| Indiana | 14 | 5 | 113 | 132 | ||||
| Iowa | 1 | 2 | 114 | 117 | ||||
| Kansas | 5 | 7 | 134 | 146 | ||||
| Kentucky | 12 | 1 | 212 | 225 | ||||
| Louisiana | 59 | 3 | 103 | 165 | ||||
| Maine | 1 | 1 | 109 | 111 | ||||
| Maryland | 36 | 2 | 61 | 99 | ||||
| Massachusetts | 15 | 23 | 187 | 225 | ||||
| Michigan | 74 | 12 | 292 | 378 | ||||
| Minnesota | 2 | 2 | 110 | 114 | ||||
| Mississippi | 60 | 1 | 103 | 164 | ||||
| Missouri | 18 | 2 | 87 | 107 | ||||
| Montana | - | 3 | 170 | 173 | ||||
| Nebraska | 6 | 8 | 107 | 121 | ||||
| Nevada | 11 | 8 | 97 | 116 | ||||
| New Hampshire | 2 | 3 | 110 | 115 | ||||
| New Jersey | 31 | 36 | 188 | 255 | ||||
| New Mexico | 2 | 120 | 102 | 224 | ||||
| New York | 100 | 130 | 445 | 675 | ||||
| North Carolina | 59 | 3 | 220 | 282 | ||||
| North Dakota | - | - | 86 | 86 | ||||
| Ohio | 73 | 10 | 307 | 390 | ||||
| Oklahoma | 11 | 6 | 139 | 156 | ||||
| Oregon | 2 | 8 | 134 | 144 | ||||
| Pennsylvania | 68 | 22 | 405 | 495 | ||||
| Rhode Island | 1 | 15 | 120 | 136 | ||||
| South Carolina | 35 | - | 77 | 112 | ||||
| South Dakota | 2 | 1 | 151 | 154 | ||||
| Tennessee | 33 | 4 | 135 | 172 | ||||
| Texas | 54 | 209 | 304 | 567 | ||||
| Utah | - | 7 | 111 | 118 | ||||
| Vermont | - | 2 | 88 | 90 | ||||
| Virginia | 36 | 2 | 130 | 168 | ||||
| Washington | 3 | 3 | 137 | 143 | ||||
| West Virginia | 5 | 1 | 224 | 230 | ||||
| Wisconsin | 6 | 3 | 116 | 125 | ||||
| Wyoming | 1 | 11 | 117 | 129 | ||||
| United States | 1,332 | 1,128 | 8,086 | 10,546 | ||||
| TABLE A-4. Weighted Percent by Age Tabulations of the March 1996 CPS for Selected Characteristics Percent with Characteristics by Age |
||||||||
|---|---|---|---|---|---|---|---|---|
| Family Income Less than 100% of the Poverty Level | ||||||||
| <18 | 18-64 | 65+ | Total | |||||
| Alabama | 29% | 18% | 15% | 21% | ||||
| Alaska | 10% | 7% | 3% | 8% | ||||
| Arizona | 29% | 15% | 9% | 18% | ||||
| Arkansas | 26% | 12% | 18% | 17% | ||||
| California | 29% | 16% | 10% | 19% | ||||
| Colorado | 13% | 8% | 5% | 10% | ||||
| Connecticut | 20% | 7% | 7% | 11% | ||||
| Delaware | 18% | 8% | 15% | 11% | ||||
| District of Columbia | 44% | 20% | 18% | 25% | ||||
| Florida | 30% | 15% | 12% | 18% | ||||
| Georgia | 19% | 11% | 17% | 14% | ||||
| Hawaii | 20% | 10% | 14% | 13% | ||||
| Idaho | 22% | 14% | 7% | 15% | ||||
| Illinois | 26% | 10% | 8% | 14% | ||||
| Indiana | 17% | 9% | 6% | 11% | ||||
| Iowa | 19% | 11% | 7% | 13% | ||||
| Kansas | 16% | 11% | 10% | 12% | ||||
| Kentucky | 25% | 14% | 11% | 16% | ||||
| Louisiana | 35% | 18% | 14% | 22% | ||||
| Maine | 16% | 10% | 13% | 12% | ||||
| Maryland | 19% | 9% | 10% | 12% | ||||
| Massachusetts | 18% | 10% | 8% | 11% | ||||
| Michigan | 20% | 10% | 9% | 13% | ||||
| Minnesota | 12% | 8% | 11% | 10% | ||||
| Mississippi | 41% | 21% | 14% | 26% | ||||
| Missouri | 18% | 11% | 4% | 12% | ||||
| Montana | 25% | 14% | 11% | 16% | ||||
| Nebraska | 15% | 9% | 11% | 11% | ||||
| Nevada | 18% | 12% | 6% | 13% | ||||
| New Hampshire | 6% | 5% | 11% | 6% | ||||
| New Jersey | 13% | 8% | 10% | 9% | ||||
| New Mexico | 40% | 22% | 15% | 27% | ||||
| New York | 28% | 14% | 12% | 18% | ||||
| North Carolina | 25% | 11% | 12% | 14% | ||||
| North Dakota | 16% | 11% | 11% | 13% | ||||
| Ohio | 22% | 9% | 8% | 13% | ||||
| Oklahoma | 26% | 15% | 15% | 18% | ||||
| Oregon | 21% | 10% | 5% | 13% | ||||
| Pennsylvania | 20% | 11% | 11% | 13% | ||||
| Rhode Island | 17% | 10% | 10% | 12% | ||||
| South Carolina | 34% | 15% | 22% | 21% | ||||
| South Dakota | 22% | 12% | 13% | 15% | ||||
| Tennessee | 28% | 13% | 15% | 18% | ||||
| Texas | 28% | 16% | 16% | 19% | ||||
| Utah | 12% | 9% | 6% | 10% | ||||
| Vermont | 18% | 8% | 11% | 11% | ||||
| Virginia | 18% | 9% | 11% | 12% | ||||
| Washington | 21% | 13% | 6% | 14% | ||||
| West Virginia | 31% | 16% | 10% | 18% | ||||
| Wisconsin | 18% | 8% | 8% | 11% | ||||
| Wyoming | 17% | 11% | 12% | 13% | ||||
| United States | 24% | 12% | 11% | 15% | ||||
| TABLE A-4. Weighted Percent by Age Tabulations of the March 1996 CPS for Selected Characteristics Percent with Characteristics by Age |
||||||||
|---|---|---|---|---|---|---|---|---|
| Persons Age 15+ Receiving AFDC | ||||||||
| <18 | 18-64 | 65+ | Total | |||||
| Alabama | 0% | 2% | 0% | 1% | ||||
| Alaska | 1% | 2% | 0% | 1% | ||||
| Arizona | 0% | 2% | 0% | 1% | ||||
| Arkansas | 0% | 1% | 0% | 1% | ||||
| California | 0% | 3% | 0% | 2% | ||||
| Colorado | 0% | 1% | 0% | 1% | ||||
| Connecticut | 0% | 3% | 0% | 2% | ||||
| Delaware | 0% | 1% | 0% | 1% | ||||
| District of Columbia | 0% | 6% | 1% | 4% | ||||
| Florida | 0% | 2% | 0% | 1% | ||||
| Georgia | 0% | 2% | 0% | 1% | ||||
| Hawaii | 0% | 2% | 0% | 1% | ||||
| Idaho | 0% | 2% | 0% | 1% | ||||
| Illinois | 0% | 3% | 0% | 2% | ||||
| Indiana | 0% | 2% | 0% | 1% | ||||
| Iowa | 0% | 2% | 1% | 1% | ||||
| Kansas | 0% | 2% | 0% | 1% | ||||
| Kentucky | 0% | 2% | 0% | 2% | ||||
| Louisiana | 0% | 2% | 0% | 1% | ||||
| Maine | 0% | 1% | 0% | 1% | ||||
| Maryland | 0% | 2% | 0% | 1% | ||||
| Massachusetts | 0% | 2% | 0% | 1% | ||||
| Michigan | 0% | 3% | 0% | 2% | ||||
| Minnesota | 0% | 2% | 0% | 1% | ||||
| Mississippi | 0% | 4% | 0% | 3% | ||||
| Missouri | 0% | 1% | 0% | 1% | ||||
| Montana | 0% | 3% | 0% | 2% | ||||
| Nebraska | 0% | 2% | 0% | 1% | ||||
| Nevada | 0% | 1% | 0% | 1% | ||||
| New Hampshire | 0% | 2% | 0% | 1% | ||||
| New Jersey | 0% | 1% | 0% | 1% | ||||
| New Mexico | 0% | 3% | 0% | 2% | ||||
| New York | 0% | 3% | 0% | 2% | ||||
| North Carolina | 0% | 2% | 0% | 1% | ||||
| North Dakota | 0% | 1% | 0% | 1% | ||||
| Ohio | 0% | 2% | 0% | 1% | ||||
| Oklahoma | 0% | 2% | 0% | 1% | ||||
| Oregon | 0% | 3% | 0% | 2% | ||||
| Pennsylvania | 0% | 1% | 0% | 1% | ||||
| Rhode Island | 0% | 2% | 0% | 1% | ||||
| South Carolina | 0% | 3% | 0% | 2% | ||||
| South Dakota | 0% | 2% | 0% | 1% | ||||
| Tennessee | 0% | 2% | 0% | 1% | ||||
| Texas | 0% | 2% | 0% | 1% | ||||
| Utah | 0% | 1% | 0% | 0% | ||||
| Vermont | 0% | 2% | 0% | 1% | ||||
| Virginia | 0% | 1% | 0% | 1% | ||||
| Washington | 0% | 3% | 0% | 2% | ||||
| West Virginia | 0% | 3% | 1% | 2% | ||||
| Wisconsin | 0% | 2% | 0% | 1% | ||||
| Wyoming | 0% | 2% | 0% | 2% | ||||
| United States | 0% | 2% | 0% | 1% | ||||
| TABLE A-4. Weighted Percent by Age Tabulations of the March 1996 CPS for Selected Characteristics Percent with Characteristics by Age |
||||||||
|---|---|---|---|---|---|---|---|---|
| All Persons Receiving AFDC | ||||||||
| <18 | 18-64 | 65+ | Total | |||||
| Alabama | 9% | 2% | 0% | 4% | ||||
| Alaska | 9% | 2% | 0% | 4% | ||||
| Arizona | 8% | 2% | 0% | 3% | ||||
| Arkansas | 6% | 1% | 0% | 2% | ||||
| California | 15% | 3% | 0% | 6% | ||||
| Colorado | 6% | 1% | 0% | 2% | ||||
| Connecticut | 14% | 3% | 0% | 6% | ||||
| Delaware | 7% | 1% | 0% | 3% | ||||
| District of Columbia | 30% | 6% | 1% | 11% | ||||
| Florida | 12% | 2% | 0% | 4% | ||||
| Georgia | 10% | 2% | 0% | 4% | ||||
| Hawaii | 8% | 2% | 0% | 3% | ||||
| Idaho | 7% | 2% | 0% | 3% | ||||
| Illinois | 16% | 3% | 0% | 6% | ||||
| Indiana | 7% | 2% | 0% | 3% | ||||
| Iowa | 7% | 2% | 1% | 3% | ||||
| Kansas | 8% | 2% | 0% | 3% | ||||
| Kentucky | 8% | 2% | 0% | 4% | ||||
| Louisiana | 12% | 2% | 0% | 4% | ||||
| Maine | 4% | 1% | 0% | 2% | ||||
| Maryland | 8% | 2% | 0% | 3% | ||||
| Massachusetts | 11% | 2% | 0% | 4% | ||||
| Michigan | 12% | 3% | 0% | 5% | ||||
| Minnesota | 7% | 2% | 0% | 3% | ||||
| Mississippi | 16% | 4% | 0% | 7% | ||||
| Missouri | 6% | 1% | 0% | 2% | ||||
| Montana | 11% | 3% | 0% | 5% | ||||
| Nebraska | 6% | 2% | 0% | 3% | ||||
| Nevada | 4% | 1% | 0% | 2% | ||||
| New Hampshire | 6% | 2% | 0% | 2% | ||||
| New Jersey | 6% | 1% | 0% | 2% | ||||
| New Mexico | 13% | 3% | 0% | 6% | ||||
| New York | 13% | 3% | 0% | 5% | ||||
| North Carolina | 8% | 2% | 0% | 3% | ||||
| North Dakota | 3% | 1% | 0% | 1% | ||||
| Ohio | 13% | 2% | 0% | 5% | ||||
| Oklahoma | 10% | 2% | 0% | 4% | ||||
| Oregon | 13% | 3% | 0% | 5% | ||||
| Pennsylvania | 7% | 1% | 0% | 3% | ||||
| Rhode Island | 7% | 2% | 0% | 3% | ||||
| South Carolina | 12% | 3% | 0% | 5% | ||||
| South Dakota | 7% | 2% | 0% | 3% | ||||
| Tennessee | 9% | 2% | 0% | 4% | ||||
| Texas | 8% | 2% | 0% | 4% | ||||
| Utah | 3% | 1% | 0% | 1% | ||||
| Vermont | 9% | 2% | 0% | 4% | ||||
| Virginia | 6% | 1% | 0% | 2% | ||||
| Washington | 12% | 3% | 0% | 5% | ||||
| West Virginia | 15% | 3% | 1% | 5% | ||||
| Wisconsin | 8% | 2% | 0% | 3% | ||||
| Wyoming | 7% | 2% | 0% | 2% | ||||
| United States | 11% | 2% | 0% | 4% | ||||
| TABLE A-4. Weighted Percent by Age Tabulations of the March 1996 CPS for Selected Characteristics Percent with Characteristics by Age |
||||||||
|---|---|---|---|---|---|---|---|---|
| Employer Provided Health Insurance | ||||||||
| <18 | 18-64 | 65+ | Total | |||||
| Alabama | 61% | 64% | 35% | 59% | ||||
| Alaska | 59% | 64% | 42% | 62% | ||||
| Arizona | 49% | 60% | 33% | 54% | ||||
| Arkansas | 54% | 63% | 24% | 55% | ||||
| California | 50% | 58% | 30% | 53% | ||||
| Colorado | 70% | 68% | 42% | 66% | ||||
| Connecticut | 70% | 77% | 45% | 70% | ||||
| Delaware | 64% | 73% | 44% | 67% | ||||
| District of Columbia | 35% | 62% | 48% | 54% | ||||
| Florida | 49% | 59% | 31% | 52% | ||||
| Georgia | 62% | 64% | 32% | 60% | ||||
| Hawaii | 59% | 68% | 36% | 62% | ||||
| Idaho | 62% | 64% | 39% | 60% | ||||
| Illinois | 63% | 74% | 37% | 66% | ||||
| Indiana | 68% | 74% | 39% | 68% | ||||
| Iowa | 61% | 70% | 18% | 61% | ||||
| Kansas | 61% | 65% | 22% | 59% | ||||
| Kentucky | 56% | 65% | 44% | 60% | ||||
| Louisiana | 41% | 54% | 32% | 48% | ||||
| Maine | 62% | 70% | 42% | 64% | ||||
| Maryland | 64% | 70% | 47% | 66% | ||||
| Massachusetts | 68% | 73% | 34% | 67% | ||||
| Michigan | 69% | 77% | 43% | 71% | ||||
| Minnesota | 67% | 73% | 23% | 66% | ||||
| Mississippi | 46% | 61% | 30% | 53% | ||||
| Missouri | 62% | 67% | 43% | 63% | ||||
| Montana | 54% | 58% | 27% | 52% | ||||
| Nebraska | 67% | 69% | 19% | 62% | ||||
| Nevada | 63% | 68% | 38% | 63% | ||||
| New Hampshire | 76% | 74% | 40% | 71% | ||||
| New Jersey | 70% | 71% | 38% | 66% | ||||
| New Mexico | 38% | 50% | 28% | 44% | ||||
| New York | 57% | 65% | 42% | 60% | ||||
| North Carolina | 55% | 67% | 32% | 60% | ||||
| North Dakota | 62% | 62% | 17% | 56% | ||||
| Ohio | 67% | 72% | 42% | 67% | ||||
| Oklahoma | 49% | 58% | 36% | 52% | ||||
| Oregon | 63% | 69% | 33% | 63% | ||||
| Pennsylvania | 68% | 72% | 37% | 66% | ||||
| Rhode Island | 66% | 70% | 27% | 62% | ||||
| South Carolina | 52% | 66% | 25% | 58% | ||||
| South Dakota | 65% | 64% | 23% | 59% | ||||
| Tennessee | 55% | 63% | 28% | 57% | ||||
| Texas | 51% | 59% | 27% | 54% | ||||
| Utah | 70% | 73% | 55% | 70% | ||||
| Vermont | 63% | 70% | 26% | 64% | ||||
| Virginia | 57% | 67% | 42% | 62% | ||||
| Washington | 60% | 67% | 40% | 62% | ||||
| West Virginia | 53% | 64% | 48% | 59% | ||||
| Wisconsin | 69% | 79% | 43% | 72% | ||||
| Wyoming | 58% | 61% | 26% | 57% | ||||
| United States | 59% | 66% | 35% | 60% | ||||
| TABLE A-4. Weighted Percent by Age Tabulations of the March 1996 CPS for Selected Characteristics Percent with Characteristics by Age |
||||||||
|---|---|---|---|---|---|---|---|---|
| Work Disability | ||||||||
| <18 | 18-64 | 65+ | Total | |||||
| Alabama | 0% | 10% | 38% | 11% | ||||
| Alaska | 0% | 6% | 16% | 4% | ||||
| Arizona | 0% | 6% | 28% | 7% | ||||
| Arkansas | 1% | 13% | 43% | 13% | ||||
| California | 0% | 7% | 23% | 7% | ||||
| Colorado | 1% | 7% | 24% | 7% | ||||
| Connecticut | 0% | 4% | 17% | 5% | ||||
| Delaware | 0% | 7% | 23% | 7% | ||||
| District of Columbia | 0% | 10% | 30% | 10% | ||||
| Florida | 0% | 9% | 22% | 9% | ||||
| Georgia | 0% | 10% | 34% | 10% | ||||
| Hawaii | 0% | 4% | 13% | 4% | ||||
| Idaho | 0% | 8% | 37% | 10% | ||||
| Illinois | 1% | 6% | 26% | 7% | ||||
| Indiana | 0% | 7% | 27% | 8% | ||||
| Iowa | 0% | 6% | 26% | 7% | ||||
| Kansas | 0% | 8% | 31% | 9% | ||||
| Kentucky | 0% | 13% | 45% | 14% | ||||
| Louisiana | 0% | 10% | 33% | 10% | ||||
| Maine | 0% | 9% | 24% | 9% | ||||
| Maryland | 0% | 7% | 21% | 7% | ||||
| Massachusetts | 0% | 8% | 21% | 8% | ||||
| Michigan | 0% | 8% | 31% | 9% | ||||
| Minnesota | 0% | 5% | 30% | 6% | ||||
| Mississippi | 0% | 10% | 35% | 10% | ||||
| Missouri | 0% | 6% | 26% | 7% | ||||
| Montana | 0% | 9% | 30% | 10% | ||||
| Nebraska | 0% | 6% | 25% | 7% | ||||
| Nevada | 1% | 7% | 27% | 8% | ||||
| New Hampshire | 0% | 7% | 40% | 9% | ||||
| New Jersey | 0% | 6% | 21% | 6% | ||||
| New Mexico | 0% | 10% | 38% | 9% | ||||
| New York | 0% | 7% | 24% | 8% | ||||
| North Carolina | 0% | 8% | 34% | 10% | ||||
| North Dakota | 1% | 4% | 22% | 6% | ||||
| Ohio | 0% | 9% | 26% | 9% | ||||
| Oklahoma | 0% | 8% | 26% | 8% | ||||
| Oregon | 0% | 9% | 29% | 9% | ||||
| Pennsylvania | 0% | 9% | 27% | 9% | ||||
| Rhode Island | 1% | 11% | 22% | 10% | ||||
| South Carolina | 0% | 9% | 25% | 8% | ||||
| South Dakota | 1% | 8% | 27% | 8% | ||||
| Tennessee | 0% | 10% | 41% | 10% | ||||
| Texas | 0% | 7% | 34% | 8% | ||||
| Utah | 1% | 6% | 28% | 6% | ||||
| Vermont | 0% | 6% | 31% | 7% | ||||
| Virginia | 1% | 10% | 26% | 9% | ||||
| Washington | 0% | 9% | 32% | 9% | ||||
| West Virginia | 0% | 12% | 35% | 14% | ||||
| Wisconsin | 0% | 7% | 23% | 6% | ||||
| Wyoming | 0% | 8% | 32% | 8% | ||||
| United States | 0% | 8% | 27% | 8% | ||||
| TABLE A-5. Unweighted Cell Counts by Age Tabulations of the March 1996 CPS for Selected Characteristics Unweighted Cell Counts by Age |
||||||||
|---|---|---|---|---|---|---|---|---|
| Total | ||||||||
| <18 | 18-64 | 65+ | Total | |||||
| Alabama | 485 | 976 | 259 | 1,720 | ||||
| Alaska | 541 | 917 | 59 | 1,517 | ||||
| Arizona | 648 | 1,244 | 244 | 2,136 | ||||
| Arkansas | 469 | 1,048 | 243 | 1,760 | ||||
| California | 4,046 | 7,646 | 1,212 | 12,904 | ||||
| Colorado | 506 | 1,142 | 136 | 1,784 | ||||
| Connecticut | 370 | 751 | 184 | 1,305 | ||||
| Delaware | 324 | 783 | 144 | 1,251 | ||||
| District of Columbia | 276 | 739 | 146 | 1,161 | ||||
| Florida | 1,662 | 3,799 | 1,079 | 6,540 | ||||
| Georgia | 583 | 1,273 | 232 | 2,088 | ||||
| Hawaii | 358 | 861 | 163 | 1,382 | ||||
| Idaho | 545 | 1,081 | 216 | 1,842 | ||||
| Illinois | 1,519 | 3,218 | 621 | 5,358 | ||||
| Indiana | 425 | 947 | 226 | 1,598 | ||||
| Iowa | 491 | 952 | 215 | 1,658 | ||||
| Kansas | 464 | 961 | 210 | 1,635 | ||||
| Kentucky | 430 | 953 | 210 | 1,593 | ||||
| Louisiana | 487 | 982 | 186 | 1,655 | ||||
| Maine | 328 | 795 | 165 | 1,288 | ||||
| Maryland | 399 | 909 | 178 | 1,486 | ||||
| Massachusetts | 734 | 1,792 | 355 | 2,881 | ||||
| Michigan | 1,241 | 2,566 | 524 | 4,331 | ||||
| Minnesota | 516 | 1,067 | 196 | 1,779 | ||||
| Mississippi | 489 | 937 | 191 | 1,617 | ||||
| Missouri | 377 | 908 | 199 | 1,484 | ||||
| Montana | 441 | 1,016 | 250 | 1,707 | ||||
| Nebraska | 481 | 970 | 226 | 1,677 | ||||
| Nevada | 402 | 899 | 178 | 1,479 | ||||
| New Hampshire | 312 | 765 | 152 | 1,229 | ||||
| New Jersey | 1,042 | 2,433 | 530 | 4,005 | ||||
| New Mexico | 776 | 1,355 | 236 | 2,367 | ||||
| New York | 2,426 | 5,272 | 1,118 | 8,816 | ||||
| North Carolina | 681 | 1,842 | 393 | 2,916 | ||||
| North Dakota | 443 | 906 | 210 | 1,559 | ||||
| Ohio | 1,275 | 2,792 | 607 | 4,674 | ||||
| Oklahoma | 485 | 1,089 | 257 | 1,831 | ||||
| Oregon | 429 | 989 | 191 | 1,609 | ||||
| Pennsylvania | 1,414 | 3,202 | 797 | 5,413 | ||||
| Rhode Island | 327 | 783 | 219 | 1,329 | ||||
| South Carolina | 401 | 815 | 156 | 1,372 | ||||
| South Dakota | 520 | 1,016 | 239 | 1,775 | ||||
| Tennessee | 441 | 979 | 182 | 1,602 | ||||
| Texas | 2,316 | 4,477 | 690 | 7,483 | ||||
| Utah | 690 | 1,053 | 174 | 1,917 | ||||
| Vermont | 371 | 768 | 135 | 1,274 | ||||
| Virginia | 423 | 1,166 | 221 | 1,810 | ||||
| Washington | 419 | 1,016 | 163 | 1,598 | ||||
| West Virginia | 402 | 1,039 | 283 | 1,724 | ||||
| Wisconsin | 556 | 1,160 | 194 | 1,910 | ||||
| Wyoming | 505 | 994 | 148 | 1,647 | ||||
| United States | 36,691 | 78,043 | 15,742 | 130,476 | ||||
| TABLE A-5. Unweighted Cell Counts by Age Tabulations of the March 1996 CPS for Selected Characteristics Unweighted Cell Counts by Age |
||||||||
|---|---|---|---|---|---|---|---|---|
| Family Income Less than 100% of the Poverty Level | ||||||||
| <18 | 18-64 | 65+ | Total | |||||
| Alabama | 133 | 168 | 42 | 343 | ||||
| Alaska | 49 | 60 | 3 | 112 | ||||
| Arizona | 198 | 195 | 24 | 417 | ||||
| Arkansas | 114 | 118 | 46 | 278 | ||||
| California | 1,331 | 1,397 | 140 | 2,868 | ||||
| Colorado | 74 | 94 | 7 | 175 | ||||
| Connecticut | 84 | 63 | 14 | 161 | ||||
| Delaware | 59 | 65 | 21 | 145 | ||||
| District of Columbia | 113 | 143 | 27 | 283 | ||||
| Florida | 493 | 573 | 133 | 1,199 | ||||
| Georgia | 109 | 132 | 41 | 282 | ||||
| Hawaii | 72 | 89 | 23 | 184 | ||||
| Idaho | 128 | 161 | 15 | 304 | ||||
| Illinois | 381 | 338 | 50 | 769 | ||||
| Indiana | 72 | 86 | 14 | 172 | ||||
| Iowa | 92 | 101 | 15 | 208 | ||||
| Kansas | 79 | 106 | 21 | 206 | ||||
| Kentucky | 107 | 125 | 23 | 255 | ||||
| Louisiana | 161 | 169 | 28 | 358 | ||||
| Maine | 54 | 79 | 22 | 155 | ||||
| Maryland | 74 | 77 | 19 | 170 | ||||
| Massachusetts | 146 | 184 | 30 | 360 | ||||
| Michigan | 249 | 262 | 46 | 557 | ||||
| Minnesota | 66 | 86 | 22 | 174 | ||||
| Mississippi | 198 | 193 | 28 | 419 | ||||
| Missouri | 68 | 94 | 8 | 170 | ||||
| Montana | 105 | 136 | 27 | 268 | ||||
| Nebraska | 74 | 95 | 27 | 196 | ||||
| Nevada | 73 | 111 | 11 | 195 | ||||
| New Hampshire | 20 | 40 | 19 | 79 | ||||
| New Jersey | 146 | 200 | 54 | 400 | ||||
| New Mexico | 310 | 302 | 38 | 650 | ||||
| New York | 740 | 843 | 147 | 1,730 | ||||
| North Carolina | 167 | 200 | 48 | 415 | ||||
| North Dakota | 71 | 101 | 23 | 195 | ||||
| Ohio | 281 | 262 | 47 | 590 | ||||
| Oklahoma | 122 | 158 | 41 | 321 | ||||
| Oregon | 95 | 105 | 11 | 211 | ||||
| Pennsylvania | 289 | 333 | 85 | 707 | ||||
| Rhode Island | 60 | 85 | 24 | 169 | ||||
| South Carolina | 132 | 119 | 35 | 286 | ||||
| South Dakota | 142 | 147 | 34 | 323 | ||||
| Tennessee | 110 | 127 | 28 | 265 | ||||
| Texas | 706 | 806 | 124 | 1,636 | ||||
| Utah | 79 | 96 | 9 | 184 | ||||
| Vermont | 64 | 58 | 15 | 137 | ||||
| Virginia | 80 | 112 | 24 | 216 | ||||
| Washington | 91 | 131 | 10 | 232 | ||||
| West Virginia | 120 | 163 | 29 | 312 | ||||
| Wisconsin | 99 | 89 | 16 | 204 | ||||
| Wyoming | 89 | 111 | 19 | 219 | ||||
| United States | 8,969 | 10,088 | 1,807 | 20,864 | ||||
| TABLE A-5. Unweighted Cell Counts by Age Tabulations of the March 1996 CPS for Selected Characteristics Unweighted Cell Counts by Age |
||||||||
|---|---|---|---|---|---|---|---|---|
| Persons Age 15+ Receiving AFDC | ||||||||
| <18 | 18-64 | 65+ | Total | |||||
| Alabama | - | 20 | - | 20 | ||||
| Alaska | 3 | 18 | - | 21 | ||||
| Arizona | - | 21 | - | 21 | ||||
| Arkansas | - | 13 | - | 13 | ||||
| California | 14 | 288 | 1 | 303 | ||||
| Colorado | - | 17 | - | 17 | ||||
| Connecticut | 1 | 29 | - | 30 | ||||
| Delaware | - | 9 | - | 9 | ||||
| District of Columbia | 1 | 40 | 1 | 42 | ||||
| Florida | 3 | 78 | - | 81 | ||||
| Georgia | - | 23 | - | 23 | ||||
| Hawaii | - | 16 | - | 16 | ||||
| Idaho | - | 23 | - | 23 | ||||
| Illinois | 1 | 88 | - | 89 | ||||
| Indiana | - | 17 | - | 17 | ||||
| Iowa | - | 17 | 1 | 18 | ||||
| Kansas | - | 20 | - | 20 | ||||
| Kentucky | 1 | 21 | - | 22 | ||||
| Louisiana | 1 | 18 | - | 19 | ||||
| Maine | 2 | 10 | - | 12 | ||||
| Maryland | - | 14 | 1 | 15 | ||||
| Massachusetts | - | 45 | 1 | 46 | ||||
| Michigan | 3 | 72 | - | 75 | ||||
| Minnesota | - | 20 | - | 20 | ||||
| Mississippi | - | 41 | - | 41 | ||||
| Missouri | - | 10 | - | 10 | ||||
| Montana | 1 | 26 | - | 27 | ||||
| Nebraska | - | 18 | - | 18 | ||||
| Nevada | - | 8 | - | 8 | ||||
| New Hampshire | - | 12 | - | 12 | ||||
| New Jersey | - | 41 | - | 41 | ||||
| New Mexico | - | 46 | - | 46 | ||||
| New York | 9 | 185 | - | 194 | ||||
| North Carolina | - | 30 | - | 30 | ||||
| North Dakota | - | 8 | 1 | 9 | ||||
| Ohio | 2 | 68 | 1 | 71 | ||||
| Oklahoma | - | 21 | - | 21 | ||||
| Oregon | 1 | 26 | 1 | 28 | ||||
| Pennsylvania | 2 | 47 | - | 49 | ||||
| Rhode Island | - | 15 | - | 15 | ||||
| South Carolina | 1 | 21 | - | 22 | ||||
| South Dakota | - | 20 | 1 | 21 | ||||
| Tennessee | 1 | 18 | - | 19 | ||||
| Texas | 7 | 87 | - | 94 | ||||
| Utah | 1 | 6 | - | 7 | ||||
| Vermont | - | 16 | - | 16 | ||||
| Virginia | - | 12 | 1 | 13 | ||||
| Washington | - | 33 | - | 33 | ||||
| West Virginia | - | 28 | 1 | 29 | ||||
| Wisconsin | - | 21 | - | 21 | ||||
| Wyoming | 2 | 20 | - | 22 | ||||
| United States | 57 | 1,821 | 11 | 1,889 | ||||
| TABLE A-5. Unweighted Cell Counts by Age Tabulations of the March 1996 CPS for Selected Characteristics Unweighted Cell Counts by Age |
||||||||
|---|---|---|---|---|---|---|---|---|
| All Persons Receiving AFDC | ||||||||
| <18 | 18-64 | 65+ | Total | |||||
| Alabama | 38 | 20 | - | 58 | ||||
| Alaska | 46 | 18 | - | 64 | ||||
| Arizona | 51 | 21 | - | 72 | ||||
| Arkansas | 25 | 13 | - | 38 | ||||
| California | 636 | 288 | 1 | 925 | ||||
| Colorado | 34 | 17 | - | 51 | ||||
| Connecticut | 61 | 29 | - | 90 | ||||
| Delaware | 24 | 9 | - | 33 | ||||
| District of Columbia | 78 | 40 | 1 | 119 | ||||
| Florida | 173 | 78 | - | 251 | ||||
| Georgia | 52 | 23 | - | 75 | ||||
| Hawaii | 27 | 16 | - | 43 | ||||
| Idaho | 42 | 23 | - | 65 | ||||
| Illinois | 213 | 88 | - | 301 | ||||
| Indiana | 30 | 17 | - | 47 | ||||
| Iowa | 33 | 17 | 1 | 51 | ||||
| Kansas | 36 | 20 | - | 56 | ||||
| Kentucky | 38 | 21 | - | 59 | ||||
| Louisiana | 49 | 18 | - | 67 | ||||
| Maine | 12 | 10 | - | 22 | ||||
| Maryland | 29 | 14 | 1 | 44 | ||||
| Massachusetts | 88 | 45 | 1 | 134 | ||||
| Michigan | 157 | 72 | - | 229 | ||||
| Minnesota | 36 | 20 | - | 56 | ||||
| Mississippi | 77 | 41 | - | 118 | ||||
| Missouri | 20 | 10 | - | 30 | ||||
| Montana | 46 | 26 | - | 72 | ||||
| Nebraska | 33 | 18 | - | 51 | ||||
| Nevada | 14 | 8 | - | 22 | ||||
| New Hampshire | 19 | 12 | - | 31 | ||||
| New Jersey | 78 | 41 | - | 119 | ||||
| New Mexico | 102 | 46 | - | 148 | ||||
| New York | 372 | 185 | - | 557 | ||||
| North Carolina | 53 | 30 | - | 83 | ||||
| North Dakota | 13 | 8 | 1 | 22 | ||||
| Ohio | 162 | 68 | 1 | 231 | ||||
| Oklahoma | 46 | 21 | - | 67 | ||||
| Oregon | 57 | 26 | 1 | 84 | ||||
| Pennsylvania | 102 | 47 | - | 149 | ||||
| Rhode Island | 26 | 15 | - | 41 | ||||
| South Carolina | 44 | 21 | - | 65 | ||||
| South Dakota | 47 | 20 | 1 | 68 | ||||
| Tennessee | 36 | 18 | - | 54 | ||||
| Texas | 199 | 87 | - | 286 | ||||
| Utah | 18 | 6 | - | 24 | ||||
| Vermont | 34 | 16 | - | 50 | ||||
| Virginia | 24 | 12 | 1 | 37 | ||||
| Washington | 52 | 33 | - | 85 | ||||
| West Virginia | 60 | 28 | 1 | 89 | ||||
| Wisconsin | 41 | 21 | - | 62 | ||||
| Wyoming | 32 | 20 | - | 52 | ||||
| United States | 3,815 | 1,821 | 11 | 5,647 | ||||
| TABLE A-5. Unweighted Cell Counts by Age Tabulations of the March 1996 CPS for Selected Characteristics Unweighted Cell Counts by Age |
||||||||
|---|---|---|---|---|---|---|---|---|
| Employer Provided Health Insurance | ||||||||
| <18 | 18-64 | 65+ | Total | |||||
| Alabama | 299 | 636 | 88 | 1,023 | ||||
| Alaska | 320 | 603 | 23 | 946 | ||||
| Arizona | 312 | 744 | 79 | 1,135 | ||||
| Arkansas | 259 | 668 | 55 | 982 | ||||
| California | 1,855 | 4,199 | 339 | 6,393 | ||||
| Colorado | 342 | 779 | 57 | 1,178 | ||||
| Connecticut | 246 | 570 | 82 | 898 | ||||
| Delaware | 205 | 577 | 64 | 846 | ||||
| District of Columbia | 100 | 472 | 72 | 644 | ||||
| Florida | 821 | 2,230 | 323 | 3,374 | ||||
| Georgia | 368 | 832 | 75 | 1,275 | ||||
| Hawaii | 210 | 590 | 59 | 859 | ||||
| Idaho | 331 | 681 | 81 | 1,093 | ||||
| Illinois | 981 | 2,401 | 233 | 3,615 | ||||
| Indiana | 290 | 707 | 86 | 1,083 | ||||
| Iowa | 304 | 672 | 38 | 1,014 | ||||
| Kansas | 284 | 637 | 45 | 966 | ||||
| Kentucky | 241 | 631 | 91 | 963 | ||||
| Louisiana | 204 | 550 | 61 | 815 | ||||
| Maine | 202 | 552 | 67 | 821 | ||||
| Maryland | 254 | 642 | 83 | 979 | ||||
| Massachusetts | 484 | 1,296 | 119 | 1,899 | ||||
| Michigan | 866 | 1,990 | 253 | 3,109 | ||||
| Minnesota | 343 | 784 | 42 | 1,169 | ||||
| Mississippi | 225 | 573 | 53 | 851 | ||||
| Missouri | 232 | 617 | 83 | 932 | ||||
| Montana | 243 | 588 | 68 | 899 | ||||
| Nebraska | 314 | 665 | 41 | 1,020 | ||||
| Nevada | 250 | 615 | 68 | 933 | ||||
| New Hampshire | 236 | 573 | 62 | 871 | ||||
| New Jersey | 713 | 1,716 | 199 | 2,628 | ||||
| New Mexico | 301 | 685 | 68 | 1,054 | ||||
| New York | 1,323 | 3,360 | 464 | 5,147 | ||||
| North Carolina | 373 | 1,263 | 127 | 1,763 | ||||
| North Dakota | 277 | 565 | 35 | 877 | ||||
| Ohio | 858 | 2,024 | 267 | 3,149 | ||||
| Oklahoma | 239 | 637 | 92 | 968 | ||||
| Oregon | 268 | 681 | 64 | 1,013 | ||||
| Pennsylvania | 971 | 2,349 | 296 | 3,616 | ||||
| Rhode Island | 208 | 537 | 58 | 803 | ||||
| South Carolina | 212 | 544 | 39 | 795 | ||||
| South Dakota | 308 | 628 | 57 | 993 | ||||
| Tennessee | 251 | 625 | 53 | 929 | ||||
| Texas | 1,122 | 2,552 | 174 | 3,848 | ||||
| Utah | 493 | 768 | 97 | 1,358 | ||||
| Vermont | 235 | 544 | 35 | 814 | ||||
| Virginia | 239 | 788 | 94 | 1,121 | ||||
| Washington | 250 | 676 | 63 | 989 | ||||
| West Virginia | 212 | 667 | 137 | 1,016 | ||||
| Wisconsin | 386 | 913 | 81 | 1,380 | ||||
| Wyoming | 285 | 613 | 38 | 936 | ||||
| United States | 21,145 | 51,209 | 5,428 | 77,782 | ||||
| TABLE A-5. Unweighted Cell Counts by Age Tabulations of the March 1996 CPS for Selected Characteristics Unweighted Cell Counts by Age |
||||||||
|---|---|---|---|---|---|---|---|---|
| Work Disability | ||||||||
| <18 | 18-64 | 65+ | Total | |||||
| Alabama | 2 | 98 | 99 | 199 | ||||
| Alaska | - | 54 | 8 | 62 | ||||
| Arizona | 2 | 71 | 68 | 141 | ||||
| Arkansas | 3 | 128 | 105 | 236 | ||||
| California | 9 | 503 | 294 | 806 | ||||
| Colorado | 5 | 83 | 33 | 121 | ||||
| Connecticut | 1 | 36 | 31 | 68 | ||||
| Delaware | 1 | 55 | 32 | 88 | ||||
| District of Columbia | - | 67 | 45 | 112 | ||||
| Florida | 4 | 313 | 242 | 559 | ||||
| Georgia | 2 | 114 | 78 | 194 | ||||
| Hawaii | 1 | 37 | 22 | 60 | ||||
| Idaho | 1 | 91 | 83 | 175 | ||||
| Illinois | 8 | 194 | 164 | 366 | ||||
| Indiana | 1 | 69 | 62 | 132 | ||||
| Iowa | 1 | 60 | 56 | 117 | ||||
| Kansas | 1 | 78 | 67 | 146 | ||||
| Kentucky | 2 | 127 | 96 | 225 | ||||
| Louisiana | 2 | 102 | 61 | 165 | ||||
| Maine | - | 71 | 40 | 111 | ||||
| Maryland | 1 | 62 | 36 | 99 | ||||
| Massachusetts | 1 | 148 | 76 | 225 | ||||
| Michigan | 6 | 202 | 170 | 378 | ||||
| Minnesota | - | 54 | 60 | 114 | ||||
| Mississippi | 2 | 94 | 68 | 164 | ||||
| Missouri | 1 | 54 | 52 | 107 | ||||
| Montana | 1 | 96 | 76 | 173 | ||||
| Nebraska | 1 | 60 | 60 | 121 | ||||
| Nevada | 3 | 63 | 50 | 116 | ||||
| New Hampshire | 1 | 55 | 59 | 115 | ||||
| New Jersey | 3 | 136 | 116 | 255 | ||||
| New Mexico | - | 131 | 93 | 224 | ||||
| New York | 11 | 397 | 267 | 675 | ||||
| North Carolina | 1 | 148 | 133 | 282 | ||||
| North Dakota | 2 | 40 | 44 | 86 | ||||
| Ohio | 5 | 230 | 155 | 390 | ||||
| Oklahoma | 1 | 87 | 68 | 156 | ||||
| Oregon | - | 89 | 55 | 144 | ||||
| Pennsylvania | 6 | 268 | 221 | 495 | ||||
| Rhode Island | 2 | 85 | 49 | 136 | ||||
| South Carolina | 2 | 71 | 39 | 112 | ||||
| South Dakota | 2 | 85 | 67 | 154 | ||||
| Tennessee | - | 97 | 75 | 172 | ||||
| Texas | 7 | 330 | 230 | 567 | ||||
| Utah | 4 | 64 | 50 | 118 | ||||
| Vermont | 1 | 48 | 41 | 90 | ||||
| Virginia | 2 | 110 | 56 | 168 | ||||
| Washington | 2 | 89 | 52 | 143 | ||||
| West Virginia | 1 | 130 | 99 | 230 | ||||
| Wisconsin | 2 | 78 | 45 | 125 | ||||
| Wyoming | 1 | 78 | 50 | 129 | ||||
| United States | 118 | 6,030 | 4,398 | 10,546 | ||||
APPENDIX B: SIPP Tables
| TABLE B-1. States Meeting Precision Criteria States Meeting Precision Criteria for Selected Characteristics 1993 SIPP |
||||||||
|---|---|---|---|---|---|---|---|---|
| Total Population | ||||||||
| Poverty | AFDC | Employer Ins. | Work Disab. | # Criteria Met (Max=4) |
||||
| Criteria for Cell Count | 70 | 242 | 102 | 141 | ||||
| Alabama | X | X | X | X | 4 | |||
| Arizona | X | X | X | X | 4 | |||
| Arkansas | X | X | X | X | 4 | |||
| California | X | X | X | X | 4 | |||
| Colorado | X | X | X | X | 4 | |||
| Connecticut | X | X | X | X | 4 | |||
| Delaware | X | X | X | 4 | ||||
| District of Columbia | X | X | 3 | |||||
| Florida | X | X | X | X | 2 | |||
| Georgia | X | X | X | X | 4 | |||
| Hawaii | X | X | X | 3 | ||||
| Illinois | X | X | X | X | 4 | |||
| Indiana | X | X | X | X | 4 | |||
| Kansas | X | X | X | X | 4 | |||
| Kentucky | X | X | X | X | 4 | |||
| Louisiana | X | X | X | X | 4 | |||
| Maryland | X | X | X | X | 4 | |||
| Massachusetts | X | X | X | X | 4 | |||
| Michigan | X | X | X | X | 4 | |||
| Minnesota | X | X | X | X | 4 | |||
| Mississippi | X | X | X | X | 4 | |||
| Missouri | X | X | X | X | 4 | |||
| Nebraska | X | X | X | X | 4 | |||
| Nevada | X | X | X | 3 | ||||
| New Hampshire | X | X | X | 3 | ||||
| New Jersey | X | X | X | X | 4 | |||
| New Mexico | X | X | 2 | |||||
| New York | X | X | X | X | 4 | |||
| North Carolina | X | X | X | X | 4 | |||
| Ohio | X | X | X | X | 4 | |||
| Oklahoma | X | X | X | X | 4 | |||
| Oregon | X | X | X | X | 4 | |||
| Pennsylvania | X | X | X | X | 4 | |||
| Rhode Island | X | X | X | 3 | ||||
| South Carolina | X | X | X | X | 4 | |||
| Tennessee | X | X | X | X | 4 | |||
| Texas | X | X | X | X | 4 | |||
| Utah | X | X | X | X | 4 | |||
| Virginia | X | X | X | X | 4 | |||
| Washington | X | X | X | X | 4 | |||
| West Virginia | X | X | X | X | 4 | |||
| Wisconsin | X | X | X | X | 4 | |||
| ME, VT | ||||||||
| IA, ND, SD | ||||||||
| AK, ID, MT, WY | ||||||||
| United States | 42 | 35 | 42 | 40 | ||||
| TABLE B-1. States Meeting Precision Criteria States Meeting Precision Criteria for Selected Characteristics 1993 SIPP |
||||||||
|---|---|---|---|---|---|---|---|---|
| Under Age 18 | ||||||||
| Poverty | AFDC | Employer Ins. | # Criteria Met (Max=3) |
|||||
| Criteria for Cell Count | 95 | 95 | 104 | |||||
| Alabama | X | X | X | 3 | ||||
| Arizona | X | X | X | 3 | ||||
| Arkansas | X | X | X | 3 | ||||
| California | X | X | X | 3 | ||||
| Colorado | X | X | X | 3 | ||||
| Connecticut | X | X | X | 3 | ||||
| Delaware | - | |||||||
| District of Columbia | - | |||||||
| Florida | X | X | X | 3 | ||||
| Georgia | X | X | X | 3 | ||||
| Hawaii | - | |||||||
| Illinois | X | X | X | 3 | ||||
| Indiana | X | X | X | 3 | ||||
| Kansas | X | X | X | 3 | ||||
| Kentucky | X | X | X | 3 | ||||
| Louisiana | X | X | X | 3 | ||||
| Maryland | X | X | X | 3 | ||||
| Massachusetts | X | X | X | 3 | ||||
| Michigan | X | X | X | 3 | ||||
| Minnesota | X | X | X | 3 | ||||
| Mississippi | X | X | X | 3 | ||||
| Missouri | X | X | X | 3 | ||||
| Nebraska | X | X | 2 | |||||
| Nevada | - | |||||||
| New Hampshire | - | |||||||
| New Jersey | X | X | X | 3 | ||||
| New Mexico | - | |||||||
| New York | X | X | X | 3 | ||||
| North Carolina | X | X | X | 3 | ||||
| Ohio | X | X | X | 3 | ||||
| Oklahoma | X | X | X | 3 | ||||
| Oregon | X | X | X | 3 | ||||
| Pennsylvania | X | X | X | 3 | ||||
| Rhode Island | - | |||||||
| South Carolina | X | X | X | 3 | ||||
| Tennessee | X | X | X | 3 | ||||
| Texas | X | X | X | 3 | ||||
| Utah | X | X | X | 3 | ||||
| Virginia | X | X | X | 3 | ||||
| Washington | X | X | X | 3 | ||||
| West Virginia | X | X | X | 3 | ||||
| Wisconsin | X | X | X | 3 | ||||
| ME, VT | ||||||||
| IA, ND, SD | ||||||||
| AK, ID, MT, WY | ||||||||
| United States | 35 | 35 | 34 | |||||
| TABLE B-1. States Meeting Precision Criteria States Meeting Precision Criteria for Selected Characteristics 1993 SIPP |
||||||||
|---|---|---|---|---|---|---|---|---|
| Age 65 and Over | ||||||||
| Poverty | Employer Ins. | Work Disab. | # Criteria Met (Max=3) |
|||||
| Criteria for Cell Count | 56 | 100 | 30 | |||||
| Alabama | X | X | 2 | |||||
| Arizona | X | X | X | 3 | ||||
| Arkansas | - | |||||||
| California | X | X | X | 3 | ||||
| Colorado | - | |||||||
| Connecticut | X | X | 2 | |||||
| Delaware | - | |||||||
| District of Columbia | - | |||||||
| Florida | X | X | X | 3 | ||||
| Georgia | X | X | X | 3 | ||||
| Hawaii | - | |||||||
| Illinois | X | X | X | 3 | ||||
| Indiana | X | X | X | 3 | ||||
| Kansas | X | X | 2 | |||||
| Kentucky | X | 1 | ||||||
| Louisiana | X | 1 | ||||||
| Maryland | X | X | X | 3 | ||||
| Massachusetts | X | X | X | 3 | ||||
| Michigan | X | X | X | 3 | ||||
| Minnesota | X | X | X | 3 | ||||
| Mississippi | X | 1 | ||||||
| Missouri | X | X | X | 3 | ||||
| Nebraska | X | 1 | ||||||
| Nevada | - | |||||||
| New Hampshire | - | |||||||
| New Jersey | X | X | X | 3 | ||||
| New Mexico | - | |||||||
| New York | X | X | X | 3 | ||||
| North Carolina | X | X | X | 3 | ||||
| Ohio | X | X | X | 3 | ||||
| Oklahoma | X | X | 2 | |||||
| Oregon | X | X | X | 3 | ||||
| Pennsylvania | X | X | X | 3 | ||||
| Rhode Island | - | |||||||
| South Carolina | X | X | 2 | |||||
| Tennessee | X | X | X | 3 | ||||
| Texas | X | X | X | 3 | ||||
| Utah | - | |||||||
| Virginia | X | X | X | 3 | ||||
| Washington | X | X | X | 3 | ||||
| West Virginia | X | 1 | ||||||
| Wisconsin | X | X | 2 | |||||
| ME, VT | ||||||||
| IA, ND, SD | ||||||||
| AK, ID, MT, WY | ||||||||
| United States | 32 | 24 | 24 | |||||
| TABLE B-1. States Meeting Precision Criteria States Meeting Precision Criteria for Selected Characteristics 1993 SIPP |
||||||||
|---|---|---|---|---|---|---|---|---|
| Black | ||||||||
| Poverty | AFDC | Employer Ins. | Work Disab. | # Criteria Met (Max=4) |
||||
| Criteria for Cell Count | 113 | 73 | 105 | 115 | ||||
| Alabama | X | X | X | X | 4 | |||
| Arizona | - | |||||||
| Arkansas | - | |||||||
| California | X | X | X | X | 4 | |||
| Colorado | - | |||||||
| Connecticut | - | |||||||
| Delaware | - | |||||||
| District of Columbia | - | |||||||
| Florida | X | X | X | X | 4 | |||
| Georgia | X | X | X | X | 4 | |||
| Hawaii | - | |||||||
| Illinois | X | X | X | X | 4 | |||
| Indiana | X | X | X | X | 4 | |||
| Kansas | - | |||||||
| Kentucky | - | |||||||
| Louisiana | X | X | X | X | 4 | |||
| Maryland | X | X | X | X | 4 | |||
| Massachusetts | - | |||||||
| Michigan | X | X | X | X | 4 | |||
| Minnesota | - | |||||||
| Mississippi | X | X | X | X | 4 | |||
| Missouri | X | X | X | X | 4 | |||
| Nebraska | - | |||||||
| Nevada | - | |||||||
| New Hampshire | - | |||||||
| New Jersey | X | X | X | X | 4 | |||
| New Mexico | - | |||||||
| New York | X | X | X | X | 4 | |||
| North Carolina | X | X | X | X | 4 | |||
| Ohio | X | X | X | X | 4 | |||
| Oklahoma | - | |||||||
| Oregon | - | |||||||
| Pennsylvania | X | X | X | X | 4 | |||
| Rhode Island | - | |||||||
| South Carolina | X | X | X | X | 4 | |||
| Tennessee | X | X | X | X | 4 | |||
| Texas | X | X | X | X | 4 | |||
| Utah | - | |||||||
| Virginia | X | X | X | X | 4 | |||
| Washington | - | |||||||
| West Virginia | - | |||||||
| Wisconsin | - | |||||||
| ME, VT | ||||||||
| IA, ND, SD | ||||||||
| AK, ID, MT, WY | ||||||||
| United States | 20 | 20 | 20 | 20 | ||||
| TABLE B-1. States Meeting Precision Criteria States Meeting Precision Criteria for Selected Characteristics 1993 SIPP |
||||||||
|---|---|---|---|---|---|---|---|---|
| Hispanic | ||||||||
| Poverty | AFDC | Employer Ins. | Work Disab. | # Criteria Met (Max=4) |
||||
| Criteria for Cell Count | 113 | 93 | 100 | 174 | ||||
| Alabama | - | |||||||
| Arizona | X | X | X | 3 | ||||
| Arkansas | - | |||||||
| California | X | X | X | X | 4 | |||
| Colorado | - | |||||||
| Connecticut | - | |||||||
| Delaware | - | |||||||
| District of Columbia | - | |||||||
| Florida | X | X | X | X | 4 | |||
| Georgia | - | |||||||
| Hawaii | - | |||||||
| Illinois | X | X | X | X | 4 | |||
| Indiana | - | |||||||
| Kansas | - | |||||||
| Kentucky | - | |||||||
| Louisiana | - | |||||||
| Maryland | - | |||||||
| Massachusetts | - | |||||||
| Michigan | - | |||||||
| Minnesota | - | |||||||
| Mississippi | - | |||||||
| Missouri | - | |||||||
| Nebraska | - | |||||||
| Nevada | - | |||||||
| New Hampshire | - | |||||||
| New Jersey | X | X | X | X | 4 | |||
| New Mexico | - | |||||||
| New York | X | X | X | X | 4 | |||
| North Carolina | - | |||||||
| Ohio | - | |||||||
| Oklahoma | - | |||||||
| Oregon | - | |||||||
| Pennsylvania | - | |||||||
| Rhode Island | - | |||||||
| South Carolina | - | |||||||
| Tennessee | - | |||||||
| Texas | X | X | X | X | 4 | |||
| Utah | - | |||||||
| Virginia | - | |||||||
| Washington | - | |||||||
| West Virginia | - | |||||||
| Wisconsin | - | |||||||
| ME, VT | ||||||||
| IA, ND, SD | ||||||||
| AK, ID, MT, WY | ||||||||
| United States | 7 | 7 | 7 | 6 | ||||
| TABLE B-2. Weighted Percent by Race Tabulations of the 1993 SIPP for Selected Characteristics Percentage with Characteristics by Race |
||||||||
|---|---|---|---|---|---|---|---|---|
| Family Income Less than 100% of the Poverty Level | ||||||||
| Black | Hispanic | Other | Total | |||||
| Alabama | 36% | 22% | 15% | 19% | ||||
| Arizona | 58% | 42% | 16% | 22% | ||||
| Arkansas | 56% | 0% | 24% | 28% | ||||
| California | 36% | 33% | 14% | 21% | ||||
| Colorado | 17% | 22% | 12% | 14% | ||||
| Connecticut | 24% | 37% | 10% | 13% | ||||
| Delaware | 31% | 0% | 11% | 15% | ||||
| District of Columbia | 28% | 50% | 0% | 25% | ||||
| Florida | 31% | 26% | 14% | 18% | ||||
| Georgia | 34% | 27% | 14% | 19% | ||||
| Hawaii | 100% | 0% | 3% | 5% | ||||
| Illinois | 32% | 21% | 8% | 13% | ||||
| Indiana | 35% | 35% | 12% | 15% | ||||
| Kansas | 42% | 7% | 12% | 14% | ||||
| Kentucky | 50% | 10% | 16% | 17% | ||||
| Louisiana | 41% | 30% | 20% | 26% | ||||
| Maryland | 13% | 10% | 6% | 8% | ||||
| Massachusetts | 27% | 74% | 12% | 17% | ||||
| Michigan | 33% | 42% | 10% | 15% | ||||
| Minnesota | 24% | 81% | 11% | 12% | ||||
| Mississippi | 44% | 0% | 17% | 26% | ||||
| Missouri | 30% | 11% | 12% | 15% | ||||
| Nebraska | 0% | 0% | 8% | 8% | ||||
| Nevada | 47% | 30% | 8% | 17% | ||||
| New Hampshire | - | - | 9% | 9% | ||||
| New Jersey | 38% | 41% | 6% | 14% | ||||
| New Mexico | 47% | 9% | 20% | 19% | ||||
| New York | 34% | 43% | 13% | 19% | ||||
| North Carolina | 27% | 44% | 10% | 14% | ||||
| Ohio | 33% | 45% | 11% | 14% | ||||
| Oklahoma | 46% | 52% | 18% | 21% | ||||
| Oregon | 74% | 44% | 14% | 16% | ||||
| Pennsylvania | 26% | 40% | 12% | 14% | ||||
| Rhode Island | 9% | 0% | 8% | 8% | ||||
| South Carolina | 45% | 27% | 9% | 21% | ||||
| Tennessee | 44% | 56% | 14% | 19% | ||||
| Texas | 40% | 39% | 13% | 23% | ||||
| Utah | 0% | 16% | 12% | 13% | ||||
| Virginia | 29% | 19% | 9% | 14% | ||||
| Washington | 54% | 39% | 15% | 17% | ||||
| West Virginia | 0% | 68% | 22% | 22% | ||||
| Wisconsin | 53% | 0% | 6% | 9% | ||||
| ME, VT | - | - | 13% | 13% | ||||
| IA, ND, SD | 81% | 31% | 10% | 11% | ||||
| AK, ID, MT, WY | 10% | 0% | 12% | 11% | ||||
| United States | 34% | 35% | 12% | 17% | ||||
| TABLE B-2. Weighted Percent by Race Tabulations of the 1993 SIPP for Selected Characteristics Percentage with Characteristics by Race |
||||||||
|---|---|---|---|---|---|---|---|---|
| Persons Age 15+ Receiving AFDC, January | ||||||||
| Black | Hispanic | Other | Total | |||||
| Alabama | 3% | 0% | 0% | 1% | ||||
| Arizona | 0% | 4% | 1% | 1% | ||||
| Arkansas | 5% | 0% | 1% | 1% | ||||
| California | 6% | 3% | 2% | 3% | ||||
| Colorado | 1% | 4% | 1% | 1% | ||||
| Connecticut | 4% | 13% | 1% | 2% | ||||
| Delaware | 5% | 0% | 2% | 2% | ||||
| District of Columbia | 10% | 0% | 0% | 7% | ||||
| Florida | 3% | 2% | 1% | 1% | ||||
| Georgia | 5% | 3% | 1% | 2% | ||||
| Hawaii | 0% | 0% | 1% | 1% | ||||
| Illinois | 6% | 3% | 0% | 2% | ||||
| Indiana | 4% | 4% | 1% | 1% | ||||
| Kansas | 0% | 0% | 1% | 0% | ||||
| Kentucky | 11% | 5% | 1% | 2% | ||||
| Louisiana | 4% | 3% | 1% | 2% | ||||
| Maryland | 3% | 0% | 0% | 1% | ||||
| Massachusetts | 3% | 15% | 1% | 2% | ||||
| Michigan | 9% | 3% | 1% | 3% | ||||
| Minnesota | 14% | 10% | 1% | 1% | ||||
| Mississippi | 4% | 0% | 1% | 2% | ||||
| Missouri | 4% | 0% | 1% | 1% | ||||
| Nebraska | 0% | 0% | 0% | 0% | ||||
| Nevada | 0% | 0% | 2% | 1% | ||||
| New Hampshire | - | - | 0% | 0% | ||||
| New Jersey | 5% | 5% | 0% | 1% | ||||
| New Mexico | 0% | 3% | 0% | 1% | ||||
| New York | 5% | 7% | 1% | 2% | ||||
| North Carolina | 4% | 2% | 1% | 1% | ||||
| Ohio | 6% | 11% | 1% | 2% | ||||
| Oklahoma | 0% | 2% | 1% | 1% | ||||
| Oregon | 17% | 6% | 1% | 2% | ||||
| Pennsylvania | 6% | 7% | 1% | 1% | ||||
| Rhode Island | 0% | 0% | 1% | 1% | ||||
| South Carolina | 5% | 2% | 0% | 2% | ||||
| Tennessee | 8% | 0% | 1% | 2% | ||||
| Texas | 3% | 2% | 0% | 1% | ||||
| Utah | 0% | 0% | 1% | 1% | ||||
| Virginia | 2% | 2% | 0% | 1% | ||||
| Washington | 0% | 0% | 1% | 1% | ||||
| West Virginia | 0% | 0% | 2% | 2% | ||||
| Wisconsin | 13% | 0% | 1% | 1% | ||||
| ME, VT | - | - | 3% | 3% | ||||
| IA, ND, SD | 11% | 0% | 1% | 1% | ||||
| AK, ID, MT, WY | 0% | 5% | 1% | 1% | ||||
| United States | 5% | 4% | 1% | 2% | ||||
| TABLE B-2. Weighted Percent by Race Tabulations of the 1993 SIPP for Selected Characteristics Percentage with Characteristics by Race |
||||||||
|---|---|---|---|---|---|---|---|---|
| All Persons Receiving AFDC, January | ||||||||
| Black | Hispanic | Other | Total | |||||
| Alabama | 6% | 0% | 0% | 1% | ||||
| Arizona | 0% | 13% | 2% | 4% | ||||
| Arkansas | 17% | 0% | 3% | 5% | ||||
| California | 23% | 13% | 6% | 9% | ||||
| Colorado | 6% | 13% | 2% | 3% | ||||
| Connecticut | 11% | 31% | 2% | 4% | ||||
| Delaware | 15% | 0% | 5% | 7% | ||||
| District of Columbia | 26% | 0% | 0% | 17% | ||||
| Florida | 9% | 6% | 2% | 4% | ||||
| Georgia | 14% | 9% | 3% | 6% | ||||
| Hawaii | 0% | 0% | 2% | 2% | ||||
| Illinois | 20% | 15% | 1% | 5% | ||||
| Indiana | 20% | 25% | 3% | 6% | ||||
| Kansas | 11% | 0% | 1% | 2% | ||||
| Kentucky | 24% | 11% | 3% | 4% | ||||
| Louisiana | 12% | 9% | 3% | 6% | ||||
| Maryland | 7% | 0% | 1% | 2% | ||||
| Massachusetts | 8% | 44% | 4% | 7% | ||||
| Michigan | 27% | 13% | 4% | 8% | ||||
| Minnesota | 50% | 69% | 3% | 5% | ||||
| Mississippi | 13% | 0% | 2% | 6% | ||||
| Missouri | 17% | 11% | 3% | 5% | ||||
| Nebraska | 0% | 0% | 1% | 1% | ||||
| Nevada | 0% | 0% | 4% | 3% | ||||
| New Hampshire | - | - | 0% | 0% | ||||
| New Jersey | 16% | 19% | 1% | 5% | ||||
| New Mexico | 0% | 6% | 0% | 1% | ||||
| New York | 13% | 22% | 2% | 6% | ||||
| North Carolina | 13% | 7% | 1% | 4% | ||||
| Ohio | 20% | 29% | 3% | 5% | ||||
| Oklahoma | 46% | 14% | 3% | 4% | ||||
| Oregon | 74% | 6% | 4% | 5% | ||||
| Pennsylvania | 18% | 20% | 2% | 4% | ||||
| Rhode Island | 0% | 0% | 2% | 2% | ||||
| South Carolina | 13% | 2% | 2% | 5% | ||||
| Tennessee | 25% | 0% | 2% | 6% | ||||
| Texas | 10% | 7% | 1% | 3% | ||||
| Utah | 0% | 0% | 3% | 3% | ||||
| Virginia | 5% | 5% | 1% | 2% | ||||
| Washington | 5% | 0% | 4% | 4% | ||||
| West Virginia | 0% | 0% | 7% | 7% | ||||
| Wisconsin | 47% | 0% | 1% | 4% | ||||
| ME, VT | - | - | 8% | 8% | ||||
| IA, ND, SD | 81% | 31% | 3% | 4% | ||||
| AK, ID, MT, WY | 0% | 16% | 3% | 3% | ||||
| United States | 15% | 13% | 3% | 5% | ||||
| TABLE B-2. Weighted Percent by Race Tabulations of the 1993 SIPP for Selected Characteristics Percentage with Characteristics by Race |
||||||||
|---|---|---|---|---|---|---|---|---|
| Employer Provided Health Insurance, January | ||||||||
| Black | Hispanic | Other | Total | |||||
| Alabama | 44% | 17% | 60% | 56% | ||||
| Arizona | 54% | 41% | 54% | 51% | ||||
| Arkansas | 29% | 10% | 51% | 47% | ||||
| California | 44% | 38% | 55% | 50% | ||||
| Colorado | 48% | 44% | 61% | 58% | ||||
| Connecticut | 59% | 46% | 70% | 67% | ||||
| Delaware | 62% | 45% | 64% | 63% | ||||
| District of Columbia | 47% | 41% | 90% | 55% | ||||
| Florida | 55% | 35% | 54% | 51% | ||||
| Georgia | 33% | 35% | 60% | 53% | ||||
| Hawaii | 0% | 68% | 79% | 77% | ||||
| Illinois | 46% | 57% | 74% | 68% | ||||
| Indiana | 41% | 27% | 64% | 61% | ||||
| Kansas | 69% | 70% | 48% | 50% | ||||
| Kentucky | 50% | 5% | 62% | 60% | ||||
| Louisiana | 28% | 48% | 56% | 48% | ||||
| Maryland | 70% | 70% | 72% | 72% | ||||
| Massachusetts | 63% | 28% | 71% | 68% | ||||
| Michigan | 47% | 45% | 74% | 68% | ||||
| Minnesota | 19% | 24% | 68% | 67% | ||||
| Mississippi | 32% | 100% | 50% | 44% | ||||
| Missouri | 40% | 77% | 65% | 62% | ||||
| Nebraska | 100% | 0% | 53% | 52% | ||||
| Nevada | 34% | 56% | 56% | 53% | ||||
| New Hampshire | - | - | 69% | 69% | ||||
| New Jersey | 48% | 41% | 69% | 64% | ||||
| New Mexico | 53% | 58% | 61% | 59% | ||||
| New York | 48% | 35% | 66% | 60% | ||||
| North Carolina | 46% | 43% | 65% | 61% | ||||
| Ohio | 52% | 41% | 69% | 67% | ||||
| Oklahoma | 54% | 21% | 60% | 57% | ||||
| Oregon | 18% | 27% | 62% | 61% | ||||
| Pennsylvania | 53% | 44% | 69% | 67% | ||||
| Rhode Island | 67% | 52% | 70% | 69% | ||||
| South Carolina | 40% | 64% | 74% | 62% | ||||
| Tennessee | 40% | 79% | 57% | 55% | ||||
| Texas | 49% | 36% | 63% | 55% | ||||
| Utah | 100% | 80% | 69% | 70% | ||||
| Virginia | 49% | 44% | 65% | 61% | ||||
| Washington | 23% | 41% | 61% | 59% | ||||
| West Virginia | 100% | 32% | 53% | 53% | ||||
| Wisconsin | 29% | 70% | 70% | 68% | ||||
| ME, VT | - | - | 61% | 61% | ||||
| IA, ND, SD | 0% | 36% | 61% | 60% | ||||
| AK, ID, MT, WY | 56% | 11% | 61% | 59% | ||||
| United States | 46% | 39% | 64% | 59% | ||||
| TABLE B-2. Weighted Percent by Race Tabulations of the 1993 SIPP for Selected Characteristics Percentage with Characteristics by Race |
||||||||
|---|---|---|---|---|---|---|---|---|
| Work Disability, January | ||||||||
| Black | Hispanic | Other | Total | |||||
| Alabama | 7% | 3% | 9% | 8% | ||||
| Arizona | 28% | 8% | 7% | 7% | ||||
| Arkansas | 13% | 0% | 10% | 11% | ||||
| California | 8% | 5% | 7% | 7% | ||||
| Colorado | 9% | 10% | 9% | 9% | ||||
| Connecticut | 5% | 0% | 5% | 5% | ||||
| Delaware | 5% | 0% | 5% | 5% | ||||
| District of Columbia | 15% | 5% | 16% | 14% | ||||
| Florida | 6% | 7% | 8% | 7% | ||||
| Georgia | 11% | 12% | 9% | 10% | ||||
| Hawaii | 0% | 0% | 5% | 5% | ||||
| Illinois | 8% | 2% | 5% | 5% | ||||
| Indiana | 5% | 5% | 5% | 5% | ||||
| Kansas | 9% | 0% | 5% | 5% | ||||
| Kentucky | 17% | 10% | 9% | 10% | ||||
| Louisiana | 12% | 6% | 11% | 11% | ||||
| Maryland | 6% | 6% | 6% | 6% | ||||
| Massachusetts | 3% | 5% | 6% | 6% | ||||
| Michigan | 11% | 9% | 7% | 7% | ||||
| Minnesota | 14% | 10% | 7% | 7% | ||||
| Mississippi | 8% | 0% | 10% | 9% | ||||
| Missouri | 13% | 0% | 8% | 8% | ||||
| Nebraska | 0% | 0% | 3% | 3% | ||||
| Nevada | 6% | 0% | 7% | 6% | ||||
| New Hampshire | - | - | 4% | 4% | ||||
| New Jersey | 7% | 7% | 4% | 5% | ||||
| New Mexico | 42% | 15% | 6% | 11% | ||||
| New York | 9% | 5% | 6% | 6% | ||||
| North Carolina | 9% | 0% | 9% | 9% | ||||
| Ohio | 7% | 6% | 9% | 9% | ||||
| Oklahoma | 0% | 2% | 9% | 9% | ||||
| Oregon | 0% | 0% | 10% | 10% | ||||
| Pennsylvania | 7% | 12% | 7% | 7% | ||||
| Rhode Island | 8% | 0% | 13% | 12% | ||||
| South Carolina | 9% | 5% | 8% | 8% | ||||
| Tennessee | 11% | 0% | 13% | 13% | ||||
| Texas | 7% | 7% | 6% | 6% | ||||
| Utah | 9% | 9% | 7% | 7% | ||||
| Virginia | 12% | 3% | 6% | 7% | ||||
| Washington | 18% | 24% | 9% | 10% | ||||
| West Virginia | 9% | 0% | 9% | 9% | ||||
| Wisconsin | 15% | 9% | 8% | 9% | ||||
| ME, VT | - | - | 6% | 6% | ||||
| IA, ND, SD | 0% | 0% | 7% | 7% | ||||
| AK, ID, MT, WY | 17% | 6% | 8% | 8% | ||||
| United States | 9% | 6% | 7% | 7% | ||||
| TABLE B-2. Weighted Percent by Race Tabulations of the 1993 SIPP for Selected Characteristics Percentage with Characteristics by Race |
||||||||
|---|---|---|---|---|---|---|---|---|
| Persons Age 15+ Receiving AFDC, in 1 or more months | ||||||||
| Black | Hispanic | Other | Total | |||||
| Alabama | 3% | 0% | 0% | 1% | ||||
| Arizona | 0% | 5% | 1% | 2% | ||||
| Arkansas | 5% | 0% | 1% | 2% | ||||
| California | 7% | 4% | 2% | 3% | ||||
| Colorado | 4% | 4% | 1% | 1% | ||||
| Connecticut | 6% | 13% | 1% | 2% | ||||
| Delaware | 5% | 0% | 2% | 2% | ||||
| District of Columbia | 10% | 0% | 0% | 7% | ||||
| Florida | 5% | 3% | 1% | 2% | ||||
| Georgia | 5% | 3% | 2% | 3% | ||||
| Hawaii | 0% | 0% | 1% | 1% | ||||
| Illinois | 8% | 3% | 1% | 2% | ||||
| Indiana | 7% | 4% | 2% | 2% | ||||
| Kansas | 0% | 0% | 1% | 1% | ||||
| Kentucky | 11% | 5% | 1% | 2% | ||||
| Louisiana | 4% | 3% | 1% | 2% | ||||
| Maryland | 5% | 3% | 0% | 2% | ||||
| Massachusetts | 6% | 17% | 2% | 3% | ||||
| Michigan | 11% | 10% | 2% | 4% | ||||
| Minnesota | 14% | 10% | 1% | 2% | ||||
| Mississippi | 4% | 0% | 1% | 2% | ||||
| Missouri | 6% | 0% | 1% | 2% | ||||
| Nebraska | 0% | 0% | 0% | 0% | ||||
| Nevada | 0% | 0% | 2% | 1% | ||||
| New Hampshire | - | - | 1% | 1% | ||||
| New Jersey | 5% | 6% | 1% | 2% | ||||
| New Mexico | 0% | 3% | 1% | 1% | ||||
| New York | 6% | 8% | 1% | 3% | ||||
| North Carolina | 6% | 4% | 1% | 2% | ||||
| Ohio | 8% | 12% | 1% | 2% | ||||
| Oklahoma | 0% | 2% | 2% | 2% | ||||
| Oregon | 17% | 11% | 2% | 2% | ||||
| Pennsylvania | 8% | 7% | 1% | 2% | ||||
| Rhode Island | 0% | 0% | 2% | 2% | ||||
| South Carolina | 7% | 4% | 0% | 3% | ||||
| Tennessee | 9% | 0% | 1% | 2% | ||||
| Texas | 6% | 2% | 1% | 2% | ||||
| Utah | 0% | 0% | 1% | 1% | ||||
| Virginia | 3% | 2% | 0% | 1% | ||||
| Washington | 0% | 2% | 3% | 3% | ||||
| West Virginia | 0% | 0% | 2% | 2% | ||||
| Wisconsin | 13% | 0% | 1% | 2% | ||||
| ME, VT | - | - | 3% | 3% | ||||
| IA, ND, SD | 21% | 0% | 2% | 2% | ||||
| AK, ID, MT, WY | 0% | 11% | 1% | 1% | ||||
| United States | 6% | 5% | 1% | 2% | ||||
| TABLE B-2. Weighted Percent by Race Tabulations of the 1993 SIPP for Selected Characteristics Percentage with Characteristics by Race |
||||||||
|---|---|---|---|---|---|---|---|---|
| All Persons Receiving AFDC, in 1 or more months | ||||||||
| Black | Hispanic | Other | Total | |||||
| Alabama | 8% | 0% | 1% | 2% | ||||
| Arizona | 0% | 18% | 3% | 6% | ||||
| Arkansas | 17% | 0% | 5% | 6% | ||||
| California | 25% | 17% | 8% | 11% | ||||
| Colorado | 8% | 15% | 3% | 4% | ||||
| Connecticut | 15% | 31% | 3% | 6% | ||||
| Delaware | 18% | 0% | 6% | 8% | ||||
| District of Columbia | 26% | 0% | 0% | 17% | ||||
| Florida | 15% | 7% | 3% | 5% | ||||
| Georgia | 16% | 9% | 5% | 8% | ||||
| Hawaii | 0% | 0% | 9% | 8% | ||||
| Illinois | 25% | 15% | 2% | 7% | ||||
| Indiana | 25% | 25% | 5% | 7% | ||||
| Kansas | 11% | 0% | 4% | 4% | ||||
| Kentucky | 24% | 11% | 5% | 6% | ||||
| Louisiana | 16% | 9% | 4% | 7% | ||||
| Maryland | 12% | 10% | 1% | 5% | ||||
| Massachusetts | 16% | 52% | 5% | 9% | ||||
| Michigan | 30% | 31% | 5% | 10% | ||||
| Minnesota | 50% | 76% | 4% | 6% | ||||
| Mississippi | 16% | 0% | 2% | 7% | ||||
| Missouri | 21% | 11% | 4% | 6% | ||||
| Nebraska | 0% | 0% | 1% | 1% | ||||
| Nevada | 0% | 0% | 4% | 3% | ||||
| New Hampshire | - | - | 2% | 2% | ||||
| New Jersey | 16% | 25% | 1% | 6% | ||||
| New Mexico | 0% | 6% | 5% | 5% | ||||
| New York | 17% | 27% | 3% | 8% | ||||
| North Carolina | 18% | 15% | 2% | 6% | ||||
| Ohio | 24% | 35% | 3% | 6% | ||||
| Oklahoma | 46% | 14% | 5% | 6% | ||||
| Oregon | 74% | 11% | 5% | 6% | ||||
| Pennsylvania | 23% | 25% | 2% | 5% | ||||
| Rhode Island | 0% | 0% | 3% | 3% | ||||
| South Carolina | 20% | 8% | 2% | 8% | ||||
| Tennessee | 30% | 0% | 3% | 7% | ||||
| Texas | 17% | 9% | 2% | 6% | ||||
| Utah | 0% | 0% | 5% | 4% | ||||
| Virginia | 10% | 5% | 1% | 3% | ||||
| Washington | 5% | 14% | 9% | 9% | ||||
| West Virginia | 0% | 35% | 8% | 8% | ||||
| Wisconsin | 47% | 0% | 2% | 5% | ||||
| ME, VT | - | - | 8% | 8% | ||||
| IA, ND, SD | 81% | 31% | 5% | 6% | ||||
| AK, ID, MT, WY | 0% | 22% | 3% | 4% | ||||
| United States | 19% | 16% | 4% | 7% | ||||
| TABLE B-2. Weighted Percent by Race Tabulations of the 1993 SIPP for Selected Characteristics Percentage with Characteristics by Race |
||||||||
|---|---|---|---|---|---|---|---|---|
| Employer Provided Health Insurance, in 1 or more months | ||||||||
| Black | Hispanic | Other | Total | |||||
| Alabama | 57% | 63% | 73% | 69% | ||||
| Arizona | 54% | 46% | 67% | 62% | ||||
| Arkansas | 31% | 70% | 60% | 56% | ||||
| California | 52% | 48% | 66% | 61% | ||||
| Colorado | 55% | 55% | 71% | 68% | ||||
| Connecticut | 67% | 55% | 77% | 75% | ||||
| Delaware | 62% | 100% | 80% | 78% | ||||
| District of Columbia | 60% | 50% | 97% | 66% | ||||
| Florida | 68% | 50% | 64% | 62% | ||||
| Georgia | 50% | 43% | 71% | 65% | ||||
| Hawaii | 0% | 0% | 0% | 0% | ||||
| Illinois | 55% | 69% | 82% | 77% | ||||
| Indiana | 55% | 32% | 74% | 71% | ||||
| Kansas | 69% | 78% | 61% | 61% | ||||
| Kentucky | 63% | 43% | 72% | 71% | ||||
| Louisiana | 39% | 48% | 68% | 60% | ||||
| Maryland | 77% | 92% | 83% | 82% | ||||
| Massachusetts | 68% | 31% | 78% | 75% | ||||
| Michigan | 61% | 45% | 81% | 77% | ||||
| Minnesota | 37% | 24% | 73% | 72% | ||||
| Mississippi | 44% | 100% | 58% | 53% | ||||
| Missouri | 55% | 89% | 72% | 70% | ||||
| Nebraska | 100% | 100% | 69% | 69% | ||||
| Nevada | 47% | 95% | 68% | 67% | ||||
| New Hampshire | - | - | 76% | 76% | ||||
| New Jersey | 56% | 47% | 78% | 72% | ||||
| New Mexico | 53% | 58% | 67% | 64% | ||||
| New York | 57% | 48% | 73% | 68% | ||||
| North Carolina | 56% | 49% | 77% | 72% | ||||
| Ohio | 66% | 46% | 79% | 77% | ||||
| Oklahoma | 54% | 46% | 67% | 65% | ||||
| Oregon | 18% | 38% | 69% | 68% | ||||
| Pennsylvania | 63% | 46% | 76% | 74% | ||||
| Rhode Island | 67% | 52% | 77% | 76% | ||||
| South Carolina | 53% | 70% | 85% | 74% | ||||
| Tennessee | 46% | 79% | 64% | 62% | ||||
| Texas | 60% | 46% | 72% | 64% | ||||
| Utah | 100% | 80% | 77% | 77% | ||||
| Virginia | 57% | 53% | 77% | 71% | ||||
| Washington | 35% | 41% | 70% | 68% | ||||
| West Virginia | 100% | 32% | 59% | 59% | ||||
| Wisconsin | 31% | 70% | 80% | 77% | ||||
| ME, VT | - | - | 70% | 70% | ||||
| IA, ND, SD | 0% | 36% | 69% | 68% | ||||
| AK, ID, MT, WY | 56% | 49% | 72% | 71% | ||||
| United States | 56% | 49% | 72% | 68% | ||||
| TABLE B-2. Weighted Percent by Race Tabulations of the 1993 SIPP for Selected Characteristics Percentage with Characteristics by Race |
||||||||
|---|---|---|---|---|---|---|---|---|
| Work Disability, in 1 or more months | ||||||||
| Black | Hispanic | Other | Total | |||||
| Alabama | 8% | 3% | 11% | 10% | ||||
| Arizona | 38% | 10% | 11% | 11% | ||||
| Arkansas | 17% | 0% | 13% | 14% | ||||
| California | 10% | 7% | 10% | 9% | ||||
| Colorado | 11% | 12% | 12% | 12% | ||||
| Connecticut | 7% | 0% | 8% | 8% | ||||
| Delaware | 5% | 0% | 8% | 7% | ||||
| District of Columbia | 19% | 5% | 16% | 16% | ||||
| Florida | 8% | 9% | 9% | 9% | ||||
| Georgia | 14% | 14% | 12% | 12% | ||||
| Hawaii | 0% | 36% | 6% | 6% | ||||
| Illinois | 10% | 5% | 7% | 7% | ||||
| Indiana | 8% | 5% | 7% | 7% | ||||
| Kansas | 9% | 0% | 7% | 7% | ||||
| Kentucky | 17% | 10% | 11% | 11% | ||||
| Louisiana | 14% | 6% | 14% | 14% | ||||
| Maryland | 8% | 8% | 8% | 8% | ||||
| Massachusetts | 3% | 8% | 8% | 8% | ||||
| Michigan | 13% | 11% | 8% | 9% | ||||
| Minnesota | 14% | 10% | 10% | 10% | ||||
| Mississippi | 9% | 0% | 12% | 11% | ||||
| Missouri | 14% | 0% | 11% | 11% | ||||
| Nebraska | 0% | 0% | 4% | 4% | ||||
| Nevada | 6% | 5% | 11% | 10% | ||||
| New Hampshire | - | - | 7% | 7% | ||||
| New Jersey | 8% | 8% | 7% | 7% | ||||
| New Mexico | 42% | 15% | 10% | 13% | ||||
| New York | 11% | 7% | 8% | 8% | ||||
| North Carolina | 12% | 4% | 11% | 11% | ||||
| Ohio | 11% | 9% | 11% | 11% | ||||
| Oklahoma | 0% | 8% | 13% | 12% | ||||
| Oregon | 0% | 6% | 14% | 14% | ||||
| Pennsylvania | 9% | 15% | 10% | 10% | ||||
| Rhode Island | 16% | 0% | 14% | 14% | ||||
| South Carolina | 10% | 5% | 11% | 10% | ||||
| Tennessee | 12% | 6% | 15% | 15% | ||||
| Texas | 8% | 10% | 8% | 9% | ||||
| Utah | 0% | 9% | 7% | 7% | ||||
| Virginia | 13% | 3% | 8% | 8% | ||||
| Washington | 34% | 24% | 12% | 13% | ||||
| West Virginia | 0% | 0% | 10% | 10% | ||||
| Wisconsin | 17% | 9% | 10% | 11% | ||||
| ME, VT | - | - | 8% | 8% | ||||
| IA, ND, SD | 0% | 0% | 10% | 9% | ||||
| AK, ID, MT, WY | 17% | 11% | 12% | 12% | ||||
| United States | 11% | 8% | 10% | 10% | ||||
| TABLE B-3. Unweighted Cell Counts by Race Tabulations of the 1993 SIPP for Selected Characteristics Unweighted Cell Counts by Race |
||||||||
|---|---|---|---|---|---|---|---|---|
| Total | ||||||||
| Black | Hispanic | Other | Total | |||||
| Alabama | 141 | 26 | 561 | 728 | ||||
| Arizona | 12 | 173 | 632 | 817 | ||||
| Arkansas | 54 | 8 | 353 | 415 | ||||
| California | 358 | 1,752 | 4,344 | 6,454 | ||||
| Colorado | 57 | 65 | 520 | 642 | ||||
| Connecticut | 65 | 32 | 536 | 633 | ||||
| Delaware | 37 | 11 | 167 | 215 | ||||
| District of Columbia | 63 | 15 | 26 | 104 | ||||
| Florida | 224 | 425 | 1,947 | 2,596 | ||||
| Georgia | 327 | 69 | 1,078 | 1,474 | ||||
| Hawaii | 3 | 3 | 166 | 172 | ||||
| Illinois | 341 | 186 | 2,029 | 2,556 | ||||
| Indiana | 136 | 22 | 1,226 | 1,384 | ||||
| Kansas | 21 | 12 | 602 | 635 | ||||
| Kentucky | 26 | 15 | 614 | 655 | ||||
| Louisiana | 200 | 32 | 623 | 855 | ||||
| Maryland | 222 | 36 | 643 | 901 | ||||
| Massachusetts | 31 | 82 | 1,157 | 1,270 | ||||
| Michigan | 292 | 67 | 1,590 | 1,949 | ||||
| Minnesota | 8 | 18 | 1,252 | 1,278 | ||||
| Mississippi | 201 | 1 | 485 | 687 | ||||
| Missouri | 122 | 9 | 992 | 1,123 | ||||
| Nebraska | 2 | 1 | 348 | 351 | ||||
| Nevada | 28 | 16 | 132 | 176 | ||||
| New Hampshire | - | - | 159 | 159 | ||||
| New Jersey | 178 | 204 | 1,351 | 1,733 | ||||
| New Mexico | 7 | 29 | 84 | 120 | ||||
| New York | 427 | 418 | 2,705 | 3,550 | ||||
| North Carolina | 279 | 44 | 1,179 | 1,502 | ||||
| Ohio | 139 | 79 | 1,844 | 2,062 | ||||
| Oklahoma | 5 | 50 | 631 | 686 | ||||
| Oregon | 11 | 18 | 796 | 825 | ||||
| Pennsylvania | 155 | 83 | 2,108 | 2,346 | ||||
| Rhode Island | 13 | 2 | 177 | 192 | ||||
| South Carolina | 224 | 48 | 512 | 784 | ||||
| Tennessee | 132 | 12 | 810 | 954 | ||||
| Texas | 435 | 878 | 2,167 | 3,480 | ||||
| Utah | 2 | 20 | 335 | 357 | ||||
| Virginia | 203 | 57 | 849 | 1,109 | ||||
| Washington | 33 | 34 | 895 | 962 | ||||
| West Virginia | 1 | 3 | 461 | 465 | ||||
| Wisconsin | 49 | 12 | 790 | 851 | ||||
| ME, VT | - | - | 415 | 415 | ||||
| IA, ND, SD | 10 | 9 | 778 | 797 | ||||
| AK, ID, MT, WY | 11 | 19 | 546 | 576 | ||||
| United States | 5,285 | 5,095 | 41,615 | 51,995 | ||||
| TABLE B-3. Unweighted Cell Counts by Race Tabulations of the 1993 SIPP for Selected Characteristics Unweighted Cell Counts by Race |
||||||||
|---|---|---|---|---|---|---|---|---|
| Family Income Less than 100% of Poverty Level | ||||||||
| Black | Hispanic | Other | Total | |||||
| Alabama | 51 | 6 | 85 | 142 | ||||
| Arizona | 7 | 72 | 101 | 180 | ||||
| Arkansas | 32 | - | 83 | 115 | ||||
| California | 127 | 592 | 627 | 1,346 | ||||
| Colorado | 10 | 14 | 63 | 87 | ||||
| Connecticut | 15 | 12 | 52 | 79 | ||||
| Delaware | 13 | - | 18 | 31 | ||||
| District of Columbia | 19 | 9 | - | 28 | ||||
| Florida | 72 | 107 | 260 | 439 | ||||
| Georgia | 115 | 20 | 148 | 283 | ||||
| Hawaii | 3 | - | 5 | 8 | ||||
| Illinois | 114 | 39 | 157 | 310 | ||||
| Indiana | 51 | 8 | 151 | 210 | ||||
| Kansas | 9 | 1 | 75 | 85 | ||||
| Kentucky | 13 | 2 | 97 | 112 | ||||
| Louisiana | 79 | 8 | 125 | 212 | ||||
| Maryland | 33 | 3 | 37 | 73 | ||||
| Massachusetts | 9 | 62 | 139 | 210 | ||||
| Michigan | 103 | 27 | 160 | 290 | ||||
| Minnesota | 2 | 15 | 135 | 152 | ||||
| Mississippi | 88 | - | 84 | 172 | ||||
| Missouri | 39 | 1 | 120 | 160 | ||||
| Nebraska | - | - | 29 | 29 | ||||
| Nevada | 12 | 5 | 11 | 28 | ||||
| New Hampshire | - | - | 14 | 14 | ||||
| New Jersey | 69 | 86 | 91 | 246 | ||||
| New Mexico | 3 | 3 | 17 | 23 | ||||
| New York | 139 | 184 | 346 | 669 | ||||
| North Carolina | 77 | 19 | 116 | 212 | ||||
| Ohio | 47 | 37 | 197 | 281 | ||||
| Oklahoma | 3 | 27 | 118 | 148 | ||||
| Oregon | 8 | 8 | 116 | 132 | ||||
| Pennsylvania | 40 | 34 | 252 | 326 | ||||
| Rhode Island | 1 | - | 13 | 14 | ||||
| South Carolina | 104 | 14 | 47 | 165 | ||||
| Tennessee | 59 | 7 | 111 | 177 | ||||
| Texas | 181 | 350 | 293 | 824 | ||||
| Utah | - | 2 | 41 | 43 | ||||
| Virginia | 62 | 12 | 77 | 151 | ||||
| Washington | 17 | 15 | 130 | 162 | ||||
| West Virginia | - | 2 | 102 | 104 | ||||
| Wisconsin | 26 | - | 46 | 72 | ||||
| ME, VT | - | - | 55 | 55 | ||||
| IA, ND, SD | 8 | 3 | 78 | 89 | ||||
| AK, ID, MT, WY | 1 | - | 66 | 67 | ||||
| United States | 1,861 | 1,806 | 5,088 | 8,755 | ||||
| TABLE B-3. Unweighted Cell Counts by Race Tabulations of the 1993 SIPP for Selected Characteristics Unweighted Cell Counts by Race |
||||||||
|---|---|---|---|---|---|---|---|---|
| Persons Age 15+ Receiving AFDC | ||||||||
| Black | Hispanic | Other | Total | |||||
| Alabama | 4 | - | - | 4 | ||||
| Arizona | - | 7 | 4 | 11 | ||||
| Arkansas | 3 | - | 2 | 5 | ||||
| California | 23 | 58 | 86 | 167 | ||||
| Colorado | 1 | 2 | 3 | 6 | ||||
| Connecticut | 3 | 4 | 4 | 11 | ||||
| Delaware | 2 | - | 3 | 5 | ||||
| District of Columbia | 6 | - | - | 6 | ||||
| Florida | 6 | 9 | 14 | 29 | ||||
| Georgia | 15 | 2 | 12 | 29 | ||||
| Hawaii | - | - | 1 | 1 | ||||
| Illinois | 20 | 7 | 8 | 35 | ||||
| Indiana | 7 | 1 | 12 | 20 | ||||
| Kansas | - | - | 3 | 3 | ||||
| Kentucky | 3 | 1 | 7 | 11 | ||||
| Louisiana | 7 | 1 | 8 | 16 | ||||
| Maryland | 6 | - | 2 | 8 | ||||
| Massachusetts | 1 | 12 | 17 | 30 | ||||
| Michigan | 27 | 2 | 22 | 51 | ||||
| Minnesota | 1 | 2 | 14 | 17 | ||||
| Mississippi | 7 | - | 4 | 11 | ||||
| Missouri | 6 | - | 7 | 13 | ||||
| Nebraska | - | - | 1 | 1 | ||||
| Nevada | - | - | 2 | 2 | ||||
| New Hampshire | - | - | - | - | ||||
| New Jersey | 8 | 10 | 5 | 23 | ||||
| New Mexico | - | 1 | - | 1 | ||||
| New York | 20 | 29 | 21 | 70 | ||||
| North Carolina | 11 | 1 | 7 | 19 | ||||
| Ohio | 8 | 9 | 17 | 34 | ||||
| Oklahoma | - | 1 | 8 | 9 | ||||
| Oregon | 2 | 1 | 10 | 13 | ||||
| Pennsylvania | 8 | 6 | 13 | 27 | ||||
| Rhode Island | - | - | 2 | 2 | ||||
| South Carolina | 11 | 1 | 2 | 14 | ||||
| Tennessee | 10 | - | 6 | 16 | ||||
| Texas | 14 | 16 | 8 | 38 | ||||
| Utah | - | - | 2 | 2 | ||||
| Virginia | 5 | 1 | 2 | 8 | ||||
| Washington | - | - | 15 | 15 | ||||
| West Virginia | - | - | 9 | 9 | ||||
| Wisconsin | 6 | - | 4 | 10 | ||||
| ME, VT | - | - | 11 | 11 | ||||
| IA, ND, SD | 1 | - | 9 | 10 | ||||
| AK, ID, MT, WY | - | 1 | 8 | 6 | ||||
| United States | 252 | 185 | 392 | 829 | ||||
| TABLE B-3. Unweighted Cell Counts by Race Tabulations of the 1993 SIPP for Selected Characteristics Unweighted Cell Counts by Race |
||||||||
|---|---|---|---|---|---|---|---|---|
| All Persons Receiving AFDC | ||||||||
| Black | Hispanic | Other | Total | |||||
| Alabama | 9 | - | - | 9 | ||||
| Arizona | - | 22 | 14 | 36 | ||||
| Arkansas | 10 | - | 9 | 19 | ||||
| California | 86 | 232 | 290 | 608 | ||||
| Colorado | 4 | 7 | 10 | 21 | ||||
| Connecticut | 8 | 10 | 11 | 29 | ||||
| Delaware | 7 | - | 8 | 15 | ||||
| District of Columbia | 17 | - | - | 17 | ||||
| Florida | 20 | 30 | 46 | 96 | ||||
| Georgia | 48 | 7 | 37 | 92 | ||||
| Hawaii | - | - | 3 | 3 | ||||
| Illinois | 70 | 30 | 20 | 120 | ||||
| Indiana | 31 | 6 | 42 | 79 | ||||
| Kansas | 2 | - | 8 | 10 | ||||
| Kentucky | 7 | 2 | 20 | 29 | ||||
| Louisiana | 23 | 3 | 21 | 47 | ||||
| Maryland | 17 | - | 4 | 21 | ||||
| Massachusetts | 3 | 38 | 55 | 96 | ||||
| Michigan | 84 | 10 | 63 | 157 | ||||
| Minnesota | 4 | 13 | 42 | 59 | ||||
| Mississippi | 25 | - | 12 | 37 | ||||
| Missouri | 24 | 1 | 25 | 50 | ||||
| Nebraska | - | - | 3 | 3 | ||||
| Nevada | - | - | 5 | 5 | ||||
| New Hampshire | - | - | - | - | ||||
| New Jersey | 30 | 42 | 13 | 85 | ||||
| New Mexico | - | 2 | - | 2 | ||||
| New York | 61 | 94 | 68 | 223 | ||||
| North Carolina | 40 | 3 | 15 | 58 | ||||
| Ohio | 28 | 25 | 54 | 107 | ||||
| Oklahoma | 3 | 7 | 17 | 27 | ||||
| Oregon | 8 | 1 | 33 | 42 | ||||
| Pennsylvania | 29 | 16 | 44 | 89 | ||||
| Rhode Island | - | - | 5 | 5 | ||||
| South Carolina | 30 | 1 | 10 | 41 | ||||
| Tennessee | 33 | - | 18 | 51 | ||||
| Texas | 45 | 61 | 20 | 126 | ||||
| Utah | - | - | 12 | 12 | ||||
| Virginia | 13 | 3 | 4 | 20 | ||||
| Washington | 2 | - | 42 | 44 | ||||
| West Virginia | - | - | 32 | 32 | ||||
| Wisconsin | 23 | - | 12 | 35 | ||||
| ME, VT | - | - | 33 | 33 | ||||
| IA, ND, SD | 8 | 3 | 23 | 34 | ||||
| AK, ID, MT, WY | - | 3 | 14 | 17 | ||||
| United States | 852 | 672 | 1,217 | 2,741 | ||||
| TABLE B-3. Unweighted Cell Counts by Race Tabulations of the 1993 SIPP for Selected Characteristics Unweighted Cell Counts by Race |
||||||||
|---|---|---|---|---|---|---|---|---|
| Employer Provided Health Insurance | ||||||||
| Black | Hispanic | Other | Total | |||||
| Alabama | 67 | 5 | 341 | 413 | ||||
| Arizona | 7 | 73 | 339 | 419 | ||||
| Arkansas | 15 | 1 | 180 | 196 | ||||
| California | 158 | 659 | 2,389 | 3,206 | ||||
| Colorado | 26 | 30 | 321 | 377 | ||||
| Connecticut | 41 | 15 | 376 | 432 | ||||
| Delaware | 21 | 5 | 109 | 135 | ||||
| District of Columbia | 30 | 5 | 23 | 58 | ||||
| Florida | 121 | 152 | 1,053 | 1,326 | ||||
| Georgia | 108 | 25 | 652 | 785 | ||||
| Hawaii | - | 2 | 132 | 134 | ||||
| Illinois | 156 | 106 | 1,501 | 1,763 | ||||
| Indiana | 56 | 6 | 792 | 854 | ||||
| Kansas | 14 | 8 | 290 | 312 | ||||
| Kentucky | 13 | 1 | 380 | 394 | ||||
| Louisiana | 62 | 15 | 349 | 426 | ||||
| Maryland | 151 | 27 | 467 | 645 | ||||
| Massachusetts | 20 | 22 | 834 | 876 | ||||
| Michigan | 136 | 31 | 1,173 | 1,340 | ||||
| Minnesota | 2 | 4 | 856 | 862 | ||||
| Mississippi | 66 | 1 | 239 | 306 | ||||
| Missouri | 51 | 7 | 642 | 700 | ||||
| Nebraska | 2 | - | 184 | 186 | ||||
| Nevada | 10 | 8 | 75 | 93 | ||||
| New Hampshire | - | - | 111 | 111 | ||||
| New Jersey | 86 | 83 | 944 | 1,113 | ||||
| New Mexico | 4 | 17 | 51 | 72 | ||||
| New York | 215 | 150 | 1,791 | 2,156 | ||||
| North Carolina | 124 | 18 | 779 | 921 | ||||
| Ohio | 70 | 33 | 1,292 | 1,395 | ||||
| Oklahoma | 2 | 10 | 380 | 392 | ||||
| Oregon | 2 | 5 | 496 | 503 | ||||
| Pennsylvania | 83 | 36 | 1,453 | 1,572 | ||||
| Rhode Island | 9 | 1 | 125 | 135 | ||||
| South Carolina | 90 | 30 | 377 | 497 | ||||
| Tennessee | 53 | 9 | 457 | 519 | ||||
| Texas | 208 | 312 | 1,364 | 1,884 | ||||
| Utah | 2 | 17 | 231 | 250 | ||||
| Virginia | 97 | 24 | 552 | 673 | ||||
| Washington | 9 | 13 | 548 | 570 | ||||
| West Virginia | 1 | 1 | 245 | 247 | ||||
| Wisconsin | 15 | 9 | 560 | 584 | ||||
| ME, VT | - | - | 257 | 257 | ||||
| IA, ND, SD | - | 3 | 477 | 480 | ||||
| AK, ID, MT, WY | 6 | 2 | 334 | 342 | ||||
| United States | 2,409 | 1,981 | 26,521 | 30,911 | ||||
| TABLE B-3. Unweighted Cell Counts by Race Tabulations of the 1993 SIPP for Selected Characteristics Unweighted Cell Counts by Race |
||||||||
|---|---|---|---|---|---|---|---|---|
| Work Disability | ||||||||
| Black | Hispanic | Other | Total | |||||
| Alabama | 8 | 1 | 49 | 58 | ||||
| Arizona | 3 | 13 | 41 | 57 | ||||
| Arkansas | 8 | - | 37 | 45 | ||||
| California | 28 | 88 | 306 | 422 | ||||
| Colorado | 5 | 6 | 47 | 58 | ||||
| Connecticut | 3 | - | 28 | 31 | ||||
| Delaware | 2 | - | 8 | 10 | ||||
| District of Columbia | 9 | 1 | 4 | 14 | ||||
| Florida | 12 | 27 | 146 | 185 | ||||
| Georgia | 34 | 6 | 97 | 137 | ||||
| Hawaii | - | - | 8 | 8 | ||||
| Illinois | 29 | 5 | 94 | 128 | ||||
| Indiana | 7 | 1 | 64 | 72 | ||||
| Kansas | 2 | - | 30 | 32 | ||||
| Kentucky | 4 | 1 | 57 | 62 | ||||
| Louisiana | 25 | 2 | 66 | 93 | ||||
| Maryland | 13 | 2 | 39 | 54 | ||||
| Massachusetts | 1 | 4 | 69 | 74 | ||||
| Michigan | 31 | 6 | 103 | 140 | ||||
| Minnesota | 1 | 2 | 85 | 88 | ||||
| Mississippi | 16 | - | 49 | 65 | ||||
| Missouri | 15 | - | 78 | 93 | ||||
| Nebraska | - | - | 11 | 11 | ||||
| Nevada | 2 | - | 9 | 11 | ||||
| New Hampshire | - | - | 6 | 6 | ||||
| New Jersey | 12 | 14 | 60 | 86 | ||||
| New Mexico | 3 | 3 | 5 | 11 | ||||
| New York | 32 | 21 | 161 | 214 | ||||
| North Carolina | 24 | - | 107 | 131 | ||||
| Ohio | 11 | 5 | 162 | 178 | ||||
| Oklahoma | - | 1 | 58 | 59 | ||||
| Oregon | - | - | 77 | 77 | ||||
| Pennsylvania | 11 | 10 | 144 | 165 | ||||
| Rhode Island | 1 | - | 22 | 23 | ||||
| South Carolina | 22 | 2 | 40 | 64 | ||||
| Tennessee | 15 | - | 106 | 121 | ||||
| Texas | 31 | 61 | 124 | 216 | ||||
| Utah | - | 2 | 22 | 24 | ||||
| Virginia | 22 | 2 | 46 | 70 | ||||
| Washington | 6 | 8 | 69 | 83 | ||||
| West Virginia | - | - | 43 | 43 | ||||
| Wisconsin | 7 | 1 | 60 | 68 | ||||
| ME, VT | - | - | 24 | 24 | ||||
| IA, ND, SD | - | - | 57 | 57 | ||||
| AK, ID, MT, WY | 2 | 1 | 41 | 44 | ||||
| United States | 457 | 296 | 2,959 | 3,712 | ||||
| TABLE B-3. Unweighted Cell Counts by Race Tabulations of the 1993 SIPP for Selected Characteristics Unweighted Cell Counts by Race |
||||||||
|---|---|---|---|---|---|---|---|---|
| Persons Age 15+ Receiving AFDC, in 1 or more months | ||||||||
| Black | Hispanic | Other | Total | |||||
| Alabama | 5 | - | 2 | 7 | ||||
| Arizona | - | 9 | 6 | 15 | ||||
| Arkansas | 3 | - | 4 | 7 | ||||
| California | 24 | 79 | 107 | 210 | ||||
| Colorado | 2 | 2 | 4 | 8 | ||||
| Connecticut | 4 | 4 | 5 | 13 | ||||
| Delaware | 2 | - | 3 | 5 | ||||
| District of Columbia | 6 | - | - | 6 | ||||
| Florida | 10 | 12 | 18 | 40 | ||||
| Georgia | 18 | 2 | 16 | 36 | ||||
| Hawaii | - | - | 2 | 2 | ||||
| Illinois | 27 | 7 | 15 | 49 | ||||
| Indiana | 10 | 1 | 19 | 30 | ||||
| Kansas | - | - | 7 | 7 | ||||
| Kentucky | 3 | 1 | 9 | 13 | ||||
| Louisiana | 8 | 1 | 9 | 18 | ||||
| Maryland | 11 | 1 | 3 | 15 | ||||
| Massachusetts | 2 | 14 | 19 | 35 | ||||
| Michigan | 31 | 7 | 27 | 65 | ||||
| Minnesota | 1 | 2 | 18 | 21 | ||||
| Mississippi | 7 | - | 4 | 11 | ||||
| Missouri | 8 | - | 12 | 20 | ||||
| Nebraska | - | - | 1 | 1 | ||||
| Nevada | - | - | 2 | 2 | ||||
| New Hampshire | - | - | 2 | 2 | ||||
| New Jersey | 8 | 12 | 7 | 27 | ||||
| New Mexico | - | 1 | 1 | 2 | ||||
| New York | 26 | 36 | 29 | 91 | ||||
| North Carolina | 16 | 2 | 10 | 28 | ||||
| Ohio | 10 | 10 | 20 | 40 | ||||
| Oklahoma | - | 1 | 10 | 11 | ||||
| Oregon | 2 | 2 | 14 | 18 | ||||
| Pennsylvania | 12 | 6 | 16 | 34 | ||||
| Rhode Island | - | - | 3 | 3 | ||||
| South Carolina | 16 | 2 | 2 | 20 | ||||
| Tennessee | 12 | - | 7 | 19 | ||||
| Texas | 24 | 23 | 17 | 64 | ||||
| Utah | - | - | 3 | 3 | ||||
| Virginia | 7 | 1 | 2 | 10 | ||||
| Washington | - | 1 | 25 | 26 | ||||
| West Virginia | - | - | 11 | 11 | ||||
| Wisconsin | 6 | - | 6 | 12 | ||||
| ME, VT | - | - | 12 | 12 | ||||
| IA, ND, SD | 2 | - | 13 | 15 | ||||
| AK, ID, MT, WY | - | 2 | 6 | 8 | ||||
| United States | 323 | 241 | 528 | 1,092 | ||||
| TABLE B-3. Unweighted Cell Counts by Race Tabulations of the 1993 SIPP for Selected Characteristics Unweighted Cell Counts by Race |
||||||||
|---|---|---|---|---|---|---|---|---|
| All Persons Receiving AFDC, in 1 or more months | ||||||||
| Black | Hispanic | Other | Total | |||||
| Alabama | 11 | - | 4 | 15 | ||||
| Arizona | - | 32 | 19 | 51 | ||||
| Arkansas | 10 | - | 16 | 26 | ||||
| California | 93 | 301 | 371 | 765 | ||||
| Colorado | 5 | 8 | 14 | 27 | ||||
| Connecticut | 11 | 10 | 16 | 37 | ||||
| Delaware | 8 | - | 9 | 17 | ||||
| District of Columbia | 17 | - | - | 17 | ||||
| Florida | 33 | 36 | 60 | 129 | ||||
| Georgia | 55 | 7 | 52 | 114 | ||||
| Hawaii | - | - | 14 | 14 | ||||
| Illinois | 90 | 32 | 46 | 168 | ||||
| Indiana | 38 | 6 | 58 | 102 | ||||
| Kansas | 2 | - | 23 | 25 | ||||
| Kentucky | 7 | 2 | 28 | 37 | ||||
| Louisiana | 30 | 3 | 27 | 60 | ||||
| Maryland | 29 | 3 | 8 | 40 | ||||
| Massachusetts | 6 | 44 | 64 | 114 | ||||
| Michigan | 94 | 21 | 81 | 196 | ||||
| Minnesota | 4 | 14 | 53 | 71 | ||||
| Mississippi | 30 | - | 12 | 42 | ||||
| Missouri | 29 | 1 | 38 | 68 | ||||
| Nebraska | - | - | 3 | 3 | ||||
| Nevada | - | - | 5 | 5 | ||||
| New Hampshire | - | - | 3 | 3 | ||||
| New Jersey | 30 | 54 | 16 | 100 | ||||
| New Mexico | - | 2 | 4 | 6 | ||||
| New York | 81 | 120 | 87 | 288 | ||||
| North Carolina | 54 | 7 | 22 | 83 | ||||
| Ohio | 33 | 29 | 61 | 123 | ||||
| Oklahoma | 3 | 7 | 31 | 41 | ||||
| Oregon | 8 | 2 | 44 | 54 | ||||
| Pennsylvania | 37 | 20 | 56 | 113 | ||||
| Rhode Island | - | - | 6 | 6 | ||||
| South Carolina | 47 | 4 | 10 | 61 | ||||
| Tennessee | 40 | - | 22 | 62 | ||||
| Texas | 74 | 87 | 56 | 217 | ||||
| Utah | - | - | 16 | 16 | ||||
| Virginia | 25 | 3 | 7 | 35 | ||||
| Washington | 2 | 6 | 72 | 80 | ||||
| West Virginia | - | 1 | 39 | 40 | ||||
| Wisconsin | 23 | - | 17 | 40 | ||||
| ME, VT | - | - | 35 | 35 | ||||
| IA, ND, SD | 8 | 3 | 35 | 46 | ||||
| AK, ID, MT, WY | - | 4 | 20 | 24 | ||||
| United States | 1,067 | 869 | 1,680 | 3,616 | ||||
| TABLE B-3. Unweighted Cell Counts by Race Tabulations of the 1993 SIPP for Selected Characteristics Unweighted Cell Counts by Race |
||||||||
|---|---|---|---|---|---|---|---|---|
| Employer Provided Health Insurance, in 1 or more months | ||||||||
| Black | Hispanic | Other | Total | |||||
| Alabama | 82 | 17 | 412 | 511 | ||||
| Arizona | 7 | 82 | 422 | 511 | ||||
| Arkansas | 16 | 6 | 211 | 233 | ||||
| California | 189 | 834 | 2,862 | 3,885 | ||||
| Colorado | 30 | 38 | 369 | 437 | ||||
| Connecticut | 45 | 18 | 416 | 479 | ||||
| Delaware | 21 | 11 | 135 | 167 | ||||
| District of Columbia | 38 | 6 | 25 | 69 | ||||
| Florida | 150 | 213 | 1,247 | 1,610 | ||||
| Georgia | 162 | 30 | 771 | 963 | ||||
| Hawaii | 3 | 3 | 148 | 154 | ||||
| Illinois | 187 | 129 | 1,662 | 1,978 | ||||
| Indiana | 72 | 7 | 911 | 990 | ||||
| Kansas | 14 | 9 | 364 | 387 | ||||
| Kentucky | 16 | 7 | 440 | 463 | ||||
| Louisiana | 84 | 15 | 424 | 523 | ||||
| Maryland | 169 | 33 | 533 | 735 | ||||
| Massachusetts | 21 | 24 | 912 | 957 | ||||
| Michigan | 173 | 31 | 1,298 | 1,502 | ||||
| Minnesota | 3 | 4 | 920 | 927 | ||||
| Mississippi | 88 | 1 | 278 | 367 | ||||
| Missouri | 66 | 8 | 713 | 787 | ||||
| Nebraska | 2 | 1 | 240 | 243 | ||||
| Nevada | 14 | 15 | 90 | 119 | ||||
| New Hampshire | - | - | 122 | 122 | ||||
| New Jersey | 98 | 97 | 1,059 | 1,254 | ||||
| New Mexico | 4 | 17 | 56 | 77 | ||||
| New York | 253 | 199 | 1,995 | 2,447 | ||||
| North Carolina | 148 | 21 | 905 | 1,074 | ||||
| Ohio | 89 | 36 | 1,464 | 1,589 | ||||
| Oklahoma | 2 | 22 | 421 | 445 | ||||
| Oregon | 2 | 7 | 550 | 559 | ||||
| Pennsylvania | 96 | 38 | 1,612 | 1,746 | ||||
| Rhode Island | 9 | 1 | 137 | 147 | ||||
| South Carolina | 118 | 33 | 436 | 587 | ||||
| Tennessee | 60 | 9 | 518 | 587 | ||||
| Texas | 257 | 399 | 1,556 | 2,212 | ||||
| Utah | 2 | 17 | 256 | 275 | ||||
| Virginia | 112 | 30 | 649 | 791 | ||||
| Washington | 12 | 13 | 635 | 660 | ||||
| West Virginia | 1 | 1 | 274 | 276 | ||||
| Wisconsin | 16 | 9 | 634 | 659 | ||||
| ME, VT | - | - | 292 | 292 | ||||
| IA, ND, SD | - | 3 | 536 | 539 | ||||
| AK, ID, MT, WY | 6 | 9 | 394 | 409 | ||||
| United States | 2,937 | 2,503 | 30,304 | 35,744 | ||||
| TABLE B-3. Unweighted Cell Counts by Race Tabulations of the 1993 SIPP for Selected Characteristics Unweighted Cell Counts by Race |
||||||||
|---|---|---|---|---|---|---|---|---|
| Work Disability, in 1 or more months | ||||||||
| Black | Hispanic | Other | Total | |||||
| Alabama | 9 | 1 | 57 | 67 | ||||
| Arizona | 4 | 17 | 68 | 89 | ||||
| Arkansas | 10 | - | 48 | 58 | ||||
| California | 36 | 112 | 415 | 563 | ||||
| Colorado | 6 | 7 | 59 | 72 | ||||
| Connecticut | 4 | - | 42 | 46 | ||||
| Delaware | 2 | - | 14 | 16 | ||||
| District of Columbia | 11 | 1 | 4 | 16 | ||||
| Florida | 17 | 35 | 180 | 232 | ||||
| Georgia | 46 | 7 | 125 | 178 | ||||
| Hawaii | - | 1 | 10 | 11 | ||||
| Illinois | 35 | 10 | 128 | 173 | ||||
| Indiana | 12 | 1 | 88 | 101 | ||||
| Kansas | 2 | - | 42 | 44 | ||||
| Kentucky | 4 | 1 | 67 | 72 | ||||
| Louisiana | 29 | 2 | 85 | 116 | ||||
| Maryland | 19 | 3 | 49 | 71 | ||||
| Massachusetts | 1 | 6 | 92 | 99 | ||||
| Michigan | 37 | 7 | 130 | 174 | ||||
| Minnesota | 1 | 2 | 124 | 127 | ||||
| Mississippi | 19 | - | 58 | 77 | ||||
| Missouri | 16 | - | 107 | 123 | ||||
| Nebraska | - | - | 15 | 15 | ||||
| Nevada | 2 | 1 | 14 | 17 | ||||
| New Hampshire | - | - | 11 | 11 | ||||
| New Jersey | 14 | 17 | 92 | 123 | ||||
| New Mexico | 3 | 3 | 8 | 14 | ||||
| New York | 40 | 27 | 218 | 285 | ||||
| North Carolina | 31 | 2 | 127 | 160 | ||||
| Ohio | 16 | 7 | 202 | 225 | ||||
| Oklahoma | - | 4 | 78 | 82 | ||||
| Oregon | - | 1 | 109 | 110 | ||||
| Pennsylvania | 14 | 12 | 197 | 223 | ||||
| Rhode Island | 2 | - | 25 | 27 | ||||
| South Carolina | 24 | 2 | 55 | 81 | ||||
| Tennessee | 17 | 1 | 126 | 144 | ||||
| Texas | 39 | 93 | 178 | 310 | ||||
| Utah | - | 2 | 22 | 24 | ||||
| Virginia | 23 | 2 | 63 | 88 | ||||
| Washington | 10 | 8 | 99 | 117 | ||||
| West Virginia | - | - | 48 | 48 | ||||
| Wisconsin | 8 | 1 | 77 | 86 | ||||
| ME, VT | - | - | 34 | 34 | ||||
| IA, ND, SD | - | - | 76 | 76 | ||||
| AK, ID, MT, WY | 2 | 2 | 60 | 64 | ||||
| United States | 565 | 398 | 3,926 | 4,889 | ||||
| TABLE B-4. Weighted Percent by Age Tabulations of the 1993 SIPP for Selected Characteristics Percent with Characteristics by Age |
||||||||
|---|---|---|---|---|---|---|---|---|
| Family Income Less than 100% of Poverty Level | ||||||||
| <18 | 18-64 | 65+ | Total | |||||
| Alabama | 32% | 16% | 14% | 19% | ||||
| Arizona | 33% | 19% | 15% | 22% | ||||
| Arkansas | 36% | 25% | 22% | 28% | ||||
| California | 32% | 17% | 10% | 21% | ||||
| Colorado | 19% | 12% | 8% | 14% | ||||
| Connecticut | 22% | 10% | 12% | 13% | ||||
| Delaware | 20% | 12% | 17% | 15% | ||||
| District of Columbia | 54% | 20% | 0% | 25% | ||||
| Florida | 24% | 16% | 12% | 18% | ||||
| Georgia | 27% | 15% | 24% | 19% | ||||
| Hawaii | 12% | 4% | 0% | 5% | ||||
| Illinois | 20% | 9% | 12% | 13% | ||||
| Indiana | 26% | 11% | 9% | 15% | ||||
| Kansas | 20% | 12% | 9% | 14% | ||||
| Kentucky | 28% | 13% | 19% | 17% | ||||
| Louisiana | 34% | 23% | 16% | 26% | ||||
| Maryland | 10% | 8% | 5% | 8% | ||||
| Massachusetts | 25% | 14% | 14% | 17% | ||||
| Michigan | 23% | 13% | 9% | 15% | ||||
| Minnesota | 17% | 9% | 16% | 12% | ||||
| Mississippi | 34% | 21% | 28% | 26% | ||||
| Missouri | 22% | 11% | 14% | 15% | ||||
| Nebraska | 9% | 6% | 11% | 8% | ||||
| Nevada | 22% | 17% | 0% | 17% | ||||
| New Hampshire | - | - | 8% | 9% | ||||
| New Jersey | 21% | 12% | 11% | 14% | ||||
| New Mexico | 27% | 19% | 0% | 19% | ||||
| New York | 29% | 16% | 14% | 19% | ||||
| North Carolina | 22% | 11% | 18% | 14% | ||||
| Ohio | 21% | 11% | 11% | 14% | ||||
| Oklahoma | 33% | 18% | 13% | 21% | ||||
| Oregon | 23% | 13% | 12% | 16% | ||||
| Pennsylvania | 23% | 10% | 13% | 14% | ||||
| Rhode Island | 4% | 8% | 15% | 8% | ||||
| South Carolina | 32% | 16% | 25% | 21% | ||||
| Tennessee | 29% | 15% | 19% | 19% | ||||
| Texas | 34% | 19% | 17% | 23% | ||||
| Utah | 16% | 11% | 4% | 13% | ||||
| Virginia | 17% | 12% | 15% | 14% | ||||
| Washington | 24% | 15% | 9% | 17% | ||||
| West Virginia | 36% | 19% | 11% | 22% | ||||
| Wisconsin | 17% | 6% | 7% | 9% | ||||
| ME, VT | - | - | 5% | 13% | ||||
| IA, ND, SD | 18% | 10% | 4% | 11% | ||||
| AK, ID, MT, WY | 12% | 9% | 20% | 11% | ||||
| United States | 26% | 14% | 13% | 17% | ||||
| TABLE B-4. Weighted Percent by Age Tabulations of the 1993 SIPP for Selected Characteristics Percent with Characteristics by Age |
||||||||
|---|---|---|---|---|---|---|---|---|
| Persons Age 15+ Receiving AFDC, January | ||||||||
| <18 | 18-64 | 65+ | Total | |||||
| Alabama | 0% | 1% | 0% | 1% | ||||
| Arizona | 0% | 2% | 0% | 1% | ||||
| Arkansas | 0% | 2% | 0% | 1% | ||||
| California | 0% | 4% | 0% | 3% | ||||
| Colorado | 0% | 2% | 0% | 1% | ||||
| Connecticut | 0% | 3% | 0% | 2% | ||||
| Delaware | 0% | 4% | 0% | 2% | ||||
| District of Columbia | 0% | 10% | 0% | 7% | ||||
| Florida | 0% | 2% | 0% | 1% | ||||
| Georgia | 0% | 3% | 0% | 2% | ||||
| Hawaii | 0% | 1% | 0% | 1% | ||||
| Illinois | 0% | 2% | 0% | 2% | ||||
| Indiana | 0% | 2% | 0% | 1% | ||||
| Kansas | 0% | 1% | 0% | 0% | ||||
| Kentucky | 0% | 3% | 0% | 2% | ||||
| Louisiana | 0% | 3% | 0% | 2% | ||||
| Maryland | 0% | 1% | 0% | 1% | ||||
| Massachusetts | 0% | 4% | 0% | 2% | ||||
| Michigan | 0% | 5% | 0% | 3% | ||||
| Minnesota | 0% | 2% | 0% | 1% | ||||
| Mississippi | 0% | 3% | 0% | 2% | ||||
| Missouri | 0% | 2% | 0% | 1% | ||||
| Nebraska | 0% | 1% | 0% | 0% | ||||
| Nevada | 0% | 2% | 0% | 1% | ||||
| New Hampshire | - | - | 0% | 0% | ||||
| New Jersey | 0% | 2% | 0% | 1% | ||||
| New Mexico | 2% | 0% | 0% | 1% | ||||
| New York | 0% | 3% | 0% | 2% | ||||
| North Carolina | 0% | 2% | 0% | 1% | ||||
| Ohio | 0% | 3% | 0% | 2% | ||||
| Oklahoma | 0% | 2% | 0% | 1% | ||||
| Oregon | 0% | 2% | 1% | 2% | ||||
| Pennsylvania | 0% | 2% | 0% | 1% | ||||
| Rhode Island | 0% | 2% | 0% | 1% | ||||
| South Carolina | 0% | 3% | 0% | 2% | ||||
| Tennessee | 0% | 3% | 0% | 2% | ||||
| Texas | 0% | 2% | 0% | 1% | ||||
| Utah | 0% | 1% | 0% | 1% | ||||
| Virginia | 0% | 1% | 1% | 1% | ||||
| Washington | 0% | 2% | 0% | 1% | ||||
| West Virginia | 0% | 3% | 0% | 2% | ||||
| Wisconsin | 0% | 2% | 0% | 1% | ||||
| ME, VT | - | - | 0% | 3% | ||||
| IA, ND, SD | 0% | 2% | 0% | 1% | ||||
| AK, ID, MT, WY | 1% | 1% | 0% | 1% | ||||
| United States | 0% | 3% | 0% | 2% | ||||
| TABLE B-4. Weighted Percent by Age Tabulations of the 1993 SIPP for Selected Characteristics Percent with Characteristics by Age |
||||||||
|---|---|---|---|---|---|---|---|---|
| All Persons Receiving AFDC, January | ||||||||
| <18 | 18-64 | 65+ | Total | |||||
| Alabama | 3% | 1% | 0% | 1% | ||||
| Arizona | 11% | 2% | 0% | 4% | ||||
| Arkansas | 10% | 3% | 0% | 5% | ||||
| California | 20% | 5% | 1% | 9% | ||||
| Colorado | 9% | 2% | 0% | 3% | ||||
| Connecticut | 13% | 3% | 0% | 4% | ||||
| Delaware | 16% | 5% | 0% | 7% | ||||
| District of Columbia | 41% | 11% | 0% | 17% | ||||
| Florida | 10% | 2% | 0% | 4% | ||||
| Georgia | 14% | 4% | 0% | 6% | ||||
| Hawaii | 2% | 2% | 0% | 2% | ||||
| Illinois | 12% | 3% | 0% | 5% | ||||
| Indiana | 14% | 3% | 0% | 6% | ||||
| Kansas | 5% | 1% | 0% | 2% | ||||
| Kentucky | 11% | 3% | 0% | 4% | ||||
| Louisiana | 11% | 4% | 0% | 6% | ||||
| Maryland | 5% | 2% | 0% | 2% | ||||
| Massachusetts | 18% | 4% | 0% | 7% | ||||
| Michigan | 17% | 5% | 0% | 8% | ||||
| Minnesota | 12% | 3% | 0% | 5% | ||||
| Mississippi | 13% | 3% | 0% | 6% | ||||
| Missouri | 12% | 2% | 0% | 5% | ||||
| Nebraska | 2% | 1% | 0% | 1% | ||||
| Nevada | 6% | 2% | 0% | 3% | ||||
| New Hampshire | - | - | 0% | 0% | ||||
| New Jersey | 13% | 2% | 0% | 5% | ||||
| New Mexico | 5% | 0% | 0% | 1% | ||||
| New York | 14% | 4% | 0% | 6% | ||||
| North Carolina | 11% | 2% | 0% | 4% | ||||
| Ohio | 13% | 3% | 0% | 5% | ||||
| Oklahoma | 10% | 2% | 0% | 4% | ||||
| Oregon | 11% | 3% | 1% | 5% | ||||
| Pennsylvania | 9% | 2% | 0% | 4% | ||||
| Rhode Island | 5% | 2% | 0% | 2% | ||||
| South Carolina | 11% | 3% | 0% | 5% | ||||
| Tennessee | 16% | 3% | 0% | 6% | ||||
| Texas | 8% | 2% | 0% | 3% | ||||
| Utah | 5% | 2% | 0% | 3% | ||||
| Virginia | 4% | 1% | 1% | 2% | ||||
| Washington | 8% | 3% | 0% | 4% | ||||
| West Virginia | 17% | 4% | 0% | 7% | ||||
| Wisconsin | 12% | 2% | 0% | 4% | ||||
| ME, VT | - | - | 0% | 8% | ||||
| IA, ND, SD | 10% | 3% | 0% | 4% | ||||
| AK, ID, MT, WY | 6% | 2% | 0% | 3% | ||||
| United States | 12% | 3% | 0% | 5% | ||||
| TABLE B-4. Weighted Percent by Age Tabulations of the 1993 SIPP for Selected Characteristics Percent with Characteristics by Age |
||||||||
|---|---|---|---|---|---|---|---|---|
| Employer Provided Health Insurance, January | ||||||||
| <18 | 18-64 | 65+ | Total | |||||
| Alabama | 46% | 61% | 42% | 56% | ||||
| Arizona | 46% | 56% | 38% | 51% | ||||
| Arkansas | 46% | 50% | 38% | 47% | ||||
| California | 43% | 56% | 34% | 50% | ||||
| Colorado | 55% | 62% | 33% | 58% | ||||
| Connecticut | 68% | 73% | 45% | 67% | ||||
| Delaware | 54% | 70% | 50% | 63% | ||||
| District of Columbia | 38% | 59% | 67% | 55% | ||||
| Florida | 48% | 56% | 33% | 51% | ||||
| Georgia | 51% | 57% | 29% | 53% | ||||
| Hawaii | 80% | 80% | 66% | 77% | ||||
| Illinois | 67% | 73% | 42% | 68% | ||||
| Indiana | 57% | 67% | 41% | 61% | ||||
| Kansas | 49% | 58% | 21% | 50% | ||||
| Kentucky | 61% | 63% | 40% | 60% | ||||
| Louisiana | 49% | 52% | 27% | 48% | ||||
| Maryland | 73% | 73% | 62% | 72% | ||||
| Massachusetts | 67% | 74% | 38% | 68% | ||||
| Michigan | 66% | 71% | 53% | 68% | ||||
| Minnesota | 73% | 73% | 30% | 67% | ||||
| Mississippi | 35% | 54% | 16% | 44% | ||||
| Missouri | 61% | 68% | 36% | 62% | ||||
| Nebraska | 54% | 60% | 26% | 52% | ||||
| Nevada | 53% | 57% | 18% | 53% | ||||
| New Hampshire | - | - | 57% | 69% | ||||
| New Jersey | 62% | 70% | 38% | 64% | ||||
| New Mexico | 52% | 65% | 49% | 59% | ||||
| New York | 55% | 65% | 48% | 60% | ||||
| North Carolina | 58% | 67% | 35% | 61% | ||||
| Ohio | 64% | 72% | 48% | 67% | ||||
| Oklahoma | 56% | 64% | 30% | 57% | ||||
| Oregon | 60% | 64% | 43% | 61% | ||||
| Pennsylvania | 63% | 73% | 48% | 67% | ||||
| Rhode Island | 75% | 75% | 29% | 69% | ||||
| South Carolina | 56% | 68% | 40% | 62% | ||||
| Tennessee | 54% | 60% | 32% | 55% | ||||
| Texas | 51% | 59% | 35% | 55% | ||||
| Utah | 71% | 73% | 45% | 70% | ||||
| Virginia | 57% | 64% | 47% | 61% | ||||
| Washington | 59% | 64% | 35% | 59% | ||||
| West Virginia | 48% | 57% | 43% | 53% | ||||
| Wisconsin | 74% | 70% | 38% | 68% | ||||
| ME, VT | - | - | 36% | 61% | ||||
| IA, ND, SD | 65% | 66% | 30% | 60% | ||||
| AK, ID, MT, WY | 61% | 65% | 28% | 59% | ||||
| United States | 56% | 64% | 39% | 59% | ||||
| TABLE B-4. Weighted Percent by Age Tabulations of the 1993 SIPP for Selected Characteristics Percent with Characteristics by Age |
||||||||
|---|---|---|---|---|---|---|---|---|
| Work Disability, January | ||||||||
| <18 | 18-64 | 65-69 | Total | |||||
| Alabama | 3% | 10% | 39% | 8% | ||||
| Arizona | 1% | 10% | 22% | 7% | ||||
| Arkansas | 0% | 16% | 19% | 11% | ||||
| California | 0% | 10% | 25% | 7% | ||||
| Colorado | 0% | 12% | 62% | 9% | ||||
| Connecticut | 2% | 7% | 14% | 5% | ||||
| Delaware | 0% | 6% | 24% | 5% | ||||
| District of Columbia | 5% | 18% | 13% | 14% | ||||
| Florida | 0% | 10% | 24% | 7% | ||||
| Georgia | 1% | 13% | 43% | 10% | ||||
| Hawaii | 0% | 6% | 12% | 5% | ||||
| Illinois | 1% | 7% | 11% | 5% | ||||
| Indiana | 0% | 7% | 21% | 5% | ||||
| Kansas | 1% | 7% | 25% | 5% | ||||
| Kentucky | 0% | 13% | 42% | 10% | ||||
| Louisiana | 1% | 16% | 39% | 11% | ||||
| Maryland | 0% | 8% | 27% | 6% | ||||
| Massachusetts | 0% | 8% | 19% | 6% | ||||
| Michigan | 1% | 10% | 24% | 7% | ||||
| Minnesota | 0% | 10% | 23% | 7% | ||||
| Mississippi | 0% | 13% | 36% | 9% | ||||
| Missouri | 2% | 10% | 44% | 8% | ||||
| Nebraska | 0% | 5% | 17% | 3% | ||||
| Nevada | 2% | 7% | 35% | 6% | ||||
| New Hampshire | - | - | 0% | 4% | ||||
| New Jersey | 0% | 7% | 16% | 5% | ||||
| New Mexico | 7% | 12% | 30% | 11% | ||||
| New York | 1% | 9% | 19% | 6% | ||||
| North Carolina | 0% | 12% | 27% | 9% | ||||
| Ohio | 1% | 13% | 21% | 9% | ||||
| Oklahoma | 1% | 12% | 43% | 9% | ||||
| Oregon | 0% | 13% | 34% | 10% | ||||
| Pennsylvania | 0% | 9% | 32% | 7% | ||||
| Rhode Island | 0% | 18% | 14% | 12% | ||||
| South Carolina | 0% | 11% | 32% | 8% | ||||
| Tennessee | 1% | 16% | 46% | 13% | ||||
| Texas | 0% | 8% | 31% | 6% | ||||
| Utah | 1% | 12% | 18% | 7% | ||||
| Virginia | 0% | 9% | 35% | 7% | ||||
| Washington | 1% | 13% | 35% | 10% | ||||
| West Virginia | 2% | 12% | 34% | 9% | ||||
| Wisconsin | 0% | 11% | 27% | 9% | ||||
| ME, VT | - | - | 17% | 6% | ||||
| IA, ND, SD | 1% | 10% | 23% | 7% | ||||
| AK, ID, MT, WY | 1% | 11% | 34% | 8% | ||||
| United States | 1% | 10% | 27% | 7% | ||||
| TABLE B-4. Weighted Percent by Age Tabulations of the 1993 SIPP for Selected Characteristics Percent with Characteristics by Age |
||||||||
|---|---|---|---|---|---|---|---|---|
| Persons Age 15+ Receiving AFDC, in 1 or more months | ||||||||
| <18 | 18-64 | 65+ | Total | |||||
| Alabama | 0% | 2% | 0% | 1% | ||||
| Arizona | 0% | 3% | 0% | 2% | ||||
| Arkansas | 0% | 3% | 0% | 2% | ||||
| California | 0% | 5% | 0% | 3% | ||||
| Colorado | 0% | 2% | 0% | 1% | ||||
| Connecticut | 0% | 3% | 0% | 2% | ||||
| Delaware | 0% | 4% | 0% | 2% | ||||
| District of Columbia | 0% | 10% | 0% | 7% | ||||
| Florida | 0% | 3% | 0% | 2% | ||||
| Georgia | 0% | 4% | 2% | 3% | ||||
| Hawaii | 0% | 2% | 0% | 1% | ||||
| Illinois | 0% | 3% | 0% | 2% | ||||
| Indiana | 1% | 3% | 0% | 2% | ||||
| Kansas | 0% | 2% | 0% | 1% | ||||
| Kentucky | 0% | 3% | 0% | 2% | ||||
| Louisiana | 0% | 4% | 0% | 2% | ||||
| Maryland | 0% | 3% | 0% | 2% | ||||
| Massachusetts | 0% | 4% | 0% | 3% | ||||
| Michigan | 0% | 6% | 0% | 4% | ||||
| Minnesota | 0% | 3% | 0% | 2% | ||||
| Mississippi | 0% | 3% | 0% | 2% | ||||
| Missouri | 0% | 3% | 0% | 2% | ||||
| Nebraska | 0% | 1% | 0% | 0% | ||||
| Nevada | 0% | 2% | 0% | 1% | ||||
| New Hampshire | - | - | 0% | 1% | ||||
| New Jersey | 0% | 3% | 0% | 2% | ||||
| New Mexico | 2% | 1% | 0% | 1% | ||||
| New York | 0% | 4% | 0% | 3% | ||||
| North Carolina | 1% | 3% | 0% | 2% | ||||
| Ohio | 0% | 3% | 0% | 2% | ||||
| Oklahoma | 0% | 3% | 0% | 2% | ||||
| Oregon | 0% | 3% | 1% | 2% | ||||
| Pennsylvania | 0% | 2% | 0% | 2% | ||||
| Rhode Island | 0% | 3% | 0% | 2% | ||||
| South Carolina | 0% | 4% | 0% | 3% | ||||
| Tennessee | 0% | 4% | 0% | 2% | ||||
| Texas | 0% | 3% | 0% | 2% | ||||
| Utah | 0% | 2% | 0% | 1% | ||||
| Virginia | 0% | 1% | 1% | 1% | ||||
| Washington | 0% | 5% | 0% | 3% | ||||
| West Virginia | 0% | 4% | 0% | 2% | ||||
| Wisconsin | 0% | 2% | 0% | 2% | ||||
| ME, VT | - | - | 0% | 3% | ||||
| IA, ND, SD | 0% | 3% | 0% | 2% | ||||
| AK, ID, MT, WY | 1% | 2% | 0% | 1% | ||||
| United States | 0% | 3% | 0% | 2% | ||||
| TABLE B-4. Weighted Percent by Age Tabulations of the 1993 SIPP for Selected Characteristics Percent with Characteristics by Age |
||||||||
|---|---|---|---|---|---|---|---|---|
| All Persons Receiving AFDC, in 1 or more months | ||||||||
| <18 | 18-64 | 65+ | Total | |||||
| Alabama | 5% | 2% | 0% | 2% | ||||
| Arizona | 14% | 4% | 0% | 6% | ||||
| Arkansas | 14% | 4% | 0% | 6% | ||||
| California | 24% | 7% | 10% | 11% | ||||
| Colorado | 10% | 2% | 0% | 4% | ||||
| Connecticut | 17% | 3% | 0% | 6% | ||||
| Delaware | 20% | 5% | 0% | 8% | ||||
| District of Columbia | 41% | 11% | 0% | 17% | ||||
| Florida | 13% | 3% | 0% | 5% | ||||
| Georgia | 16% | 4% | 2% | 8% | ||||
| Hawaii | 10% | 10% | 0% | 8% | ||||
| Illinois | 16% | 4% | 0% | 7% | ||||
| Indiana | 18% | 4% | 0% | 7% | ||||
| Kansas | 10% | 2% | 0% | 4% | ||||
| Kentucky | 13% | 4% | 0% | 6% | ||||
| Louisiana | 15% | 5% | 0% | 7% | ||||
| Maryland | 9% | 4% | 0% | 5% | ||||
| Massachusetts | 22% | 5% | 0% | 9% | ||||
| Michigan | 21% | 7% | 0% | 10% | ||||
| Minnesota | 13% | 4% | 0% | 6% | ||||
| Mississippi | 16% | 3% | 0% | 7% | ||||
| Missouri | 16% | 3% | 0% | 6% | ||||
| Nebraska | 2% | 1% | 0% | 1% | ||||
| Nevada | 6% | 2% | 0% | 3% | ||||
| New Hampshire | - | - | 0% | 2% | ||||
| New Jersey | 15% | 3% | 0% | 6% | ||||
| New Mexico | 14% | 1% | 0% | 5% | ||||
| New York | 18% | 5% | 0% | 8% | ||||
| North Carolina | 15% | 3% | 0% | 6% | ||||
| Ohio | 15% | 4% | 0% | 6% | ||||
| Oklahoma | 16% | 3% | 0% | 6% | ||||
| Oregon | 13% | 5% | 1% | 6% | ||||
| Pennsylvania | 12% | 3% | 0% | 5% | ||||
| Rhode Island | 5% | 3% | 0% | 3% | ||||
| South Carolina | 17% | 5% | 0% | 8% | ||||
| Tennessee | 19% | 4% | 0% | 7% | ||||
| Texas | 13% | 4% | 0% | 6% | ||||
| Utah | 7% | 3% | 0% | 4% | ||||
| Virginia | 8% | 1% | 1% | 3% | ||||
| Washington | 17% | 6% | 0% | 9% | ||||
| West Virginia | 19% | 5% | 0% | 8% | ||||
| Wisconsin | 13% | 3% | 0% | 5% | ||||
| ME, VT | - | - | 0% | 8% | ||||
| IA, ND, SD | 13% | 5% | 0% | 6% | ||||
| AK, ID, MT, WY | 9% | 2% | 0% | 4% | ||||
| United States | 16% | 4% | 0% | 7% | ||||
| TABLE B-4. Weighted Percent by Age Tabulations of the 1993 SIPP for Selected Characteristics Percent with Characteristics by Age |
||||||||
|---|---|---|---|---|---|---|---|---|
| Employer Provided Health Insurance, in 1 or more months | ||||||||
| <18 | 18-64 | 65+ | Total | |||||
| Alabama | 63% | 74% | 54% | 69% | ||||
| Arizona | 56% | 67% | 52% | 62% | ||||
| Arkansas | 52% | 59% | 53% | 56% | ||||
| California | 52% | 68% | 44% | 61% | ||||
| Colorado | 61% | 74% | 40% | 68% | ||||
| Connecticut | 74% | 81% | 54% | 75% | ||||
| Delaware | 75% | 83% | 57% | 78% | ||||
| District of Columbia | 41% | 71% | 87% | 66% | ||||
| Florida | 62% | 67% | 42% | 62% | ||||
| Georgia | 62% | 70% | 39% | 65% | ||||
| Hawaii | 91% | 92% | 79% | 90% | ||||
| Illinois | 75% | 82% | 53% | 77% | ||||
| Indiana | 66% | 76% | 57% | 71% | ||||
| Kansas | 65% | 69% | 30% | 61% | ||||
| Kentucky | 70% | 75% | 47% | 71% | ||||
| Louisiana | 63% | 62% | 38% | 60% | ||||
| Maryland | 80% | 84% | 69% | 82% | ||||
| Massachusetts | 72% | 81% | 45% | 75% | ||||
| Michigan | 72% | 80% | 68% | 77% | ||||
| Minnesota | 75% | 80% | 32% | 72% | ||||
| Mississippi | 47% | 63% | 20% | 53% | ||||
| Missouri | 67% | 78% | 40% | 70% | ||||
| Nebraska | 77% | 79% | 30% | 69% | ||||
| Nevada | 68% | 73% | 29% | 67% | ||||
| New Hampshire | - | - | 69% | 76% | ||||
| New Jersey | 69% | 78% | 47% | 72% | ||||
| New Mexico | 52% | 68% | 69% | 64% | ||||
| New York | 63% | 73% | 55% | 68% | ||||
| North Carolina | 70% | 78% | 43% | 72% | ||||
| Ohio | 73% | 81% | 61% | 77% | ||||
| Oklahoma | 62% | 72% | 39% | 65% | ||||
| Oregon | 62% | 73% | 51% | 68% | ||||
| Pennsylvania | 69% | 81% | 56% | 74% | ||||
| Rhode Island | 79% | 83% | 29% | 76% | ||||
| South Carolina | 67% | 80% | 51% | 74% | ||||
| Tennessee | 60% | 69% | 36% | 62% | ||||
| Texas | 58% | 70% | 46% | 64% | ||||
| Utah | 78% | 80% | 58% | 77% | ||||
| Virginia | 70% | 75% | 55% | 71% | ||||
| Washington | 67% | 73% | 43% | 68% | ||||
| West Virginia | 55% | 64% | 46% | 59% | ||||
| Wisconsin | 78% | 82% | 45% | 77% | ||||
| ME, VT | - | - | 40% | 70% | ||||
| IA, ND, SD | 71% | 75% | 33% | 68% | ||||
| AK, ID, MT, WY | 78% | 76% | 29% | 71% | ||||
| United States | 65% | 74% | 48% | 69% | ||||
| TABLE B-4. Weighted Percent by Age Tabulations of the 1993 SIPP for Selected Characteristics Percent with Characteristics by Age |
||||||||
|---|---|---|---|---|---|---|---|---|
| Work Disability, in 1 or more months | ||||||||
| <18 | 18-64 | 65+ | Total | |||||
| Alabama | 3% | 12% | 13% | 10% | ||||
| Arizona | 2% | 16% | 10% | 11% | ||||
| Arkansas | 1% | 21% | 9% | 14% | ||||
| California | 1% | 13% | 11% | 9% | ||||
| Colorado | 1% | 16% | 20% | 12% | ||||
| Connecticut | 2% | 10% | 5% | 8% | ||||
| Delaware | 0% | 8% | 16% | 7% | ||||
| District of Columbia | 5% | 21% | 12% | 16% | ||||
| Florida | 1% | 12% | 9% | 9% | ||||
| Georgia | 1% | 17% | 19% | 12% | ||||
| Hawaii | 0% | 8% | 7% | 6% | ||||
| Illinois | 2% | 10% | 5% | 7% | ||||
| Indiana | 1% | 10% | 8% | 7% | ||||
| Kansas | 1% | 10% | 8% | 7% | ||||
| Kentucky | 1% | 14% | 16% | 11% | ||||
| Louisiana | 1% | 20% | 13% | 14% | ||||
| Maryland | 0% | 10% | 16% | 8% | ||||
| Massachusetts | 0% | 11% | 8% | 8% | ||||
| Michigan | 1% | 13% | 9% | 9% | ||||
| Minnesota | 1% | 14% | 9% | 10% | ||||
| Mississippi | 1% | 16% | 11 | 11% | ||||
| Missouri | 2% | 14% | 14% | 11% | ||||
| Nebraska | 1% | 6% | 3% | 4% | ||||
| Nevada | 2% | 13% | 11% | 10% | ||||
| New Hampshire | - | - | 0% | 7% | ||||
| New Jersey | 0% | 10% | 8% | 7% | ||||
| New Mexico | 7% | 16% | 14% | 13% | ||||
| New York | 1% | 11% | 8% | 8% | ||||
| North Carolina | 0% | 14% | 16% | 11% | ||||
| Ohio | 1% | 16% | 8% | 11% | ||||
| Oklahoma | 2% | 16% | 14% | 12% | ||||
| Oregon | 1% | 19% | 13% | 14% | ||||
| Pennsylvania | 1% | 12% | 14% | 10% | ||||
| Rhode Island | 0% | 20% | 9% | 14% | ||||
| South Carolina | 0% | 13% | 19% | 10% | ||||
| Tennessee | 1% | 19% | 19% | 15% | ||||
| Texas | 0% | 12% | 15% | 9% | ||||
| Utah | 1% | 12% | 4% | 7% | ||||
| Virginia | 0% | 11% | 15% | 8% | ||||
| Washington | 2% | 19% | 17% | 13% | ||||
| West Virginia | 2% | 13% | 13% | 10% | ||||
| Wisconsin | 1% | 14% | 11% | 11% | ||||
| ME, VT | - | - | 11% | 8% | ||||
| IA, ND, SD | 1% | 13% | 7% | 9% | ||||
| AK, ID, MT, WY | 1% | 17% | 12% | 12% | ||||
| United States | 1% | 13% | 11% | 10% | ||||
| TABLE B-5. Unweighted Cell Counts by Age Tabulations of the 1993 SIPP for Selected Characteristics Unweighted Cell Counts by Age |
||||||||
|---|---|---|---|---|---|---|---|---|
| Totals | ||||||||
| <18 | 18-64 | 65+ | 65-69 only | Total | ||||
| Alabama | 177 | 460 | 91 | 31 | 728 | |||
| Arizona | 233 | 476 | 108 | 34 | 817 | |||
| Arkansas | 117 | 245 | 53 | 15 | 415 | |||
| California | 1,990 | 3,779 | 685 | 220 | 6,454 | |||
| Colorado | 189 | 402 | 51 | 17 | 642 | |||
| Connecticut | 144 | 389 | 100 | 28 | 633 | |||
| Delaware | 56 | 130 | 29 | 9 | 215 | |||
| District of Columbia | 25 | 65 | 14 | 7 | 104 | |||
| Florida | 636 | 1,566 | 394 | 123 | 2,596 | |||
| Georgia | 458 | 892 | 124 | 47 | 1,474 | |||
| Hawaii | 38 | 104 | 30 | 8 | 172 | |||
| Illinois | 744 | 1,528 | 284 | 94 | 2,556 | |||
| Indiana | 410 | 808 | 166 | 43 | 1,384 | |||
| Kansas | 177 | 348 | 110 | 29 | 635 | |||
| Kentucky | 156 | 423 | 76 | 24 | 655 | |||
| Louisiana | 273 | 483 | 99 | 29 | 855 | |||
| Maryland | 228 | 571 | 102 | 43 | 901 | |||
| Massachusetts | 346 | 777 | 147 | 52 | 1,270 | |||
| Michigan | 587 | 1,177 | 185 | 60 | 1,949 | |||
| Minnesota | 343 | 760 | 175 | 50 | 1,278 | |||
| Mississippi | 208 | 395 | 84 | 25 | 687 | |||
| Missouri | 311 | 641 | 171 | 53 | 1,123 | |||
| Nebraska | 101 | 184 | 66 | 13 | 351 | |||
| Nevada | 49 | 110 | 17 | 6 | 176 | |||
| New Hampshire | 44 | 101 | 14 | 4 | 159 | |||
| New Jersey | 494 | 1,023 | 216 | 77 | 1,733 | |||
| New Mexico | 36 | 68 | 16 | 7 | 120 | |||
| New York | 950 | 2,141 | 459 | 157 | 3,550 | |||
| North Carolina | 375 | 939 | 188 | 79 | 1,502 | |||
| Ohio | 554 | 1,251 | 257 | 80 | 2,062 | |||
| Oklahoma | 183 | 402 | 101 | 26 | 686 | |||
| Oregon | 229 | 486 | 110 | 38 | 825 | |||
| Pennsylvania | 641 | 1,372 | 333 | 114 | 2,346 | |||
| Rhode Island | 48 | 122 | 22 | 7 | 192 | |||
| South Carolina | 240 | 481 | 63 | 31 | 784 | |||
| Tennessee | 230 | 567 | 157 | 53 | 954 | |||
| Texas | 1,060 | 2,081 | 339 | 118 | 3,480 | |||
| Utah | 149 | 177 | 31 | 7 | 357 | |||
| Virginia | 313 | 692 | 104 | 40 | 1,109 | |||
| Washington | 278 | 567 | 117 | 46 | 962 | |||
| West Virginia | 127 | 260 | 78 | 26 | 465 | |||
| Wisconsin | 214 | 540 | 97 | 39 | 851 | |||
| ME, VT | 121 | 259 | 35 | 12 | 415 | |||
| IA, ND, SD | 199 | 472 | 126 | 30 | 797 | |||
| AK, ID, MT, WY | 173 | 336 | 67 | 18 | 576 | |||
| United States | 14,654 | 31,050 | 6,291 | 2,069 | 51,995 | |||
| TABLE B-5. Unweighted Cell Counts by Age Tabulations of the 1993 SIPP for Selected Characteristics Unweighted Cell Counts by Age |
||||||||
|---|---|---|---|---|---|---|---|---|
| Family Income Less than 100% of Poverty Level | ||||||||
| <18 | 18-64 | 65+ | Total | |||||
| Alabama | 57 | 72 | 13 | 142 | ||||
| Arizona | 76 | 89 | 15 | 180 | ||||
| Arkansas | 41 | 62 | 12 | 115 | ||||
| California | 642 | 636 | 68 | 1,346 | ||||
| Colorado | 35 | 48 | 4 | 87 | ||||
| Connecticut | 31 | 37 | 11 | 79 | ||||
| Delaware | 11 | 15 | 5 | 31 | ||||
| District of Columbia | 14 | 14 | - | 28 | ||||
| Florida | 155 | 237 | 47 | 439 | ||||
| Georgia | 121 | 131 | 31 | 283 | ||||
| Hawaii | 4 | 4 | - | 8 | ||||
| Illinois | 139 | 137 | 34 | 310 | ||||
| Indiana | 103 | 91 | 16 | 210 | ||||
| Kansas | 35 | 40 | 10 | 85 | ||||
| Kentucky | 43 | 54 | 15 | 112 | ||||
| Louisiana | 90 | 106 | 16 | 212 | ||||
| Maryland | 24 | 43 | 6 | 73 | ||||
| Massachusetts | 85 | 105 | 20 | 210 | ||||
| Michigan | 132 | 142 | 16 | 290 | ||||
| Minnesota | 60 | 66 | 26 | 152 | ||||
| Mississippi | 68 | 81 | 23 | 172 | ||||
| Missouri | 67 | 69 | 24 | 160 | ||||
| Nebraska | 10 | 12 | 7 | 29 | ||||
| Nevada | 11 | 17 | - | 28 | ||||
| New Hampshire | 4 | 9 | 1 | 14 | ||||
| New Jersey | 103 | 120 | 23 | 246 | ||||
| New Mexico | 9 | 14 | - | 23 | ||||
| New York | 274 | 342 | 53 | 669 | ||||
| North Carolina | 81 | 96 | 35 | 212 | ||||
| Ohio | 117 | 136 | 28 | 281 | ||||
| Oklahoma | 61 | 73 | 14 | 148 | ||||
| Oregon | 56 | 62 | 14 | 132 | ||||
| Pennsylvania | 142 | 140 | 44 | 326 | ||||
| Rhode Island | 2 | 9 | 3 | 14 | ||||
| South Carolina | 74 | 75 | 16 | 165 | ||||
| Tennessee | 64 | 84 | 29 | 177 | ||||
| Texas | 368 | 398 | 58 | 824 | ||||
| Utah | 24 | 18 | 1 | 43 | ||||
| Virginia | 55 | 79 | 17 | 151 | ||||
| Washington | 69 | 85 | 8 | 162 | ||||
| West Virginia | 47 | 48 | 9 | 104 | ||||
| Wisconsin | 34 | 31 | 7 | 72 | ||||
| ME, VT | 18 | 35 | 2 | 55 | ||||
| IA, ND, SD | 35 | 48 | 6 | 89 | ||||
| AK, ID, MT, WY | 21 | 32 | 14 | 67 | ||||
| United States | 3,712 | 4,242 | 801 | 8,755 | ||||
| TABLE B-5. Unweighted Cell Counts by Age Tabulations of the 1993 SIPP for Selected Characteristics Unweighted Cell Counts by Age |
||||||||
|---|---|---|---|---|---|---|---|---|
| Persons Age 15+ Receiving AFDC, January | ||||||||
| <18 | 18-64 | 65+ | Total | |||||
| Alabama | - | 4 | - | 4 | ||||
| Arizona | - | 11 | - | 11 | ||||
| Arkansas | - | 5 | - | 5 | ||||
| California | 1 | 164 | 2 | 167 | ||||
| Colorado | - | 6 | - | 6 | ||||
| Connecticut | - | 11 | - | 11 | ||||
| Delaware | - | 5 | - | 5 | ||||
| District of Columbia | - | 6 | - | 6 | ||||
| Florida | - | 29 | - | 29 | ||||
| Georgia | - | 29 | - | 29 | ||||
| Hawaii | - | 1 | - | 1 | ||||
| Illinois | 1 | 34 | - | 35 | ||||
| Indiana | - | 20 | - | 20 | ||||
| Kansas | - | 3 | - | 3 | ||||
| Kentucky | - | 11 | - | 11 | ||||
| Louisiana | - | 16 | - | 16 | ||||
| Maryland | - | 8 | - | 8 | ||||
| Massachusetts | - | 30 | - | 30 | ||||
| Michigan | - | 51 | - | 51 | ||||
| Minnesota | - | 17 | - | 17 | ||||
| Mississippi | 1 | 10 | - | 11 | ||||
| Missouri | - | 13 | - | 13 | ||||
| Nebraska | - | 1 | - | 1 | ||||
| Nevada | - | 2 | - | 2 | ||||
| New Hampshire | - | 23 | - | 23 | ||||
| New Jersey | 1 | - | - | 1 | ||||
| New Mexico | - | 69 | 1 | 70 | ||||
| New York | 1 | 18 | - | 19 | ||||
| North Carolina | 2 | 32 | - | 34 | ||||
| Ohio | - | 9 | - | 9 | ||||
| Oklahoma | - | 12 | 1 | 13 | ||||
| Oregon | 1 | 25 | 1 | 27 | ||||
| Pennsylvania | - | 2 | - | 2 | ||||
| Rhode Island | - | 14 | - | 14 | ||||
| South Carolina | - | 16 | - | 16 | ||||
| Tennessee | - | 38 | - | 38 | ||||
| Texas | - | 2 | - | 2 | ||||
| Utah | - | 7 | 1 | 8 | ||||
| Virginia | - | 15 | - | 15 | ||||
| Washington | - | 9 | - | 9 | ||||
| West Virginia | - | 10 | - | 10 | ||||
| Wisconsin | - | 11 | - | 11 | ||||
| ME, VT | - | 10 | - | 10 | ||||
| IA, ND, SD | 1 | 5 | - | 6 | ||||
| AK, ID, MT, WY | - | - | - | - | ||||
| United States | 9 | 814 | 6 | 829 | ||||
| TABLE B-5. Unweighted Cell Counts by Age Tabulations of the 1993 SIPP for Selected Characteristics Unweighted Cell Counts by Age |
||||||||
|---|---|---|---|---|---|---|---|---|
| All Persons Receiving AFDC, January | ||||||||
| <18 | 18-64 | 65+ | Total | |||||
| Alabama | 5 | 4 | - | 9 | ||||
| Arizona | 25 | 11 | - | 36 | ||||
| Arkansas | 12 | 7 | - | 19 | ||||
| California | 390 | 214 | 4 | 608 | ||||
| Colorado | 15 | 6 | - | 21 | ||||
| Connecticut | 18 | 11 | - | 29 | ||||
| Delaware | 9 | 6 | - | 15 | ||||
| District of Columbia | 10 | 7 | - | 17 | ||||
| Florida | 63 | 33 | - | 96 | ||||
| Georgia | 61 | 31 | - | 92 | ||||
| Hawaii | 1 | 2 | - | 3 | ||||
| Illinois | 84 | 36 | - | 120 | ||||
| Indiana | 57 | 22 | - | 79 | ||||
| Kansas | 7 | 3 | - | 10 | ||||
| Kentucky | 17 | 12 | - | 29 | ||||
| Louisiana | 29 | 18 | - | 47 | ||||
| Maryland | 11 | 10 | - | 21 | ||||
| Massachusetts | 62 | 34 | - | 96 | ||||
| Michigan | 96 | 61 | - | 157 | ||||
| Minnesota | 38 | 21 | - | 59 | ||||
| Mississippi | 26 | 11 | - | 37 | ||||
| Missouri | 35 | 15 | - | 50 | ||||
| Nebraska | 2 | 1 | - | 3 | ||||
| Nevada | 3 | 2 | - | 5 | ||||
| New Hampshire | 60 | 25 | - | 85 | ||||
| New Jersey | 2 | - | - | 2 | ||||
| New Mexico | 135 | 87 | 1 | 223 | ||||
| New York | 39 | 19 | - | 58 | ||||
| North Carolina | 71 | 36 | - | 107 | ||||
| Ohio | 18 | 9 | - | 27 | ||||
| Oklahoma | 25 | 16 | 1 | 42 | ||||
| Oregon | 59 | 29 | 1 | 89 | ||||
| Pennsylvania | 3 | 2 | - | 5 | ||||
| Rhode Island | 25 | 16 | - | 41 | ||||
| South Carolina | 35 | 16 | - | 51 | ||||
| Tennessee | 85 | 41 | - | 126 | ||||
| Texas | 8 | 4 | - | 12 | ||||
| Utah | 12 | 7 | 1 | 20 | ||||
| Virginia | 26 | 18 | - | 44 | ||||
| Washington | 22 | 10 | - | 32 | ||||
| West Virginia | 24 | 11 | - | 35 | ||||
| Wisconsin | 19 | 14 | - | 33 | ||||
| ME, VT | 19 | 15 | - | 34 | ||||
| IA, ND, SD | 11 | 6 | - | 17 | ||||
| AK, ID, MT, WY | - | - | - | - | ||||
| United States | 1,774 | 959 | 8 | 2,741 | ||||
| TABLE B-5. Unweighted Cell Counts by Age Tabulations of the 1993 SIPP for Selected Characteristics Unweighted Cell Counts by Age |
||||||||
|---|---|---|---|---|---|---|---|---|
| Employer Provided Health Insurance, January | ||||||||
| <18 | 18-64 | 65+ | Total | |||||
| Alabama | 84 | 289 | 40 | 413 | ||||
| Arizona | 108 | 270 | 41 | 419 | ||||
| Arkansas | 54 | 123 | 19 | 196 | ||||
| California | 858 | 2,115 | 233 | 3,206 | ||||
| Colorado | 106 | 254 | 17 | 377 | ||||
| Connecticut | 97 | 290 | 45 | 432 | ||||
| Delaware | 30 | 90 | 15 | 135 | ||||
| District of Columbia | 9 | 40 | 9 | 58 | ||||
| Florida | 311 | 888 | 127 | 1,326 | ||||
| Georgia | 232 | 516 | 37 | 785 | ||||
| Hawaii | 31 | 83 | 20 | 134 | ||||
| Illinois | 508 | 1,135 | 120 | 1,763 | ||||
| Indiana | 237 | 548 | 69 | 854 | ||||
| Kansas | 87 | 202 | 23 | 312 | ||||
| Kentucky | 95 | 268 | 31 | 394 | ||||
| Louisiana | 139 | 259 | 28 | 426 | ||||
| Maryland | 164 | 418 | 63 | 645 | ||||
| Massachusetts | 235 | 584 | 57 | 876 | ||||
| Michigan | 386 | 854 | 100 | 1,340 | ||||
| Minnesota | 250 | 559 | 53 | 862 | ||||
| Mississippi | 77 | 216 | 13 | 306 | ||||
| Missouri | 192 | 448 | 60 | 700 | ||||
| Nebraska | 55 | 114 | 17 | 186 | ||||
| Nevada | 26 | 64 | 3 | 93 | ||||
| New Hampshire | 35 | 68 | 8 | 111 | ||||
| New Jersey | 308 | 720 | 85 | 1,113 | ||||
| New Mexico | 19 | 45 | 8 | 72 | ||||
| New York | 522 | 1,406 | 228 | 2,156 | ||||
| North Carolina | 216 | 638 | 67 | 921 | ||||
| Ohio | 361 | 912 | 122 | 1,395 | ||||
| Oklahoma | 104 | 258 | 30 | 392 | ||||
| Oregon | 137 | 318 | 48 | 503 | ||||
| Pennsylvania | 407 | 1,003 | 162 | 1,572 | ||||
| Rhode Island | 36 | 92 | 7 | 135 | ||||
| South Carolina | 137 | 334 | 26 | 497 | ||||
| Tennessee | 123 | 347 | 49 | 519 | ||||
| Texas | 529 | 1,233 | 122 | 1,884 | ||||
| Utah | 106 | 130 | 14 | 250 | ||||
| Virginia | 177 | 447 | 49 | 673 | ||||
| Washington | 161 | 367 | 42 | 570 | ||||
| West Virginia | 61 | 152 | 34 | 247 | ||||
| Wisconsin | 160 | 387 | 37 | 584 | ||||
| ME, VT | 74 | 170 | 13 | 257 | ||||
| IA, ND, SD | 127 | 316 | 37 | 480 | ||||
| AK, ID, MT, WY | 105 | 218 | 19 | 342 | ||||
| United States | 8,276 | 20,188 | 2,447 | 30,911 | ||||
| TABLE B-5. Unweighted Cell Counts by Age Tabulations of the 1993 SIPP for Selected Characteristics Unweighted Cell Counts by Age |
||||||||
|---|---|---|---|---|---|---|---|---|
| Work Disability, January | ||||||||
| <18 | 18-64 | 65-69 | Total | |||||
| Alabama | 4 | 42 | 12 | 58 | ||||
| Arizona | 1 | 49 | 7 | 57 | ||||
| Arkansas | - | 42 | 3 | 45 | ||||
| California | 5 | 363 | 54 | 422 | ||||
| Colorado | - | 48 | 10 | 58 | ||||
| Connecticut | 2 | 25 | 4 | 31 | ||||
| Delaware | - | 8 | 2 | 10 | ||||
| District of Columbia | 1 | 12 | 1 | 14 | ||||
| Florida | 3 | 152 | 30 | 185 | ||||
| Georgia | 4 | 113 | 20 | 137 | ||||
| Hawaii | - | 7 | 1 | 8 | ||||
| Illinois | 5 | 113 | 10 | 128 | ||||
| Indiana | 2 | 61 | 9 | 72 | ||||
| Kansas | 2 | 23 | 7 | 32 | ||||
| Kentucky | 1 | 51 | 10 | 62 | ||||
| Louisiana | 3 | 79 | 11 | 93 | ||||
| Maryland | - | 43 | 11 | 54 | ||||
| Massachusetts | - | 64 | 10 | 74 | ||||
| Michigan | 6 | 119 | 15 | 140 | ||||
| Minnesota | 1 | 75 | 12 | 88 | ||||
| Mississippi | 1 | 55 | 9 | 65 | ||||
| Missouri | 5 | 64 | 24 | 93 | ||||
| Nebraska | - | 9 | 2 | 11 | ||||
| Nevada | 1 | 8 | 2 | 11 | ||||
| New Hampshire | 1 | 5 | - | 6 | ||||
| New Jersey | 1 | 72 | 13 | 86 | ||||
| New Mexico | 2 | 7 | 2 | 11 | ||||
| New York | 5 | 182 | 27 | 214 | ||||
| North Carolina | 1 | 107 | 23 | 131 | ||||
| Ohio | 3 | 158 | 17 | 178 | ||||
| Oklahoma | 1 | 47 | 11 | 59 | ||||
| Oregon | - | 64 | 13 | 77 | ||||
| Pennsylvania | 2 | 126 | 37 | 165 | ||||
| Rhode Island | - | 22 | 1 | 23 | ||||
| South Carolina | - | 54 | 10 | 64 | ||||
| Tennessee | 2 | 94 | 25 | 121 | ||||
| Texas | 3 | 177 | 36 | 216 | ||||
| Utah | 1 | 22 | 1 | 24 | ||||
| Virginia | - | 57 | 13 | 70 | ||||
| Washington | 2 | 67 | 14 | 83 | ||||
| West Virginia | 2 | 32 | 9 | 43 | ||||
| Wisconsin | - | 58 | 10 | 68 | ||||
| ME, VT | - | 22 | 2 | 24 | ||||
| IA, ND, SD | 1 | 49 | 7 | 57 | ||||
| AK, ID, MT, WY | 1 | 37 | 6 | 11 | ||||
| United States | 75 | 3,084 | 553 | 3,712 | ||||
| TABLE B-5. Unweighted Cell Counts by Age Tabulations of the 1993 SIPP for Selected Characteristics Unweighted Cell Counts by Age |
||||||||
|---|---|---|---|---|---|---|---|---|
| Persons Age 15+ Receiving AFDC, in 1 or more months | ||||||||
| <18 | 18-64 | 65+ | Total | |||||
| Alabama | - | 7 | - | 7 | ||||
| Arizona | - | 15 | - | 15 | ||||
| Arkansas | - | 7 | - | 7 | ||||
| California | 4 | 204 | 2 | 210 | ||||
| Colorado | - | 8 | - | 8 | ||||
| Connecticut | - | 13 | - | 13 | ||||
| Delaware | - | 5 | - | 5 | ||||
| District of Columbia | - | 6 | - | 6 | ||||
| Florida | - | 40 | - | 40 | ||||
| Georgia | - | 34 | 2 | 36 | ||||
| Hawaii | - | 2 | - | 2 | ||||
| Illinois | 1 | 48 | - | 49 | ||||
| Indiana | 2 | 28 | - | 30 | ||||
| Kansas | - | 7 | - | 7 | ||||
| Kentucky | - | 13 | - | 13 | ||||
| Louisiana | - | 18 | - | 18 | ||||
| Maryland | - | 15 | - | 15 | ||||
| Massachusetts | - | 35 | - | 35 | ||||
| Michigan | - | 65 | - | 65 | ||||
| Minnesota | - | 21 | - | 21 | ||||
| Mississippi | 1 | 10 | - | 11 | ||||
| Missouri | 1 | 19 | - | 20 | ||||
| Nebraska | - | 1 | - | 1 | ||||
| Nevada | - | 2 | - | 2 | ||||
| New Hampshire | - | 2 | - | 2 | ||||
| New Jersey | - | 27 | - | 27 | ||||
| New Mexico | 1 | 1 | - | 2 | ||||
| New York | - | 90 | 1 | 91 | ||||
| North Carolina | 3 | 25 | - | 28 | ||||
| Ohio | 2 | 38 | - | 40 | ||||
| Oklahoma | - | 11 | - | 11 | ||||
| Oregon | - | 17 | 1 | 18 | ||||
| Pennsylvania | 1 | 32 | 1 | 34 | ||||
| Rhode Island | - | 3 | - | 3 | ||||
| South Carolina | - | 20 | - | 20 | ||||
| Tennessee | - | 19 | - | 19 | ||||
| Texas | 1 | 63 | - | 64 | ||||
| Utah | - | 3 | - | 3 | ||||
| Virginia | - | 9 | 1 | 10 | ||||
| Washington | - | 26 | - | 26 | ||||
| West Virginia | - | 11 | - | 11 | ||||
| Wisconsin | - | 12 | - | 12 | ||||
| ME, VT | - | 12 | - | 12 | ||||
| IA, ND, SD | - | 15 | - | 15 | ||||
| AK, ID, MT, WY | 2 | 6 | - | 8 | ||||
| United States | 19 | 1,065 | 8 | 1,092 | ||||
| TABLE B-5. Unweighted Cell Counts by Age Tabulations of the 1993 SIPP for Selected Characteristics Unweighted Cell Counts by Age |
||||||||
|---|---|---|---|---|---|---|---|---|
| All Persons Receiving AFDC, in 1 or more months | ||||||||
| <18 | 18-64 | 65+ | Total | |||||
| Alabama | 8 | 7 | - | 15 | ||||
| Arizona | 3 | 18 | - | 51 | ||||
| Arkansas | 16 | 10 | - | 26 | ||||
| California | 482 | 278 | 5 | 765 | ||||
| Colorado | 18 | 9 | - | 27 | ||||
| Connecticut | 24 | 13 | - | 37 | ||||
| Delaware | 11 | 6 | - | 17 | ||||
| District of Columbia | 10 | 7 | - | 17 | ||||
| Florida | 80 | 49 | - | 129 | ||||
| Georgia | 74 | 38 | 2 | 114 | ||||
| Hawaii | 4 | 10 | - | 14 | ||||
| Illinois | 112 | 56 | - | 168 | ||||
| Indiana | 71 | 31 | - | 102 | ||||
| Kansas | 17 | 8 | - | 25 | ||||
| Kentucky | 21 | 16 | - | 37 | ||||
| Louisiana | 39 | 21 | - | 60 | ||||
| Maryland | 20 | 20 | - | 40 | ||||
| Massachusetts | 74 | 40 | - | 114 | ||||
| Michigan | 120 | 76 | - | 196 | ||||
| Minnesota | 43 | 28 | - | 71 | ||||
| Mississippi | 30 | 12 | - | 42 | ||||
| Missouri | 47 | 21 | - | 68 | ||||
| Nebraska | 2 | 1 | - | 3 | ||||
| Nevada | 3 | 2 | - | 5 | ||||
| New Hampshire | 1 | 2 | - | 3 | ||||
| New Jersey | 68 | 32 | - | 100 | ||||
| New Mexico | 5 | 1 | - | 6 | ||||
| New York | 172 | 115 | 1 | 288 | ||||
| North Carolina | 56 | 27 | - | 83 | ||||
| Ohio | 79 | 44 | - | 123 | ||||
| Oklahoma | 28 | 13 | - | 41 | ||||
| Oregon | 31 | 22 | 1 | 54 | ||||
| Pennsylvania | 74 | 38 | 1 | 113 | ||||
| Rhode Island | 3 | 3 | - | 6 | ||||
| South Carolina | 38 | 23 | - | 61 | ||||
| Tennessee | 41 | 21 | - | 62 | ||||
| Texas | 138 | 79 | - | 217 | ||||
| Utah | 11 | 5 | - | 16 | ||||
| Virginia | 25 | 9 | 1 | 35 | ||||
| Washington | 47 | 33 | - | 80 | ||||
| West Virginia | 25 | 15 | - | 40 | ||||
| Wisconsin | 26 | 14 | - | 40 | ||||
| ME, VT | 21 | 14 | - | 35 | ||||
| IA, ND, SD | 25 | 21 | - | 46 | ||||
| AK, ID, MT, WY | 16 | 8 | - | 24 | ||||
| United States | 2,289 | 1,316 | 11 | 3,616 | ||||
| TABLE B-5. Unweighted Cell Counts by Age Tabulations of the 1993 SIPP for Selected Characteristics Unweighted Cell Counts by Age |
||||||||
|---|---|---|---|---|---|---|---|---|
| Employer Provided Health Insurance, in 1 or more months | ||||||||
| <18 | 18-64 | 65+ | Total | |||||
| Alabama | 114 | 346 | 51 | 511 | ||||
| Arizona | 131 | 324 | 56 | 511 | ||||
| Arkansas | 61 | 145 | 27 | 233 | ||||
| California | 1,027 | 2,556 | 302 | 3,885 | ||||
| Colorado | 116 | 300 | 21 | 437 | ||||
| Connecticut | 107 | 318 | 54 | 479 | ||||
| Delaware | 42 | 108 | 17 | 167 | ||||
| District of Columbia | 10 | 47 | 12 | 69 | ||||
| Florida | 396 | 1,055 | 159 | 1,610 | ||||
| Georgia | 286 | 628 | 49 | 963 | ||||
| Hawaii | 35 | 95 | 24 | 154 | ||||
| Illinois | 562 | 1,265 | 151 | 1,978 | ||||
| Indiana | 271 | 624 | 95 | 990 | ||||
| Kansas | 114 | 240 | 33 | 387 | ||||
| Kentucky | 109 | 318 | 36 | 463 | ||||
| Louisiana | 176 | 309 | 38 | 523 | ||||
| Maryland | 182 | 483 | 70 | 735 | ||||
| Massachusetts | 251 | 638 | 68 | 957 | ||||
| Michigan | 425 | 952 | 125 | 1,502 | ||||
| Minnesota | 260 | 610 | 57 | 927 | ||||
| Mississippi | 100 | 250 | 17 | 367 | ||||
| Missouri | 212 | 507 | 68 | 787 | ||||
| Nebraska | 78 | 145 | 20 | 243 | ||||
| Nevada | 33 | 81 | 5 | 119 | ||||
| New Hampshire | 35 | 77 | 10 | 122 | ||||
| New Jersey | 343 | 808 | 103 | 1,254 | ||||
| New Mexico | 19 | 47 | 11 | 77 | ||||
| New York | 595 | 1,587 | 265 | 2,447 | ||||
| North Carolina | 260 | 732 | 82 | 1,074 | ||||
| Ohio | 407 | 1,025 | 157 | 1,589 | ||||
| Oklahoma | 115 | 291 | 39 | 445 | ||||
| Oregon | 141 | 361 | 57 | 559 | ||||
| Pennsylvania | 446 | 1,112 | 188 | 1,746 | ||||
| Rhode Island | 38 | 102 | 7 | 147 | ||||
| South Carolina | 163 | 391 | 33 | 587 | ||||
| Tennessee | 138 | 394 | 55 | 587 | ||||
| Texas | 610 | 1,443 | 159 | 2,212 | ||||
| Utah | 115 | 142 | 18 | 275 | ||||
| Virginia | 217 | 517 | 57 | 791 | ||||
| Washington | 187 | 421 | 52 | 660 | ||||
| West Virginia | 69 | 171 | 36 | 276 | ||||
| Wisconsin | 169 | 447 | 43 | 659 | ||||
| ME, VT | 85 | 193 | 14 | 292 | ||||
| IA, ND, SD | 141 | 357 | 41 | 539 | ||||
| AK, ID, MT, WY | 134 | 255 | 20 | 409 | ||||
| United States | 9,525 | 23,217 | 3,002 | 35,744 | ||||
| TABLE B-5. Unweighted Cell Counts by Age Tabulations of the 1993 SIPP for Selected Characteristics Unweighted Cell Counts by Age |
||||||||
|---|---|---|---|---|---|---|---|---|
| Work Disability, in 1 or more months | ||||||||
| <18 | 18-64 | 65-69 | Total | |||||
| Alabama | 4 | 51 | 12 | 67 | ||||
| Arizona | 4 | 75 | 10 | 89 | ||||
| Arkansas | 1 | 52 | 5 | 58 | ||||
| California | 12 | 472 | 79 | 563 | ||||
| Colorado | 1 | 61 | 10 | 72 | ||||
| Connecticut | 3 | 38 | 5 | 46 | ||||
| Delaware | - | 11 | 5 | 16 | ||||
| District of Columbia | 1 | 13 | 2 | 16 | ||||
| Florida | 4 | 191 | 37 | 232 | ||||
| Georgia | 4 | 150 | 24 | 178 | ||||
| Hawaii | - | 9 | 2 | 11 | ||||
| Illinois | 11 | 148 | 14 | 173 | ||||
| Indiana | 3 | 85 | 13 | 101 | ||||
| Kansas | 2 | 33 | 9 | 44 | ||||
| Kentucky | 2 | 58 | 12 | 72 | ||||
| Louisiana | 3 | 100 | 13 | 116 | ||||
| Maryland | - | 56 | 15 | 71 | ||||
| Massachusetts | 1 | 86 | 12 | 99 | ||||
| Michigan | 7 | 149 | 18 | 174 | ||||
| Minnesota | 3 | 108 | 16 | 127 | ||||
| Mississippi | 2 | 66 | 9 | 77 | ||||
| Missouri | 7 | 91 | 25 | 123 | ||||
| Nebraska | 1 | 12 | 2 | 15 | ||||
| Nevada | 1 | 14 | 2 | 17 | ||||
| New Hampshire | 2 | 9 | - | 11 | ||||
| New Jersey | 2 | 103 | 18 | 123 | ||||
| New Mexico | 2 | 10 | 2 | 14 | ||||
| New York | 8 | 241 | 36 | 285 | ||||
| North Carolina | 1 | 128 | 31 | 160 | ||||
| Ohio | 6 | 197 | 22 | 225 | ||||
| Oklahoma | 4 | 64 | 14 | 82 | ||||
| Oregon | 2 | 93 | 15 | 110 | ||||
| Pennsylvania | 3 | 169 | 51 | 223 | ||||
| Rhode Island | - | 25 | 2 | 27 | ||||
| South Carolina | - | 69 | 12 | 81 | ||||
| Tennessee | 3 | 111 | 30 | 144 | ||||
| Texas | 5 | 256 | 49 | 310 | ||||
| Utah | 1 | 22 | 1 | 24 | ||||
| Virginia | - | 74 | 14 | 88 | ||||
| Washington | 5 | 94 | 18 | 117 | ||||
| West Virginia | 3 | 35 | 10 | 48 | ||||
| Wisconsin | 1 | 75 | 10 | 86 | ||||
| ME, VT | - | 30 | 4 | 34 | ||||
| IA, ND, SD | 1 | 65 | 40 | 76 | ||||
| AK, ID, MT, WY | 1 | 55 | 8 | 64 | ||||
| United States | 127 | 4,054 | 708 | 4,889 | ||||