
Cheryl l. Damberg, Melony E. Sorbero, Peter S. Hussey, Susan Lovejoy, hangsheng liu, and ateev mehrotra
WR-633-ASPE
February 2009
Assistant Secretary for Planning and Evaluation
U.S. Department of Health and Human Services
The report was prepared by the contractor (RAND). The findings and conclusions are those of the authors and do not necessarily reflect the views of ASPE or HHS.
ABSTRACT
This project is taking a building block approach to examine alternative episode definitions to better align performance measures, incentives, payments and accountability within Medicare fee-for service in the near term and examining options for moving toward broader episode-based reforms to encourage high quality, efficient and coordinated care. The episode is used as the unit of analysis. The project includes an environmental scan, a technical expert panel for review and input of deliverables in the project, analyses of grouped Medicare claims data using two commercial grouper software products and the development of a conceptual analytic piece.
This product is part of the RAND Health working paper series. RAND working papers are intended to share researchers’latest findings and to solicit informal peer review. They have been approved for circulation by RAND Health but have not been formally edited or peer reviewed. Unless otherwise indicated, working paper scan be quoted and cited without permission of the author, provided the source is clearly referred to as a working paper. RAND’s publications do not necessarily reflect the opinions of its research clients and sponsors. RAND® is a registered trademark.
Material contained in this publication is in the public domain and may be reproduced, fully or partially, without permission of the Federal Government. The courtesy of attribution is requested. The recommended citation follows:
Office of Health Policy, ASPE(2008) Exploring Episode-Based Approaches for Medicare Performance Measurement, Accountability and Payment. Washington, DC: U.S. Department of Health and Human Services, Office of the Assistant Secretary for Planning and Evaluation.
Executive Summary
Substantial deficits in the quality of health care and persistent and unsustainable growth in health care spending have led to calls for reform of the Medicare system, including such
steps as increasing performance accountability and making changes in payment policies (IOM, 2001; IOM 2006). Existing Medicare fee-for-service (FFS) performance measurement and payment policies focus on individual provider silos (e.g., provider types and settings of care). The separate performance measurement and payment systems for each provider type and setting are not aligned around or reflective of the continuum of care that a beneficiary receives within a given course of treatment or episode of care. Aligning performance measurement and financial incentives for service delivery around a beneficiary’s episode of care is one reform mechanism being considered in an effort to improve care delivery and coordination for the beneficiary and, in turn, to drive improvements in quality and the use of resources.
The Assistant Secretary for Planning and Evaluation (ASPE) contracted with RAND to explore how episodes of care could be defined for a limited set of clinical events/conditions and, based on varying definitions, to consider ways in which the alignment of performance measurement, accountability and incentives to providers could be improved within the current Medicare payment and performance measurement systems in the near term. RAND was also tasked to provide ASPE with options to consider in moving toward broader episode-based performance measurement and payment reforms to encourage high quality, efficient and coordinated care. A core piece of the work involved using two commercially available episode grouping software tools to construct episodes; the constructed episodes were then used to illustrate a variety of issues that would need to be considered in applying episodes as a basis for payment and/or performance measurement.
The project used a “building block” framework to examine the construction and application of episodes of care for similarly situated beneficiaries under Medicare FFS. For the purposes of this project, we define an episode of care as a series of health care services related to the treatment of a specific illness or injury. In the context of a building block approach, an episode of care could be constructed (1) narrowly to reflect the services delivered by one provider in a single setting for a specific illness or injury, (2) more broadly to reflect the services delivered in a single setting by multiple providers, such as the physician and the hospital during an inpatient stay, (3) very broadly to encompass the entire continuum of services received across multiple settings and providers for treatment/management of a specific condition, or (4) other variations along this continuum. The work included a review of the literature, discussions with experts, cataloging existing performance measurement and payment approaches used by Medicare, analyses of episodes constructed for nine clinical conditions for beneficiaries living in three states, a synthesis of findings and recommendations for future work. A panel of technical experts also provided comments on our analyses of episodes, and reviewed and commented on the final project report.
Existing Medicare Provider Payment Approaches
We catalogued the provider payment approaches used by Medicare as of 2008, which revealed two important issues of relevance to this project.
Separate Payment Mechanisms Do not Foster Coordination and Shared Accountabilities
Medicare uses separate payment mechanisms for each of its FFS provider settings and Medicare Advantage plans, and these payments are currently not aligned in ways that foster coordination, shared accountabilities, and delivery of high quality care. For the FFS program, Medicare predominantly uses prospective rate systems to pay providers, through which providers agree to accept as payment in full a predetermined amount for each separate billable Medicare covered product, service, admission or set of services. The amount of the base payment to a provider is based on a unit of service, which varies by type of provider. Typically, base payments are adjusted for patient characteristics, geographic factors, and in the case of physician payments, for practice expenses and professional liability costs. Payment rates for most settings are updated annually to account for changes in market conditions, technology or practice patterns.
Where Differential Payment Policies Exist, the Focus is on Reporting of Performance
Differential payments to providers currently reflect additional payments for reporting rather than actual performance. As of July 2008, Medicare had pay-for-reporting programs in place for the hospital inpatient, hospital outpatient, and home health settings; these programs require providers to voluntarily report on a defined set of performance measures or forego two percentage points of their annual payment update. Additionally, as part of FY 2008 IPPS hospital payment regulations, Medicare embedded quality performance in a limited fashion into its hospital reimbursement policy, by ruling that it would no longer reimburse hospitals for the additional costs associated with certain preventable conditions (CMS, 2007). The Medicare Physician Quality Reporting Initiative (PQRI), initiated under the Tax Relief and Health Care Act of 2006, provides a financial incentive (a bonus) of up to 2.0 percent of total allowed charges for covered Medicare physician fee schedule services to physicians who voluntarily report on a minimum of three clinical quality measures during the reporting period. The PQRI results are not made publicly available at this time, whereas the results of the hospital inpatient and the home health reporting programs are shared with consumers on the Medicare Compare websites. In the future, some or all of these programs may transition from pay-for-reporting to pay-for-performance programs, in which providers would be paid differentially based on actual performance rather than the reporting of measures.
Performance Measures Currently Reported to Medicare
We catalogued performance measures that are being reported to Medicare as of 2008, finding that Medicare is collecting a significant number of performance measures; however these efforts currently are single setting and provider focused and they emphasizes assessment of the provision of discrete services rather than the full spectrum of services within an episode for any given patient
Medicare Collects Quality Performance Data across Many Settings and Conditions
For the FFS program, Medicare currently collects data on quality measures for six different health care settings:
- Hospital inpatient,
- Hospital outpatient,
- Physicians/practitioners/therapists,
- Skilled nursing facilities (SNFs),
- Home health agencies (HHAs), and
- Dialysis facilities.
As previously described, four settings have financial incentives associated with the reporting of measures to CMS: (1) hospital inpatient, (2) hospital outpatient, (3) home health agencies, and (4) physicians. Public reporting of performance measures currently occurs for providers in four settings: (1) hospital inpatient, (2) HHAs, (3) SNFs, and (4) dialysis facilities.
There are 249 performance measures submitted to CMS in the six provider settings, and these measures cover 53 different clinical conditions/procedures as well as patient experience in the hospital setting, the presence of health information technology in physician offices, and some patient functional status measures that are not disease/condition specific for skilled nursing facilities and home health.
Medicare Measurement Efforts do not Address the Continuum of Care Delivered across an Entire Episode
Current health care quality measurement efforts focus on assessing care for individual indicators of performance for a patient with a specific clinical condition or set of risk factors at discrete points in time (e.g., percentage of patients with diabetes who received an HbA1c screening test or the percentage of women between the ages of 40-69 who received a mammogram). The measurement typically focuses on the actions of a single type of provider, such as the physician or the hospital, and emphasizes assessment of the provision of discrete services rather than the full spectrum of services within an episode for any given patient.
The existing Medicare performance reporting systems with their discrete service indicator focus, do little to address the continuum of a patient’s care across provider settings or to create reinforcing incentives and joint accountabilities among providers for the care delivered to patients. Only 10 clinical conditions are addressed by reporting programs for more than one setting. Three clinical conditions are included in programs for three settings: (1) acute myocardial infarction, (2) perioperative/surgical care, and (3) urinary incontinence. Seven conditions are included in programs for two settings: (1) back pain, (2) community acquired pneumonia, (3) depression, (4) end stage renal disease, (5) heart failure, (6) pain, and (7) prevention.
For the conditions addressed by more than one Medicare reporting program, the measures used do not fully permit the examination of the quality of care across a patient’s entire episode. There is little overlap in the conditions covered across the reporting programs and there is a lack of coordination of measures across settings when there are measures for the same condition. Across the various conditions, measures may address selected aspects of care in certain settings. Important performance measurement gaps exist when considering measurement using an episode of care framework for assessment. Key among the gaps are measures that directly assess care coordination or transitions of care from one setting to another—actions which are critical given that for most conditions, Medicare beneficiaries are being managed by multiple providers in multiple care settings.
Proposed Uses and Current Applications of Episodes of Care
We reviewed the empirical literature and held discussions with a small number of experts to identify what types of episodes of care or other groupings of related services have been used, tested, or proposed as a basis for performance measurement and accountability and/or payment. This review was used to inform our consideration and discussion of issues related to alternative approaches to defining an episode of care.
Our review finds that episodes of care, defined in a variety of ways, have been used or proposed for use as a unit of payment and as a unit of measurement to assess relative resource use and/or quality performance. Generally, the episode of care definitions that have been applied or tested tend to be narrow in scope—such as focusing on a single setting of care as is the case with DRG payments for an inpatient stay. An exception to this is the application of commercial episode grouper software tools that examine resource utilization across multiple settings and providers. The more recent policy literature discusses broader episode of care constructs for use in performance measurement, joint accountabilities, and payment, but there remains little detailed developmental work or actual testing of these broader episode constructions.
There is a lack of empirical work regarding how best to construct an episode for the various applications being considered, and what the potential ramifications are of various episode definitions. While not an exhaustive list, some of the unaddressed questions include: How should an episode of care be defined (how broad vs. how narrow) and would the definition vary depending on the particular application and/or type of condition? Which providers would be held accountable for an episode and how would these accountable groupings of providers be configured in a disconnected FFS environment? What types of case mix issues arise within episode of care applications, and how should differences in case mix be handled? What types of unintended consequences might occur and under which applications—such as skimping on care provided during an episode (which is reminiscent of concerns with capitation payment arrangements), the potential for gaming to maximize reimbursement (e.g. upcoding diagnoses to place patient in an episode with better reimbursement, reminiscent of concerns with certain DRGs or modifying coding or service delivery practices to increase the number of episodes assigned to a patient)—and what types of control mechanisms need to be put in place to minimize the likelihood of unintended consequences occurring? How should financial incentives or bundled payments be allocated among various providers delivering services during an episode?
The Application of Episodes of Care
Episodes of Care for Performance Measurement
The use of episodes of care for quality measurement and accountability is mostly non-existent in practice, although it has been proposed and discussed in the literature as a strategy for reforming Medicare. There are a few cases where providers are being held accountable for what percentage of their patients with a particular condition received all recommended services under what is referred to as an “appropriate care” composite measure, such as for patients with diabetes (Health Partners, 2007) or for patients undergoing coronary artery bypass graft (CABG) surgery. However, these “bundled” measurement efforts generally are limited in scope to physicians providing care in a single care setting and do not cut across the trajectory of care to involve multiple care settings.
Aligning or coordinating condition-specific measurement efforts across different provider types and settings as a mechanism to enhance the care delivered during an episode of care has not been addressed in the literature or in practice. Hospitals have recognized, however, the importance of aligning hospital and physician measures to improve care delivered in a narrow inpatient episode (Damberg et al. 2007), which could occur even within the existing silo-based performance measurement framework that Medicare has in place through alignment and coordination of measurement across programmatic efforts.
The IOM has recommended the use of episode-based performance measurement in two recent reports (Institute of Medicine Committee on Redesigning Health Insurance Performance Measures, 2006; Institute of Medicine Committee on Redesigning Health Insurance Performance Measures, 2007), suggesting that currently available point-in-time quality measures could be aggregated to the episode level and then applied. The IOM also identified a number of measurement gaps associated with measuring care over the course of an episode, including care coordination and transitions across care settings, patient outcomes over time, and measures of the oversupply of services, and recommended using such measures in the future (Institute of Medicine Committee on Redesigning Health Insurance Performance Measures, 2006). Research suggests that improvements in care around patients transitioning from the hospital to the community could substantially reduce readmission rates (Coleman et al., 2006; Naylor and McCauley, 1999). Some progress has been made in recent years to develop measures to assess care coordination and transitions in care ( Institute of Medicine Committee on Redesigning Health Insurance Performance Measures, 2006). For example, as part of the 9th Scope of Work, Quality Improvement Organizations (QIOs) in 14 states will work to improve care coordination and transitions between settings for Medicare beneficiaries.
Some of the experts with whom we held discussions raised concerns about adequacy of currently available quality measures for episode-based approaches. However, others held the view that quality measurement could be improved for use in episode-based approaches, and felt that existing measures were adequate for initial steps towards episode-based approaches, citing the efforts of the NQF and others in developing measures to address current gaps. Experts also described a need for new data collection systems, such as clinical registries and electronic health records that would facilitate broader measurement efforts.
In contrast, measurement of resource utilization has been conducted using episodes of care as the unit of analysis and reporting (McGlynn et al., 2008). The past five years has seen increased use by commercial payers of software tools that measure resource use within an episode of care construct—mostly for profiling, but in some cases for establishing tiered insurance products. Testing work is being done to determine if such measures can be incorporated into pay-for-performance program. In the resource use measurement application, the episode is typically limited to care delivered in ambulatory care and inpatient settings (post-acute care typically is not considered as it is less common in the commercially-insured-aged population). CMS has also begun to explore the potential use of commercial episode grouper tools to profile physician resource use within the Medicare program. CMS has funded an array of projects which have considered or are examining how Medicare data is handled by commercial groupers, the underlying clinical logic of the groupers, and the construction and testing of resource use reports with physicians. The National Quality Forum (NQF) is currently examining the joint measurement of quality and cost using episodes of care as the basis of assessment (National Quality Forum, 2007).
Episodes of Care for Payment
Episodes of care have been used and proposed as a unit of payment for over 25 years; however, such applications have focused on narrow definitions of what constitutes an episode of care and have not considered definitions that more broadly encompass a larger piece of or the entirety of the patient’s care trajectory. Where episode-based payment approaches have been applied, they either have been limited to single settings (e.g., prospective DRG payments for hospital-based services related to an admission) or were tested within a limited scope of care delivery (e.g., Medicare Participating Heart Bypass Center Demonstration).
Key payment-related issues that surface in the conceptual discussions of episode-based payments include how to structure an episode-based payment and how to divide an episode-based payment among multiple providers who might be involved in delivering the care. Within the literature, proposals for structuring payments focus on withholding a portion of payments and adjusting the withheld amount retrospectively based on resource use and quality of care during an episode of care (Davis and Guterman, 2007; Pham and Ginsburg, 2007; Jencks and Dobson, 1985; Welch, 1989; Wennberg et al., 2007) similar to a pay-for-performance (P4P) approach, or alternatively, the payment amount for the episode of care could be set prospectively and adjusted based on the quality of care for the episode. Although withholds have been used to reward quality performance for discrete services and prospective payment has been used within a narrow DRG episode context (though not linked to quality performance), neither approach has been tested using a broad episode of care construct as the basis.
The literature also highlighted the challenge of how to divide a payment for a single episode of care, when multiple providers are involved in the management of the episode. Options discussed in the literature include allowing an entity that has been assigned accountability for the episode to determine their payment arrangements with other participating providers or paying each provider separately by dividing the payment according to a predetermined formula (e.g., based on current Medicare payment rates) (Davis and Guterman, 2007; Network for Regional Healthcare Improvement, 2007) .
Some proposals for episode-based payment reforms in the literature have considered using a “building block” approach. Such an approach might begin with adjustment of FFS payments (e.g., the application of a P4P financial incentive), which would require relatively minor changes to Medicare policy, then potentially move towards a prospective payment approach for episodes that involves larger reforms and modifications to current payment structures (e.g., Wennberg et al., 2007). In our discussions, the experts expressed support for such a “building block” approach; however, many stated that significant financial incentives, such as bundled payment, would ultimately be necessary to achieve significant results, although much more difficult to implement.
Types of Episode of Care Definitions that Have Been Proposed or Are in Use
A broad variety of episode definitions have been used in practice or proposed in the health policy literature. Episodes of care could be constructed in a variety of ways which could encompass different parts of the continuum of care. Conceptually, health care services could be aggregated into episodes along two dimensions:
- aggregating related services over time by the same provider, and
- aggregating related services over time that are delivered by different providers of care.
Types of Episode Constructions that Have Been Used
(1) Services Related to a Major Inpatient Procedure. This type of episode typically bundles together the inpatient and physician services payments related to a major procedure. We found four examples cited in the literature of the use of this type of episode construction for payment and in some cases for quality measurement for coronary artery bypass graft (CABG) surgery.
(2) Services Related to an Outpatient Procedure. In the Cataract Alternative Payment Demonstration, Medicare tested an episode-based payment for outpatient cataract surgery. The episode included physician and facility fees, intraocular lens costs, and selected pre- and postoperative tests. Payment rates were determined by competitive bidding. Participation was very low, and the demonstration produced a low level of savings compared to the Participating Heart Bypass Center Demonstration, with little impact on utilization or patient outcomes (Abt Associates Inc., 1997).
(3) Contact Capitation for Specialists. This episode definition, used for payment, included specialist physician services related to treatment of a particular condition, and in some cases hospital and/or ancillary services (Frank and Roeder, 1999). Under this type of episode, the episode begins with the referral to the specialist and ends after a specified time or clinical endpoint. This payment arrangement was found to be common among large Independent Practice Associations (IPAs) in the late 1990s (Robinson, 1999); however, the system proved to be administratively complex (Frank and Roeder, 1999).
While various types of episode construction have been discussed, relatively few examples exist for how each type has been applied. The findings from the various applications of episodes suggest that the potential for using episodes and achieving the goals of episode-based payment and performance measurement will likely vary depending not only on how the episode is constructed, but also on implementation issues, such as participation rates in efforts making use of episodes.
Types of Episode Constructions that Have Been Proposed for Use
(1) Services Related to a Hospitalization. Several proposals in the literature have focused on constructing episodes of care related to a hospitalization. In many approaches in the literature, the episode would include related care provided during a post-discharge time period, potentially including post-acute institutional, home health care, and follow-up medical and therapy services. The earlier proposals, starting before the implementation of IPPS, focused on payment only. More recently, the proposals have also included a focus on performance measurement.
(2) Preventive Care or Primary Care Episodes. Several recent articles included proposals to create episodes of care covering preventive care or primary care only, excluding specialty care, hospital care, ancillaries, etc., with the episode capturing up to a year of time (Goroll et al., 2007; Network for Regional Healthcare Improvement, 2007; Pham and Ginsburg, 2007) . To qualify for the payment, providers may be required to demonstrate that they meet criteria for an “advanced medical home.”
(3) Chronic Care Episodes. Several articles proposed bundling together services related to the management of chronic conditions, including services provided by the physician managing the condition and possibly diagnostic tests, with general primary care physician services, specialists, hospital care, long-term care, etc. paid separately (Berenson, 2007; Davis and Guterman, 2007; Network for Regional Healthcare Improvement, 2007) . An existing example is the Medicare payment of physicians for management of end-stage renal disease (ESRD) (Leavitt, 2008).
(4) Broader Definitions of Episodes. Several articles have proposed using broader definitions of episodes of care to bundle together all services related to a particular condition for the purposes of performance measurement and/or payment (U. S. Office of Technology Assessment, 1986; Davis and Guterman, 2007; Pham and Ginsburg, 2007) . Two proprietary episode “grouper” software programs, the Symmetry Episode Treatment Groups (ETGs) and the Thomson-Medstat Medical Episode Groups (MEGs), bundle claims into episodes based on procedure and/or diagnosis codes. However, a recent review found little published literature on the clinical validity of the groupers (McGlynn et al., 2008). CMS has funded a study to study the clinical validity but the study is still ongoing. Current applications using a broader episode definition have focused on profiling physicians on their relative resource use applying the commercially available grouper tools.
(5) Prometheus Payment Model Approach. The Prometheus Payment program, which has been conceptualized but not yet tested, proposes to base payment and performance measurement on episodes defined using diagnoses and clinical practice guidelines for appropriate services. The program proposes to develop an evidence-informed case rate (ECR), which would be a single, risk-adjusted, prospective (or retrospective) payment given to providers across inpatient and outpatient settings to care for a patient diagnosed with a specific condition—in effect the defined “episode” under this model. Payment amounts would be based on the resources required to provide care as recommended in well-accepted clinical guidelines. This model calls for a portion of the payment to be withheld and re-distributed based on provider performance on measures of clinical process, outcomes of care, and patient experience with care received (de Brantes and Camillus, 2007).
We discussed with the experts their views on the pros and cons of different episode definitions. Most experts professed a strong preference for episodes that cut across multiple settings because of the incentives created for care coordination. A particular concern flagged by many experts was how to approach complex patients with multiple chronic conditions, who represent a high proportion of Medicare costs. Many experts doubted whether episodes focusing on each disease separately were appropriate for these patients, who may be better managed using a more holistic approach. Alternative approaches for handling complex patients with multiple conditions included medical homes or other arrangements, in which an organization accepted accountability for performance and a care coordination payment, capitation payment, or other payment for management of multiple conditions.
Attributing Episodes of Care to Providers
A critical issue when measuring clinical performance and resource utilization is assigning responsibility (also called “attribution”) for the services or set of services that are or are not provided to a beneficiary. The building block approach, which illustrates that an episode can be constructed and used in various ways, implies different issues related to attribution.
An episode-based approach that cuts across the continuum of care would require that accountability for the episode to be assigned to an entity or group of entities. The accountable entities would then assume responsibility for performance (i.e., quality and/or resource use pertaining to the full set of services provided (or not provided) during the episode). Accountability could be reinforced in a range of ways, including, but not limited to, measurement and providing feedback to providers on performance and resource use for episodes of care, public reporting of performance results within an episode of care construct, financial incentives for performance and/or resource use for episodes of care, or episode-based payment adjusted for performance.
In reviewing the literature, we sought to understand how attribution has been addressed either in practice or in concept within the area of performance measurement. Some of the approaches focused on assigning accountability to a single entity, while other approaches jointly attributed an episode to multiple entities. Depending on how an episode of care is defined, the accountable entities accountability could be individual providers, integrated provider groups such as physician group practices or integrated delivery systems, or “virtual groups” of providers that create a formal relationship for the purposes of episode-based payment and/or performance measurement (Davis and Guterman, 2007). A paper by Fisher et al. (2006) calls for the construction of Accountable Care Organizations (ACOs) by defining virtual groups that comprise physicians and the hospitals where they work or admit their patients; the researchers assert that this approach is feasible because Medicare beneficiaries receive most of their care from relatively coherent local delivery systems. Some of the experts interviewed favored beginning by allowing integrated provider groups to accept accountability for episodes, while others expressed concerns that such an arrangement would reward existing organizational structures; instead allowing attribution to virtual groups would foster more innovation in health care delivery and may move providers towards forming more cohesive group arrangements.
Specific entities that have been used or proposed as the basis of attribution include:
- Individual physician(s). Commonly proposed criteria for assigning responsibility to an individual physician include a count of Evaluation and Management (E&M) visits or costs, physician specialty type, or some combination thereof (CCHRI, 2008).
- Individual physician – hospital care only. One approach that has been tested is to attribute acute inpatient episodes to the attending physician for the hospitalization.
- Hospitals. Another strategy is to hold hospitals accountable for episodes of care that include a hospitalization in addition to physician services and/or services from other providers, such as skilled nursing facilities (Jencks and Dobson, 1985; Welch, 1989) .
- Integrated Delivery Systems and Physician Group Practices. Existing integrated provider organizations are likely to have the greatest ability to assume responsibility for episodes of care because of the defined relationships between providers (Davis and Guterman, 2007; MedPAC, 2007a; MedPAC, 2007b; MedPAC, 2007c) .
- Hospital medical staff. This model would assign accountability for acute care episodes to the entire medical staff of a hospital (holding the hospital accountable as well).
- Virtual Groups. Some have suggested the possibility of using virtual groups – that is, groups defined by geographic areas or other characteristics primarily for the purposes of episode-based performance measurement or payment (Davis and Guterman, 2007).
Assignments could be made prospectively or retrospectively under any of these scenarios. Prospective designation allows for some choice by physicians and patients about which providers should be responsible for which patients’ episodes of care (Davis, 2007; Pham, Schrag et al., 2007), but it also creates the possibility of risk selection (i.e., incentivizing providers to assume accountability for healthier, more-profitable patients). Prospective designation is easier in environments, such as managed care plans, where patients are already assigned to primary care physicians (PCPs). In a FFS environment, when patients may use multiple PCPs, the assignment could prove more challenging. Retrospective attribution is methodologically challenging because physicians frequently bill under multiple tax identifiers and these tax identifiers may be at a group level thereby precluding attribution to a specific physician.
Both approaches to attribution raise policy considerations because different assignment methods can lead to substantially different results on various criteria. In a previous study, RAND found significant variation in both the fraction of episodes that could be assigned to a physician and the level of agreement to which a physician was held responsible. RAND researchers (Mehrotra et al., 2007) examined 13 retrospective assignment rules in assigning episodes of resource utilization constructed from Symmetry’s ETG tool. This study applied the assignment rules against an aggregated claims database from four commercial health plans in Massachusetts . The 13 rules differed on characteristics such as the basis of assignment (e.g. costs versus visits) and whether only one or multiple physicians were assigned to an episode. Comparing the results of two different rules found that 50 percent of the episodes were assigned to different physicians, illustrating that different assignment methods using different criteria can lead to substantially different results regarding which provider would be held responsible.
When accountability is assigned to individual physicians, small sample sizes could lead to substantial risk for costs and/or quality outcomes given that the estimates of costs and performance based on a small number of cases will be noisy (i.e., highly variable)—which is one reason thaThe discussions with experts found sharp differences of opinion on the relative merits of these two approaches. Some experts strongly believed that providers would not “buy in” to episode-based approaches unless they had prospectively identified the patients/episodes for which they were accountable. Other experts expressed a concern that very few providers were organized into formally linked groups of providers to be able to accept accountability for episodes, and that strong incentives would be required to drive them to organize themselves to do so. Some experts expressed doubt that many providers would voluntarily accept accountability for episodes.t Fisher et al. (2006) recommended assigning accountability to larger units. However, the risk would also depend on the variability of the outcome in question and potential safeguards against risk that could be used. Given the degree of dispersion of care across multiple providers for a typical Medicare beneficiary, fostering a sense of shared accountability across providers and settings for an episode of care may prove challenging. This may be particularly true whself as primarily responsible for delivering the recommended care (e.g., a cardiologist may not view her/himself as responsible for ensuring that a woman receives a mammogram).
Risk Adjustment of Episodes of Care for Payment and Performance Measurement
Most proposals in the literature acknowledge the need to risk-adjust (i.e., adojust for differences in patient populations across providers) episodes of cre for payment and some en a provider represents only a small fraction of all the care delivered and/or does not view her/himtypes of performance measurement, particularly for outcome measures. Hwever, little detail on the spaecific risk-adjusters that should be used is provided. Most of the experts also believed that risk adjustment is very important to episode-based approaches—whether the application is for payment or performance measurement. They felt that risk adjustment was necessary to prevent risk selection by providers and/or insurers.
The risk adjustment literature indicates the results of risk-adjustment are sensitive to the specific patient characteristics included and data sources used (Stuckenborg et al., 2007; Shahian et al., 2007). Some articles stated that when the focus is on cost/resource use, it is appropriate to use adjusters that explain variation in the time and costs of services provided (Goroll et al., 2007; Network for Regional Healthcare Improvement, 2007) , while in the context of performance measurement for intermediate and long-term outcomes of care, adjusters should focus on differences in the severity of illness. This suggests that two separate sets of risk adjustment may be required if jointly assessing episode-based clinical quality and resource use.
While there is general agreement about the use of risk-adjustment for payment and outcome measures, there is less of a consensus around its use for process of care measures. Some have argued that some process and intermediate outcome measures are influenced by disease severity as well as patient behavior, such as nonadherence, and that social, cultural, and economic factors influence decisions to seek care and to comply with recommended actions. Absent a method to address differences in the mix of patients treated across providers, this could create incentives for providers to avoid such patients ( Institute of Medicine Committee on Redesigning Health Insurance Performance Measures, 2007). However, the issue of risk adjustment needs to be carefully balanced against reducing incentives to providers to reduce health care disparities, which could occur if the risk model adjusts out the undesired variation (differences in care that could be influenced by provider behavior). The IOM identified risk adjustment and its appropriate use as an area requiring additional research in its report Rewarding Provider Performance (Institute of Medicine Committee on Redesigning Health Insurance Performance Measures, 2007). In our discussions, many of the experts emphasized the difficulty of risk adjustment for care provided over the course of an episode of care, often in multiple settings. For this reason, other methods for minimizing risk, such as special treatment of outliers, were identified as necessary by several experts.
Findings from Exploratory Analyses of Constructed Episodes
We conducted a series of analyses using episodes of care generated by two commercial episode groupers, Symmetry ETGs and Thomson MEGs to explore issues related to constructing and using episodes of care the purposes of measurement and aligning incentives to deliver high quality care. The study population for this work consisted of FFS beneficiaries who were continuously enrolled in Medicare from 2004-2006 and whose 2005 primary residence was in Florida , Oregon or Texas .
The episode groupers utilize the primary diagnosis on claim line items to create and place the line items into an episode. Only certain types of claims can start an episode such as an inpatient admission or an Evaluation and Management (E&M visit). Chronic condition episodes are predetermined to be of one-year duration. For other episodes that do not represent a chronic condition, they are defined by having a “clean period” during which no claims for that condition can appear before a new episode of the same type can start.
Our analyses focused on individuals with a diagnosis of one of nine clinical conditions that were purposively selected to illustrate various issues, such as discrete time-limited events that might entail fewer providers and/or settings, chronic conditions of long duration that might involve management by a broad collection of providers, and complex events that would likely entail care provided across an array of settings of care. The nine conditions were:
- Acute myocardial infarction
- Bacterial pneumonia
- Breast cancer
- Cerebrovascular disease
- Chronic obstructive pulmonary disease
- Congestive heart failure
- Diabetes
- Hip fracture
- Low back pain
For each individual with one of the nine clinical conditions, we categorized all of their episodes that were constructed by the grouper tools into those that were “related” to or “unrelated” to the condition for which they were selected. It should be noted that the results that we observed are, in part, related to how the episode grouper tools define what claims get assigned to an episode (i.e., the underlying grouper logic used to construct an episode) as well as variations in coding practices among providers in what diagnosis they code as primary versus secondary (and the completeness of this coding). The primary diagnosis drives the start of an episode of a particular type.
The key findings from our analyses are:
- Medicare Beneficiaries Have a Large Number of Different types of Episodes per Year: Beneficiaries with the nine conditions experienced an average of 10 episodes of any kind during the measurement year, most of which were not related to nine conditions of focus in this study. Many of the unrelated episodes were common among a large proportion of beneficiaries across the nine study conditions, such as hypertension, congestive heart failure, and fungal skin infections. The large number of episodes per beneficiary raises questions about the degree to which care for a particular beneficiary should be examine holistically, or alternatively split into small units of analysis. It is unclear whether physicians and other providers would view a beneficiary’s multiple episodes as defined in this study as distinct issues to be managed separately or as related issues to be managed jointly. If providers view certain episodes as related issues that should be managed jointly, (e.g. episodes of ischemic heart disease, hypertension, and hyperlipidemia), then it may be appropriate to expand episode definitions to group related conditions for some applications. One possibility would be to create bundles of episodes that commonly co-occur and are jointly managed. An issue that needs to be considered but which was not addressed in our analyses is whether the same provider would be attributed primary responsibility for multiple different episodes.
- Standardized Payments per Episode Varied Widely Across and Within the Nine Conditions. An inverse relationship was observed between standardized episode payments and the coefficient of variation, a measure that identifies the amount of variation in payments between episodes related to the same condition. Thus, there is wide variation in what is happening to patients within episodes of the same type that were constructed using commercially-available software grouper tools, suggesting a fair amount of heterogeneity in care practices and/or types of patients being treated. We used fairly broad groupings of patients based on the nine conditions. Heterogeneity might be reduced if subgroups of patients were created within a given condition. For example, instead of grouping together all diabetics, one could separate diabetics into categories based on the degree of advancement of their disease and other existing comorbidities to address differences in the management of these individuals. The amount of variation observed in the analyses suggests a need to understand the sources of variation in standardized payments, and which sources need to be accounted for in the episode construction or patient group creation versus sources of variation that could be reduced through the application of episodes for performance measurement or financial incentives.
Beneficiaries who experienced a greater total number of episodes (both related and unrelated to conditions of focus) had higher average standardized payments per episode and more providers involved in the delivery of care for each episode related to the conditions of focus. This finding highlights the need to consider not only risk-adjusting for the severity of the specific condition of focus, but also the other conditions experienced by the beneficiary.
- The Care Trajectory and Number of Settings Involved varies by Condition and within Episode Types. Across the nine conditions, there was no standard care pattern of the types of providers and settings involved for the related episodes; some conditions were more heavily focused on care delivered in an ambulatory setting, while others involved care delivered in ambulatory, hospital, and post-acute care settings. Even for patients with the same condition, there was substantial variation in the types of settings involved, and it is unclear how this variation in care trajectories would be affected if episode constructions within the same condition were less heterogeneous (i.e., creating more homogeneous subgroups of patients within an episode category). Often care cuts across three settings of care for any given condition and almost 60 percent of hip facture episodes involved more than four settings or provider types, highlighting the importance of care coordination among providers in different settings. During a single episode of care for a particular condition, the care provided was often dispersed among multiple specialists; however, for the nine conditions reviewed in this study, most involved a median of one primary care physician (PCP). These PCPs could potentially provide a foundation for coordinating the care for a beneficiary, if the PCP is also managing care for other episode types a beneficiary may experience. This study did not use a cross-condition approach to examine whether there were multiple PCPs involved in managing a beneficiary’s care across episode types; future work should explore whether there are multiple different PCPs involved in managing care across the entire set of episodes for any given Medicare beneficiary to ascertain whether a single PCP exists to coordinate care.
- Different methods for assigning responsibility for an episode (i.e., attribution) yielded different results. A significant fraction of episodes could be assigned to a provider for most of the attribution rules we tested. Variation was observed in the proportion of the episodes that could be assigned depending on the rule and the type of condition; some conditions are addressed primarily in an ambulatory setting, so facility-based attribution rules led to the assignment of a smaller share of episodes of these types. Depending on the condition, we observed that multiple providers delivered services in most episodes and that some providers represent only a small fraction of total episode payments. Therefore, it is often difficult to determine which provider or setting of care may have had the most responsibility for managing the care and resources within the episode. For example, for episodes where the majority of episode costs are facility costs, which physicians should be held accountable if one were to use a single attribution model? Should it be the physician who managed the patient in the facility or the physician who managed the physician prior to the admission or both? Further, should the facility also be accountable for the episode costs? While most methods of attribution rely on determining which physician may have had the most responsibility, some episodes were comprised primarily of facility costs and therefore it may be important to consider attribution to facilities or multiple attribution to providers and facilities. Given variation in the composition of provider types and settings and the extent of involvement of various providers in the management of episodes for different conditions, attribution rules may need to be tailored to the type of episode to ensure that the assignment aligns with provider roles and responsibilities in managing an episode. A single attribution approach for all types of episodes may not be appropriate. Attribution rules may need to vary depending on the manner in which the information is used and other policy considerations. For performance measurement, multiple attribution could serve to encourage joint responsibility and improvement among all. For resource utilization, the ambulatory physician who could prevent a hospital admission may be appropriate, while for bundling of payment, the entity or entities most able to manage the bulk of the dollars may be a more important consideration.
- State-level Variation Exists and Care within Episodes Cuts Across State Lines: There was variation across the three states in the average number of episodes per beneficiary, both overall and for the subset of beneficiaries with each of the nine conditions, the average standardized payments per episode, the involvement of different post-acute care providers, and the percent of episodes for which beneficiaries received care outside of their state of residence. The mean number of total episodes of all types per beneficiary varied widely among the three states in our analysis, averaging 6.1 episodes per beneficiary in Oregon , 6.9 in Texas and 8.0 in Florida . Average 2005 per-capita payments were highest in Florida and Texas and substantially lower in Oregon . The average standardized payment per episode for the episodes related to the nine conditions varied in a consistent pattern across the nine conditions, with Oregon showing consistently lower average per-episode payments as compared to Florida or Texas . The reasons behind the observed geographic variations in per episode payments and frequency of episodes are unclear and likely reflect several sources of variation, including variations in the care management practices of providers, differences in the availability of and types of providers across health markets, and/or differences in the underlying health status of Medicare beneficiaries in the three states. For example, inpatient rehabilitation facility (IRF) care was more common for episodes in Texas , where these types of facilities are relatively numerous, use of SNFs was more common in Oregon and Florida . A better understanding of the sources of variation could inform the future development of episode-based approaches to quality measurement and payment.
Potential Applications of Episodes of Care Along a Continuum of Policy Reform Options
There are a number of ways in which episode-of-care based approaches to performance measurement and payment potentially could be incorporated into Medicare—in the near term within existing Medicare payment and program structures as well as over a longer period of time, by building capacity and through reform of existing structures. Although not an exhaustive list, we present some options for consideration:
- Near Term Applications of Episodes of Care
- Adopt a holistic, patient-based approach to measuring performance. In the near term, there are multiple adjustments that could be made to Medicare’s existing performance measurement systems to create a more holistic, patient-based approach to performance measurement. Specific actions could include:
- (1) Build out Medicare’s performance measures to cover the entire care trajectory for patients with specific conditions as they move across provider settings (i.e., this moves measurement away from an individual setting focus to one that follows the patient as he/she is being managed across various care settings and encompasses the full range of care a patient with a given condition might receive). The investments that CMS is making in measure development over the next five years will make an important contribution to filling existing gaps and aligning measures across settings to enable an episodic approach to measurement; as this work progresses, CMS could consider an episode construct as a way to frame decisions about where to invest its measure development resources. Additionally, CMS could work to construct and add measures that address care transitions in the near term as a means to encourage greater coordination among various providers across a patient’s episode, leveraging the work that is starting under the 9th Scope of Work for the QIOs.
- (2) Coordinate and align measurements both within and across settings for management of the same condition (in the building block approach this would include aligning measurement accountabilities for the physician(s) and hospital for an inpatient admission, and more broadly to encompass all providers and settings that are involved in care for a given episode)
- (3) Integrate measures to address care trajectories for patients with multiple conditions to create a more holistic approach to care management. For example, ischemic heart disease is a highly prevalent condition among Medicare beneficiaries, which typically involves managing a cluster of issues/events such as hypertension, lipid levels, cerebrovascular disease, heart failure, and heart attack.
- (4) Bundle measures within an episode framework for a given clinical condition, so that patients and their providers can understand what appropriate care represents across an entire episode of care. Condition specific measure maps that cut across settings would make it explicit to providers what their designated role is in affecting the quality of care for patients with particular conditions. To achieve maximum impact in the near term, the measure development and integration work could start by focusing on those clinical conditions that represent the greatest volume and/or costs to the Medicare program. For example, although osteoarthritis and sepsis were among the ten most expensive conditions in the hospital for Medicare beneficiaries in 2005 (AHRQ, 2007), there are no hospital measures currently reported for these conditions.
- (1) Build out Medicare’s performance measures to cover the entire care trajectory for patients with specific conditions as they move across provider settings (i.e., this moves measurement away from an individual setting focus to one that follows the patient as he/she is being managed across various care settings and encompasses the full range of care a patient with a given condition might receive). The investments that CMS is making in measure development over the next five years will make an important contribution to filling existing gaps and aligning measures across settings to enable an episodic approach to measurement; as this work progresses, CMS could consider an episode construct as a way to frame decisions about where to invest its measure development resources. Additionally, CMS could work to construct and add measures that address care transitions in the near term as a means to encourage greater coordination among various providers across a patient’s episode, leveraging the work that is starting under the 9th Scope of Work for the QIOs.
- Measure the totality of care delivered within an episode and provide this feedback to all providers who touched the patient within the episode. Today, when measured, providers see only their particular slice of the “whole,” and what is missing is the full picture of how the patient is managed during an episode. In the near term, CMS may want to experiment with a small number of conditions where measures currently exist to test the feasibility of such an approach and to flag gaps in measures across the various settings where care is being delivered. At the beginning, CMS could adopt a building block approach to this work, such as by providing feedback to both the hospital and physicians within a narrowly defined hospital admission or by providing feedback to ambulatory care physicians and hospitals who are involved in care related to a hospital admission. Then over a longer period, as Medicare builds out its capacity to measure care more broadly to address an array of conditions across settings and works to coordinate those measurement efforts across settings, it could expand the set of conditions for which it could assess care over a broader episode construct. The long term goal would be to develop and provide a feedback report that would encompass the totality of care processes that should occur in managing a patient’s condition across an entire episode and highlight for all providers involved how well a patient was managed. Initially, this feedback could be done confidentially and provide comparisons to how patients with similar care trajectories are being managed in the broader community. This internal feedback would highlight variations in practice and could stimulate a discussion among providers about ways to improve quality through better care coordination, enhanced system integration, and sharing of best practices. Such information could also stimulate the formation of more explicit relationships among providers for improved coordination and care management.
- Implement performance-based financial incentives (i.e., pay-for-performance) within Medicare for individual provider types and/or settings that include measures of care transition and coordination. Medicare could create setting specific P4P programs that include a focus on care coordination and care transitions between settings. Such programs could use existing measures as a foundation, with additional measures of coordination and transition added as they are developed. This approach does not have any requirements for the types of provider organizational structures that could participate, so could be implemented in the current FFS provider structure.
- Adopt a holistic, patient-based approach to measuring performance. In the near term, there are multiple adjustments that could be made to Medicare’s existing performance measurement systems to create a more holistic, patient-based approach to performance measurement. Specific actions could include:
- Mid-Term Applications of Episodes of Care
- Educate Medicare beneficiaries about consensus-based “right care” pathways in management of conditions. Patients and their families can be advocates to ensure that the right care is delivered. CMS is investing considerable resources over the next five years to increase the number of performance measures that are available to assess the quality of care across a larger number of conditions, provider types, and settings of care and make this information available to Medicare beneficiaries. As the capacity to identify what the right care looks like for an entire episode of care for a given clinical condition increases, such consensus-based information (i.e., “right care” maps) could be shared with patients and their family members to enable them to advocate for and hold the system accountable for delivering high-quality care.
- Create public accountability for performance by making results transparent. Medicare’s current public reporting efforts could be consolidated and synthesized to report on the quality of care delivered within an episode of care for patients with selected clinical conditions. Spotlighting the performance of virtual groupings of providers within a community that excel in delivering the right care to patients would strengthen signals to other providers to improve.
- Implement episode-based financial incentives (i.e., pay-for-performance) within Medicare, tying together two or more provider types and/or settings. To strengthen join accountability and care coordination, Medicare could tie a small proportion of payment to performance for care delivered across some portion (i.e., using a building block approach) or the entirety of an episode. Preceding this type of application, work would need to occur related to measure development and coordination, constructing an episode-based framework for performance measurement, and determining how accountabilities would be assigned. Aligning financial incentives along an episode-of-care construct could encourage providers to be more explicit about their relationships with each other and their respective roles in ensuring that the right care is delivered in a coordinated fashion.
- Share savings for delivery of care within an episode with groups of providers to incentivize efficiency and performance. This approach would assign accountability for episodes of care across a group of accountable providers. If a group met its quality and cost savings targets, a portion of savings between a benchmark spending level and actual spending would be shared with the accountable unit of providers. Again, this application could start using a building block approach, such as by grouping providers within the ambulatory setting, then linking ambulatory physicians to hospitals, and finally linking physicians delivering care within the hospital and the hospital. Additional work would need to occur to define virtual groups that could serve as the unit of accountability. Building joint accountabilities and shared savings into the Medicare program might encourage health care providers to organize into virtual or actual integrated delivery systems, which tend to be more advanced in their use of information technology and other systems that facilitate coordination and information exchange across providers (Enthoven et al., 2007).
- Educate Medicare beneficiaries about consensus-based “right care” pathways in management of conditions. Patients and their families can be advocates to ensure that the right care is delivered. CMS is investing considerable resources over the next five years to increase the number of performance measures that are available to assess the quality of care across a larger number of conditions, provider types, and settings of care and make this information available to Medicare beneficiaries. As the capacity to identify what the right care looks like for an entire episode of care for a given clinical condition increases, such consensus-based information (i.e., “right care” maps) could be shared with patients and their family members to enable them to advocate for and hold the system accountable for delivering high-quality care.
- Longer-Term Applications of Episodes of Care
- Change the unit of payment for some services to episodes of care, with adjustments for performance. To fully align payments across providers, with the goal of increasing coordination and encouraging increased efficiencies in delivery, “bundled payments” could be made for certain episodes of care, building on the model of the Medicare Acute Care Episode Demonstration. A small number of episode types could be used at first, building in additional episode types over time. A building block approach to episode definition could be used, beginning with bundled payment for hospital-based services only (as in the Acute Care Episode Demonstration), then building out to include care in other settings (e.g., post-acute care). The bundled payment approach could also be applied to episodes of care that do not involve hospitalization, such as outpatient surgery, Medicare post-acute care or chronic care. This approach could also consider adjusting the payment based on performance that occurs within the management of the entire episode. Virtual and actual integrated delivery systems are likely better positioned to be able to accept such payments in the near term; over time, episode-based payments may encourage health care providers to arrange into these structures.
Future Research and Demonstration Opportunities
There is an absence of solid empirical work related to and few real-world applications of episode-based approaches that provide guidance on how best to construct and apply episodes of care in the context of performance measurement and/or payment policy. The work done within this project was exploratory in nature and represents only a first step in a much larger process to flesh-out episode of care-based approaches to performance measurement and payment. The findings contained in this report reflect the design features of the two commercially available grouper software tools that were used to construct episodes in this project. Other types of episode constructions could yield different results. Additionally, some of the observed variation in results across states may be an artifact of variations in coding practices in different regions and future work should attempt to understand the extent of variation in coding practices.
Our exploration highlighted a number of issues and gaps in the knowledge base where additional research studies and/or testing in the form of small pilot studies or demonstrations could further advance Medicare’s capabilities to apply episodes of care in various ways to drive improvements in quality and cost-efficiencies. Areas for additional work that could be considered are described in more detail in Chapter 6.
Acknowledgments
We gratefully acknowledge the participation of numerous individuals who were instrumental in helping us complete this project. In particular, we appreciate the contributions made by our Technical Expert Panel members, who provided feedback on our data analyses and who served as external reviewers of this report. The panel members were: Robert Berenson, MD (Senior Fellow, Urban Institute), Gary Kaplan, MD (CEO and Chairman, Virginia Mason Medical Center), Robert Mecklenberg, MD (Medical Director, Virginia Mason Medical Center), Mark Rattray, MD (President, Care Variance), Mark Miller (Executive Director, MedPAC), Debra Saliba, MD (Director, UCLA/ JHA Borun Center for Gerontological Research), and Karen Milgate (Director, Office of Policy, CMS). We also want to thank the individuals who participated in our expert discussions, for contributing their time and their knowledge to helping identify key considerations associated with applying episodes of care to payment and performance measurement.
We wish to acknowledge Acumen, LLC for the work they performed to run the commercial episode groupers and to provide RAND with constructed episodes and helping with interpretation of the output. We are grateful to the support provided by Symmetry and Thomson-Medstat (now Thomson-Reuters) for making their episode grouping software tools available for this research application.
Our ASPE project officer, Susan Bogasky, provided guidance, support and expert counsel throughout the project. Karen Milgate, from CMS, also provided ongoing guidance and critical feedback throughout the project, as did a broader set of individuals at CMS, including Fred Thomas, Craig Caplan, Lisa Grabert, Rene Mentnech, Curt Mueller, and Jesse Levy. We acknowledge the contributions to this project and report made by Susan Lovejoy, Kristin Leuschner, and Magdalen Paskell from RAND. Any errors of fact or interpretation are the responsibility of the RAND authors.
Abbreviations
| Abbreviation | Definition |
|---|---|
| ACEI | Angiotensin converting enzyme inhibitor |
| ACO | Accountable care organizations |
| AMI | Acute myocardial infarction |
| APC | Ambulatory payment classification |
| APU | Annual payment update |
| ARB | Angiotensin receptor blocker |
| ASC | Ambulatory surgical center |
| ASPE | Assistant Secretary for Planning and Evaluation |
| BMI | Body mass index |
| CABG | Coronary artery bypass graft |
| CAD | Coronary artery disease |
| CKD | Chronic kidney disease |
| CMG | Case-mix group |
| CMS | Centers for Medicare and Medicaid Services |
| COPD | Chronic obstructive pulmonary disease |
| COLA | Cost of living adjustment |
| CPI | Consumer price index |
| CPT | Current procedural terminology |
| CT | Computed tomography |
| DHHS | Department of Health and Human Services |
| DRG | Diagnosis related group |
| DSH | Disproportionate share |
| ECT | Electroconvulsive therapy |
| E&M | Evaluation and management |
| ESRD | End stage renal disease |
| ETG | Episode treatment group |
| FEHB | Federal employee health benefits |
| FFS | Fee-for-service |
| GAO | Government accountability office |
| GDP | Gross domestic product |
| GERD | Gastroesophageal reflux disease |
| HCC | Hierarchical condition category |
| HCPCS | Healthcare common procedure coding system |
| HHA | Home health agency |
| HHQI | Home health quality initiative |
| HF | Heart failure |
| HHRG | Home health resource group |
| HOP QDRP | Hospital outpatient quality data reporting program |
| IDS | Integrated delivery system |
| IOM | Institute of Medicine |
| IPPS | Inpatient prospective payment system |
| IRF | Inpatient rehabilitation facility |
| LDL | Low-density lipoprotein |
| LTC | Long term care |
| LTCH | Long term care hospital |
| LVSD | Left ventricular systolic dysfunction |
| MA | Medicare Advantage |
| MCP | Monthly capitation payment |
| MedPAC | Medicare payment advisory committee |
| MEG | Medical episode grouper |
| MDS | Myelodysplastic syndrome |
| MRI | Magnetic resonance imaging |
| MSA | Metropolitan statistical area |
| MS DRG | Medicare severity diagnosis related group |
| MSIS | Medicaid statistical information system |
| MS LTC DRG | Medicare severity long term care diagnosis related group |
| NHQI | Nursing home quality initiative |
| NLA | National limitation amount |
| OASIS | Outcome assessment and information set |
| OME | Otis media with effusion |
| PCI | Percutaneous coronary intervention |
| PHO | Physician hospital organization |
| PN | Community acquired bacterial pneumonia |
| PPS | Prospective payment system |
| PQRI | Physician quality reporting initiative |
| P4P | Pay for performance |
| P4R | Pay for reporting |
| RAP | Radiology, anesthesiology, pathology |
| RHQDAPU | Reporting hospital quality data for annual update |
| RPL | Rehabilitation, psychiatric and long term care |
| RUG | Resource utilization group |
| Rx HCC | Prescription drug hierarchical condition category |
| SGR | Sustainable growth rate |
| SNF | Skilled nursing facility |
| UI | Urinary incontinence |
| VBP | Value-based purchasing |
1. Introduction
The Cost and Quality Problem
Substantial deficits in the quality of health care and persistent and unsustainable growth in health care spending have led to calls for reforms of the Medicare system, including such steps as increasing performance accountability and making changes in payment policies (IOM, 2001; IOM, 2006). Deficiencies in the quality of care delivered to patients in the United States are well documented (Schuster et al., 1998; Institute of Medicine, 2001; Wenger et al., 2003), with adults receiving approximately 55 percent of recommended care (McGlynn et al., 2003). The deficits exist across all sociodemographic subgroups with substantial underuse of recommended care regardless of income, race, or age (Asch et al., 2006). Although there have been some improvements in the quality of care delivered to Medicare beneficiaries (Jencks et al., 2003; Lindenauer et al., 2007), quality of care remains a problem for the Medicare population (Higashi et al., 2007), especially in coordinating the care.
Existing Medicare fee-for-service (FFS) performance measurement and payment policies focus on individual providers in each distinct health care setting. However, the actual care delivered to beneficiaries for an episode of illness reflects a continuum of care that can cross settings and providers. On an annual basis, Medicare beneficiaries receive care from a median of seven physicians who practice in multiple different health care settings, and it is common for beneficiaries to move from one setting to another as they experience changes in health and functional status (Pham et al., 2007). The number of physicians seen in a year is even greater for beneficiaries with common chronic conditions such as diabetes and coronary artery disease (CAD) and increases with the number of conditions experienced by the beneficiary (Pham et al., 2007). In the current fragmented system of care, no one provider or set of providers claim ownership or responsibility for managing a patient's care, and this fragmentation contributes to the overuse of services, duplication of services and use of costly services rather than efficient, high-quality care (Davis, 2007).
In addition to quality of care problems, health care costs continue to rise and account for an increasing amount of theUnited States ' gross domestic product (GDP). In 2007, health expenditures were projected to make up 16.3 percent of the GDP and are anticipated to account for 19.5 percent of GDP by 2017 (Keehan et al., 2008). Medicare's 2007 expenditures were $432 billion and accounted for 3.2 percent of GDP (Boards of Trustees, Federal Hospital Insurance and Federal Supplementary Medicare Insurance Trust Funds, 2008). One of the contributors to the spending problem is the substantial geographic variation in the use of health care services, which has raised concerns about the over use of health services (Fisher et al., 2003a; Fisher et al., 2003b). The Fisher study demonstrated that regions with higher utilization did not achieve better patient outcomes or greater patient satisfaction with care as compared to lower utilization areas—suggesting over use of services (i.e., greater resource consumption) absent benefits to Medicare beneficiaries.
The unsustainable growth has resulted in a level of spending that, in each of the past three years, has resulted in the Board of Trustees issuing in their 2006, 2007 and 2008 reports a determination of “excess general revenue Medicare funding.” As established by the Medicare Prescription Drug, Improvement, and Modernization Act of 2003 (MMA),this finding in two consecutive years in turn triggers the “Medicare funding warning,” which were present in the Board of Trustees Reports in 2007 and 2008, Triggering of the Medicare funding warning requires the President to propose and Congress to consider legislation to control Medicare spending. In response to the Medicare funding warning in the Board of Trustees 2007 Report, the Medicare Funding Warning Response Act of 2008 was proposed in February 2008. Title I of this proposed bill, contains language that, if enacted, would provide the Secretary of the Department of Health and Human Services (DHHS) with the authority and responsibility to introduce initiatives to make the Medicare program a value-based purchaser of health care services, consistent with President Bush's August 2006 Executive Order, “Promoting Quality and Efficient Health Care.” The urgency for reform to reign in spending was underscored by a 2008 projection from the Boards of Trustees of the Federal Hospital Insurance and Federal Supplementary Medical Insurance Trust Funds that, without intervention, the trust fund for Medicare Part A will be completely depleted in 2019 (Boards of Trustees, Federal Hospital Insurance and Federal Supplementary Medicare Insurance Trust Funds, 2008). MedPAC stated in their 2008 Report to the Congress: Medicare Payment Policy that multiple strategies will be necessary to reform Medicare (Medicare Payment Advisory Commission, 2008).
A variety of reform mechanisms are being considered to address the problems of underuse and overuse of services, including the establishment of performance accountability mechanisms and incentives that reward the delivery of the right care compared to the current approach which fosters lack of coordination of care, overuse of services, and lack of accountability and ownership for management of patient care. Among the reforms being considered and tested in demonstrations, are competitive bidding, pay for performance, gainsharing, and—the subject of this study—the alignment of performance measurement and financial incentives for service delivery around a beneficiary' episodes of care.
Goal of This Study
The Assistant Secretary for Planning and Evaluation (ASPE) contracted with RAND to explore how episodes of care could be defined for a limited set of clinical events/conditions and, based on varying definitions, to consider ways in which the alignment of performance measurement, accountability, and incentives to providers could be improved within the current Medicare payment and performance measurement systems in the near term. RAND was also tasked to provide ASPE with options to consider in moving toward broader episode-based performance measurement and payment reforms to encourage high-quality, efficient, and coordinated care. A core piece of the work involved using two commercially available episode grouping software tools to construct episodes of care, which were then used to identify the issues that would need to be considered in applying episodes as a basis for payment and/or performance measurement.
The Potential Use of Episodes of Care as a Unit of Measure
Efforts to focus on an episode of care for a patient attempt to change the current fragmented environment which is service oriented to one that takes a more holistic view of the care process. A recent Institute of Medicine (IOM) report entitled Rewarding Provider Performance: Aligning Incentives in Medicare recommended that “CMS should build towards an ultimate vision of aggregating funds for rewards into one integrated pool that would accommodate shared accountability and encourage coordination of care” and that the current measure sets “…should evolve over time to provide more comprehensive and longitudinal assessments of provider and system performance” (IOM, 2007).
For the purposes of this discussion, we define an “episode of care” as a series of health care services for a Medicare beneficiary that are related to the treatment of a specific illness or injury (e.g., the treatment of a specific acute illness or the ongoing care for a chronic disease). The way in which the definition of an episode is operationalized could vary making the defined unit of measurement more or less expansive. An episode of care could be narrowly constructed to reflect the services delivered by one provider in a single setting for a specific illness or injury, broadly constructed to encompass the entire continuum of services received across multiple setting for a specific condition, or could be constructed to reflect something between these two ends of the spectrum.
There are a range of services that could be included in an episode of care, making the defined unit of measurement more or less expansive. At one end of the spectrum would be an episode that includes the services delivered by one provider in a single setting. A current example of this type of episode construction is a Diagnosis Related Group (DRG) used by CMS for making payments to IPPS hospitals; the DRG includes all of the facility services for an inpatient stay. An example of an intermediate stage could be an episode construction that captures the facility services as well as the physicians services provided during an inpatient stay. An expansive episode of care construction would include the continuum of Medicare services a beneficiary receives for a condition. An example of an inclusive episode could be one that reaches beyond the inpatient stay to capture post-acute care that is delivered to the patient.
There are a variety of approaches that could be used to move towards the IOM vision of shared accountability and coordinated care. For example, performance measurement programs could be designed to assess the care delivered across the entirety of an episode and be aligned across different types of providers. Another mechanism is to link payment to episodes of care (Davis, 2007), with the payment rate adjusted based on performance measures such as clinical quality and patient experience (Schoen et al., 2007; MedPAC, 2008). The Commonwealth Fund estimates that by linking payment to an episodes involving hospitalizations that include inpatient, physician and related services from the time of admission through a post-discharge period (e.g. 90 days) and using the 75th percentile of the Metropolitan Statistical Area (MSA) with the lowest severity-adjusted Medicare costs nationally to set payment rates would save $96.4 billion over five years and $229.2 billion over 10 years (Schoen et al., 2007). This proposed approach does not link any quality or outcome measures to the episode.
CMS is in the process of developing a Medicare demonstration that will test a competitive bidding approach to determining global payments (i.e. a single overall payment) for acute care episodes for select orthopedic and cardiovascular inpatient procedures. After the first year of the demonstration, CMS and the demonstration sites may consider extending the episode of care to include some post-acute care services as well.
About This Report
The Assistant Secretary for Planning and Evaluation (ASPE) contracted with RAND in September 2007 to examine episodes of care for different clinical events/conditions and to consider ways in which the alignment of quality and financial incentives could be improved within the current Medicare payment and performance measurement systems and to explore broader episode-based performance and payment reforms to encourage coordination, shared accountability and efficiency. To address selected policy questions related to the potential use of episodes of care for performance measurement, payment, and value-based purchasing (VBP), the project is applying two commercially available episode groupers, the Symmetry Episode Treatment Groups (ETGs) and the Thomson Healthcare Medical Episode Grouper (MEG), on Medicare claims data for 2004 - 2006 from three states.
The project is using a “building block” framework to examine the construction and application of episodes of care. In the context of a building block approach, an episode of care could be constructed (1) narrowly to reflect the services delivered by one provider in a single setting for a specific illness or injury, (2) more broadly to reflect the services delivered in a single setting by multiple providers, such as the physician and the hospital during an inpatient stay, (3) very broadly to encompass the entire continuum of services received across multiple settings and providers for treatment/management of a specific condition, or (4) other variations along this continuum.
Analyses of the output from the grouper software runs focused on specific clinical conditions and will utilize three definitions of episodes of care that start from the current “silo-based” foundation, and expand out to include multiple provider types and settings including, but not limited to:
- Episodes that occur in a single setting (e.g., ambulatory) and address a single type of providers (e.g. physicians);
- Episodes that include both hospital and physician services; and
- Episodes that include the continuum of Medicare provider services.
Using the episode of care as the unit of analysis, data on the episodes derived from the ETG and MEG grouper tools will be used to calculate descriptive statistics that will provide an array of summary information to better understand trends of care for similarly situated beneficiaries.
The scope of work addressed by this project focused on seven key tasks:
- A review of the literature on episode-based approaches to care delivery, as has been applied in the context of provider payment and performance measurement.
- A cataloging of existing payments approaches across Medicare provider settings and assessment of the extent to which these payment policies are aligned.
- A cataloging of performance measures currently being reported to Medicare by provider setting (ambulatory, hospital, home health, etc.) and an assessment of the extent to which these measures are aligned and where gaps exist.
- Discussions with experts to solicit feedback on alternative approaches for defining episodes and creating incentives, both financial and non-financial, that would lead to better alignment of performance measurement and accountability across an episode of care.
- Analyses of episodes constructed from two commercially available episode groupers, including descriptions of the number and types of settings an episode touches for various clinical conditions, number and types of other co-occurring episodes, and the amount of care that is delivered outside a beneficiary's primary state of residence.
- Modeling of various attribution rules for assigning episodes to one or more providers and examining the impact of the various assignment rules.
- Synthesis of the results to assess design considerations and policy issues associated with using an episode-based approach for performance measurement and improving the alignment of financial incentives to providers across settings to enhance coordination, quality and the efficiency with which resources are utilized.
The remaining chapters of this report address an overview of Medicare's payment policies across settings and providers (Chapter 2), a summary of performance measures that are currently supplied to CMS through its' various reporting programs for health care providers and assesses the alignment of these programs (Chapter 3), a review of the literature on the use and potential use of episodes of care for performance measurement and payment and findings from discussions with experts (Chapter 4), a summary of findings from our analysis of the episodes constructed for nine clinical conditions (Chapter 5), and a synthesis of findings and discussion of issues related to application of episodes of care and possible areas for future research and demonstration projects (Chapter 6).
2. Medicare Payment Policy
Medicare uses separate payment mechanisms for each of its FFS provider settings and Medicare Advantage plans. Our review finds that these payments are currently not aligned in ways that stimulate coordination, shared accountabilities, and delivery of high quality care.
We summarized the current Medicare payment systems for each provider or supplier type and benefit category.
- hospital inpatient,
- hospital outpatient,
- physician,
- skilled nursing (SNF),
- long-term-care hospitals (LTCH),
- inpatient rehabilitation facilities (IRF),
- home health (HHA),
- ambulatory surgical centers (ASC),
- outpatient laboratories,
- durable medical equipment (DME),
- dialysis (ESRD),
- hospice,
- prescription drugs (Rx), and
- Medicare Advantage (MA) plans.
The purpose of this discussion is to understand whether and how current payment policies create incentives for providers across a patient's continuum of care, as a starting point for any types of applications or reforms that would involve using episodes of care in the context of provider payments to better align financial incentives in various settings.
In Table 1, we summarize the payment mechanism used by provider type and setting. The format used in this table mirrors a table presented in the MedPAC 2003 Report to Congress, however the content has been updated utilizing the October 2007 MedPAC Payment Basics reports, information on the CMS website and Federal Register. We report the fiscal year (FY) the payment method began, basis of payment, method used to determine payments, source of the base payment amount and any provider-specific adjustments made to the amount, and method to update payments, reporting incentives and other related policies.
Medicare predominantly uses prospective rate systems for paying providers, through which providers agree to accept as payment in full a predetermined amount for each separately billable Medicare covered product, service, admission or set of services. Cost-based payment continues for Critical Access Hospitals (CAHs) and selected other categories of service or patients.
CMS developed and implemented prospective payment systems separately for each of the other FFS settings, beginning with acute hospital inpatient care in 1984 and, most recently, with ambulatory surgical centers in 2008. Payments to providers are based on a unit of service, which varies by type of provider. These units of service may be per-discharge (hospital-based care), per-diem (SNF, hospice), per-episode (HHA), per-treatment (dialysis) or on a fee schedule (hospital outpatient, physician, outpatient therapy, outpatient labs, durable medical equipment). Typically, base payments are adjusted for patient characteristics, geographic factors, and in the case of physician payments, for practice expenses and professional liability costs. Payment rates for most settings are updated annually to account for changes in market conditions, technology or practice patterns.
FFS payments create incentives for providers to increase the number of reimbursable units provided (e.g. the number of discharges for hospitals, unique services for physicians) to maximize reimbursement. When the reimbursable unit encompasses a bundle of services, which occurs under DRG payments for hospitals, there are incentives created that encourage the provider to be more efficient in the use of services in order to maximize profits. This has been evidenced by hospitals reducing lengths of stay in response to prospective payments, in contrast to cost based payment subject to limits.
In contrast to the payment per unit of service for most Medicare FFS providers, the Medicare Advantage program and the Part D prescription drug program make monthly capitated payments to private health plans or drug plans. In the case of the Medicare Advantage program, Medicare pays a base payment rate that is the lesser of the plan's bid and the local or regional benchmark, which is then risk-adjusted based on enrolled beneficiary characteristics. Health plans participating in the Part D program receive payments based on their annual bids during a competitive bidding process. Under the capitation arrangement, plans face incentives to limit resource use and to keep members healthier to maximize profits,
While the payment systems described above create incentives for provider behavior, often to provide more services, with only one exception do they specifically reward providers for delivering high quality, efficient care. The exception is CMS' recent policy change, implemented in FY 2008, where the Medicare program no longer reimburses hospitals for the additional costs (i.e., a higher MS-DRG payment) associated with eight preventable complications, including three “never events,” unless the condition was documented as being present on admission (CMS, 2007c). The final rule for hospital inpatient services for FY 2009 includes an additional seven conditions.
Due to the lack of differentiation in payment based on quality and efficiency and calls from many policy leaders to align payments with the delivery of high quality, efficient care, CMS has instituted value-based purchasing (VBP) initiatives for several settings as a means of better aligning payment and performance. Currently, several Medicare FFS provider settings are provided a financial incentive for the reporting of quality data to CMS as the first step toward the longer term goal of differentiating payment based on performance or “pay for performance.” Currently, the hospital inpatient, hospital outpatient and home health settings have pay-for-reporting programs in place through which providers must report on a set of measures in order to receive their full payment updates. In contrast, the Physician Quality Reporting Initiative (PQRI) provides a bonus to physicians who report on a minimum of three measures during the reporting period.
In the future, some or all of these programs could potentially transition to pay for performance (i.e., financial incentive linked directly to actual performance on measures rather than the reporting of measures). In November 2007, the Secretary of Health and Human Services submitted a Report to Congress detailing a plan to implement a hospital value-based purchasing program for Medicare services as mandated by the 2005 Deficit Reduction Act1 (DRA). The Medicare Improvements for Patients and Providers Act of 20082 (MIPPA) requires the Secretary of Health and Human Services submit no later than May 2010 a plan to transition to value based purchasing for physicians and other practitioners. Furthermore, MIPPA calls for the establishment of a P4P program for ESRD providers effective January 1, 2012. Additionally, CMS has pay-for-performance (P4P) demonstration projects in process for hospitals, physician group practices, and home health agencies and is developing plans for P4P demonstrations in other settings.
Performance reporting initiatives are not the only value-based purchasing activities in which CMS is engaged. CMS is also exploring competitive bidding as a mechanism to contain costs and potentially ensure quality. A competitive bidding program was planned to start in 2008 for select durable medical equipment (DME) in 10 MSAs with a planned expansion to 80 MSAs in 2009; in addition, a competitive bidding demonstration was planned for clinical laboratories starting in 2008. However, MIPPA delays until after 2011 full implementation of the DME competitive acquisition program, and repeals the competitive bidding demonstration for clinical laboratory services.
CMS will test the use of gainsharing between hospitals and physicians as a mechanism to improve the quality and efficiency of care delivered to beneficiaries through two demonstrations (CMS, 2006): the Hospital Gainsharing Demonstration, which was authorized by section 5007 of the DRA and started in October 2008 and the Physician Hospital Collaboration Demonstration, which was authorized by section 646 of the MMSA and is targeted to start in spring 2009. In May of 2008, CMS announced its plans for the Acute Care Episode demonstration through which it will provide a single bundled payment for both Part A and Part B Medicare services provided during an inpatient stay for a select set of cardiac and orthopedic surgical procedures.
| Payment System Description | Acute Inpatient Care | Ambulatory Care | |||||||
|---|---|---|---|---|---|---|---|---|---|
| Acute care hospitals | Critical access hospitals (CAH) | Psychiatric hospitals | Physicians | Hospital outpatient departments | Ambulatory surgical centers (ASC) | Outpatient laboratories | |||
| Fiscal Year Began | 1984 | 1997 | 2005 | 2000 | 2000 | 2008 | 1984 | ||
| Basis of Payment | Prospective | Cost-based | Prospective | Prospective | Prospective | Prospective | Prospective | ||
| Product Definition | Method of Payment | The labor portion of the base payment is adjusted by the hospital wage index and added to the non labor portion. The total is multiplied by the MS-DRG3 weight. The adjusted base payment is further adjusted for indirect medical education, share of low income patients, transfers and high cost outliers | Medicare pays each CAH 101% of its reported costs for outpatient, inpatient, laboratory, and therapy services, as well as SNF level post-hospital extended care- in the hospital's swing beds | The labor portion of the per-diem base rate is adjusted by the hospital wage index and added to the non-labor portion. The total is adjusted for facility and patient characteristics through the PPS4adjustment factor. The base rate is then further modified by the per diem adjustor, the presence of an emergency department, ECT7 treatments and high cost outliers | The 3 RVUs5(work, practice expense, and professional liability insurance) are each adjusted for complexity of service/expenses and geographic factors then are added together and multiplied by the conversion factor. Payment modifiers are then applied to arrive at the adjusted fee schedule payment rate. That rate is then adjusted for provider type (decrease) or geographic area(increase). For most services, Medicare pays the provider 80% of the fee schedule amount, and the beneficiary is liable for the 20% coinsurance | The labor portion of the conversion factor is adjusted by the hospital wage index and added to the non-labor portion. The adjusted conversion factor is then multiplied by the APC6 relative weight. The payment amount may be further adjusted for rural status, hold harmless payments and high cost outliers. | The labor portion of the ASC conversion factor is adjusted by the hospital wage index and added to the non-labor portion. The adjusted conversion factor is then multiplied by the APC relative weight. | Payment for the lab service is the lesser of the provider's charge, the carrier fee schedule amount and the National Limitation Amount (NLA) | |
| Unit of payment | Discharge | Service | Day | Service | Service | Procedure | Test | ||
| Classification system | 743 MS-DRGs | None | 15 DRGs | ~6700 HCPCS8 codes | HCPCS grouped in APCs | 3300 procedures grouped in APCs | 1100+ HCPCS codes | ||
| Policies defining boundaries | 72 hour rule short stay transfers; high cost outliers | None | High cost outliers | Differentials by setting; multiple or atypical services | High-cost outliers; multiple services discount | Multiple services discount | None | ||
| Product Relative Values (RV) | Components of RV | Single value for each MS DRG | NA- Captured in costs | DRGs | Physician work; practice expenses; liability insurance | Single value for each APC | Single value for each APC | Combined with base amount | |
| Source of RV | Hospitals' billed charges | None | Billed charges | Expert judgment; practice expense data; premium survey | Median of estimated service costs | Median of estimated service costs | None | ||
| Base payment rate/conversion factor | Components of base amt | Labor-related; nonlabor; capital | NA | Labor-related; nonlabor; capital | Single conversion factor (for sum of relative values) | Labor-related; non-labor | Labor-related; non-labor | Carrier specific rates with limit | |
| Source of base amt | Updated providers' 1982 costs | NA | Updated providers' 2002 costs | Projected spending under preceding method | 1996 outpatient department charges adjusted to costs | 1986 Survey of ASCs | Updated 1983 lab charges | ||
| Adjustments for local market conditions | Labor input prices | Hospital wage index | NA | Hospital wage index | Separate Geographic Practice Cost Indexes (work, practice expense, liability insurance) | Hospital wage index | Hospital Wage Index | None | |
| Other input prices | COLA (Alaska, Hawaii) | NA | COLA (Alaska, Hawaii) | None | None | None | None | ||
| Other payment adjustments | Low-income patients (DSH)9;GME10 | None | Patient characteristics; facility characteristics (teaching, rural, emergency dept); additional payment for ECT treatment | Reduced rates for non-physician practitioners | None | None | |||
| Payment update method | Hospital market basket index | NA | Hospital market basket index | Relative weights updated at least every 5 years; HCPCS codes updated annually, conversion factor updated annually according to SGR11system | Hospital market index; Expert review of APC and relative weights annually | Annual review of APCs and relative weights; conversion factor updated annually based on CPI starting 2010 | Congress specifies update factors | ||
| Reporting incentives | Reporting Hospital Quality Data for Annual Payment Update
|
None | None | Physician Quality Reporting Initiative (PQRI) 2.0 % bonus for reporting on quality measures for FYs 2009 and 2010 | Hospital Outpatient Quality Data Reporting Program (HOP QDRP) Withhold of 2 percentage points APU for failure to report on quality measures beginning 2008 | None | None | ||
| Payments for capital costs | Separate prospective rates | Included in payment rate | Included in payment rate | Included in payment rate | Included in payment rate | Included in payment rate | Included in payment rate | ||
| Other policies | Higher rates in large urban areas; new technology payments; reimbursement for bad debts; no reimbursement for preventable complications starting 2008 | SNF, psychiatric, and rehab units and home health agencies are paid through prospective systems. | The adjusted rate is higher for earlier days of a patient's stay and declines through the 22nd day. | 10% addition for health professional shortage areas | New technology pass-through; transitional corridors; hold harmless for cancer, children's and rural hospitals | Full payment is only given for the procedure with the highest payment rate. Payments for other procedures performed on the same day are reduced to half their usual rates. | NLA=74% of median fee schedule amounts set by 56 carriers. | ||
| Payment System Description | Post Acute Care | Services for Special Populations | |||||
|---|---|---|---|---|---|---|---|
| Skilled nursing facilities (SNF) | Home health agencies | Inpatient rehab facilities | Long term care hospitals | Outpatient dialysis care | Hospice services | ||
| Fiscal Year Began | 1998 | 2000 | 2002 | 2003 | 1982 | 1983 | |
| Basis of Payment | Prospective | Prospective | Prospective | Prospective | Prospective | Prospective | |
| Product Definition | Method of Payment | The labor portion of the SNF base rate is adjusted by the pre-floor and pre reclassified hospital wage index then added to the non-labor portion. The adjusted base rate is then multiplied by the RUG13weight to arrive at the payment amount. | The labor portion of the base rate is adjusted by the pre-floor and pre reclassified hospital wage index then added to the non-labor portion. The adjusted base rate is then multiplied by the HHRG14weight and adjusted for short stay or high cost outliers | The labor portion of the base rate is adjusted by the hospital wage index and added to the non-labor portion. The adjusted base rate is then multiplied by the CMG15weight and adjusted for rural location, share of low income patients, teaching facility and short stay or high cost outliers | The labor portion of the base rate is adjusted by the hospital wage index and added to the non-labor portion. The adjusted base rate is multiplied by the MS-LTC-DRG16weight and adjusted for short stay or high cost outliers | The labor portion of the freestanding base composite rate or the hospital-based composite rate is adjusted by the hospital wage index and added to the non-labor portion and to a drug add-on payment. This amount is then multiplied by a case-mix neutrality factor | The labor portion of the four categories of base payments (routine home care, continuous home care, inpatient respite, general inpatient) is adjusted by the hospital wage index and added to the non-labor related portion. |
| Unit of payment | Day | 60-Day episode | Discharge | Discharge | Dialysis Treatment | Day | |
| Classification system | 53 RUGs | 153 HHRGs | 92 CMGs (87 have 4 tiers with separate payment rates =353 separate rates ) | MS LTC DRGs | None | 4 care type groups | |
| Policies defining boundaries | None | Short stay outlier (fewer than 5 visits, high-cost outliers | Short stay outliers/deaths; transfers; high-cost outliers | Short-stay outliers; high-cost outliers; interrupted stays | None | Beneficiary gives up curative treatment | |
| Product Relative Values (RV) | Components of RV | Nursing care; therapy services | Single value for each HHRG | Single value for each CMG/tier | Single value for each MS LTC DRG | None | Combined with base amounts |
| Source of RV | Staff-time studies | Estimated mean cost per HHRG | Hospitals' billed charges | Hospitals' billed charges | None | None | |
| Base payment rate/conversion factor | Components of base amt |
Labor-related; other |
Labor-related; other | Labor-related; other | Labor-related; other | Labor-related; other | Labor-related; other |
| Source of base amt | Amount received in 1995, updated for inflation | Spending in preceding system | Projected spending under preceding method | Projected spending under preceding method | 1977-1979 cost reports | Cost data from Medicare demonstration | |
| Adjustments for local market conditions | Labor input prices | Pre-floor and pre reclassified hospital wage index | Pre-floor and pre reclassified hospital wage index | Pre-floor and pre reclassified hospital wage index | Hospital wage index | Hospital wage index | Hospice wage index |
| Other input prices | None | None | None | COLA (Alaska,Hawaii) | None | None | |
| Other payment adjustments | None | Non-routine medical supplies; proportional episode payment adjustment for beneficiary elected transfers | Low income patients; teaching facility | None | Higher rates for hospital-based facilities; adjusted for patient characteristics (age, BMI, body surface area; drug add-on payment | None | |
| Payment update method | SNF market basket index | Home health market basket index | RPL17market basket index | No legislative mandate to update payments. CMS updates based on RPL market basket index | Annual updates of add-on payment based on growth in drug expenditures | Hospital market basket index | |
| Reporting incentives | Public reporting | As part of the Home Health Quality Initiative (HHQI), HHAs must report quality measures; otherwise 2 percentage points market basket update is withheld plus public reporting | None | None | Public reporting | None | |
| Payments for capital costs | Included in payment rate | Included in payment rate | Included in payment rate | Included in payment rate | Included in payment rate | Included in payment rate | |
| Other policies | 128% increase in per-diem for SNF patients with AIDS | Higher rates in rural areas | None | Medicare caps payments to facilities at 3 sessions per week | Annual payment per beneficiary capped | ||
| Payment System Description | Durable medical equipment (DME) | Medicare Advantage (MA) plans | Part D plans | |
|---|---|---|---|---|
| Fiscal Year Began | 1986 | 1998 (M+C) 2006 (MA) | 2006 | |
| Basis of Payment | Prospective | Prospective-Capitation | Prospective-Capitation | |
| Product Definition | Method of Payment | Payment is the lesser of the provider's charge or the state fee schedule amount | All-inclusive A/B capitation rate is determined by multiplying the base rate (which is either the plan's bid or the benchmark) by the enrollee's risk measure, also known as the CMS-HCC18 weight. | Capitation rate is determined by multiplying the plan's bid by the enrollee's risk measure, also known as the RxHCC19; adjusting for other factors; subtracting the enrollee premium; and adding the additional low income subsidy, reinsurance and risk corridor payments |
| Unit of payment | Item | Month | Month | |
| Classification system | HCPCS within 5 equipment categories | CMS-HCCs are based on beneficiaries' diagnosis, age, gender, working age status; Medicaid status and disabled status | RxHCCs are based on beneficiaries' diagnosis, age, gender and disability status | |
| Policies defining boundaries | None | Payment floors for base rate (national and urban). Separate CMS-HCC risk models for aged, disabled, ESRD, new enrollees, and institutionalized. Additional frailty adjustment factor reflecting the average level of functional impairment. | Additional adjustments are made for low income status, and institutionalized status
Separate RxHCC model for new enrollees |
|
| Product Relative Values (RV) | Components of RV | Combined with base amount | One value for each HCC based on diagnosis, age, gender, working age status, Medicaid status, and disabled status. | One value for each RxHCC based on age, gender and disabled status |
| Source of RV | None | The CMS-HCC risk adjustment model includes approximately 70 disease groups comprised of ICD-9 codes that are clinically related and have similar cost complications
CMS uses demographic and diagnostic information from original Medicare and MA organizations to determine beneficiaries' risk scores |
The CMS RxHCC risk adjustment model includes approximately 70 disease groups comprised of ICD-9 codes that are clinically related and have similar cost complications
CMS uses demographic and diagnostic information from original Medicare and MA organizations to determine beneficiaries' risk scores |
|
| Base payment rate/conversion factor | Components of base amt | Single amount | Local/regional benchmarks | Plan bids |
| Source of base amt | Allowed charges in 1986-1987 with exceptions for customized equipment, medications used in conjunction with DME, and home oxygen | County-level payment rates used to pay MA plans before 2006 (based on historical FFS rates, subject to payment floors and minimum updates) | Expected costs for a Medicare beneficiary of average health | |
| Adjustments for local market conditions | Labor input prices | NA | Included in bid | Included in bid |
| Other input prices | Geographic differences reflected in separate fee schedule for each state | None | None | |
| Other payment adjustments | State fee schedules subject to national floor and ceiling. Fees for prosthetics and orthotics subject to regional limits. | Rebates to plans for difference between benchmark and bid rate (if below the benchmark) that can be used to provide additional benefits or reduce premiums)
Enrollees must pay an additional premium for plans with bids above the benchmark Adjustment for beneficiaries utilization of VA and DOD military facilities Risk corridor payments for regional MA plans |
Enrollees must pay a base premium plus any difference between their plan's bid and the nationwide average bid
Beneficiaries may also be subject to a late enrollment penalty In addition to direct subsidy payments for drug coverage, plans also receive low income subsidy payments; individual reinsurance payments; and risk corridor payments |
|
| Payment update method | CPI-U20 | Plans' bids updated annually
Rise in national growth rate in per capita Medicare spending is used to update the benchmarks each year, subject to a minimum percentage increase MA FFS capitation rates are rebased at lease once every 3 years based on more recent FFS claims data Coefficients in the Part C CMS-HCC Risk Adjustment Model, and frailty adjustment factors are also periodically updated using more recent data |
Parameters for the standard Part D benefit are updated each year based on the estimated annual change in per capita drug spending and the annual percentage increase in the CPI
Coefficients in the Part D RxHCC risk adjustment model were originally developed based on drug expenditure data from FEHB21 and MSIS22and will be updated based on actual Part D utilization |
|
| Reporting incentives | None | None | None | |
| Payments for capital costs | Included in payment rate | Included in payment rate | Included in payment rate | |
| Other policies | ||||
3. Performance Measures Reported to Medicare
In 2002, CMS launched the Quality Initiative, an effort designed to assure quality health care for all Americans through performance accountability and public disclosure of performance results (http://www.cms.hhs.gov, 2008). The roll-out of this program has occurred over the past few years, continues to expand, and includes performance measurement in six different Medicare health care settings:
- The Nursing Home Quality Initiative (NHQI) in 2002;
- The Home Health Quality Initiative (HHQI) in 2003;
- The Hospital Quality Initiative (HQI) in 2003;
- The End Stage Renal Disease (ESRD) Quality Initiative, in 2004;
- The Physician Quality Reporting Initiative (PQRI) in 2006; and
- The Hospital Outpatient Quality Data Reporting Program (HOP QDRP) in 2008.
To understand whether performance measurement is aligned across the various components of the current FFS payment system, we cataloged the six Medicare performance measurement programs and examined the extent to which these programs are aligned in terms of the clinical conditions measured and measures included.
Across the various settings, CMS collects a total of 249 performance measures for hospital inpatient, hospital outpatient, physicians/practitioners/therapists, skilled nursing facilities (SNF), home health agencies, and dialysis facilities through a variety of methods and with varying types and levels of incentives attached. Four settings have financial incentives associated with the reporting of measures (i.e., “pay for reporting” programs). Reporting performance measures for hospital inpatient, hospital outpatient and home health agencies, while voluntary, is required in order for these providers to receive the full annual payment update/market basket update; providers that do not report the measures forgo 2 percentage points of the update. For the Physician Quality Reporting Initiative (PQRI), participation is voluntary and physicians who submit data on the specified performance measures received a bonus (subject to a cap for reporting in 2007) of 1.5% percent of allowed charges for covered Medicare physician fee schedule services for 2007 and 2008. For 2009 and 2010, the bonus amount is increased to 2% of allowed charges.
Public reporting of performance results occurs for providers in four of the settings as of March 2008: (1) hospital inpatient, (2) home health agencies (HHAs), (3) skilled nursing facilities (SNFs) and (4) dialysis facilities. At this time, physicians participating in PQRI receive a confidential feedback report containing their reporting and performance information mid-year following the end of the PQRI reporting period.
The data used to construct the SNF and home health measures are collected through existing assessment and collection tools. Dialysis facility measures are constructed from Medicare administrative data sources, while new HCPC codes have been developed to enable the construction of measures from physician claims data for PQRI. In 2008, CMS allowed physicians to submit performance data via registries, and seeks to expand registry submissions in 2009 and continue to test data submissions from electronic health records (EHRs) (CMS, 2008). Hospital inpatient and hospital outpatient measures are based on data collected from electronic or paper medical records.
Cataloging the Set of Performance Measures Contained in CMS Performance Measurement Systems
This section provides brief descriptions of the six CMS performance measurement programs. Table 2 summarizes the number of measures included in the programs by measure type (e.g. clinical process of care, patient experience). Nearly 70 percent of the measures across the programs are clinical process of care measures (173 measures). All of the performance measurement programs, except the home health program (HHQI), include clinical process measures. Patient outcome measures are included for five settings (hospital inpatient, physicians, skilled nursing facilities, home health agencies and dialysis facilities), while intermediate patient outcomes are included for 3 settings (hospital inpatient, physicians, and dialysis facilities) and two settings have measures of patient functioning (skilled nursing facilities and home health care agencies). Measures of patient experience are captured for hospital inpatient care. The physician (PQRI) and the hospital outpatient programs include a small number of efficiency (inappropriate use of services) measures and PQRI has two structural measures. PQRI also includes several measures about proper documentation which we have termed “other.” We also list (Table 3) the full set of performance measures that are reported to or constructed by CMS for each of the six settings and whether the same measure used in one setting (e.g., the hospital) is also applied in another provider setting (e.g., PQRI, hospital outpatient). Within each provider setting or payment silo, measures are organized by condition or procedure where relevant.
| Type of Measure | Hospital Inpatient (RHADAPU) | Hospital Outpatient (HOP QDRP) | PQRI | Skilled Nursing Facilities | Home Health | Dialysis Facilities |
|---|---|---|---|---|---|---|
| Clinical Process of Care | 26 | 10 | 131 | 5 | 0 | 1 |
| Patient Outcome | 14 | 0 | 5 | 10 | 4 | 1 |
| Patient Intermediate Outcome | 1 | 0 | 5 | 0 | 0 | 1 |
| Patient Functioning | 0 | 0 | 0 | 4 | 8 | 0 |
| Patient Experience | 10 | 0 | 0 | 0 | 0 | 0 |
| Efficiency | 0 | 1 | 4 | 0 | 0 | 0 |
| Structural/Health Information Technology | 0 | 0 | 2 | 0 | 0 | 0 |
| Other (documentation) | 0 | 0 | 6 | 0 | 0 | 0 |
Reporting Hospital Quality Data for Annual Payment Update (RHQDAPU) Program This program, mandated under the Medicare Prescription Drug Improvement and Modernization Act of 200323, collects performance data from hospitals on a set of hospital inpatient measures of clinical quality (both process of care and outcomes) and patient experience with care. This “pay-for-reporting” program provides differential payment updates to Inpatient Prospective Payment System (IPPS) hospitals based on whether they publicly report their performance on the defined set of measures. The original program, established in 2004, required hospitals to report on a set of 10 performance measures in order to receive 0.4 percentage points of their annual payment update. The 2005 Deficit Reduction Act expanded the list of measures and increased the differential payment for reporting to 2 percentage points. The performance results are publicly reported on the CMS Hospital Compare website. The initial RHQDAPU list of measures has since expanded to 41 clinical measures and 10 patient experience measures required for reporting for fiscal year 2009. Of the current list, eight clinical measures are also reported in the Hospital Outpatient Quality Data Reporting Program (HOP QDRP) and/or the PQRI.
Hospital Outpatient Quality Data Reporting Program (HOP QDRP). Under Section 109 of the Tax Relief and Health Care Act of 200624, Congress established new requirements for hospitals serving Medicare beneficiaries to report outpatient quality data to secure their full annual update to the Outpatient Prospective Payment System fee schedule. Effective April 2008, hospitals were required to submit performance data on a set of seven measures of care provided in the hospital outpatient setting in order to receive their full annual update in calendar year 2009. For 2009, four new measures have been added. Those that do not participate in the program receive a reduction of 2.0 percentage points in their annual payment update. As this program is just starting, performance data is not yet publicly reported. Five of the measures included in HOP QDRP are emergency department (ED) transfer measures, two measures address perioperative care, and the four new measures address imaging appropriateness and follow-up. The number of measures to be reported for this program is expected to grow, and CMS has sought public comment on an additional 18 measures being considered for future years.
Physician Quality Reporting Initiative (PQRI). The Tax Relief and Healthcare Reform Act of 2006 required Congress to establish a physician quality reporting program. Established in 2007, this is a voluntary reporting program for physicians, practitioners and therapists. The Medicare, Medicaid, and SCHIP Extension Act of 200725] authorized the extension of the program through 2010. It also allowed for registry-based reporting and removed the cap on bonuses paid. The initial set of 74 clinical measures was expanded to 119 measures in 2008 and 153 in 2009 and addresses an array of clinical specialty areas. Eligible professionals who successfully report at least 3 of the 153 measures for calendar year 2009 receive a bonus over allowed charges for covered Medicare physician fee schedule services. The Medicare Improvements for Patients and Providers Act of 2007 (MIPPA) increased the bonus payment from 1.5 percent to 2.0 percent for 2009 and 2010. There is currently no public reporting associated with PQRI; providers' results are confidentially reported back to the individual provider mid-year following the end of the PQRI reporting period. The performance measures address 43 conditions or procedures, preventive care, and the use of health information technology (IT). The 2008 measure set included a measure for e-prescribing which was eliminated for 2009 due to the new e-prescribing incentive program included in the MIPPA. The PQRI program has also established measure groups for diabetes, chronic kidney disease, prevention, CABG, rheumatoid arthritis, perioperative care and back pain. Physicians or practitioners that elect to report on a group of measures must report all measures in the group that are applicable to each patient. PQRI measures have some degree of alignment with the hospital inpatient and outpatient measures (i.e., management of acute myocardial infarction, heart failure, perioperative/surgical care and pneumonia). Additionally, several preventive care measures (e.g., influenza and pneumococcal vaccinations) addressed in PQRI align with measures reported by SNFs.
Nursing Home Quality Initiative (NHQI). This reporting program began in 2002 and requires SNFs to provide information about the residents' health, physical functioning, and general function. The measures are constructed with data from the Minimum Data Set (MDS) Repository and the performance results are publicly reported on the CMS Nursing Home Compare website. There is no financial incentive associated with NHQI. A total of 19 measures are to be reported in 2009, with 14 relevant to long stay patients and five relevant to short stay patients; four of the five measures for short stay patients are also used for long stay patients. Long stay patients are those in an extended or permanent nursing home stay, while the short stay patients are usually recovering from a hospital stay and are expected to return home. The measures address vaccinations, pain, pressure sores, urinary incontinence, use of restraints, depression, mobility, urinary tract infections, and weight loss. There is some alignment between the conditions addressed by NHQI and PQRI (i.e., preventive care, depression, urinary incontinence), and there is overlap in the preventive measures (immunizations) included in the programs. Some of the conditions addressed by NHQI align with the home health program, HHQI, (i.e., pain, urinary incontinence), though the measures included in the two programs do not overlap.
Home Health Quality Initiative (HHQI). Beginning in 2000, every Medicare-certified home health agency was required to complete and submit health data on their clients utilizing the Outcome and Assessment Information Set (OASIS) data collection tool. Home health agencies that do not provide their data experience a two percentage point reduction in their annual market basket payment update. CMS began publicly reporting a subset of this information in late 2003 on the CMS Home Health Compare website. In 2005, the NQF endorsed the 10 measures reported on Home Health Compare, and two measures were added to the program for calendar year 2008. The performance measures address ambulation, activities of daily living, medical emergencies and discharge from home care. With the exception of pain, dyspnea, and urinary incontinence, most measures are not specific to a particular disease or condition. None of the measures are included in the other performance measurement programs.
End Stage Renal Disease (ESRD) Quality Initiative. In 2004, CMS required kidney dialysis facilities to report performance for patients with ESRD. CMS currently collects and reports three dialysis facility-specific measures that indicate the adequacy of hemodialysis, control of anemia and survival for patients with end stage renal disease (ESRD). The performance results are reported on the CMS Dialysis Facility Compare website along with the types of services offered by ESRD facilities. There is no financial incentive for reporting currently, however the 2008 MIPPA requires the establishment of a P4P program for ESRD providers effective January 1, 2012 and the establishment of a fully bundled payment system for ESRD facilities by January 1, 2011. The measures are produced from data that comes from the Standard Information Management Systems, which receive data from the ESRD Networks on a monthly basis and from the Renal Management Information System maintained by Medicare. Measures are also under development or have been recently developed for kidney transplant referral, ESRD bone disease and metabolism, and vascular access. The three existing dialysis facility-level measures are not included in the other performance measurement programs.
| Condition | Measure | Overlap with Other Reporting Programs | Measure Type26 | ||
|---|---|---|---|---|---|
| Hospital Inpatient | Acute Myocardial Infarction (AMI) | Aspirin at arrival | Hospital Outpatient & PQRI | P | |
| AMI | Aspirin prescribed at discharge | None | P | ||
| AMI | ACE-I or ARB for LVSD | None | P | ||
| AMI | Adult smoking cessation advice/counseling | None | P | ||
| AMI | Beta blocker at arrival | None | P | ||
| AMI | Beta blocker prescribed at discharge | None | P | ||
| AMI | Fibrinolytic medication received within 30 minutes of hospital arrival | Hospital Outpatient | P | ||
| AMI | PCI received within 120 minutes of hospital arrival | None | P | ||
| AMI | 30-day AMI mortality | None | O | ||
| Heart Failure (HF) | Discharge instructions | None | P | ||
| HF | Left ventricular function assessment | None | P | ||
| HF | ACE-I or ARB for LVSD | PQRI | P | ||
| HF | Adult smoking cessation advice/counseling | None | P | ||
| HF | 30-day HF mortality | None | O | ||
| HF | 30-day HF readmission* | None | O | ||
| Community Acquired Bacterial Pneumonia (PN) | Assessed and given pneumococcal vaccination | None | P | ||
| PN | Assessed and given influenza vaccination | None | P | ||
| PN | Blood culture performed in the emergency department before the first antibiotic received in hospital | None | P | ||
| PN | Appropriate initial antibiotic selection | PQRI | P | ||
| PN | Initial antibiotic received within 6 hours | None | P | ||
| PN | Adult smoking cessation advice/counseling | None | P | ||
| PN | 30-day PN mortality | None | O | ||
| Perioperative/Surgical Care | Prophylactic received within 1 hour prior to surgical incision | Hospital Outpatient & PQRI | P | ||
| Perioperative/Surgical Care | Prophylactic antibiotic selection for surgical patients | Hospital Outpatient & PQRI | P | ||
| Perioperative/Surgical Care | Prophylactic antibiotics discontinued within 24 hours after surgery end time | PQRI | P | ||
| Perioperative/Sur gical Care | Surgery patients with recommended venous thromboembolism prophylaxis ordered | PQRI | P | ||
| Perioperative/Surgical Care | Surgery patients with recommended venous thromboembolism prophylaxis received within 24 hours prior to or after surgery | None | P | ||
| Perioperative/Surgical Care | Cardiac patients with controlled 6 am post-operative serum glucose | None | IO | ||
| Perioperative/Surgical Care | Surgery patients with appropriate hair removal | None | P | ||
| Perioperative/Surgical Care | Surgery patients on a beta blocker prior to arrival who received a beta blocker during the perioperative period* | None | P | ||
| Perioperative/Surgical Care | Death among surgical patients with treatable serious complications* | None | O | ||
| Perioperative/ Surgical Care | Postoperative wound dehiscence* | None | O | ||
| Perioperative/Surgical Care | Mortality for selected surgical procedures (composite)* | None | O | ||
| Cardiac Surgery | Participation in a systematic database for cardiac surgery* | None | P | ||
| Nursing Sensitive | Failure to rescue* | None | O | ||
| Pneumothorax | Iatrogenic pneumothorax* | None | O | ||
| NA | Accidental puncture or laceration* | None | O | ||
| Abdominal Aortic Aneurysm | AAA mortality rate (with or without volume)* | None | O | ||
| Hip Fracture | Hip fracture mortality rate* | None | O | ||
| NA | Mortality for selected medical conditions (composite)* | None | O | ||
| NA | Complication/patient safety for selected indicators (composite)* | None | O | ||
| Patient Experience | Communication with doctors (composite) | None | PE | ||
| Patient Experience | Communication with nurses (composite) | None | PE | ||
| Patient Experience | Responsiveness of hospital staff (composite) | None | PE | ||
| Patient Experience | Cleanliness of hospital (composite) | None | PE | ||
| Patient Experience | Quietness of hospital (composite) | None | PE | ||
| Patient Experience | Pain control (composite) | None | PE | ||
| Patient Experience | Communication about medicines (composite) | None | PE | ||
| Patient Experience | Discharge information (composite) | None | PE | ||
| Patient Experience | Overall rating of hospital care | None | PE | ||
| Patient Experience | Overall recommendation | None | PE | ||
| Hospital Outpatient | |||||
| AMI | Emergency department transfer: Aspirin at arrival | Hospital Inpatient & PQRI | P | ||
| AMI | Emergency department transfer: Median time to fibrinolysis | None | P | ||
| AMI | Emergency department transfer: Fibrinolytic therapy received within 30 minutes of arrival | Hospital Inpatient | P | ||
| AMI | Emergency department transfer: Median time to electrocardiogram | None | P | ||
| AMI | Emergency department transfer: Median time to transfer for primary PCI | None | P | ||
| Perioperative Care | Timing of antibiotic prophylaxis | Hospital Inpatient & PQRI | P | ||
| Perioperative Care | Selection of prophylactic antibiotic | Hospital Inpatient & PQRI | P | ||
| Low Back Pain/Imaging | MRI lumbar spine for low back pain* | None | E | ||
| Imaging | Mammography follow-up rates* | None | P | ||
| Imaging | Abdomen CT-use of contrast material* | None | P | ||
| Imaging | Thorax CT-use of contrast material* | None | P | ||
| Physicians, Practitioners, Therapists (PQRI) | |||||
| Acute Bronchitis | Inappropriate antibiotic treatment for adults | None | P | ||
| Acute Otitis Externa | Topical therapy | None | P | ||
| Acute Otitis Externa | Pain assessment | None | P | ||
| Acute Otitis Externa | Systemic antimicrobial therapy-avoidance of inappropriate use | None | E | ||
| Age-Related Macular Degeneration (AMD) | Dilated macular examination | None | P | ||
| AMD | Counseling on antioxidant supplement* | None | P | ||
| AMI | Aspirin at arrival | Hospital Inpatient & Hospital Outpatient | P | ||
| Asthma | Assessment of symptoms | None | P | ||
| Asthma | Pharmacologic therapy | None | P | ||
| Back Pain | Initial visit* | None | P | ||
| Back Pain | Physical Exam* | None | P | ||
| Back Pain | Advice for normal activities* | None | P | ||
| Back Pain | Advice against bed rest* | None | P | ||
| Breast Cancer | Hormonal therapy for stage 1C-III ER/PR positive breast cancer | None | P | ||
| Breast Cancer | Pathology reporting: pT and pN category and histologic grade | None | Other | ||
| CABG | Use of internal mammary artery | None | P | ||
| CABG | Pre-operative beta blocker | None | P | ||
| CABG | Prolonged intubation* | None | O | ||
| CABG | Deep sternal wound infection rate* | None | O | ||
| CABG | Stroke/CVA* | None | O | ||
| CABG | Post operative renal insufficiency* | None | O | ||
| CABG | Surgical re-exploration* | None | O | ||
| CABG | Anti-platelet medication at discharge* | None | P | ||
| CABG | Beta blocker at discharge* | None | P | ||
| CABG | Lipid management and counseling* | None | P | ||
| Cancer | Medical and radiation-plan of care for pain* | None | P | ||
| Cancer | Pain intensity quantified* | None | P | ||
| Cancer | Radiation dose limits to normal tissue* | None | P | ||
| Cataracts | Comprehensive preoperative assessment for surgery with IOL replacement* | None | P | ||
| Catheter-Associated Bloodstream Infections | Prevention - central venous catheter insertion protocol | None | P | ||
| Chronic Kidney Disease (CKD) | Laboratory Testing (calcium, phosphorus, iPTH and lipid profile) | None | P | ||
| CKD | Blood pressure management | None | P | ||
| CKD | Plan of care; elevated hemoglobin for patients receiving Erythropoiesis Stimulating Agents | None | P | ||
| CKD | Influenza immunization* | None | P | ||
| CKD | Referral for AV Fistula* | None | P | ||
| Chronic Lymphocytic Leukemia | Baseline flow cytometry | None | P | ||
| Chronic Obstructive Pulmonary Disease (COPD) | Spirometry evaluation | None | P | ||
| COPD | Bronchodilator therapy | None | P | ||
| Colon Cancer | Chemotherapy for stage III patients | None | P | ||
| Community Acquired Bacterial Pneumonia (PN) | Vital Signs | None | P | ||
| PN | Assessment of oxygen saturation | None | P | ||
| PN | Assessment of mental status | None | P | ||
| PN | Appropriate antibiotic selection | Hospital Inpatient | P | ||
| Colorectal Cancer | Pathology reporting: pT and pN category and histologic grade | None | Other | ||
| Coronary Artery Disease (CAD) | Oral antiplatelet therapy prescribed | None | P | ||
| CAD | Beta blocker therapy for patients with prior MI | None | P | ||
| CAD | ACE inhibitor or ARB therapy | None | P | ||
| CAD | Lipid profile* | None | P | ||
| Depression | Antidepressant medication during acute phase for patients with new episode of major depression | None | P | ||
| Depression | Diagnostic evaluation | None | P | ||
| Depression | Assessed for suicide risk | None | P | ||
| Diabetes | Hemoglobin A1C poor control | None | IO | ||
| Diabetes | LDL control | None | IO | ||
| Diabetes | Blood pressure control | None | IO | ||
| Diabetes | Dilated eye exam | None | P | ||
| Diabetes | Urine screening or medical attention for nephropathy | None | P | ||
| Diabetes | Foot exam* | None | P | ||
| Diabetes | Foot and ankle care: neurological evaluation | None | P | ||
| Diabetes | Foot and ankle care: evaluation of footwear | None | P | ||
| Diabetic Retinopathy | Documentation of presence or absence of macular edema and level of severity of retinopathy | None | P | ||
| Diabetic Retinopathy | Communication with the physician managing ongoing diabetes care | None | P | ||
| Endarterectomy | Use of patch during conventional endarterectomy* | None | P | ||
| ESRD | Influenza vaccination | None | P | ||
| ESRD | Plan of care for inadequate hemodialysis | None | P | ||
| ESRD | Plan of care for inadequate peritoneal dialysis | None | P | ||
| ESRD | Hemodialysis vascular access-placement of autogenous arterial venous fistula* | None | P | ||
| ESRD (pediatric) | Adequacy of hemodialysis* | None | IO | ||
| ESRD (pediatric) | Influenza immunization* | None | P | ||
| Falls | Plan of care* | None | P | ||
| Falls | Risk assessment* | None | P | ||
| Glaucoma | Optic nerve evaluation | None | P | ||
| Glaucoma | Reduction of intraocular pressure by 15% or documentation of a plan of care* | None | IO | ||
| Heart Failure | ACE-I or ARB for LVSD | Hospital Inpatient | P | ||
| Heart Failure | Beta blocker therapy for LVSD | None | P | ||
| Hepatitis C | Testing for Hepatitis C Viremia | None | P | ||
| Hepatitis C | RNA testing prior to treatment | None | P | ||
| Hepatitis C | HCV genotype testing prior to therapy | None | P | ||
| Hepatitis C | Consideration of antiviral therapy | None | P | ||
| Hepatitis C | HCV RNA testing at week 12 of therapy | None | P | ||
| Hepatitis C | Hepatitis A vaccination* | None | P | ||
| Hepatitis C | Hepatitis B vaccination* | None | P | ||
| Hepatitis C | Counseling regarding use of alcohol | None | P | ||
| Hepatitis C | Counseling regarding use of contraception prior to starting antiviral therapy | None | P | ||
| HIV/AIDS | CD4+ cell count or CD4+ percentage* | None | P | ||
| HIV/AIDS | Pneumocystis Jiroveci Pneumonia prophylaxis* | None | P | ||
| HIV/AIDS | Adolescent and adult patients with HIV/AIDS who are prescribed potent antiretroviral therapy* | None | P | ||
| HIV/AIDS | HIV RNA control after 6 months of potent antiretroviral therapy* | None | P | ||
| Lung, Esophageal Cancer | Recording of clinical stage* | None | Other | ||
| Melanoma | Follow-up aspects of care* | None | P | ||
| Melanoma | Continuity of care-recall system* | None | S | ||
| Melanoma | Coordination of care* | None | P | ||
| Multiple Myeloma | Treatment with bisphosphonates | None | P | ||
| Myelodysplastic Syndrome (MDS) | Documentation of iron stores in patients receiving erythropoietin | None | P | ||
| MDS and Acute Leukemia | Baseline cytogenetic testing performed on bone marrow | None | P | ||
| Non Traumatic Chest Pain | Electrocardiogram performed | None | P | ||
| Nuclear Medicine | Correlation with existing imaging studies for patients undergoing bone scintigraphy* | None | P | ||
| Osteoarthritis | Assessment of pain and function | None | P | ||
| Osteoarthritis | Assessment for use of anti-inflammatory or analgesic over the counter medications* | None | P | ||
| Osteoporosis | Communication with the physician managing ongoing care post-fracture | None | P | ||
| Osteoporosis | Screening or therapy for women aged 65 and older | None | P | ||
| Osteoporosis | Management following fracture | None | P | ||
| Osteoporosis | Pharmacologic therapy | None | P | ||
| Otis Media with Effusion (OME) | Diagnostic evaluation | None | P | ||
| OME | Hearing testing | None | P | ||
| Perioperative Care | Timing of antibiotic prophylaxis-ordering physician | None | P | ||
| Perioperative Care | Timing of antibiotic prophylaxis-administering physician | Hospital Inpatient & Hospital Outpatient | P | ||
| Perioperative Care | Selection of prophylactic antibiotic | Hospital Inpatient & Hospital Outpatient | P | ||
| Perioperative Care | Discontinuation of prophylactic antibiotic (cardiac procedures) | None | P | ||
| Perioperative Care | Discontinuation of prophylactic antibiotic (non-cardiac procedures) | Hospital Inpatient | P | ||
| Perioperative Care | Venous thromboembolism (VTE) prophylaxis | Hospital Inpatient | P | ||
| Pharyngitis | Appropriate testing for children | None | E | ||
| Prev/Screening | Medication reconciliation after discharge from inpatient setting | None | P | ||
| Prev/Screening | Advance care plan | None | P | ||
| Prev/Screening | Influenza vaccination for patients > 50 | SNF | P | ||
| Prev/Screening | Pneumonia vaccination for patients > 65 | SNF | P | ||
| Prev/Screening | Screening mammography | None | P | ||
| Prev/Screening | Colorectal cancer screening | None | P | ||
| Prev/Screening | Inquiry regarding tobacco use | None | P | ||
| Prev/Screening | Advising smokers to quit | None | P | ||
| Prev/Screening | Universal weight screening and follow-up | None | P | ||
| Prev/Screening | Universal documentation and verification of current medications in the medical record | None | P | ||
| Prev/Screening | Pain assessment prior to initiation of patient treatment | None | P | ||
| Prev/Screening | Screening for clinical depression | None | P | ||
| Prev/Screening | Screening for alcohol abuse* | None | P | ||
| Prev/Screening | Endoscopy and polyp surveillance-interval in patients with history of adenomatous polyps* | None | P | ||
| Prev/Screening | Elder maltreatment screen with follow-up plan* | None | P | ||
| Prostate Cancer | Inappropriate use of bone scan for staging low risk patients | None | E | ||
| Prostate Cancer | Adjuvant hormonal therapy for high-risk prostate cancer patients | None | P | ||
| Prostate Cancer | Three dimensional radiotherapy | None | P | ||
| Radiology | Exposure time reported for procedures using fluoroscopy* | None | Other | ||
| Radiology | Inappropriate use of "probably benign" assessment category in mammography screening* | None | P | ||
| Rheumatoid Arthritis (RA) | Disease modifying anti-rheumatic drug therapy | None | P | ||
| RA | Tuberculosis screening* | None | P | ||
| RA | Periodic assessment of disease activity* | None | P | ||
| RA | Functional limitation assessment* | None | P | ||
| RA | Assessment and classification of disease prognosis* | None | P | ||
| RA | Glucocorticoid management* | None | P | ||
| Stroke | CT or MRI reports | None | Other | ||
| Stroke | Carotid imaging reports | None | Other | ||
| Stroke | DVT for ischemic stroke or intracranial hemorrhage | None | P | ||
| Stroke | Discharged on antiplatelet therapy | None | P | ||
| Stroke | Anticoagulant therapy for atrial fibrillation at discharge | None | P | ||
| Stroke | Tissue Plasminogen Activator (t-PA) considered | None | P | ||
| Stroke | Screening for dysphasia | None | P | ||
| Stroke | Consideration of rehabilitation services | None | P | ||
| Syncope | Electrocardiogram performed | None | P | ||
| Upper Respiratory Infection | Appropriate treatment for children | None | E | ||
| Urinary Incontinence (UI) | Assessment of presence or absence in women aged 65 years and older | None | P | ||
| UI | Characterization of UI in women aged 65 years and older | None | P | ||
| UI | Plan of care for women aged 65 years and older | None | P | ||
| Wound care | Use of compression care in patients with venous ulcers* | None | P | ||
| NA | Functional outcome assessment in chiropractic care* | None | P | ||
| NA | Adoption/use of health information technology (electronic health records) | None | S | ||
| Skilled Nursing Facilities (SNFs) | |||||
| Long-Stay: | |||||
| Prevention | Residents given influenza vaccination during the flu season | PQRI | P | ||
| Prevention | Residents assessed and given pneumococcal vaccination | PQRI | P | ||
| NA | Residents whose need for help with daily living activities has increased | None | F | ||
| Pain | Residents who have moderate to severe pain | None | O | ||
| Pressure Sores | High risk residents who have pressure sores | None | O | ||
| Pressure Sores | Low risk residents who have pressure sores | None | O | ||
| NA | Residents who were physically restrained | None | O | ||
| Depression/Anxiety | Residents who are more depressed or anxious | None | O | ||
| Incontinence | Residents who lose control of their bowels or bladder | None | F | ||
| UI | Residents who have had a catheter inserted and left in their bladder | None | P | ||
| NA | Residents who spent most of their time in a bed or in a chair | None | F | ||
| NA | Residents whose ability to move about and around their room got worse | None | F | ||
| Urinary Tract Infection | Residents with a urinary tract infection | None | O | ||
| Weight Loss | Residents who lost too much weight | None | O | ||
| Short-Stay: | Prevention | Residents given influenza vaccination during the flu season | PQRI | P | |
| Prevention | Residents assessed and given pneumococcal vaccination | PQRI | P | ||
| Delirium | Residents with delirium | None | O | ||
| Pain | Residents who had moderate to severe pain | None | O | ||
| Pressure Sores | Residents with pressure sores | None | O | ||
| Home Health | |||||
| NA | Improvement in ambulation/locomotion | None | F | ||
| NA | Improvement in bathing | None | F | ||
| NA | Improvement in transferring | None | F | ||
| NA | Improvement in management of oral medication | None | F | ||
| Pain | Improvement in pain interfering with activity | None | F | ||
| Dyspnea | Improvement in dyspnea | None | F | ||
| UI | Improvement in urinary incontinence | None | F | ||
| NA | Improvement in the status of surgical wounds | None | F | ||
| NA | Patients requiring acute care hospitalization | None | O | ||
| NA | Patients requiring emergent care | None | O | ||
| NA | Patients requiring emergent care for wound infections | None | O | ||
| NA | Patients discharged to the community | None | O | ||
| Dialysis Facilities | |||||
| ESRD | Anemia control | None | IO | ||
| ESRD | Hemodialysis adequacy | None | P | ||
| ESRD | Patient survival | None | O | ||
| Note: P=Process, O=Outcome, E=Efficiency, IO=Intermediate Outcome, F=Functioning, S=Structural, PE=Patient Experience * Indicates measure was added for the 2009 reporting year |
|||||
Alignment and Coordination of Performance Measures Across Medicare Provider Settings
We evaluated the extent of alignment and coordination of measures across the six performance measurement programs. By alignment we mean whether the measures included in these programs address the same conditions or procedures. For conditions and procedures that are addressed by more than one program, we then assess whether the programs include similar measures for that condition or procedure, which we refer to as "overlap." This determination was based on measure titles; we did not obtain actual measure specifications to determine whether the measures were exactly the same. We also provide a brief discussion of the range of measures for conditions or procedures that are addressed in multiple programs.
The performance measures reported in the six settings cover 53 different conditions or procedures as well as patient experience in the hospital setting, the presence of health information technology in physician offices, and some health and functional status measures that are not disease/condition specific for skilled nursing facilities and home health. Of the 249 measures reported in total, 224 (90 percent) are reported only for a single setting. There are some cases where the same conditions are addressed by the various reporting programs, although identical measures are not being collected across the different settings being measured. Table 4 summarizes the type of conditions, diseases, and procedures that are currently addressed to greater or lesser extents by the various reporting programs. Only ten conditions are addressed by performance measurement programs for more than one setting. Three conditions/diseases/procedures are included in programs for three settings: acute myocardial infarction, perioperative/surgical care, and urinary incontinence. Seven conditions are included in programs for two settings: back pain, community acquired pneumonia, depression, end stage renal disease, heart failure, pain, and prevention.
| Conditions/Diseases/ Procedures | # of Reporting Programs Addressing Condition | Hospital Inpatient (RHQDAPU) |
Hospital Outpatient (HOP QDRP) |
Physicians Practitioners Therapist (PQRI) |
Skilled Nursing Facilities | Home Health | Dialysis Facilities |
|---|---|---|---|---|---|---|---|
| Acute Myocardial Infarction | 3 | X | X | X | |||
| Perioperative /Surgical Care | 3 | X | X | X | |||
| Urinary Incontinence | 3 | X | X | X | |||
| Back Pain | 2 | X | X | ||||
| Community Acquired Bacterial Pneumonia | 2 | X | X | ||||
| Depression | 2 | X | X | ||||
| End Stage Renal Disease | 2 | X | X | ||||
| Heart Failure | 2 | X | X | ||||
| Pain | 2 | X | X | ||||
| Prevention | 2 | X | X | ||||
| Abdominal Aortic Aneurysm | 1 | X | |||||
| Acute Bronchitis | 1 | X | |||||
| Acute Leukemia | 1 | X | |||||
| Acute Otitis Externa | 1 | X | |||||
| Asthma | 1 | X | |||||
| Breast Cancer | 1 | X | |||||
| Cataracts | 1 | X | |||||
| Catheter-Associated Blood Stream Infections | 1 | X | |||||
| Chronic Kidney Disease | 1 | X | |||||
| Chronic Lymphotic Leukemia | 1 | X | |||||
| Chronic Obstructive Pulmonary Disease | 1 | X | |||||
| Colon Cancer | 1 | X | |||||
| Coronary Artery Bypass Graft | 1 | X | |||||
| Coronary Artery Disease | 1 | X | |||||
| Delirium | 1 | X | |||||
| Diabetes | 1 | X | |||||
| Diabetic Retinopathy | 1 | X | |||||
| Dsypnea | 1 | X | |||||
| Endarterectomy | 1 | X | |||||
| Falls | 1 | X | |||||
| Glaucoma | 1 | X | |||||
| Hepatitis C | 1 | X | |||||
| Imaging | 1 | X | |||||
| Incontinence (Bowel) | 1 | X | |||||
| Macular Degeneration | 1 | X | |||||
| Multiple Myeloma | 1 | X | |||||
| Myelodyplastic Syndrome | 1 | X | |||||
| Non-Traumatic Chest Pain | 1 | X | |||||
| Osteoarthritis | 1 | X | |||||
| Osteoporosis | 1 | X | |||||
| Otis Media with Effusion | 1 | X | |||||
| Pharyngitis | 1 | X | |||||
| Pneumothorax | 1 | X | |||||
| Pressure Sores | 1 | X | |||||
| Prostate Cancer | 1 | X | |||||
| Rectal Cancer | 1 | X | |||||
| Rheumatoid Arthritis | 1 | X | |||||
| Stroke | 1 | X | |||||
| Syncope | 1 | X | |||||
| Upper Respiratory Infection | 1 | X | |||||
| Urinary Tract Infection | 1 | X | |||||
| Weight Loss (Undesired) | 1 | X | |||||
| Wound Care | 1 | X |
* Includes measures that will be reported in 2009.
Below we describe the areas of alignment and overlap by condition or type of care. For the nine conditions addressed by more than one performance measurement program, Table 5 list the individual measures by condition and indicates the areas of overlap.
- Acute myocardial infarction measures are included in the RHQDAPU (9 measures), HOP QDRP (5 measures) and PQRI (1 measure) reporting programs. An "aspirin at arrival" measure is included in all three reporting efforts, while fibrinolytic medication received within 30 minutes of hospital arrival is included in RHQDAPU and HOP QDRP.27 RHQDAPU includes a measure of the receipt of PCI within 120 minute of arrival, while HOP QDRP has a measure examining the median time to transfer for PCI. The remaining measures in the programs do not overlap. Of the 15 measures in the three programs, ten focus on either the care received upon arrival of the patient to the hospital or the time it took the patient to receive recommended care, four address prescriptions or counseling received at discharge from the hospital and one is a longer-term patient outcome.
- Perioperative /Surgical care - measures are included in the RHQDAPU (11 measures), HOP QDRP (2 measures), and PQRI (6 measures) reporting programs. Measures related to the timing of the ordering and the selection of prophylactic antibiotics for surgical patients are included in all three programs, while measures on the discontinuation of these prophylactic antibiotics are included only in RHQDAPU and PQRI. A measure on the ordering of venous thromboembolism prophylaxis is included in both RHQDAPU and PQRI; a measure on the actual administration is included only in RHQDAPU. RHQDAPU also includes measures for appropriate hair removal and post-operative serum glucose control for cardiac patients and several surgical outcome measures.
| Measure | Hospital Inpatient(RHQDAPU) | Hospital Outpatient (HOP QDRP) | Physicians Practitioners Therapist (PQRI) | Skilled Nursing Facilities | Home Health | Dialysis Facilities | |||
|---|---|---|---|---|---|---|---|---|---|
| Conditions Addressed by Three Reporting Programs | |||||||||
| Acute Myocardial Infarction (AMI) | |||||||||
| Aspirin at arrival (For HOP QDRP, applies to emergency department transfers) | X | X | X | ||||||
| Aspirin prescribed at discharge | X | ||||||||
| ACE-I or ARB for LVSD | X | ||||||||
| Adult smoking cessation advice/counseling | X | ||||||||
| Beta blocker at arrival | X | ||||||||
| Beta blocker prescribed at discharge | X | ||||||||
| Fibrinolytic medication received within 30 minutes of hospital arrival (For HOP QDRP, applies to emergency department transfers) | X | X | |||||||
| Emergency department transfer: median time to fibrinolysis | X | ||||||||
| PCI received within 120 minutes of hospital arrival | X | ||||||||
| Emergency department transfer: median time to transfer for primary PCI | X | ||||||||
| Emergency department transfer: median time to electrocardiogram | X | ||||||||
| 30-day AMI mortality | X | ||||||||
| Perioperative/Surgical Care | |||||||||
| Timing of antibiotic prophylaxis-ordering physician | X | ||||||||
| Timing of administration of prophylactic antibiotic for surgical patients | X | X | X | ||||||
| Prophylactic antibiotic selection for surgical patients | X | X | X | ||||||
| Prophylactic antibiotics discontinued within 24 hours after surgery end time: (For PQRI separated into cardiac and non-cardiac procedures) | X | X
(2 measures) |
|||||||
| Surgery patients with recommended venous thromboembolism prophylaxis ordered | X | X | |||||||
| Surgery patients with recommended venous thromboembolism prophylaxis received within 24 hours prior to or after surgery | X | ||||||||
| Cardiac patients with controlled 6 am post-operative serum glucose | X | ||||||||
| Surgery patients with appropriate hair removal | X | ||||||||
| Surgery patients on a beta blocker prior to arrival who received a beta blocker during the perioperative period | X | ||||||||
| Death among surgical patients with treatable serious complications | X | ||||||||
| Postoperative wound dehiscence | X | ||||||||
| Mortality for selected surgical procedures (composite) | X | ||||||||
| Urinary Incontinence (UI) | |||||||||
| Assessment of presence or absence of UI in women aged 65 years and older | X | ||||||||
| Characterization of UI in women aged 65 years and older | X | ||||||||
| Plan of care for women aged 65 years and older | X | ||||||||
| Improvement in urinary incontinence | X | ||||||||
| Residents who have had a catheter inserted and left in their bladder | X | ||||||||
| Conditions Addressed by Two Reporting Programs | |||||||||
| Community Acquired Bacterial Pneumonia (PN) | |||||||||
| Oxygenation assessment | X | ||||||||
| Blood culture performed in the emergency department before the first antibiotic received in hospital | X | ||||||||
| Appropriate initial antibiotic selection | X | X | |||||||
| Initial antibiotic received within 4 hours | X | ||||||||
| Assessed and given pneumococcal vaccination | X | ||||||||
| Assessed and given influenza vaccination | X | ||||||||
| Vital signs | X | ||||||||
| Assessment of mental status | X | ||||||||
| Adult smoking cessation advice/counseling | X | ||||||||
| 30-day PN mortality | X | ||||||||
| Depression | |||||||||
| Antidepressant medication during acute phase for patients with new episode of major depression | X | ||||||||
| Patients who have major depression disorder who meet DSM IV criteria | X | ||||||||
| Assessed for suicide risk | X | ||||||||
| Residents who are more depressed or anxious | X | ||||||||
| ESRD | |||||||||
| Plan of care for inadequate peritoneal dialysis | X | ||||||||
| Vascular access for patients undergoing hemodialysis | X | ||||||||
| Influenza vaccination | X | ||||||||
| Plan of care for inadequate hemodialysis | X | ||||||||
| Adequacy of hemodialysis (pediatric) | X | ||||||||
| Influenza vaccination (pediatric) | X | ||||||||
| Anemia control | X | ||||||||
| Hemodialysis adequacy | X | ||||||||
| Patient survival | X | ||||||||
| Heart Failure - (HF) | |||||||||
| Left ventricular function assessment | X | ||||||||
| ACE-I or ARB for LVSD | X | X | |||||||
| Beta blocker therapy for LVSD | X | ||||||||
| Adult smoking cessation advice/counseling | X | ||||||||
| Discharge instructions | X | ||||||||
| 30-day HF mortality | X | ||||||||
| 30-day HF readmission | X | ||||||||
| Pain | |||||||||
| Improvement in pain interfering with activity | X | ||||||||
| Residents who had moderate to severe pain | X | ||||||||
| Prevention/Screening | |||||||||
| Medication reconciliation after discharge from inpatient setting | X | ||||||||
| Advance care plan | X | ||||||||
| Influenza vaccination for patients > 50 (for SNF measure: residents during flu season) | X | X | |||||||
| Pneumonia vaccination for patients > 65 (for SNF measure: residents assessed and given vaccination) | X | X | |||||||
| Screening mammography | X | ||||||||
| Colorectal cancer screening | X | ||||||||
| Inquiry regarding tobacco use | X | ||||||||
| Advising smokers to quit | X | ||||||||
| Universal weight screening and follow-up | X | ||||||||
| Universal documentation and verification of current medications in the medical record | X | ||||||||
| Pain assessment prior to initiation of patient treatment | X | ||||||||
| Screening for clinical depression | X | ||||||||
| Screening and brief counseling for alcohol abuse | X | ||||||||
| Endoscopy and polyp surveillance | X | ||||||||
| Elder maltreatment screen with follow-up plan | X | ||||||||
| * Includes measures that will be reported in 2009. | |||||||||
* Includes measures that will be reported in 2009.
- Urinary incontinence measures are included in the PQRI (3 measures), HHQI (1 measure), and NHQI (1 measure) reporting programs. NHQI includes a second measure that addresses both urinary and bowel incontinence. None of the measures in the three programs overlap. The PQRI measures focus on the identifying and characterizing urinary incontinence, and putting in place a treatment plan. The SNF NHQI measure focuses on the use of use of catheters being inserted and left in the bladder of residents with urinary incontinence. The HHQI measure focuses on improvement in urinary incontinence.
- Pneumonia measures are included in RHQDAPU (7 measures) and PQRI (4 measures) reporting programs. Both programs include measures on appropriate initial antibiotic selection. The other measures in the programs do not overlap. The other three PQRI pneumonia measures focus on the patient's oxygen saturation, vital signs and assessment of mental status. The remaining RHQDAPU pneumonia measures address the performance of blood cultures prior to receipt of antibiotics, the timing of antibiotic administration, assessment for and administration of pneumococcal and influenza vaccinations, smoking cessation advice and 30-day mortality.
- Depression measures are included in the PQRI (3 measures) and NHQI (1 measure) reporting programs. While both PQRI and NHQI measures focus on the assessment of depression, the specifications differ so the measures are not completely aligned. Two PQRI measures focus on the use of antidepressants and assessing depressed patients for their suicide risk and do not appear as measures in any other setting.
- End stage renal disease is addressed by two programs: PQRI (6 measures) and the dialysis facility program (3 measures). The PQRI measures focus on vascular access for patients receiving hemodialysis, influenza vaccination status and care plans (2 measures) for ESRD patients as well as two pediatric measures, while the measures in the dialysis facility program focus on anemia control, hemodialysis adequacy and ESRD patient survival.
- Heart failure measures are included in the RHQDAPU (6 measures) and PQRI (2 measures) reporting programs. Both programs include a measure assessing the receipt of ACE-inhibitors or ARB for LVSD. - Other RHQDAPU measures focus on left ventricular function assessment, care around the time of discharge from the hospital, 30-day mortality, and 30 day readmission. PQRI includes a measure on the use of beta blocker therapy for LVSD, which is not included in RHQDAPU.
- Pain measures are found in two reporting programs. The NHRI includes two measures, one for long stay patients and one for short stay patients that assess the presence of moderate to severe pain. The HHQI program includes a measure on improvement in the extent to which pain affects functioning.
- Prevention/Screening measures are contained in the PQRI program (15 measures), and the NHQI includes 4 measures (two for long-term stay residents and two for short stay residents). The nursing home measures (receipt of influenza vaccination during the flu season, and pneumococcal vaccination) are analogous to two of the measures in PQRI. PQRI also has an influenza vaccination measure that focuses on patients with ESRD (therefore, this measure is counted under ESRD). In addition, PQRI includes a variety of screening, counseling, care planning and immunization measures. RHQDAPU also includes the two vaccination measures for influenza and pneumococcal, but limits the eligible population to individuals hospitalized with community acquired pneumonia (therefore, these measures are counted under pneumonia).
Summary
In recent years, in an effort to assure quality health care, CMS has implemented performance measurement programs for six health care settings: hospital inpatient, hospital outpatient, physician services, skilled nursing facilities, home health care agencies, and dialysis facilities, that include a mixture of financial (for reporting) and non-financial (public reporting) incentives. Collectively, these programs include 249 measures that cover a broad array of measure types and clinical areas. The alignment of these programs, however, is relatively limited. Only ten clinical conditions are addressed by more than one reporting program, and seven of these are addressed by only two programs. The conditions addressed by more than one program have very little overlap of the actual measures or very similar measures included in more than a single program. Thus, the current set of performance measures offer little opportunity to use the performance reporting programs to create joint accountability for the care delivered to patients. This could change, however, as additional measures are included in the programs, particularly if efforts are undertaken to increase alignment of measures across programs and to expand out measures within clinical conditions to address relevant care delivered in various settings.
4. Literature Review and Expert Discussions
In this chapter, we summarize our findings from a systematic review of the literature on the use and proposed use of episode-based approaches to payment, performance measurement, and accountability. We also present the results from our discussions with a small set of experts, where we explored issues related to constructing and using episodes of care for the purposes of performance measurement and accountability to better align financial and non-financial incentives to deliver high quality, efficient and coordinated care across an episode of illness or injury.
We organized our review and discussions around four questions:
- How have payment and performance measurement been applied using episodes of care as a basis for payment and performance measurement?
- What types of episode constructions have been used or proposed for use in the context of payment and/or performance measurement?
- How can accountability for episodes be assigned when multiple providers and settings are involved?
- How has risk adjustment of episodes of care been performed or proposed?
Methods
We searched the databases PubMed, SSRN, EconLit, Sociological Abstracts, Business Practices and Management, and Conference Proceedings for articles published between January 1, 1985 and December 31, 2007. Search terms included episode AND payment OR reimbursement OR performance OR quality; bundl* AND payment OR reimbursement OR performance OR quality; episode AND attribution; bundl* AND attribution; virtual AND provider AND network; accountable AND organization AND payment OR quality; assign* AND responsibility AND physician OR provider; "physician-hospital organization"; "medical home"; "primary care" AND pay* AND responsibility. We added additional references from a previously conducted systematic review of health care efficiency measures, which use episodes of care as the unit of measurement (McGlynn et al., 2008). - We also searched the gray literature for related publications by organizations including CMS, the Medicare Payment Advisory Commission (MedPAC), the Commonwealth Fund, the NQF, and the Leapfrog Group. We performed reference mining by searching the bibliographies of retrieved publications for additional relevant publications.
Results
The search terms yielded 465 total references. Of these, 63 were identified as potentially relevant through a screen of the abstracts. To be eligible for inclusion, a publication needed to discuss the use of episodes for performance measurement and/or payment, the attribution of responsibility for the episode of care, or grouping individual services into episodes. - During the abstraction, 26 additional publications were eliminated as either being off topic or not available even through interlibrary loan. An additional 23 publications were included through the search of the gray literature. In total, we reviewed 60 publications and summarize the findings in the sections that follow.
The Application of Episodes of Care
Episodes of Care for Performance Measurement
Current health care quality measurement efforts focus on assessing care for individual indicators of performance for a patient with a specific clinical condition or set of risk factors at discrete points in time (e.g., percent of patients with diabetes who received an HbA1c screening test or percent of women between the ages of 18-54 who received a pap smear). The measurement typically is directed at measuring the actions of a single type of provider, such as the physician or the hospital, and emphasizes assessing the provision of discrete services rather than the full spectrum of services within an episode for any given patient. There are a few cases, more recently, where providers are being held accountable for what percentage of their patient with a particular condition received all recommended services under what is referred to as an appropriate care composite measure, such as for a patient with diabetes (Health Partners, 2007), but again these measurement efforts are limited in scope to providers in a single setting and do not cut across the trajectory of care to involve multiple care settings.
The literature includes a number of proposals for episode-based quality measurement, but most of the proposals have not been tested or implemented. One prominent exception is the use of episodes for measurement of relative resource use, which has become increasingly common in recent years (McGlynn et al., 2008).The IOM has recommended episode-based performance measurement in two recent reports as an approach to address the clinical quality, cost, and outcomes of care (Institute of Medicine Committee on Redesigning Health Insurance Performance Measures, 2006; Institute of Medicine Committee on Redesigning Health Insurance Performance Measures, 2007). The IOM suggested that currently available point-in-time quality measures could be aggregated to the episode level to provide a composite assessment of the quality of care for that episode. An illustration is a Geisinger Health System program where patients undergoing CABG surgery are guaranteed to receive a set of 40 recommended processes of care (Casale et al., 2007). However, significant limitations exist in the number and types of measures for many clinical conditions, specialties and settings of care. Gaps identified by the IOM include transitions across care settings (e.g., hospital to long-term-care facility), patient outcomes over time (e.g., complications of chronic conditions), and measures of the oversupply of services (Institute of Medicine Committee on Redesigning Health Insurance Performance Measures, 2006). The gaps in measures vary by condition, provider type and setting. For example, many currently available diabetes-related measures could be applied to a one-year episode of diabetes care, but most hip fracture-related measures would apply to only the acute portion of the episode of hip fracture care. - -
The NQF is currently examining the joint measurement of quality and cost using episodes as the basis of assessment (National Quality Forum, 2007). In a preliminary report, the NQF recommended development of accountable care entities - either integrated providers or virtual groups - which would be held accountable for the quality and cost of episodes of care instead of individual providers. The NQF's work on how performance would be measured at the episode level is still in development.
MedPAC tested the feasibility of assigning quality indicators related to episodes of care to individual physicians (MedPAC, 2006). However, they did not explicitly perform the quality measurement at the episode level. The quality of care for patients with specific diagnoses was attributed to physicians, and resource use for episodes of care related to the same diagnoses were independently attributed to individual physicians. Both quality measures and resource use measures were attributed based on the number of E&M visits. Using an attribution threshold of 35 percent of E&M visits, the quality of care for 93 percent of patients was attributed to a physician (MedPAC, 2006).
Episodes of Care for Payment
In this section, we discuss ways that episodes have been used or proposed in the literature as the basis of payment, and how payment reform could be aligned with performance measurement. Episode-based performance measurement does not necessarily need to be linked to payment reform. For example, provider performance on episodes of care could be assessed, including both quality of care and relative resource use, and reported back to providers. Public reporting would add an additional incentive for improvement. However, most episode-based approaches discussed in the literature involve a financial incentive linked to performance on the episode.
Different types of financial incentives have been discussed in the literature, and we classified them into two groups based on how they were structured:
- Retrospective adjustment of FFS payments based on resource use and quality during the episode. Some authors proposed withholding a portion of payments and adjusting the withheld amount retrospectively based on resource use during the episode (Jencks and Dobson, 1985; Welch, 1989; Wennberg et al., 2007) . - The withheld payments would be disbursed at the end of a set time period, adjusted on the basis of performance during the episode (Davis and Guterman, 2007; Pham and Ginsburg, 2007) . Conceptually, this model would be similar to a P4P program with incentives based on episode resource use and/or quality. - For example, providers would receive 95 percent of their current payment rate. At the end of the year, providers would receive the 5 percent of payments withheld, with adjustments made so that providers of lower-resource-use/higher-quality episodes received more than 5 percent and providers of higher-resource-use/lower-quality episodes received less than 5 percent. This type of system would not require that current Medicare payment systems be replaced (MedPAC, 2007c). Savings realized by CMS could be shared with providers to support improvements in the quality of care (Wennberg et al., 2007).
- Prospective payment for the episode. Similar to existing Medicare prospective payment systems, such as the IPPS or the home health prospective payment system (which uses a 60-day episode of care as the unit of service), the payment amount for the episode of care would be set prospectively but could be adjusted based on the quality of care for the episode using a pay-for-performance system.
Retrospective adjustment of FFS payments would require smaller, incremental changes to current policy, whereas prospective payment approaches represent a larger reform. As discussed in the introduction, some proposals in the literature have included a phased or "building block" approach beginning with retrospective adjustment of FFS payments, which would require relatively minor changes to Medicare policy, then potentially moving towards a prospective payment approach (e.g., Wennberg et al., 2007).
One issue that surfaces when considering episode-based payments is how to divide a single episode of care payment, when multiple providers are involved in the management of the episode. Options discussed in the literature include allowing an entity that has been assigned accountability for the episode to determine their payment arrangements with other participating providers or paying each provider separately by dividing the payment according to a predetermined formula (e.g., based on current Medicare payment rates) (Davis and Guterman, 2007; Network for Regional Healthcare Improvement, 2007). According to proposals in the literature, the first method would provide greater incentives for coordination of care between providers, since they would need to develop formal arrangements with one another (Network for Regional Healthcare Improvement, 2007; Pham and Ginsburg, 2007). Providers could be encouraged to accept payment through an accountable entity through a bonus, with the option to accept lower, separate payments instead (Wennberg et al., 2007; O'Kane et al., 2008).
Types of Episode of Care Constructions that Have Been Proposed or which Are in Use
A broad variety of episode definitions have been used in practice or proposed in the health policy literature. Episodes could be constructed in a variety of ways, encompassing different parts of the continuum of care. Conceptually, health care services could be aggregated into episodes along two dimensions:
- aggregating related services over time by the same provider, and
- aggregating related services over time that are provided by different providers of care.
Types of Episode Constructions that Have Been Used
(1) Services related to a major inpatient procedure. This type of episode typically bundles together the inpatient and physician services payments related to a major procedure. We found four examples cited in the literature where this type of episode construction has been used for payment and in some cases for quality measurement for coronary artery bypass graft (CABG) surgery.
- Geisinger. This Integrated Delivery System (IDS) recently began accepting payment for all care related to CABG surgery, including preoperative evaluation and workup, inpatient facility and physician services, routine postoperative care, and treatment of complications (Casale et al., 2007; Lee, 2007). The price for the bundle of services was set at a level calculated to cover treatment for 50 percent of the historical rate of complications. Geisinger also guaranteed adherence to 40 processes of care performance measures for CABG, and used adherence to delivering the right care as a basis for a portion of surgeons' payments (Casale et al., 2007). The 40 care processes that are measured were derived from practice guidelines by the Geisinger cardiothoracic surgeons. In the three months following implementation, the team increased adherence from 59 to 100 percent of patients receiving all 40 recommended processes of care. In preliminary results, patients receiving surgery after program implementation experienced fewer adverse events, more discharges to home, and shorter average length of hospital stay compared to otherwise similar Geisinger CABG patients
- Medicare Participating Heart Bypass Center Demonstration. This demonstration, conducted in the early 1990s, tested payment for an episode that included all inpatient and physician services during hospitalization, readmissions within 72 hours, and related physician services during the 90-day global period, but not other pre- and post-discharge physician services (Liu et al., 2001). Payment was made to the hospital, with the hospital and physicians free to divide the payment as they chose (Cromwell et al., 1998). The payment rate was determined through a competitive bidding process (Cromwell et al., 1998). An evaluation of the demonstration's effects on hospital costs found that participating hospitals reduced direct variable costs over the three-year demonstration period and that physicians changed their practice patterns to improve efficiency (Liu et al., 2001). The Medicare program saved an average of 10 percent for bypass patients in demonstration hospitals compared to the predicted Medicare payments in the absence of the demonstration (Cromwell et al., 1998). In-hospital and one-year mortality rates declined in demonstration hospitals after adjustment for patient risk factors, but the rate of reported complications increased slightly (Cromwell et al., 1998). The appropriateness of the CABG procedures was also assessed, but the rate did not change during the demonstration. Finally, CABG patients reported better overall experiences in demonstration hospitals compared to competitor hospitals, and did not report significantly different health outcomes (Cromwell et al., 1998).
- Texas Heart Institute. The Texas Heart Institute accepted a bundled CABG payment similar to that used in the Medicare Participating Heart Bypass Center Demonstration from several private insurers, and later participated in the Medicare demonstration. This arrangement was later expanded to other high-volume cardiology procedures with defined beginning and end points. Standardized diagnostic tests and appropriate optional services were established for each major service and included in the fee, although the treatment standards were sometimes hard to adhere to because of patient diversity (Edmonds and Hallman, 1995). No quality measures were reported. In 1985, the combined facility and physician payment in this program were $13,800 per CABG procedure, compared to an average Medicare payment of $24,558 (Edmonds and Hallman, 1995).
- Medicare Acute Care Episode Demonstration. Medicare is targeting a 2009 implementation for a demonstration that will provide global payments for acute care episodes for orthopedic and cardiovascular inpatient procedures. The Acute Care Episode (ACE) demonstration will provide a bundled payment for both Part A and Part B services provided during a hospital stay, and will possibly include post-acute care in later years. Prices for the bundled payment will be established through competitive bidding.
(2) Services Related to an Outpatient Procedure. In the Cataract Alternative Payment Demonstration, which operated 1993-1996, Medicare tested an episode-based payment for outpatient cataract surgery. The episode included physician and facility fees, intraocular lens costs, and selected pre- and postoperative tests. Payment rates were determined by competitive bidding. The response rate to the demonstration solicitation was very low (3.7 percent). Episode payment rates were negotiated with three participating providers; the payment rates were modestly discounted from non-demonstration payment rates for the same services (2 to 5 percent discount). Patient-level clinical and utilization data were collected using checklists. There was no evidence that service utilization decreased among participating providers during the demonstration compared to a baseline pre-demonstration period. There was also no impact on patient outcomes (e.g., visual acuity, post-operative complications) that could be attributed to the demonstration.
The evaluation contractor, Abt Associates, concluded that the demonstration was a success in meeting its objectives including allowing provider flexibility in managing bundled services, creating incentives for cost-effectiveness, reducing government involvement in pricing services through competitive bidding, and providing insight into quality assurance (Abt Associates Inc., 1997). However, the potential for producing savings while maintaining or improving the quality of care for an episode of cataract surgery was limited, as evidenced by the low participation rate, strong opposition to the demonstration from organized medicine, the low level of savings produced compared to the Participating Heart Bypass Center Demonstration, and the lack of impact on utilization or patient outcomes. These results may have been due in part to declining Medicare cataract surgery payment rates in the years preceding the demonstration, and the low cost of cataract surgery compared to CABG (Abt Associates Inc., 1997). These findings suggest that the potential for achieving the goals of episode-based payment and performance measurement may vary widely between types of episodes.
(3) Contact Capitation for Specialists. In the 1990s, several descriptions were published of "contact capitation" payment arrangements between managed care organizations and specialists in group practices. This episode definition, used for payment, included specialist physician services related to treatment of a particular condition, and in some cases hospital and/or ancillary services (Frank and Roeder, 1999). This type of episode begins with the referral to the specialist and ends after a specified time or clinical endpoint. This method differs from simple capitation in that payment is only triggered if the referral is made (episode begins) and that the provider is only at risk for patients being actively treated for a given condition ("technical risk"). Under simple capitation, the accountable provider assumes the health risks of the defined practice population ("probability risk"). Under contact capitation, the insurer retains the probability risk, but the provider assumes the technical risk for the care episode. This payment arrangement was found to be common among large Independent Practice Associations (IPAs) in the late 1990s (Robinson, 1999). However, the system proved to be administratively complex because of the need for new billing systems that were able to link related services together, and differentiating the bundled services from others that would be paid on a FFS basis (Frank and Roeder, 1999). The literature reviewed did not include any descriptions of quality measurement tied to contact capitation.
Types of Episode Constructions that Have Been Proposed for Use
(1) Services Related to a Hospitalization. Several proposals in the literature have focused on constructing episodes of care related to a hospitalization. The earlier proposals, starting before the implementation of IPPS, focused on payment only. More recently, the proposals have also included a focus on performance measurement. Under current Medicare payment policy, the hospital facility payment covers the hospital's expenditures related to an admission, including hospital-based labor such as nurses, technicians, and housekeeping, laboratory tests, imaging, administration, and capital. The payments are adjusted for service intensity using diagnosis-related groups (DRGs). Outpatient hospital services related to the hospitalization delivered in the three days pre-hospitalization are also bundled into the hospital payment. However, physician services are paid separately, as are all post-discharge services. Medicare measures hospital-level quality indicators, covering the time period of the hospitalization only, through the Hospital Quality Initiative. Here we describe the various alternative bundling approaches that have been proposed, starting with the earliest proposals and concluding with the options most recently considered by MedPAC.
- Physician DRGs. In the first Senate bill introduced on the IPPS in 1983, the design included bundling physician services provided during an inpatient stay, so that the hospital and attending physician would each receive one payment per discharge (Scott, 1988). This provision was omitted from the final legislation, but Congress ordered a study of its feasibility (Jencks and Dobson, 1985; Mitchell, 1985; U. S. Office of Technology Assessment, 1986; Mitchell et al., 1987) . After the feasibility study determined that the financial risk for physicians could be substantial (described below in the discussion of assignment of accountability to individual physicians), the concept was later opposed by the Secretary of Health and Human Services and defeated (Scott, 1988; Welch, 1989) . It was nevertheless the subject of several subsequent analyses (Welch, 1989; Miller and Welch, 1992).
- Radiology, Anesthesiology and Pathology (RAP) DRGs. Next, the concept of the Physician DRG was proposed in reduced form: RAP DRGs, which would bundle radiology, anesthesiology, and pathology physician services with the hospital payment. This proposal was based on the fact that patients do not choose these providers, many of whom have contracts with hospitals (Mitchell and Rosenbach, 1989). RAP DRGs were first proposed by the Reagan administration in 1987, but the provision was deleted from the Medicare reconciliation bill by the House Ways and Means Committee after extensive lobbying by the American Medical Association and other medical organizations. The major objections raised were the incentives for skimping on care and the potential adverse effect on the development of new technologies (Hanson, 1987; Scott, 1988) . Estimation of provider financial risk under RAP DRGs using claims data indicated that the level of risk was acceptably low (Mitchell and Rosenbach, 1989). RAP DRGs were proposed again by the Congressional Budget Office as a deficit-reduction measure for the 1990-94 federal budgets, with estimates of a 1 percent reduction in Medicare spending on physician services (Mitchell and Rosenbach, 1989), but were never enacted.
- Bundling hospital and post-acute care. In the 1990s, a bundled payment for hospital and post-acute care was proposed and rejected (Gardner, 1995; Lee et al., 1996; Welch, 1998) . One feasibility study found that hospital-level financial risk would actually be reduced under this arrangement (Lee et al., 1996), although another study concluded that the hospital financial risk was approximately equal with bundled and unbundled payments (Welch, 1998). Bundling post-acute and inpatient care is part of the possible refinements to the Medicare Acute Care Episode demonstration plan, is currently being considered by MedPAC (MedPAC, 2007c), and has been proposed in several other recent reports from the Commonwealth Fund, among others (Schoen et al, 2007). The American Geriatrics Society has recommended developing performance measures for transitions of care between acute and post-acute settings (AGS, 2007).
- Medicare Acute Care Episode Demonstration. Medicare is currently designing a bundled payment demonstration for selected inpatient cardiovascular and orthopedic episodes that would include inpatient services and post-discharge care (Centers for Medicare and Medicaid Services, 2007a) . Prices for the bundled payment will be established through competitive bidding. It is not clear how performance measurement will be incorporated in the demonstration design. Demonstration sites are expected to be announced in the first quarter of 2009 with implementation of the demonstration expected in fall of 2009.
- Medicare Payment Advisory Commission (MedPAC). Bundling of physician and hospital payments related to a hospitalization is currently being considered by MedPAC for 10 common DRGs ( MedPAC, 2007a; MedPAC, 2007b; MedPAC, 2007c) . Preliminary MedPAC analyses found that physician services contribute little to differences in the cost of hospitalization-related episodes. Costs for imaging and tests were even smaller than those for physician services (MedPAC, 2007c). The analyses showed that including hospital readmissions and post-acute care in the service bundle would potentially produce greater savings (MedPAC, 2007c). MedPAC has separately recommended a P4P program that would be expected to complement this. The measures proposed for use by MedPAC for hospital P4P include the Hospital Quality Initiative measures, risk-adjusted mortality rates for acute myocardial infarction and CABG, NQF endorsed safe practices, and patient experiences with care (Milgate and Cheng, 2006). These are largely the measures that have been implemented in the Medicare Reporting Hospital Quality Data for Annual Payment Update initiative.
(2) Preventive Care and Primary Care Episodes. Several recent articles included proposals to create episodes of care covering preventive care or primary care only, with specialty physician care, hospital care, ancillaries, etc. excluded, with the episode capturing up to a year of time. This episode definition has been proposed as a unit for payment and performance measurement for primary care physicians, under which payment levels would be increased over current levels to cover additional coordination activities (Goroll et al., 2007; Network for Regional Healthcare Improvement, 2007; Pham and Ginsburg, 2007 ; Bodenheimer, 2008). To qualify for the payment, providers may be required to demonstrate that they meet criteria for an "advanced medical home" (Bodenheimer, 2008).
(3) Chronic Care Episodes. Several articles proposed bundling together services related to the management of chronic conditions, including services provided by the physician managing the condition and possibly diagnostic tests, with general primary care physician services, specialists, hospital care, long-term care, etc. paid separately (Berenson, 2007; Davis and Guterman, 2007; Network for Regional Healthcare Improvement 2007) . If the chronic condition is managed by a specialist physician, this definition would be very similar to contact capitation. An existing example is the Medicare payment of physicians for management of end-stage renal disease (ESRD). Medicare pays a monthly capitation payment to nephrologists who manage ESRD patients, including assessments and planning, monitoring of tests and dialysis, and managing anemia and other secondary conditions (Leavitt, 2008). Any care provided by the primary care provider or other specialists (e.g. cardiologist) is paid for separately, as is a hospitalization for a complication of dialysis.
(4) Broader Definitions of Episodes. Several articles have proposed using broader definitions of episodes of care to bundle together all services related to a particular condition for the purposes of performance measurement and / or payment (U. S. Office of Technology Assessment, 1986; Davis and Guterman, 2007; Pham and Ginsburg, 2007) .
One issue in defining these broader episodes is to accurately divide a patient's care into these episodes. For example, a patient with both CAD and diabetes could have a blood test. To which of the two episodes, CAD or diabetes, should that blood test be assigned? Two proprietary episode "grouper" software programs (ETG and MEGS) that bundle claims into episodes based on procedure and/or diagnosis codes have become increasingly popular. However, a recent review found little published literature on the clinical validity of the groupers (McGlynn et al., 2008). CMS has funded a study to study the clinical validity but the study is still ongoing.
Most of the work using these proprietary episode groupers has focused on profiling physicians on their resource use. One study compared Symmetry's Episode Treatment Groups (ETGs), Thomson-Medstat's Medical Episode Groups (MEGs), plus four other groupers for consistency and found "moderate to high" agreement between physician efficiency rankings using the various measures (Thomas et al., 2004). MedPAC has tested ETGs and MEGs on Medicare claims data and recommended using them to provide physicians with reports on resource use as a means to lower use of resources and costs within the Medicare program (MedPAC, 2006). MedPAC's analyses focused on the feasibility of application of the groupers using Medicare data, finding that most Medicare claims could be assigned to episodes, most episodes assigned to physicians, and outliers could be identified. However, each of these steps was sensitive to specifications used. The two groupers were fairly consistent on these measures.
MedPAC has found that costs per episode varied widely for some types of episodes; for example, congestive heart failure and diabetes had twice the cost per episode for ETGs compared to MEGs, highlighting the different approaches to creating episodes taken by the two commercial groupers. Comparing variation in costs between geographic areas, MedPAC found that using episodes as the unit of analyses (for some episode types) versus annual per-capita costs yielded different results ( MedPAC, 2006). A qualitative analysis of the use of episode groupers by private health plans for resource use reporting revealed many technical challenges with implementation (Lake et al., 2007). The technical issues included small episode sample size; difficulty in identifying physicians accurately and consistently using claims identifiers; difficulty aggregating data to practice-level indicators; difficulty in determining which specialties should be held responsible for which episodes; and difficulty in establishing the appropriate comparison groups (Lake et al., 2007).
(5) Prometheus Payment. An alternative method for defining episodes has been proposed for use in the Prometheus Payment program, and this approach also considers using a building block approach to episode construction with each building block seen as a smaller, self-contained episode. - The program proposes to develop an evidence-informed case rate (ECR), which would be a single, risk-adjusted, prospective (or retrospective) payment given to providers across inpatient and outpatient settings to care for a patient diagnosed with a specific condition--in effect the defined "episode" under this model. Payment amounts would be based on the resources required to provide care as recommended in well-accepted clinical guidelines. This model calls for a portion of the payment to be withheld and re-distributed based on provider performance on measures of clinical process, outcomes of care, and patient experience with care received. Ten conditions have been chosen for initial development.28 Some portion of the payment would be bonuses for quality performance using process, outcomes, and patient experience measures (de Brantes and Camillus, 2007). The data sources include both clinical data and claims analysis.
Summary: Episode Construction
A broad variety of episode definitions have been used or proposed. The greatest amount of activity has focused on developing episodes related to a hospitalization. This type of episode has been discussed mainly in terms of payment applications, although recent examples, such as Geisinger's CABG episode, explicitly include the quality of the care provided during the episode. Proprietary episode groupers are commonly used to define broad episodes of care used for resource use measurement. Other types of episodes definitions, such as outpatient procedure episodes or chronic condition episodes, have been used in limited applications of payment and/or performance measurement applications.
Attributing Episodes of Care to Providers
A critical issue within performance measurement is assigning responsibility (also called "attribution") for the services or set of services that are or are not provided to a beneficiary. How an episode is constructed, as illustrated by the building block approach, and then used (e.g., resource use profiling, pay for performance, larger payment and performance measurement reform), implies different issues related to attribution.
An episode-based approach that cuts across the continuum of care would require that accountability for the episode is assigned to an entity or group of entities. The accountable entities would then assume the responsibility for the quality and resource use for a range of services provided during the episode. The accountability could be reinforced in a range of ways, including measurement and reporting of performance and resource use for episodes of care; financial incentives for performance and resource use for episodes of care, or at the extreme, episode-based payment adjusted for performance. In reviewing the literature, we sought to understand how attribution has been addressed either in practice or in concept within the area of performance measurement, as a means to inform the implications of different types of episode constructions and applications.
Our review of the published literature on assignment of accountability for an episode of care revealed two distinct approaches that have been used or proposed for use to assign responsibility:
- Prospective assignment-where an entity assumes accountability for a patient before the episode begins (similar to what occurs under capitation),or
- Retrospective assignment--where an entity is assigned accountability following the episode based on analyses of care patterns.
The main distinction between these two approaches is that under prospective assignment, providers and patients are aware of the accountability before services are delivered, whereas under retrospective assignment accountability is assigned after care is delivered. Prospective assignment of accountability would likely be necessary for prospective payment approaches (the extreme end of the spectrum in the "building block" approach to reform). The retrospective or prospective method for assigning accountability could be used for any of the other approaches discussed.
The entities with accountability can be individual providers, integrated provider organizations, or "virtual groups" - that is, a group of independent providers that create a relationship for the purposes of coordination across the episode of care. Prospective designation allows for some choice by physicians and patients about which providers should be responsible for which patients' episodes of care (Davis, 2007; Pham et al., 2007), but it also creates the possibility of risk selection by incentivizing providers to assume accountability for healthier, more-profitable patients. Several methods for retrospective attribution have been proposed in the literature and are described below.
(1) Individual physician(s). The accountable physician(s) could be identified retrospectively through analysis of claims data, although current provider identifiers imperfectly identify individual physicians and their practice specialty.29 Commonly proposed criteria include a count of Evaluation and Management (E&M) visits or costs, physician specialty type, or some combination thereof (Cheryl Damberg, personal communication, 8/6/2008).
One study examined attribution for a year of care for Medicare beneficiaries to individual physicians (Pham et al., 2007). The major finding was that dispersion of care among multiple providers made retrospective attribution of accountability difficult. Although the study focused on retrospective assignment of accountability, the dispersion of care observed would also likely prevent physicians from prospectively claiming responsibility for patients who receive much of their care from other physicians. - Four assignment algorithms were tested, mirroring assignment methods currently used in pay-for-performance programs. The four algorithms tested were:
- Plurality provider algorithm - beneficiary assigned to physician who provided the greatest number of E&M visits in a given year;
- Plurality primary care physician algorithm - same as (1) only assignment was restricted to primary care physicians;
- Majority provider algorithm - beneficiary assigned to physician who provided >50 percent of E&M visits in a given year;
- Multiple provider algorithm - beneficiary assigned to all providers providing at least 25 percent of E&M visits.
Table 6 summarizes the results of application of these four assignment algorithms. The percentage of all beneficiaries with at least one E&M visit who were assigned to beneficiaries ranged from a low of 65 percent (majority provider algorithm) to a high of 97 percent (multiple provider algorithm). For all four algorithms, on average most Medicare patients a physician treated in a year were not assigned to that physician. That is, most beneficiaries in a physician's practice population received a minority of their E&M services from that physician. This was particularly true for specialists. Under the plurality provider algorithm, which assigns patients to either specialists or generalists, primary care physicians were assigned 39 percent of the beneficiaries for whom they provided services, while specialists were assigned only 6 percent of the beneficiaries they treated. (The study did not test algorithms based on costs rather than visit counts, which would be expected to assign more beneficiaries to specialists.) Care was highly dispersed: under the plurality provider algorithm, in one year the typical beneficiary saw two primary care physicians and five specialists, collectively from four different practices. Higher dispersion of care among physicians was found for patients with more chronic conditions. Many patients also changed physicians year-to-year (based on claims analysis) under all four algorithms.
| Assignment Algorithm | % of Beneficiaries Assigned to a Physician | % of Physician's Patients Assigned to that Physician | % of Beneficiaries Changing Assignment Year-to-Year |
|---|---|---|---|
| (1) Plurality provider | 94 | 12 | 31 |
| (2) Plurality primary care physician | 79 | 47 | 20 |
| (3) Majority provider | 65 | 7 | 37 |
| (4) Multiple provider | 97 | 25 | 27 |
Pham et al. conclude that the dispersion of care observed make it difficult to hold individual physicians accountable for a year of patient care. Episodes of care may be more highly concentrated among physicians, making attribution of accountability for an episode more feasible than for an entire year of care. However, the results also indicate that attribution is very sensitive to the algorithm used, and that each approach likely involves tradeoffs between a number of criteria that may be important.
A RAND study examined the effects of 13 different retrospective attribution rules, in an application where the Symmetry ETG tool was used to construct resource use measures using commercial data from four health plans in Massachusetts (Mehrotra et al., 2007). The 13 rules assignment rules differed on characteristics such as the basis of assignment (e.g. costs versus visits) and whether the episode was assigned to only one or multiple physicians. This study found both significant variation in the fraction of episodes that could be assigned to a physician and also the level of agreement in which physician was held responsible. For example, comparing the results of two different rules found that 50 percent of the episodes were assigned to different physicians. The results demonstrate that different assignment methods can lead to substantially different results on various criteria.
MedPAC conducted several similar analyses, testing assignment of accountability for episodes of care, measured using ETGs and MEGs, to individual physicians. They found that most episodes could be assigned to individual physicians using a threshold of 35 percent of E&M visits. They also explored attribution to multiple providers, but found that few episodes had more than one physician providing more than 35 percent of E&M visits (MedPAC, 2006; MedPAC, 2007d). Some specialties saw a broad range of types of episodes, while other specialties mainly saw a small number of episode types (MedPAC, 2007d).
(2) Individual physician – hospital care only. A variant on assignment of accountability to an individual physician is assignment of services provided during a hospital stay to the attending physician. This model was tested in the study of Physician DRGs mandated by Congress with the implementation of IPPS (Jencks and Dobson, 1985; Mitchell, 1985; Mitchell et al., 1987; Welch, 1989) . The analysis showed that spending on physician services for surgical cases was relatively homogeneous, but that spending for medical cases varied widely. Thus, assignment of responsibility for hospital-based physician services to individual attending physicians would be likely to cause substantial financial risk for the attending physician (Mitchell, 1985; Welch, 1989) . This finding was one of the major reasons that Physician DRGs were not considered further. Subsequent proposals and analyses focused on spreading the financial risk more broadly.
(3) Hospitals. Another attribution approach that has been proposed is to hold hospitals accountable for episodes of care that include a hospitalization in addition to physician services and/or services from other providers, such as skilled nursing facilities (Jencks and Dobson, 1985; Welch, 1989) . One issue that has been raised with this approach is that hospitals may not be able to influence physician and/or post-acute provider care provision (Welch, 1989). One solution that has been tested is gainsharing, which is a payment arrangement by which hospitals incentivize physicians (Wilensky et al., 2006). However, there are several legal restrictions against gainsharing (Wilensky et al., 2006). These regulations are motivated by a concern about the incentives created for skimping on care, selection of healthy patients, and kickbacks from hospitals to physicians for referrals. MedPAC recommended loosening the restrictions against gainsharing given appropriate safeguards for these concerns (MedPAC, 2007). CMS is planning two gainsharing-related demonstrations, the Medicare Hospital Gainsharing Demonstration and the Physician Hospital Collaboration Demonstration (Wilensky et al., 2006).
(4) Integrated Delivery Systems and Physician Group Practices. Existing integrated provider organizations are likely to have the greatest ability to assume responsibility for episodes of care because of the defined relationships between providers (Davis and Guterman, 2007; MedPAC, 2007a; MedPAC, 2007b; MedPAC, 2007c) . For example, integration was considered key to successful implementation of CABG bundling at Geisinger (Casale et al., 2007; Lee, 2007). Examples of integrated organizations with both hospitals and physicians include physician-led multispecialty group practices that also own hospital(s) (e.g., Mayo Clinic, Virginia Mason); hospitals that own physician groups (e.g., Intermountain Healthcare); or physician-hospital organizations (e.g., Advocate Health Partners; these have declined since late 1990s) (Cortese and Smoldt, 2007). However, there are several obstacles to attributing accountability for episodes of care primarily to integrated provider organizations. First, patients have the option to use services outside of the integrated provider organization, limiting control over the episode of care. Second, most physicians are organized in solo or small single-specialty practices, not integrated organizations or large groups (Pham and Ginsburg, 2007). Finally, Medicare currently does not recognize these integrated entities as a provider class eligible for payment (Davis and Guterman, 2007).
(5) Hospital medical staff. This model would assign accountability for acute care episodes to the entire medical staff of a hospital (holding the hospital accountable as well). In most proposals, the medical staff would be defined to comprise both hospital-based physicians such as pathologists and community-based physicians who see patients in the hospital. Since most medical staffs are not true legal organizations, they would have to form new legal entities in order to receive payment, including a performance-based bonus (Jencks and Dobson, 1985; Welch, 1989; Davis and Guterman, 2007) . This would essentially form a multispecialty group practice associated with a hospital (Fisher et al., 2006).
The concept of assigning accountability to a medical staff was initially tested in the context of payment reform after the initial Physician DRG concept - attribution to the attending physician - was defeated (Mitchell et al., 1987; Mitchell and Ellis, 1992) . These claims data analyses showed that paying a medical staff for physician services delivered during hospitalizations involved a more acceptable level of financial risk than paying individual physicians. The concept was then analyzed using claims data as a possible replacement for the Volume Performance Standard (Miller and Welch, 1992). The Volume Performance Standard was meant to control physician spending by linking annual fee schedule updates to the rate of increase in service volume. However, by measuring volume at the national level, the incentive for individual physicians was weak. Creating an equivalent arrangement at a smaller measurement unit, such as the hospital medical staff, would strengthen the incentive. Physician fees would be adjusted based on medical staff resource use in the prior year, so that different hospital staffs would have different payment rates. Neither of these studies explicitly examined quality measurement.
Elliott Fisher and colleagues have tested the feasibility of defining hospital medical staffs, which they call Accountable Care Organizations (ACOs), empirically using insurance claims data (Fisher et al., 2006; Bynum et al., 2007) . The ACOs were designed with the intent to hold them accountable for both quality and resource use. Beneficiaries were assigned to physicians and then through the physicians to hospitals based on service use in a defined time period. Beneficiaries were linked to the physician who was the generalist or medical subspecialist providing the plurality of their ambulatory care visits in a two-year period (the authors did not test how often the assigned physician changed over time). Physicians were assigned to a hospital based on the number of patients for whom they had submitted Part B claims or the number of hospital claims for which they were listed as attending or operating physician during hospitalization. If both of these values were zero, assignment was based on where the patients they treated were hospitalized. Using this method, 94 percent of physicians were assigned to a hospital. One-third of physicians bill at multiple hospitals, but typically provide the majority of their care at one hospital. On average, two-thirds of medical admissions and physician billing for patients were provided by the assigned hospital and medical staff (Bynum et al., 2007) . Tests were favorable for face, discriminant, and predictive validity of assignment (Bynum et al., 2007) . The advantages cited for using ACOs for accountability (compared to individual providers) include larger sample size (98 percent of physicians were assigned to ACOs serving more than 500 Medicare beneficiaries), broader scope of potential performance measures (e.g., measures of the fragmentation of care), and feasibility of including all contributing physicians within the measurement frame. The most important reason for using ACOs as the level of accountability, in the authors' view, is to establish accountability for local decisions about capacity, which drives utilization. In addition, hospitals and extended staffs would have greater incentive to invest in care management and coordination (Fisher et al., 2006). While developed with the intent of assigning a beneficiary to an ACO, the approach could also be used to assign episodes to ACOs and the research has been used as a basis for discussion of episodes by MedPAC in 2007 Commissioners meetings (MedPAC, 2007a; MedPAC, 2007b; MedPAC, 2007c) .
If the medical staff received payments, the organization would then need a process to allocate payment to individual physicians (Miller and Welch, 1992). One model could be contact capitation, where budgets were allocated to departments based on historical costs and then departments paid individual physicians based on productivity (Robinson, 1999). However, if the episode included a significant pre- or post-hospitalization window, it is possible that some physicians providing care would be geographically distant from the hospital (MedPAC, 2007c), which would require the development of alternative methods of payment allocation and performance accountability.
Since the hospital medical staff model uses "virtual" groups as the accountable entities, a significant barrier is the lack of integration between group members. In recent years, relations between physicians and hospitals have become increasingly strained (Fisher et al., 2006; Berenson et al., 2007) . This tension will likely be a significant barrier to holding hospitals and physicians jointly accountable for episodes of care (Pham and Ginsburg, 2007). On the other hand, it is possible that holding hospitals and medical staff jointly accountable for episodes of care could encourage physician-hospital collaboration.
(6) Other Virtual Groups. Some authors have raised the possibility of using other "virtual groups" defined by geographic areas or other characteristics (Davis and Guterman, 2007). No detailed proposals have been made, however.
Summary: Attribution of Accountability
Accountability for an episode of care could be claimed by a provider prospectively or assigned retrospectively. Approaches that have been tested in the literature include assignment to individual physicians, hospitals, hospital medical staffs, integrated delivery systems, and physician group practices. The majority of attribution approaches that have been tested have focused on attribution to a single entity, although several approaches to joint assignment to multiple providers have been tested. Different assignment methods that have been tested have lead to widely different results on various criteria.
Risk Adjustment of Episodes of Care for Payment and Performance Measurement
Most proposals in the literature acknowledge the need to risk-adjust episodes of care for payment and some types of performance measurement, particularly for outcome measures, but little detail on specific risk-adjusters is usually provided. Some articles stated that when the focus is on cost/resource use, it is appropriate to use adjusters that explain variation in the time and costs of services provided instead of health outcomes (Goroll et al., 2007; Network for Regional Healthcare Improvement, 2007) . This suggests that two separate sets of risk adjustment may be appropriate for joint assessment of episode quality and resource use.
Several existing risk-adjusters used in payment/resource use measurement could be applied to episodes of care. Inpatient hospital facility payments are currently adjusted using severity-adjusted diagnosis-related groups (MS-DRGs); these could potentially be used to risk-adjust other services bundled in with the inpatient stay. The episode groupers ETGs and MEGs include concurrent (i.e., based on the same time period covered by the episodes) episode-level severity and patient-level risk adjusters. However, one study found that risk scores for ETGs were essentially unrelated to episode costs (Thomas, 2006). On the contrary, another study found that risk adjustment increased explanatory power for costs for a different episode grouper, Common Treatment Categories (Brailer and Kroch, 1999). MedPAC found that when risk adjusters are applied, patients in higher risk categories have higher average per-episode costs (MedPAC, 2006). The IOM identified risk adjustment and its appropriate use as an area requiring additional research in its report Rewarding Provider Performance (Institute of Medicine Committee on Redesigning Health Insurance Performance Measures, 2007).
Expert Discussions
We held discussions with eight experts to explore issues related to constructing and using episodes of care for the purposes of performance measurement and to better align financial incentives to deliver high quality, efficient and coordinated care across an episode of illness or injury. - Because this area of work is largely in a conceptual state of development, experts were viewed as a key resource for investigating the policy issues of interest, absent published work in this area. The experts were individuals who had experience in one or more of the following areas: 1) constructing episodes of care; 2) using episodes of care for either performance measurement or payment; 3) issues of attribution and case mix adjustment; 4) provision of medical care.
Our discussions with the experts focused on the following topics:
- Approaches to payment and performance measurement that create incentives, both financial and non-financial, within an episode of care, to drive performance improvement and efficiency;
- How to define an episode of care, including, but not limited to our three approaches (single setting, multiple types of providers in a single setting, and then across the continuum of Medicare settings), and whether certain clinical conditions more and less suitable for an episodes-based approaches;
- Attribution issues related to shared versus individual accountability for an episode of care;
- Use of risk-adjustment within episodes of care.
Payment and performance measurement approaches
We asked the experts about a range of episode-based approaches to creating financial and non-financial incentives for performance and efficiency including public reporting/transparency, routine internal feedback for quality improvement, pay for performance, gainsharing between physicians and hospitals, and bundled payments. Many of the experts stated that while non-financial incentives such as public reporting and quality improvement may have some benefit, they believed that financial incentives would be much more effective in effecting change. Some went further to state that smaller financial incentives, such as pay-for-performance payments, would not be sufficient, and that bundled payment would be necessary to achieve significant results, although much more difficult to implement.
Regarding episode-based performance measurement applications, we asked about the adequacy of currently available quality measures - in particular, if the experts perceived problems around alignment of measures between providers and settings, and if they perceived significant gaps. Opinions were somewhat mixed on these issues. Some of the experts raised concerns about the robustness, alignment, and representativeness of currently available measures. They pointed to the numerous gaps in available measures, particularly in the areas of coordination and transitions of care. One expert raised a concern that quality measurement is too difficult to expect that it could be used for some purposes that have been proposed, such as ensuring that there was no skimping on care under bundled payment, where incentives for providing less care exist.
Other experts held the view that quality measurement could be improved for use in episode-based approaches. They pointed towards efforts by the NQF and others in developing measures addressing current gaps. They also described a need for new data collection systems. An example given by one expert is the Society for Thoracic Surgeons database, which includes voluntary submissions by members of clinical data for cardiac surgery patients. This database has allowed more-robust measurement of processes and outcomes for cardiac surgery than for other conditions, allowing for use in episode-based approaches such as the Geisinger heart bypass surgery program. The experts stated that something similar will be necessary for application of episode-based quality measurement to non-cardiac procedures. The adoption of electronic health records was one development that was raised as a possible source of additional clinical data.
Other experts expressed the view that currently available measures are adequate for some uses and that measure availability should not be a barrier to moving forward with episode-based approaches. One expert raised the example of bundled versus separate payments for hospitals and physicians for inpatient care. At the time the inpatient prospective payment system was implemented, many believed that separate payments were necessary in order to create different incentives for physicians and hospitals (physicians are paid FFS and have a financial incentive to provide additional services; hospitals are paid per-discharge and have an incentive to provide fewer services during a hospital stay). However, the expert now believes that quality measurement has now progressed to the point where it can provide a check against financial incentives for both hospitals and physicians to provide less care under bundled payment or gainsharing.
Definition of episodes
We asked experts for their views on the pros and cons of different episode definitions, with particular reference to three potential types of definitions under a building block approach (single setting, multiple types of providers in a single setting, and then across the continuum of Medicare settings). Most experts professed a strong preference for episodes that cut across multiple settings. The main benefit of episode-based approaches to these experts was to create change in the delivery system to reduce fragmentation of care. To these experts, episodes of care that cover only a single setting (e.g., physician and hospital services for inpatient care) do not do enough towards this goal (one expert went as far as to call single-setting approaches "useless"). On the other hand, several experts suggested a different approach: due to the challenges with conducting performance measurement or payment across settings, they suggested focusing on single-setting approaches first, such as gainsharing for physicians and hospitals for inpatient care. If these efforts were successful, the experts believed, they could be expanded to include multiple settings.
When asked about particular conditions or other types of episodes that would be good candidates for initial episode-based approaches, many experts pointed towards high-prevalence, high-cost conditions. The reasons given were that these conditions represented greater potential opportunity for cost-saving and greater volume, which would help balance the variability in content of episodes. Some experts also expressed a preference for starting with episodes that were more discrete (i.e., well-defined beginning and end points).
A particular concern that was flagged my many experts was how to approach complex patients with multiple chronic conditions, who represent a high proportion of Medicare costs. For these patients, experts expressed doubts about whether episodes focusing on each disease separately were appropriate since the patients may be managed more holistically. One expert raised the possibility that treatments for one chronic condition may contraindicate treatments for another, indicating that a more-holistic approach may be preferable to an episode-based approach. Alternative approaches that were raised by experts for complex patients with multiple conditions included medical homes or other arrangements where an organization accepted accountability for performance and a care coordination payment, capitation payment, or other payment for management of multiple conditions.
Attribution
We asked experts for their opinions on various approaches to attribution, including attribution to single versus multiple organizations, prospective versus retrospective attribution, and attribution to integrated versus virtual groups of providers. The area where the experts expressed the strongest opinions was on prospective versus retrospective attribution, where they had differences of opinion. Some experts strongly believed that providers would not "buy in" to episode-based approaches unless they had, at the outset, identified the patients/episodes for which they were accountable, similar to the Medicare Physician Group Practice demonstration model. One expert stated that providers were comfortable with this approach since this was consistent with how they viewed patient care - although they are currently paid per service, they don't tend to think in terms of individual services but rather from when a patient presents with a particular condition until the point where treatment stops. Other experts expressed a concern that very few providers were organized to be able to accept accountability for episodes, and that strong incentives would be required to drive them to organize themselves to do so. Some experts expressed doubts that many providers would voluntarily accept accountability for episodes. These experts favored identifying accountability retrospectively using empirical data, and pointed to studies such as those of "accountable care organizations" of a hospital and associated physicians by Fisher and colleagues as evidence that this approach would be feasible
On a related issue, attribution to real versus virtual groups of providers, there were also differences of opinion. Some experts favored beginning first with allowing integrated provider groups to accept accountability for episodes. Other experts expressed concerns that this would reward existing organizational structures, and that allowing for attribution to virtual groups would allow for more innovation in health care delivery.
Risk adjustment
Most of the experts believed that risk adjustment is very important to episode-based approaches. They pointed to risk adjustment as necessary in order to prevent risk selection by providers and/or insurers. One expert stated that even disregarding other benefits, risk adjustment was necessary to get provider buy-in to episode-based approaches.
However, many of the experts pointed to the difficulty of risk adjustment for care provided over the course of an episode of care, often in multiple settings. Some drew a distinction between risk adjustment models that predict costs, which are relatively well-developed, and models that predict outcomes, which are not well-developed. All of the risk-adjustment models currently in use were considered likely inadequate for use in episode-based approaches. For this reason, other methods for minimizing risk, such as special treatment of outliers, were identified as necessary by several experts.
Summary of Findings from Literature Review and Expert Discussions
Our review of the literature on approaches to episode-based payment and performance measurement found that a wide variety of approaches have been proposed, in some cases with a long history. However, relatively few of the proposed approaches have been implemented and remain largely conceptual in nature. Several approaches have been tested in limited applications in the private sector or Medicare demonstrations. For example, bundled payment for an acute episode of care, accompanied by performance measurement in some applications, has been tested in the Geisinger Health System, Texas Heart Institute, and Medicare Participating Heart Bypass Center Demonstration for CABG surgery. These tests have produced favorable results on the costs and quality of care. However, another approach, the Medicare Cataract Alternative Payment Demonstration, had less favorable results, suggesting that effects may vary for different types of episodes. Other episode-based approaches, such as those based on chronic or preventive care episodes, have been proposed frequently but implemented in very limited applications. Earlier proposals, such as Physician DRGs and RAP DRGs in the 1980s, focused on payment approaches, while more recent proposals focus more on performance measurement, as performance measurement methodology has progressed.
Based on the findings of the review, we conclude that the most commonly used episode-based approach is physician relative resource use measurement using broad episodes of care defined via commercial grouper software. The measures have been used in reports to providers, public reports, and P4P incentive programs. However, very limited evidence is available in the literature on the validity of these approaches, and they have recently faced several legal challenges (Lacewell, 2007; Massachusetts Medical Society, 2008). Many of the experts we interviewed expressed the opinion that while reporting and P4P may have some benefits, larger financial incentives will be necessary to drive meaningful change in the health care delivery system.
A central challenge in episode-based approaches is attribution of accountability to one or multiple providers. A variety of attribution methods have been tested, finding that the results of attribution are highly sensitive to the methods. Some episode-based approaches that have been implemented, such as the Medicare Participating Heart Bypass Demonstration, use prospective designation of accountability, whereby providers assume accountability for a patient population before care is delivered. Episode-based resource measurement, on the other hand, typically uses retrospective attribution to single providers based on utilization and/or costs.
Experts were split on the relative merits of these two approaches. Proponents of prospective designation argued that this approach is necessary for providers to feel "ownership" of an episode of care, while proponents of retrospective designation argued that it enables participation of a larger number of providers, many of whom are not highly integrated with other providers.
Overall, the findings of the literature review suggest episode-based approaches to performance measurement and payment hold promise for improving quality and efficiency through increased coordination over the continuum of care. However, significant methodological and administrative barriers remain to widespread implementation of these approaches.
5. Analysis of Episodes of Care
This chapter summarizes our approach and findings from conducting quantitative analyses of episodes of care data generated from two commercially available episode grouper tools (i.e., Symmetry ETGs and Thomson MEGs). These analyses were intended to explore issues related to the construction and use of episodes of care for the purposes of performance measurement and aligning incentives to deliver high quality care. - We examined a set of episodes that were constructed using existing commercial episode grouper tools as a matter of convenience in an effort to explore a range of issues.30
The episode groupers utilize the primary diagnosis on claim line items to create and place the line items into episode. Thus, a condition consistently coded as a secondary diagnosis will not have its own episode. Only certain types of claims, as determined by procedure and revenue codes, can start an episode such as evaluation and management procedure codes, surgery procedure codes or specific inpatient facility revenue code. Ancillary claims, such as pharmacy and laboratory, and other services can be grouped into an existing episode, but do not start an episode. Each episode that does not represent a chronic condition has a "clean period" during which no claims for that condition can appear before a new episode of the same type can start. This clean period varies by specific episode. -
The goal of this project was not to critique the validity or applicability of existing grouper software tools, or to explicitly compare the tools, but rather to conduct a variety of exploratory analyses to illustrate the types of issues that would need to be considered if performance measurement or financial incentives were to be aligned around an episode of care, regardless of what tool (either de novo or existing) would be used to define an episode. Most of these issues we addressed would benefit from additional analyses to better understand the questions raised by these exploratory analyses.
In considering the findings contained in this report, readers should be aware that the results partly reflect the design features of the two commercially available grouper software tools that were used to construct episodes in this project. As such, other types of episode constructions could yield different results. Additionally, the variation in results observed across states may be an artifact of variations in coding practices in different regions and future work should attempt to understand the extent of variation in coding practices.
Our analyses focused on informing a number of overarching questions:
How much variation is there in the number of episodes, standardized payments for episodes, and the types and combinations of settings in which care was delivered?
To what extent does patient complexity, as assessed by the total number of episodes assigned to a beneficiary, influence what we observe?
What is the impact of various attribution rules, in terms of the percent of episodes that could be attributed to providers under each rule?
How much variation exists across the three states in the number and cost of episodes, the settings in which care was delivered, as well as how well various types of attribution rules worked?
Overview of the Analytic Sample
Figure 1 provides a high-level illustration of the approach used in our analyses. The study population for this work consisted of Medicare FFS beneficiaries who were continuously enrolled in FFS Medicare Part A and Part B for 2004-2006, whose reason for eligibility was their age, and whose primary residence in 2005 was in one of three states: Florida, Oregon, or Texas. As a result of our inclusion criteria, we excluded beneficiaries enrolled in a Medicare Advantage plan for any of the analyses period. Claims data for the medical services received by individuals enrolled in a Medicare Advantage plan are not reported to Medicare, making it impossible to accurately create episodes of care for these individuals. We also excluded individuals who aged into Medicare over the time period of 2004-2006 or were eligible for Medicare due to end-stage renal disease. We did not exclude individuals who died during the time period as long as they met our other eligibility criteria.
The three states included in our analyses were selected in part because we sought states that 1) had a mix of urban and rural areas, 2) would facilitate an understanding of the issues associated with "snowbirds" who spend part of the year in a warm climate, and 3) had variation in the presence of long-term care hospitals to understand the effect their supply may have on the settings in which beneficiaries receive care. Furthermore, careful consideration was given to the geographic areas included in previous episodes of care work performed by MedPAC and Acumen, LLC (on behalf of CMS). -
We used three years of claims data (2004-2006) for the construction of episodes of care. This provides a year of data as the primary period of focus and allows looking forward and backward to complete the episodes. We used Medicare Standard Analytic Files for inpatient (including those for acute care hospitals, long-term care hospitals, critical access hospitals, and inpatient rehabilitation facilities), skilled nursing facility, outpatient, home health agency, carrier (non-institutional providers including physicians, physician assistants, clinical social workers, nurse practitioners, independent clinical laboratories, ambulance providers, and stand-alone ambulatory surgical centers), durable medical equipment and hospice to construct the episodes of care. This project utilized 100 percent of the claims for Medicare FFS beneficiaries who resided in the three states within the specified time frame of the analysis. Thus, we included all of the claims for these Medicare beneficiaries, even if they receive some of their health care services in other states.
Nine Conditions Selected for Analysis
Many of our analyses focused on individuals diagnosed with one or more of a subset of nine clinical conditions in order to better understand similarities and differences between different types of episodes for different types of patients. We sought a mix of acute and chronic conditions that make up a large portion of Medicare cases (i.e., volume) and/or costs. We define and refer to "acute" episodes as those that are time-limited in duration. An acute episode, as used in this report, does not refer to episodes that involve care provided solely in an inpatient acute care hospital setting, although a time-limited event such as a hip fracture episode would involve care in the inpatient hospital setting. Rather, an acute episode is one of short duration (e.g., sinusitis, heart attack, hip fracture), which may touch one or more settings of care including an inpatient acute care hospital.
We also tried to select clinical conditions that cover the spectrum types of conditions and services received by Medicare beneficiaries. For example, we selected a mix of clinical conditions such that some are treated predominantly in a single setting (e.g. ambulatory care) while others are treated in multiple settings including inpatient and post-acute care. To build on the work previously performed by MedPAC, we included some of the clinical conditions that were the focus of their analyses.31 The following conditions are included in our analyses.
- Acute myocardial infarction
- Bacterial pneumonia
- Breast cancer
- Cerebrovascular disease
- Chronic obstructive pulmonary disease
- Congestive heart failure
- Diabetes
- Hip fracture
- Low back pain
These nine clinical conditions were identified using primary and secondary ICD-9 diagnosis codes in 2005 Medicare claims data. For conditions that are part of the CMS Chronic Care Warehouse, we used the CMS definition. For other conditions, we used published definitions from the literature. Appendix A contains the specific codes and the sources of the codes for each of the above listed conditions.
ETGs and MEGs were run by Acumen, LLC on data for the entire study population (not just those with the above-mentioned clinical conditions) to produce summary statistics. Appendix B presents the specific settings Acumen used to run the analyses for this study.
For each condition, we designated episodes as being "related" or "unrelated" to the specific condition. Appendix C lists the specific episodes within each grouper tool that we considered directly related to the conditions of focus. - Some of the "unrelated" episodes reflect comorbid conditions that commonly co-occur with the condition of focus (e.g. hypertension was considered unrelated to acute myocardial infarction).
Figure 1: Overview of Analyses
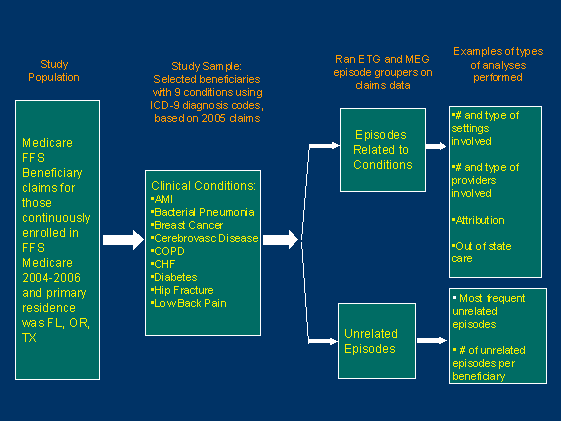
Figure 1 provides a high-level illustration of the approach used in our analyses. The study population for this work consisted of Medicare FFS beneficiaries who were continuously enrolled in FFS Medicare Part A and Part B for 2004-2006, whose reason for eligibility was their age, and whose primary residence in 2005 was in one of three states: Florida, Oregon, or Texas. As a result of our inclusion criteria, we excluded beneficiaries enrolled in a Medicare Advantage plan for any of the analyses period.
Overview of Analyses Conducted
Basic descriptive analyses for each state and episode grouper provide a broad overview of the number of episodes comprised by care delivered to Medicare beneficiaries who reside in the three states. These analyses include such summary statistics such as the number of beneficiaries who are in the analytic sample, the number of created and complete episodes created, percentage of claims that cannot be assigned to episodes, average number of episodes per beneficiary, total Medicare payments represented by claims in the sample, and percentage of episodes and percentage of payments represented by conditions of focus.
Additional detailed analyses focus on the clinical conditions listed above. The analyses presented below examined the settings and number of providers that are included in episodes for each of the conditions to facilitate the exploration of issues around alignment of performance measurement and financial incentives across providers and settings. We investigated the other episodes commonly constructed for these beneficiaries to assist our understanding of the extent to which related care might not be captured in the episodes clearly related to the clinical conditions of focus (e.g. home health care after a hospitalization for congestive heart failure). We also explored a variety of attribution rules that could be used to assign accountability to an individual or multiple providers and types of providers.
Complex patients are a particular interest because a substantial fraction of Medicare beneficiaries have multiple chronic conditions. To facilitate our understanding of whether and how having multiple conditions affects the care received for an episode for the conditions of interest in this project (e.g. the costs of the episode, number of settings in which they receive care, the number of providers they see as part of the episode, and the number of other types of episodes experienced); we stratified many of the condition-specific analyses by the level of comorbidity experienced by patients. We used the total number of episodes experienced by a beneficiary to assess patient burden of comorbidity and created three levels of comorbidity: up to 5 episodes, 6-11 episodes, 12 or more episodes. In terms of the number of episodes experienced by our study population, these categories represent the lowest 25 percent, the middle 50 percent and the upper 25 percent. The condition-specific analyses were also stratified by state in order to examine the extent to which there are differences in episodes and their composition across the three states included in the analyses.
Results of Quantitative Analyses of Episodes of Care
We begin our presentation by examining the results generated by ETGs and MEGs to provide a reader with a sense of their comparability. For the remainder of the chapter, our discussion focuses on the results generated by ETGs, as the MEGs results were not substantively different. The full set of results for both ETGs and MEGs are presented in the Appendix D.
Summary Statistics for Continuously Enrolled Beneficiaries
To provide a sense of scale, Table 7 provides summary statistics on the number of Medicare beneficiaries residing in each of the three states in 2005 who were continuously enrolled in Medicare FFS, 2004-2006, the number of Medicare claims in 2005 for these beneficiaries and the total Medicare payments for these claims.
| State | # of Beneficiaries | # Medicare Claims in 2005 | FFS Medicare Payments for 2005 Claims | 2005 FFS Medicare Payments per Beneficiary |
|---|---|---|---|---|
| Florida | 1,682,031 | 58,532,070 | $14,096,159,338 | $8,380 |
| Oregon | 222,691 | 5,623,819 | $1,307,129,151 | $5,870 |
| Texas | 1,596,950 | 48,959,417 | $13,465,355,633 | $8,432 |
Table 8 presents for both ETGs and MEGs the percent of 2005 claims the grouper did not assign to an episode and what these unassigned claims translated into in terms of the percent of 2005 Medicare FFS payments that were not assigned to an episode. We also present the total number of episodes created by the two groupers for the continuously enrolled Medicare beneficiaries in our study population and the average number of episodes per continuously enrolled beneficiary. We then show the percent of all episodes that were identified as being related to the nine conditions of focus in this project and the percent of Medicare payments the episodes related to the nine conditions represented.
| State | % Claims Not Assigned to an Episode | % Payments Not Assigned to an Episode | # of Episodes of Any Type | Average Number of Episodes per Beneficiary | % of Episodes Related to Conditions of Focus | % of Medicare Payments for Episodes Related to Conditions of Focus | |
|---|---|---|---|---|---|---|---|
| ETGs | |||||||
| Florida | 9.6% | 5.2% | 12,773,401 | 8.0 | 13.1% | 34.7% | |
| Oregon | 10.8% | 4.5% | 1,252,148 | 6.1 | 14.2% | 34.0% | |
| Texas | 10.2% | 5.2% | 10,243,694 | 6.9 | 15.0% | 37.2% | |
| MEGs | |||||||
| Florida | 12.9% | 7.6% | 13,474,905 | 8.4 | 13.3% | 27.2% | |
| Oregon | 12.3% | 5.3% | 1,380,593 | 6.6 | 14.3% | 27.8% | |
| Texas | 12.5% | 5.5% | 11,018,315 | 7.3 | 14.8% | 31.2% | |
Both groupers assigned a high fraction of both claims and payments to an episode. Only approximately 10 percent and 12.5 percent of claims for ETGs and MEGs respectively were not assigned to an episode; these claims represented 4.5 percent to 7.6 percent of total Medicare payments made, depending on the state and specific grouper. The types of claims most frequently not assigned to an episode were durable medical equipment and laboratory tests. The vast majority of episodes created were deemed complete (approximately 97 percent for ETGs and 89 percent for MEGs). For purposes of this project an episode was deemed complete if it either began and ended in 2005 or began in 2004, with the necessary clean period for the specific episode observed, and ended in 2005.
A small portion of continuously enrolled Medicare FFS beneficiaries did not have any episodes, ranging from 4.2 percent ( Florida using MEGs) to 7.6 percent ( Oregon using ETGs). Most of these individuals did not have any claims. Individuals with at least one episode had an average of 6.1 ( Oregon) to 8.0 ( Florida) ETG episodes and 6.6 ( Oregon) to 8.4 ( Florida) MEG episodes. This variation in the number of episodes could partly be due to differences in practice styles across regions, which could trigger more episodes in one area than another. Another possibility is that the Medicare beneficiaries residing in Oregon may be healthier than those in Florida. The underlying reasons for variation in the number of episodes per enrollee is an area for future research.
Episodes identified as being related to the nine conditions of focus represented a relatively small portion of the total number of episodes (13.1 to 15.0 percent). They represented a substantially larger portion of Medicare payments, however, ranging from 27.2 percent to 37.2 percent of payments. While ETGs and MEGs captured very similar percentages of claims in episodes related to the conditions of focus, ETG episodes related to the conditions represented a larger portion of total Medicare payments than MEG episodes.
Summary Statistics for Selected Conditions of Focus across the Three States
As stated in the overview of our analyses, we sought to focus on conditions that are common among Medicare beneficiaries. Table 9 presents the number and percent of continuously enrolled Medicare FFS beneficiaries identified as having each of the conditions of focus using both primary and secondary diagnoses that appeared in the 2005 claims data. The selected conditions were fairly common among the continuously enrolled beneficiaries, with between 0.8 percent (bacterial pneumonia) and 17.7 percent (diabetes) experiencing each of the conditions. Three of the conditions were experienced by more than 10 percent of the beneficiaries: COPD, congestive heart failure and diabetes.
| Condition | # of Continuously Enrolled FFS Beneficiaries with Condition | % of Continuously Enrolled FFS Beneficiaries with Condition |
|---|---|---|
| AMI | 37,464 | 1.1% |
| Bacterial Pneumonia | 28,617 | 0.8% |
| Breast Cancer | 55,129 | 1.6% |
| Cerebrovascular Disease | 129,271 | 3.7% |
| COPD | 364,691 | 10.4% |
| Congestive Heart Failure | 513,000 | 14.7% |
| Diabetes | 620,141 | 17.7% |
| Hip Fracture | 35,576 | 1.0% |
| Low Back Pain | 283,869 | 8.1% |
Figure 2. Number of Conditions of Focus among Beneficiaries with at Least One Condition
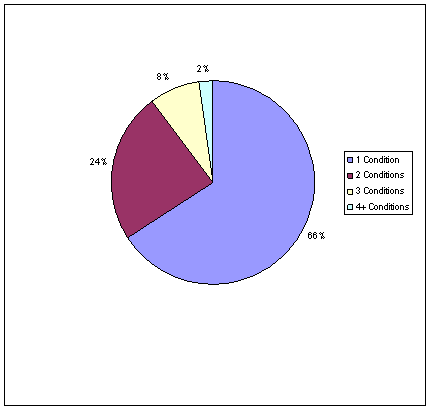
Figure 2 shows the distribution of the nine conditions of interest in 2005 among the continuously enrolled Medicare beneficiaries. Two-thirds had only one of the conditions. Approximately a quarter had two of the conditions, while eight percent had three conditions. Two percent of beneficiaries with any of the conditions had at least four of the conditions, with the maximum being eight of the nine conditions.
While we used both primary and secondary diagnoses to identify the conditions of focus, the episode groupers use primary diagnoses on selected types of claims to trigger the creation of episodes.
Figure 3. Average Number of Related Episodes per Condition, ETGs
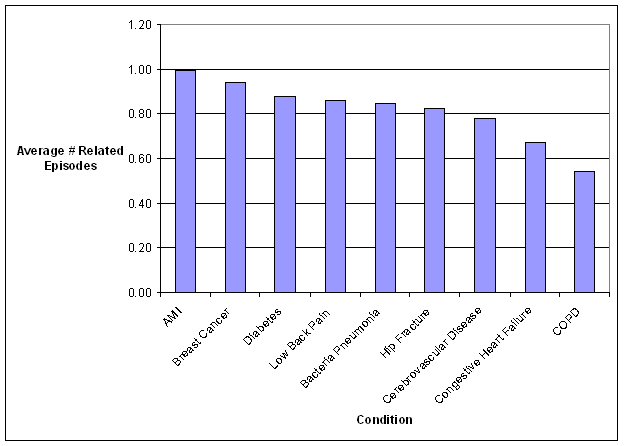
Figures 3 shows the average number of episodes related to the conditions experienced by beneficiaries identified as having each of the conditions for ETGs and MEGs, respectively.- With both groupers, there were individuals we identified as having a condition who did not have an episode designated as being related to the condition. This occurred most frequently for congestive heart failure and COPD, where the condition was consistently used as a secondary diagnosis or appeared as a primary diagnosis on claims that did not trigger a new episode, such as durable medical equipment claims. There were instances where individuals with a condition had more than one episode related to the condition; this was most notable with back pain under MEGs. There were five MEG episodes we identified as being related to back pain (Appendix C). There were beneficiaries with back pain that experienced more than 1 of the 5 different episodes we identified as being related to back pain, while other beneficiaries experienced more than 1 of the same type of episode.
Figure 4. Average Number of Related Episodes per Condition, MEGs
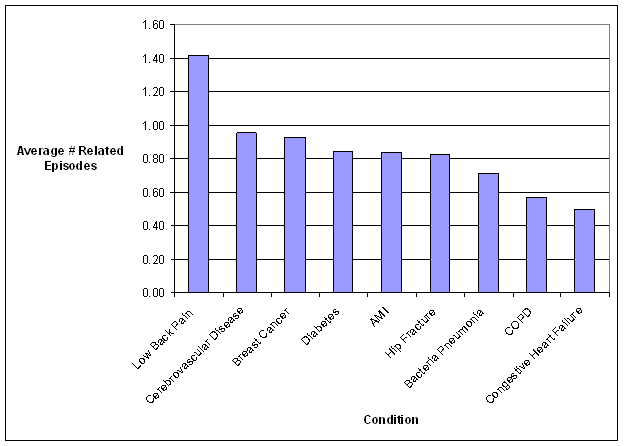
Figure 4 shows the average number of episodes related to the conditions experienced by beneficiaries identified as having each of the conditions for ETGs and MEGs, respectively.- With both groupers, there were individuals we identified as having a condition who did not have an episode designated as being related to the condition. This occurred most frequently for congestive heart failure and COPD, where the condition was consistently used as a secondary diagnosis or appeared as a primary diagnosis on claims that did not trigger a new episode, such as durable medical equipment claims. There were instances where individuals with a condition had more than one episode related to the condition; this was most notable with back pain under MEGs. There were five MEG episodes we identified as being related to back pain (Appendix C). There were beneficiaries with back pain that experienced more than 1 of the 5 different episodes we identified as being related to back pain, while other beneficiaries experienced more than 1 of the same type of episode.
Variations in Standardized Payments for Episodes Between and Within Conditions
The analyses presented in this section examine the extent to which there is variation in the average total payments per episode across the nine conditions and within episodes related to each of the nine conditions. These average payments have been standardized based on 2005 payment rates and payment policy to exclude variations in resource use due to geographic differences (e.g. wage adjustments) and policy considerations (e.g. payment to teaching hospitals). For example, for inpatient acute care hospitals stays, the base Medicare payment was multiplied by DRG weight for the DRG on the claim and adjusted for transfers and high-cost outliers. Thus, we did not include adjustments for area wages, IME payments or disproportionate share hospital (DSH) payments. Appendix D provides information on Medicare FFS payment policy in 2005 and the approach taken to standardize costs for each type of Medicare provider.
Figure 5. Average Standardized Payment per Episode, ETGs
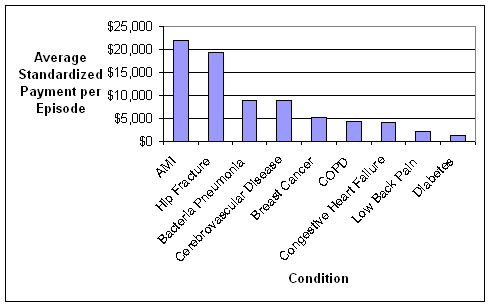
Figure 5 (ETGs) shows there is substantial variation in the average total standardized payment per episode across the nine conditions we examined. Episodes for AMI and hip fracture are more expensive on average than episodes for management of low back pain or diabetes.
Figure 6. Coefficient of Variation for Standardized Payments for Related Episodes, ETGs
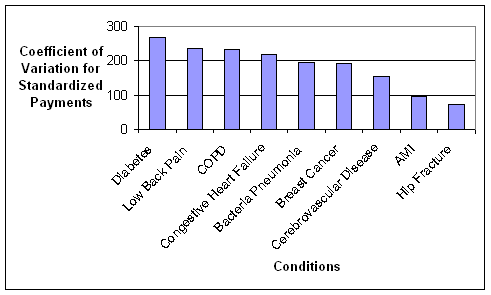
Figure 6 shows the coefficient of variation (COV), which is the standard deviation in payments divided by the average payment per episode, for ETGs. This measure provides a measure of how much variation there is in standardized payments between episodes related to the same condition. While episodes related to diabetes had the lowest average standardized payments per episode, they had the largest variations in standardized payments suggesting that these episodes may not be homogeneous. To some extent, across these nine conditions, we observe that the COV is inversely related to the average payment. AMI and hip fracture, while having the largest average standardized payments per episode, had lower COV indicating relatively less variation in the costs of episodes, representing more homogeneity in the way these patients are treated.
The observed variation in standardized payments for episodes related to a specific condition could be due to a variety of factors, such as variation in patterns of care, which could be due to undesired variations or heterogeneity in the clinical condition (e.g., severe pneumonia versus mild pneumonia) and random variation.
Figure 7. Average Standardized Payment per Episode, MEGs
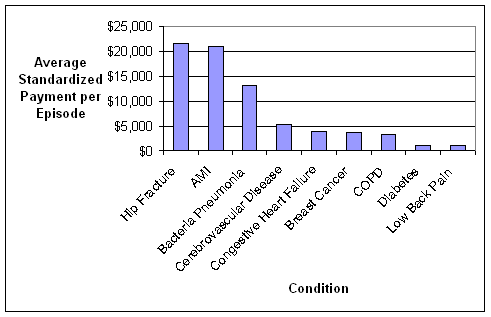
Figure 7 presents comparable information for the episodes created by MEGs. A similar pattern between average standardized payments and COV is observed overall.
Figure 8. Coefficient of Variation for Standardized Payments for Related Episodes, MEGs
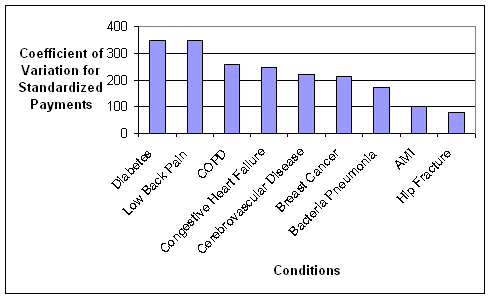
Figure 8 presents comparable information for the episodes created by MEGs. A similar pattern between average standardized payments and COV is observed overall.
Extent to Which Beneficiaries' Care is for Episodes Related to Conditions of Focus
Figures 9 and 10 show, on a per capita basis, how much of the care received by beneficiaries diagnosed with each of the nine conditions is for ETG episodes related to the condition.
Figure 9. Portion of Episodes Related to Condition, ETG
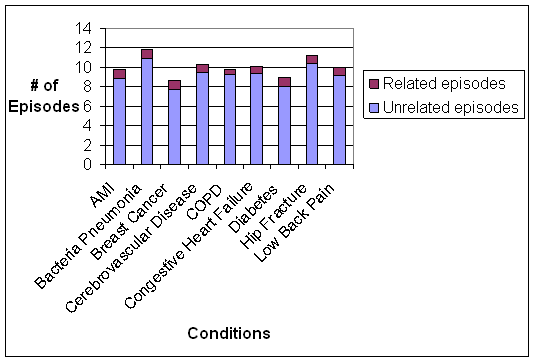
Figure 9 shows that related episodes make up a small fraction of all of the episodes experienced by beneficiaries with each of the nine conditions.
Figure 10. Portion of Standardized Payments for Episodes Related to Condition, ETGs
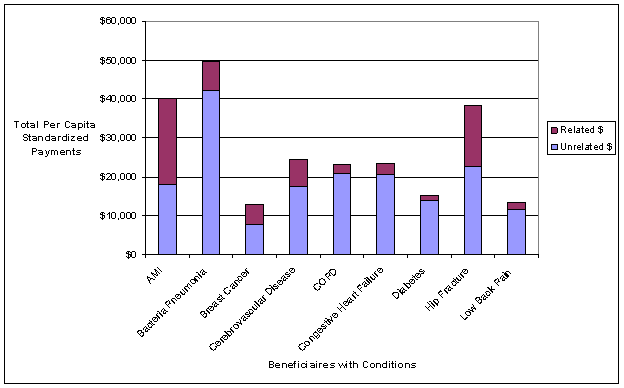
Figure 10 shows that, in general, related episodes comprise a greater portion of standardized payments than of total number of episodes. There is also substantial variation across the conditions both in the total standardized payment for care delivered to the beneficiaries and in the potion of payments that are for episodes related to the conditions. For example, for beneficiaries who experience an AMI, the care they received as part of the episodes related to the AMI accounts for approximately 50 percent of their total costs. In contrast, for beneficiaries diagnosed with diabetes, the care they received during their diabetes-related episodes accounts for less then 10 percent of their total costs.
Figure 11. Portion of Episodes Related to Condition, MEGs
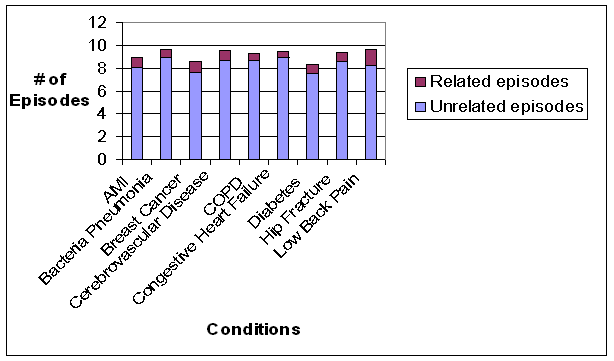
Figures 11 shows comparable information for episodes created by MEGs. The results are substantively similar, so here we only discuss Figures 9 and 10
Figure 12. Portion of Standardized Payments for Episodes Related to Condition, MEGs
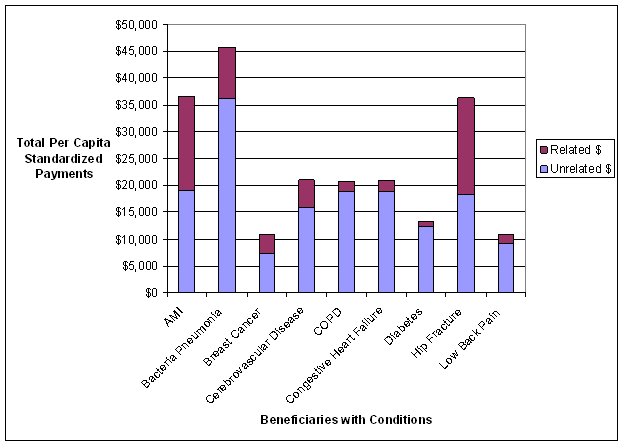
Figures 12 shows comparable information for episodes created by MEGs. The results are substantively similar, so here we only discuss Figures 9 and 10
To describe the unrelated episodes, Table 10 lists the average number of unrelated episodes for beneficiaries diagnosed with AMI, diabetes and hip fracture as well as the five most common unrelated episodes for each of the three conditions. Some of the unrelated episodes are very common across the three conditions, such as hypertension and fungal skin infection for ETGs, while for MEGs the commonalities were essential hypertension, and encounters for preventive health services.
| AMI | Diabetes | Hip Fracture | |||
|---|---|---|---|---|---|
| ETGs | |||||
| Average # unrelated episodes per beneficiary | 8.8 | 8.0 | 10.4 | ||
| 5 most common unrelated episodes: % of beneficiaries experiencing | |||||
| Hypertension | 63.1% | 65.6% | 67.3% | ||
| Congestive heart failure | 53.7% | Not in top 5 | 29.8% | ||
| Diabetes | 34.5% | Related to Diabetes | Not in top 5 | ||
| Cerebrovascular accident | 22.2% | Not in top 5 | Not in top 5 | ||
| Fungal skin infection | 17.0% | 19.3% | 26.8% | ||
| Ischemic heart disease | Related to AMI | 37.7% | 36.3% | ||
| Cataract | Not in top 5 | 27.3% | Not in top 5 | ||
| Hyperlipidemia | Not in top 5 | 23.2% | Not in top 5 | ||
| Infection of lower genitourinary system, not sexually transmitted | Not in top 5 | Not in top 5 | 26.7% | ||
| MEGs | Average # unrelated episodes per beneficiary | 8.1 | 7.5 | 8.6 | |
| 5 most common unrelated episodes: % of beneficiaries experiencing | |||||
| Coronary artery disease | 62.3% | 29.7% | Not in top 5 | ||
| Essential hypertension | 51.3% | 57.3% | 53.0% | ||
| Encounter for preventive health services | 32.4% | 44.5% | 33.7% | ||
| Congestive heart failure | 32.2% | Not in top 5 | Not in top 5 | ||
| Arrhythmias | 21.0% | Not in top 5 | 18.2% | ||
| Cataract | Not in top 5 | 22.4% | Not in top 5 | ||
| Other inflammations and infections of skin and subcutaneous tissue | Not in top 5 | 20.4% | 22.9% | ||
| Urinary tract infections | Not in top 5 | Not in top 5 | 18.9% | ||
The relatively small portion of care represented by the related episodes, together with the relative frequency of some of the unrelated episodes, suggests the complexities of defining what constitutes an episode of care and raises questions about how the tension between segmenting and "bundling" care could be balanced. Here we use beneficiaries diagnosed with AMI and the episodes created with ETGs to highlight this complexity and examine beneficiaries who experienced an AMI with the various combinations of vascular disease episodes of care shown in Figure 13.
Figure 13. Select Combinations of Vascular Disease Episodes
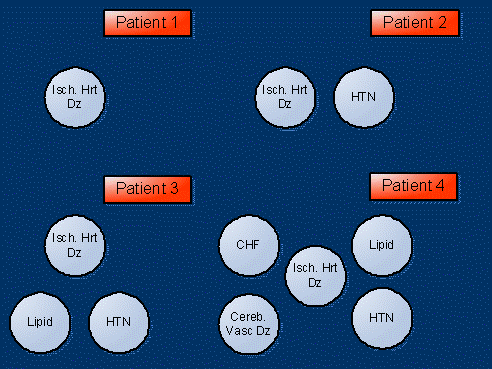
Figure 13 shows how we use beneficiaries diagnosed with AMI and the episodes created with ETGs to highlight this complexity and examine beneficiaries who experienced an AMI with the various combinations of vascular disease episodes of care shown.
We identified the ETGs' ischemic heart disease episodes as related to AMI diagnosis; no other ETG episodes were designated as related to AMI. Virtually all of the beneficiaries with a primary or secondary diagnosis of AMI in 2005 also had an ischemic heart disease episode. However, as shown in Table 11 below, only 13 percent of beneficiaries with AMI only had an ischemic heart disease episode (Patient 1). As shown in Table 9 above, 63 percent of the beneficiaries with AMI also had a hypertension episode. However, there were only 15 percent of beneficiaries with AMI who had only ischemic heart disease and hypertension episodes (Patient 2). As additional conditions that are prevalent in AMI patients are added, it represents a smaller, but still substantial portion of AMI patients. It is significant to note that as an AMI patient has additional vascular disease comorbidities that could "travel" together, not only are the total costs of caring for the patient affected, but the standardized payments for the ischemic heart disease episode increase substantially as well, as illustrated in the last row of Table 11.
| Episode Combinations | % of those Beneficiaries Diagnosed with AMI | Standardized Payments for Ischemic Heart Disease Episode (AMI-related Episode) | Total Standardized Payments for Beneficiaries with AMI |
|---|---|---|---|
| Patient 1: Only ischemic heart disease | 13% | $20,106 | $26,885 |
| Patient 2: Ischemic heart disease and hypertension | 15% | $21,834 | $32,696 |
| Patient 3: Ischemic heart disease, hypertension, and hyperlipidemia | 7% | $24,657 | $32,264 |
| Patient 4: Ischemic heart disease, hypertension, hyperlipidemia, cerebrovascular accident, congestive heart failure | 2% | $28,613 | $61,322 |
Number of Providers and Settings Involved in Episodes Related to Conditions
Medicare beneficiaries received care for episodes related to the nine conditions of focus from a wide variety of providers and in numerous settings. Figure 14 presents the median number of providers delivering services during episodes related to each of the nine conditions. Providers were categorized as primary care physicians (specialties of family practice, internal medicine, general practice, geriatrics and genecology), specialists (all other physician specialties), and other providers (e.g., physical therapists, dieticians). We present only the information from ETGs as that produced by MEGs was not substantively different.
Figure 14. Median Number of Providers Involved in the Episode, ETGs
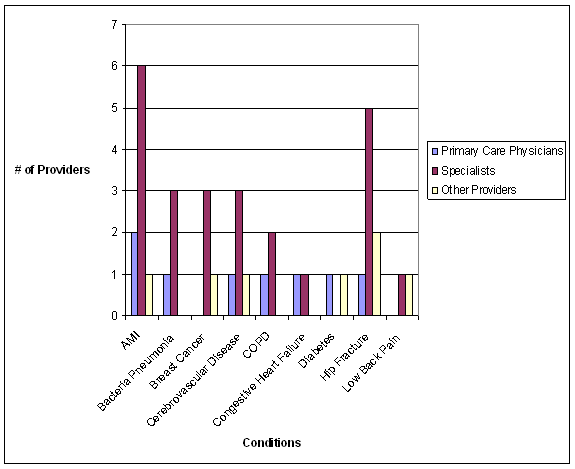
Figure 14 presents the median number of providers delivering services during episodes related to each of the nine conditions. Providers were categorized as primary care physicians (specialties of family practice, internal medicine, general practice, geriatrics and genecology), specialists (all other physician specialties), and other providers (e.g., physical therapists, dieticians). We present only the information from ETGs as that produced by MEGs was not substantively different.
Across most of the nine conditions we examined, we observe a median of one primary care physician involved in the management of the episode. For episodes related to breast cancer and low back pain, more than half of episodes did not include any primary care physicians. Only episodes related to AMI had a median number of primary care type physicians involved that was more than one. Involvement of specialists varied more across the episodes related to the nine conditions, with AMI and hip fracture having the largest number of specialists involved (median of six and five, respectively), while episodes related to diabetes had the fewest (median less than one). Many of the episodes also involved other types of providers, most notably hip fracture (median of two). Larger numbers of providers involved in the treatment of an episode increases the likelihood that coordination challenges in the delivery of care will occur.
Figure 15. Median Number of Physicians Providing Services in Facility and Outpatient Settings, ETGs
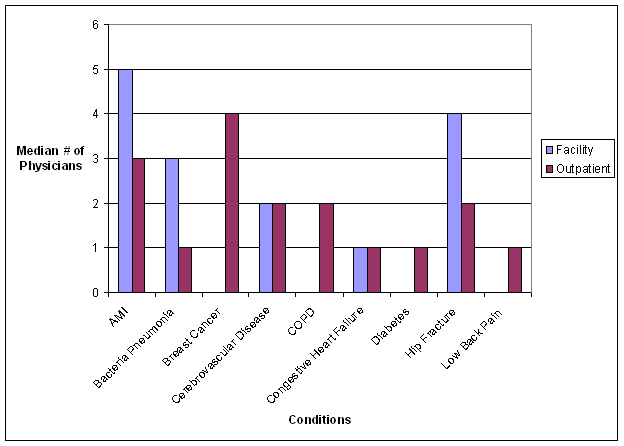
Figure 15 focuses only on physicians, shows the number of physicians delivering care in a facility (e.g. hospital, nursing home) versus the outpatient setting, which has implications for coordination of care. For ETG episodes related to some conditions, such as breast cancer, COPD, diabetes and low back pain, the majority of physicians are predominantly providing services in outpatient settings. For other conditions, such as AMI and hip fracture, the majority of physicians involved are providing care in facilities.
The number of physicians providing services during an episode only provides a partial picture of the potential complexity of an episode. Patients may flow between various health care settings and provider types, as shown in Figure 16, and Medicare has different performance measurement programs and payment systems for separate settings. In Figure 17, we show the number of settings involved in ETG episodes related to each of the nine clinical conditions of focus. There are nine settings captured by Figure 17: physician ambulatory services (i.e. services provided in the community), ambulatory surgical centers, hospital outpatient (includes the physician services delivered in hospital outpatient departments), inpatient acute care (including physician services), long-term care hospitals, inpatient rehabilitation facilities, skilled nursing homes, home health and hospice. Durable medical equipment (DME) and outpatient laboratory services are not included as separate settings for this figure. While there are some substantive differences in these results by the two episodes groupers, we present here only the results of ETGs for the purpose of simplicity. The results for MEGs are presented in the tables in the appendices.
Figure 16. Potential Patient Trajectories Through the Health Care System
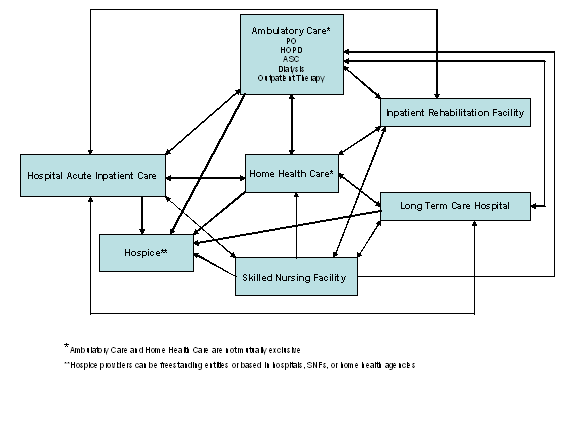
Figure 16 shows the number of physicians providing services during an episode only provides a partial picture of the potential complexity of an episode. Patients may flow between various health care settings and provider types and Medicare has different performance measurement programs and payment systems for separate settings.
The number of settings involved in episodes varied both within a condition and between conditions. For example, while approximately 50 percent of ETG episodes related to low back pain involved only one setting, more than 50 percent of episodes related to hip fracture involved four or more settings. For cerebrovascular disease, over 20 percent of episodes fell into each of our four categories. The fraction of episodes involving just one setting ranged from 4.0 percent of AMI-related episodes to 50.6 percent of low back pain episodes. At the other end of the spectrum, the number of episodes involving at least four settings ranged from 4.4 percent for diabetes to 57.3 percent of hip fracture episodes. The large number of settings involved in a substantial portion of these episodes creates a number of complexities for aligning either performance measurement or financial incentives.
Figure 17. Number of Settings Involved in Episodes by Condition, ETGs
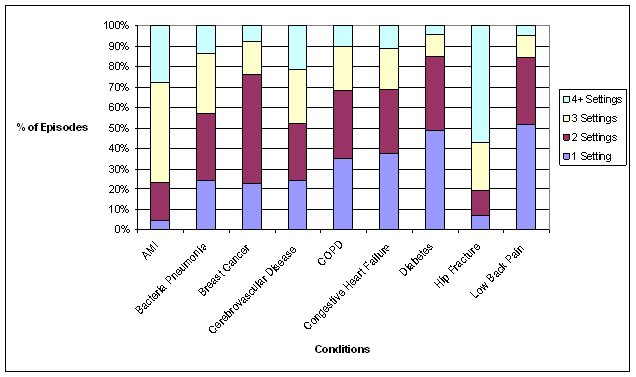
Figure 17 shows the number of settings involved in ETG episodes related to each of the nine clinical conditions of focus.
Figures 18-20 illustrate the different settings of care that patient with ETG episodes related to AMI, diabetes and hip fracture, respectively, "touch". Comparable information for the other conditions are provided in Appendix E. Also, in Appendix E we report the percentage of episodes related to the nine conditions for both groupers that involve each setting; these tables include DME and outpatient laboratories. In Figures 18-20, we categorize settings by ambulatory care (i.e. hospital outpatient, physician office, ambulatory surgical centers), acute inpatient care (hospital acute inpatient care), post-acute care (home health care, skilled nursing facilities, inpatient rehabilitation facilities, long-term care hospitals), and special populations (hospice). For each setting, we report in parentheses the percentage of episodes related to the condition that involve that setting. For example, 88.5 percent of episodes related to AMI involve the hospital outpatient setting (upper left portion of figure). As part of this analysis, we report the number of performance measures for the condition that are currently reported to Medicare for each setting below the percent of episodes involving the setting. We also report at the bottom of each figure the most common combinations of settings that occur in episodes related to the condition. We focus on combinations that occur in more than 10 percent of episodes. We use this information to assess the extent to which the measures reported to Medicare for the condition align with the settings in which the care for episodes related to the condition is delivered and identify gaps in existing measures.
In addition to the condition specific-measures that are currently reported to Medicare for each patient of the settings of care, we recognize that there may be other measures that are potentially relevant to patients with each condition. For example, there will be a subset of AMI patients that will have a CABG performed in the hospital during the episode of care related to their AMI. For these patients, the CABG measures as well as the perioperative/surgical care measures would be relevant. Therefore, we address measures for other conditions that are potentially relevant for the condition of focus (e.g. AMI). Additionally, there are SNF, home health and PQRI prevention/screening measures that are not condition-specific that may be particularly relevant to patients with our conditions of focus. We indicate those measures that clinical experts at RAND believe may have particular relevance for each of the conditions in Tables 14 and 15.
Other Potentially Relevant Measures. There are number of measures that may apply to subsets of AMI patients. These include CABG/Cardiac Surgery, Heart Failure, and Perioperative measures. Additionally the PQRI measures calling for an electrocardiogram for non-traumatic chest pain or syncope may apply to patients with episodes of care related to AMI.
Figure 18. Settings Involved in ETG Episodes Related to AMI
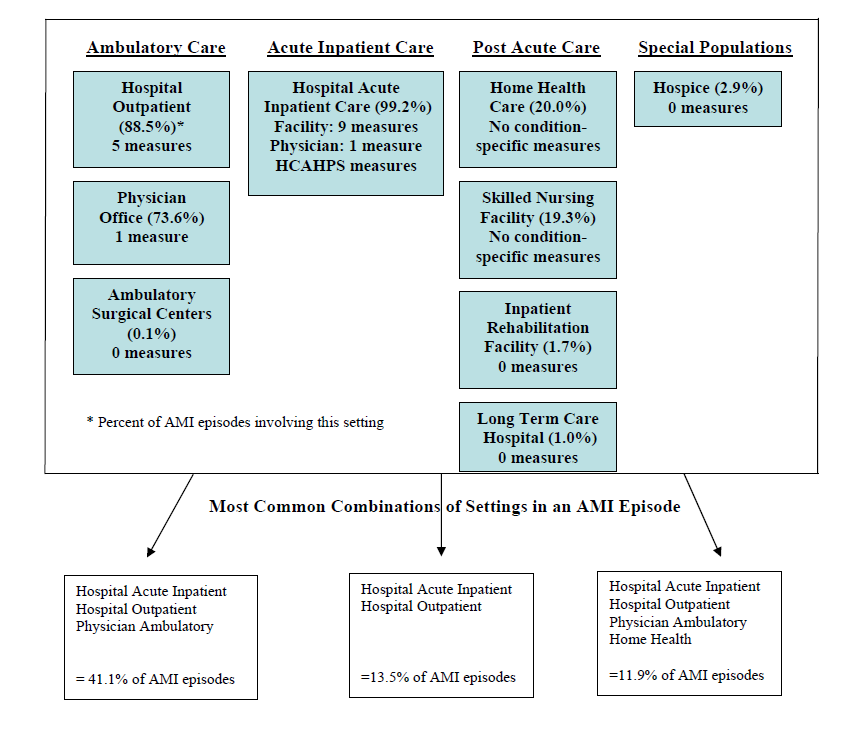
Figure 18 shows that nearly all (99.2%) patients with an AMI-related episode utilized an acute care hospital, 89 percent utilized the hospital outpatient department (which includes the emergency department), and 74 percent visited a physician office for that episode.- Additionally, approximately 20 percent of patients utilized home health or a skilled nursing facility.- There were three different combinations of settings that each accounted for more than 10 percent of the episodes related to AMI and these three combinations jointly accounted for 67 percent of the AMI-related episodes. The most common combination of settings involved acute care hospitals, hospital outpatient departments and physician office visits (41 percent of episodes). While there are nine clinical measures (listed in Table 12) reported for the hospital facility (and one for physicians in the hospital setting) and five measures for the emergency department, there is only one measure for care delivered in a physician office.- The skilled nursing and home health measures are not condition specific and apply to all patients in those settings.
| Measure Condition | Measure | Hospital Inpatient |
Hospital Outpatient/ED | Physician |
|---|---|---|---|---|
| AMI | Aspirin at Arrival | X | X | X (inpatient)* |
| AMI | Aspirin at discharge | X | ||
| AMI | ACE-I or ARB for LVSD | X | ||
| AMI | Adult smoking cessation advice/counseling | X | ||
| AMI | Beta blocker at arrival | X | ||
| AMI | Beta blocker prescribed at discharge | X | ||
| AMI | Fibrinolytic medication received within 30
minutes of hospital arrival |
X | X | |
| AMI | PCI received within 120 minutes of hospital arrival | X | ||
| AMI | 30-day AMI mortality | X | ||
| AMI | Median time to fibrinolysis | X | ||
| AMI | Median time to electrocardiogram | X | ||
| AMI | Median time to transfer for primary PCI | X | ||
| CAD | Beta blocker therapy for patients with prior MI | X | ||
| *This is a PQRI physician-level measure that would apply in a hospital setting | ||||
Nearly 90 percent of patients with an episode related to diabetes visited a physician office and 45 percent utilized the hospital outpatient department. Only 15 percent had an acute care hospitalization related to the episode. Additionally, 11 percent utilized home health care and 9 percent a skilled nursing facility. Only two combinations of settings each accounted for more than 10 percent of the episodes; these two combinations accounted for 67 percent of all diabetes-related episodes in our sample. The most common combination involved only physician ambulatory services (41 percent of episodes related to diabetes). There are currently 10 measures reported to CMS for the physician office setting where the majority of the care for diabetes episodes is taking place; these measures are presented in Table 13. The skilled nursing and home health measures are not condition specific and apply to all patients in those settings.
Other Potentially Relevant Measures. The PQRI measure for wound care for patients with venous ulcers is also potentially relevant for individuals with diabetes.
Figure 19. Settings Involved in ETG Episodes Related to Diabetes
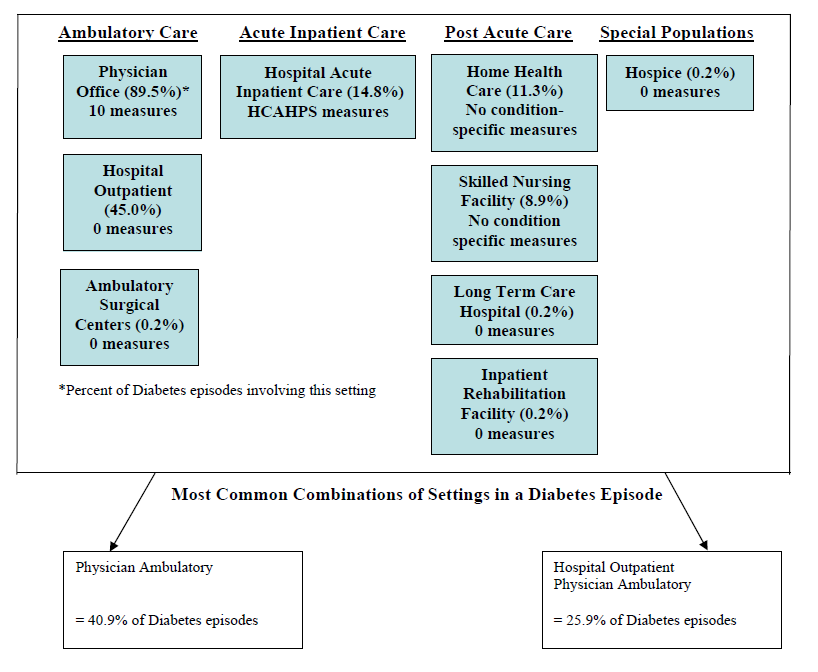
Figures 19 illustrates the different settings of care that patient with ETG episodes related to AMI, diabetes and hip fracture, respectively, "touch". Comparable information for the other conditions are provided in Appendix E. Also, in Appendix E we report the percentage of episodes related to the nine conditions for both groupers that involve each setting; these tables include DME and outpatient laboratories.
| Measure Condition | Measure | Physician (Ambulatory) |
|---|---|---|
| Diabetes | Hemoglobin A1C poor control | X |
| Diabetes | LDL control | X |
| Diabetes | Blood pressure control | X |
| Diabetes | Dilated eye exam | X |
| Diabetes | Urine screening or medical attention for nephropathy | X |
| Diabetes | Foot exam | X |
| Diabetes | Foot and ankle care: neurological evaluation | X |
| Diabetes | Foot and ankle care: evaluation of footwear | X |
| Diabetic Retinopathy | Documentation of presence or absence of macular edema and level of severity of retinopathy | X |
| Diabetic Retinopathy | Communication with the physician managing ongoing diabetes care | X |
Over 90 percent of patients with an episode related to hip fracture utilized an acute care hospital, 85 percent utilized the hospital outpatient department (including the emergency department) and 65 percent visited a physician office related to the episode. Additionally, 56 percent utilized a skilled nursing facility, 40 percent home health care 18 percent inpatient rehabilitation. The three most common combinations of settings accounted for 41 percent of the hip fracture-related episodes in our sample. The most common combination of settings involved four settings (hospital acute inpatient, hospital outpatient, physician ambulatory services, and skilled nursing facility) and accounted for only 15.7 of episodes. There is currently only one condition-specific measure reported to CMS for hip fracture and that is for mortality in the acute care hospital setting. The skilled nursing and home health measures are not condition specific and apply to all patients in those settings.
Other Potentially Relevant Measures. As most patients who have a hip fracture will have surgery, the perioperative measures would apply as would the hospital inpatient Patient Safety Indicator for post operative wound dehiscence. Additionally, the PQRI osteoporosis measure calling for management following a fracture would likely apply.
Figure 20. Settings Involved in ETG Episodes Related to Hip Fracture
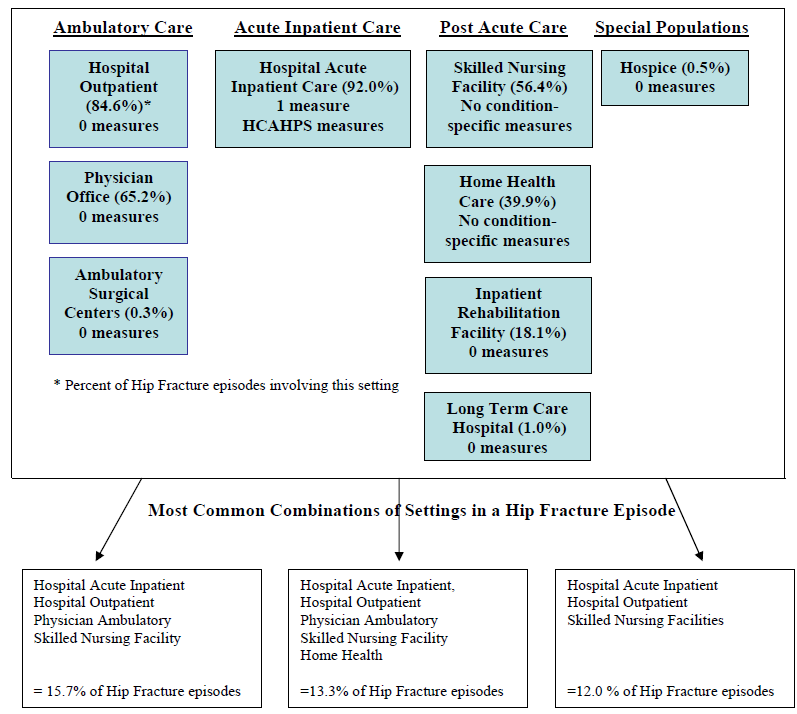
Figures 20 illustrates the different settings of care that patient with ETG episodes related to AMI, diabetes and hip fracture, respectively, "touch". Comparable information for the other conditions are provided in Appendix E. Also, in Appendix E we report the percentage of episodes related to the nine conditions for both groupers that involve each setting; these tables include DME and outpatient laboratories.
Non Condition-Specific Measures. The PQRI prevention/screening measures and the Home Health and SNF measures are not condition-specific and are intended to be applied to all Medicare beneficiaries receiving care in those settings. However, in Tables 14 and 15 we specify those measures that clinical experts at RAND determined to be the most applicable to the conditions of interest.
| Measures | AMI | Bacterial Pneumonia | Breast- Cancer | Cerebro-vascular | CHF | COPD | Diabetes | Hip Fracture | Low Back Pain |
|---|---|---|---|---|---|---|---|---|---|
| Medication reconciliation after discharge from inpatient setting | X | X | X | X | X | X | X | ||
| Advance care plan | X | X | X | X | |||||
| Influenza vaccination for patients > 50 | X | X | X | X | X | X | X | ||
| Pneumonia vaccination for patients > 65 | X | X | X | X | X | X | |||
| Screening mammography | X | ||||||||
| Colorectal cancer screening | |||||||||
| Inquiry regarding tobacco use | X | X | X | X | X | ||||
| Advising smokers to quit | X | X | X | X | X | ||||
| Universal weight screening and follow-up | X | X | X | X | |||||
| Universal documentation and verification of current medications in the medical record | X | X | X | X | X | X | |||
| Pain assessment prior to initiation of patient treatment | X | X | X | ||||||
| Screening for cognitive impairment | X | ||||||||
| Screening for clinical depression | X | X | X | ||||||
| Screening and brief counseling for alcohol abuse | |||||||||
| Endoscopy and polyp surveillance--interval in patients with history of adenomatous polyps | |||||||||
| Elder maltreatment screen with follow-up plan | X | X |
| Measures | AMI | Bacterial Pneumonia | Breast- Cancer | Cerebro-vascular | CHF | COPD | Diabetes | Hip Fracture | Low Back Pain | ||
|---|---|---|---|---|---|---|---|---|---|---|---|
| SNF | |||||||||||
| Long Stay: | |||||||||||
| Residents given influenza vaccination during the flu season | X | ||||||||||
| Residents assessed and given pneumococcal vaccination | X | ||||||||||
| Residents whose need for help with daily living activities has increased | X | X | |||||||||
| Residents who have moderate to severe pain | X | X | X | X | |||||||
| High risk residents who have pressure sores | All | ||||||||||
| Low risk residents who have pressure sores | All | ||||||||||
| Residents who were physically restrained | All | ||||||||||
| Residents who are more depressed or anxious | X | X | X | ||||||||
| Residents who lose control of their bowels or bladder | X | X | |||||||||
| Residents who have had a catheter inserted and left in their bladder | X | X | |||||||||
| Residents who spent most of their time in a bed or in a chair | X | X | X | X | |||||||
| Residents whose ability to move about and around their room got worse | X | X | X | X | |||||||
| Residents with a urinary tract infection | X | X | |||||||||
| Residents who lost too much weight | All | ||||||||||
| Short Stay: | |||||||||||
| Residents given influenza vaccination during the flu season | X | ||||||||||
| Residents assessed and given pneumococcal vaccination | X | ||||||||||
| Residents with delirium | All | ||||||||||
| Residents who had moderate to severe pain | X | X | X | X | |||||||
| Residents with pressure sores | All | ||||||||||
| Home Health | |||||||||||
| Improvement in ambulation/locomotion | X | X | X | X | |||||||
| Improvement in bathing | X | ||||||||||
| Improvement in transferring | X | X | |||||||||
| Improvement in management of oral medication | All | ||||||||||
| Improvement in pain interfering with activity | X | X | X | X | |||||||
| Improvement in dyspnea | X | X | |||||||||
| Improvement in urinary incontinence | X | X | |||||||||
| Improvement in the status of surgical wounds | X | ||||||||||
| Patients requiring acute care hospitalization | All | ||||||||||
| Patients requiring emergent care | All | ||||||||||
| Patients requiring emergent care for wound infections | X | X | |||||||||
| Patients discharged to the community | All | ||||||||||
The previous discussion of the settings involved in episodes of care highlighted the prominent position of hospital acute inpatient care for episodes related to AMI and hip fracture. While it is not surprising that multiple different physicians are involved in providing services during an episode, it would be easy to assume that acute inpatient care is provided in a single facility. However, this is not always the case, particularly for AMI patients. Seventeen percent of ETG episodes related to AMI involved more than one acute care hospital (table in Appendix E). This is likely due to patients being transferred from one hospital to another after they have been admitted or being readmitted during the course of the episode to a different hospital. This occurrence was much less frequently observed for the other conditions with less than two percent of episodes involving more than one acute care hospital.
Figure 21. Division of Standardized Payments across Care Settings, ETGs
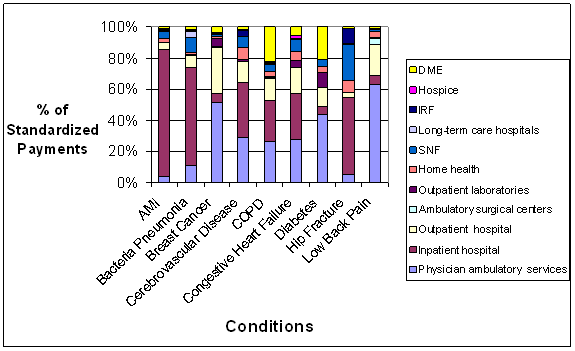
Figure 21 shows how standardized payments for ETG episodes related to each of the nine conditions are divided across settings. Comparable information for MEG episodes is presented in the appendices. Substantial variation in the distribution of payments across settings and conditions is evident. For example, the percent of payments for acute inpatient care ranges from approximately six percent for total episode payments for diabetes, low back pain and breast cancer to 80 percent for episodes related to AMI.- Similarly, while physician ambulatory services account for 63 percent of the episode payments for low back pain, they only account for approximately 3 percent of payments for AMI episode. Substantial variation exists for most of the other settings as well.
Attribution of Care to Providers
There is a wide array of attribution rules that can be used to assign episodes to providers of care. The rules can vary in terms of whether a single provider is assigned responsibility versus multiple providers being assigned responsibility. The particular types of services and the threshold used to allocate responsibility can also vary. The rules we used included some that used Evaluation and Management (E&M) visits to allocate responsibility, while others have used costs based on a broader set of professional services. Using E&M visits as the basis for accountability is frequently used in the context of performance measurement, whereby one is interested in determining which physician had the most responsibility for the "management" or trajectory of care. Using attribution methods that include other Part B services or facility care may include services that have such high fixed costs, that they do not necessarily represent any relative level of management, but rather reflect the built-in costs of those services. On the other hand, not including those types of services assumes little to no responsibility for managing the costs of those services or episodes for those that provide the procedures or the facility care.
While there is no universally agreed upon definition of what constitutes "professional services," in previous work spent significant effort creating operational definitions for professional costs a based on a reduced set of HCPCS codes using E&M visits under CMS' Berenson Eggers Type of Service (BETOS) code definition as a starting point as described in Appendix F.
Previous work in attribution has looked at assigning care only to physicians. However, for the purposes of linking performance measurement or financial incentives to episodes, as noted previously, it may also be important to have attribution rules that assign care to facilities. Therefore, in addition to examining the performance of physician-based attribution rules that have been used by others, we introduced new rules that allow assignment of episodes to facilities. Table 16 presents a summary of the attribution rules used in these analyses. For example the "episode payments plurality" rule assigned an episode to the single MD that had the highest portion of professional services payments as long as they met the threshold of having at least 30 percent of the professional payments. If no MD met this threshold, attribution for the episode was not assigned under this rule.
The facility rule could be combined with physician/practice attribution rules to create shared facility-physician attribution rules - the next to the last row in Table 15 is an example of this. The last row of Table 16 includes a shared attribution rule that combines facility attribution with the attending physician for the hospital assigned responsibility for the episode. More sophisticated and complicated attribution rules could be created that utilize a hierarchy of attribution based on a series of if-then statements. For example, attribution could be an individual physician if they account for the majority of outpatient E&M visits; then if no physician met this criterion, attribution could be made to a facility.
| Title of Rule | Signal for Responsibility | Single or Multiple Providers | Relevant cut-off |
|---|---|---|---|
| Episode Payments Plurality | Professional Payments | Single MD | At least 30% professional payments |
| Episode Payments Multiple Physicians | Professional Payments | Multiple MDs | All MD with >25% |
| Episode Visits Plurality | E&M Visits | Single MD | At least 30% E&M visits |
| Facility Payments Plurality | Facility Payments | Single Facility | At least 30% facility payments |
| Facility Payments Multiple Facilities | Facility Payments | Multiple Facilities | At least 25% facility payments |
| Episode Payments Plurality + Facility Payments Plurality | Professional Payments + Facility Payments | Single MD + Single Facility | Facility with at least 30% facility payments or MD with at least 30% professional payments |
In Table 17 we present the portion of episodes related to three conditions, AMI, diabetes, and hip fracture, that could be assigned under each of the attribution rules. The majority of episodes could be assigned to a physician under all of the physician-based rules. While basing attribution on professional services payments resulted in only a small increase compared to the use of E&M visits in the number of episodes that could be attributed for diabetes (an additional 2.9 percent of episodes), the difference was more substantial for both AMI (and additional 12.8 percent of episodes) and hip fracture (an additional 14.2 percent of episodes). Similarly, while moving the threshold from 30 percent to 25 percent of professional services payments resulted in being able to attribute an additional seven percent of AMI-related episodes to physicians, this had much less of an impact on the attribution of diabetes-related episodes (increase of 0.6 percent of episodes attributed) and hip fracture-related episodes (an additional 1.4 percent of episodes attributed).
The fraction of episodes that could be assigned to a facility varied greatly by condition. The variation is driven by whether facilities are involved in the care for episodes related to that condition. For example, 99.2 percent of episodes related to AMI include inpatient care and 93.0 percent of all episodes related to AMI can be assigned to a facility. In contrast, 14.8 percent of episodes related to diabetes involve inpatient care and only 8.4 percent of episodes can be assigned to a facility.
| Attribution Rule | AMI | Diabetes | Hip Fracture |
|---|---|---|---|
| Episode Visits Plurality | 73.4% | 82.2% | 81.7% |
| Episode Payments Plurality | 86.2% | 85.1% | 95.9% |
| Episode Payments Multiple Physician | 93.2% | 85.7% | 97.3% |
| Facility Payments Plurality | 93.0% | 8.4% | 89.7% |
| Facility Payments Multiple Facilities | 93.0% | 8.4% | 89.8% |
| Episode MD Payments Plurality or Facility Payments Plurality | 98.9% | 86.3% | 98.6% |
There may be concerns that if beneficiaries receive care in many settings, their care could be fragmented and it might be difficult to identify a provider who meets the minimum thresholds for attributing episodes. The data supported this concern for some, but not all, of the conditions. In general, the more settings that were involved in an episode, the more likely an episode could be assigned to a facility (i.e., the episode was more likely to involve inpatient care). Also, when multiple settings were involved, the facility care was typically the most costly. Despite representing a large portion of the total costs, it is unclear whether the facility should have much responsibility over overall costs or quality of the episode, given that the decision to admit a patient to a facility may have occurred outside of the facility (i.e., with the ambulatory physician). For physician-based rules, the results were mixed.
Figure 22. Relationship between Number of Settings Involved in Episode and Attribution
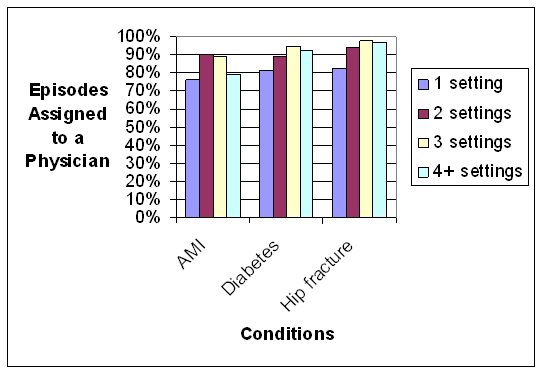
Figure 22 shows the relationship between the number of settings involved in an episode and the percent of ETG episodes that could be assigned based on the episode professional services payment plurality rule (single provider accounting for at least 30 percent of professional services payments) for AMI, diabetes and hip fracture. While the percent of episodes related to AMI that were able to be attributed to a physician initially increased with the number of settings, there was a substantial drop-off when the episode involved four or more settings. This drop-off was very small, however for diabetes and hip fracture.
The previous table and figure show that episodes can be assigned to providers, but this does not guarantee that the attribution will have face validity with the provider. While a majority of the costs of care in an episode with a facility admission will be driven by the facility costs, it may be less clear whether the physician who delivered care before the admission or the physician who managed the patient inside the admission had more responsibility over the costs of that episode and how to divide responsibility. Of potential concern is that an assigned provider, either a physician or a facility, may actually provide a relatively small fraction of the care in terms of costs and that this may create face validity problems in making the assignment.
This is borne out in the data. In Table 18 we show results for three rules: "episode payments plurality", "facility payments plurality" and "episode payments plurality + facility payments plurality." We show data for ETG episodes; MEGs produce similar results. The fraction of payments for services delivered by the provider(s) to which the episode is attributed varies substantially by both attribution rule and condition; a rule with a high fraction for one condition may have a low fraction for another condition. Rules that assign care to both a physician and a facility had a larger fraction of payments being delivered by the responsible provider. These data show the utility of multiple attribution, but also raise questions regarding if the rule were based on single attribution to a physician and multiple physicians are involved, which physician is more responsible for managing the costs of the episode? The preferred attribution rule would likely be determined by what is trying to be accomplished from a policy perspective, the type of episode that is being measured, and the application.
| Condition | Episode Payments Plurality | Facility Payments Plurality | Episode Payments Plurality + Facility Payments Plurality |
|---|---|---|---|
| AMI | - 6.5% | 66.4% | 73.0% |
| Diabetes | 29.0% | - 5.0% | 34.0% |
| Hip Fracture | - 8.9% | 54.3% | 63.1% |
Geographic Variation and Out of State Care
Much of the data presented in the chapter has been aggregated across the three states, Florida, Oregon and Texas. Figure 23 shows the average standardized payments per ETG episode by state for each of the nine conditions. As shown, there is substantial variation in the payments per episode, but the pattern by state is not completely consistent. For most conditions, Oregon has lower standardized payments per episode than either Florida or Texas. For some conditions, Florida and Texas have very similar average standardized payments per episode, but Texas has substantially higher payments for bacterial pneumonia, cerebrovascular disease and hip fracture, while Florida has higher average standardized payments for congestive heart failure. These differences could be driven by differences in the number of episodes per beneficiaries in the three states, which could be interpreted as differences in case mix or health of the beneficiaries. The variations could also be due to variations in practice patterns or differences in the use of different care settings, such as the use inpatient rehabilitation facilities versus SNFs. It will be important in future work to distinguish how much of the differences observed are a function of these various factors and to consider the implications for performance measurement and financial incentives.
Figure 23. Average Standardized Payments per Episode by Condition and State, ETGs
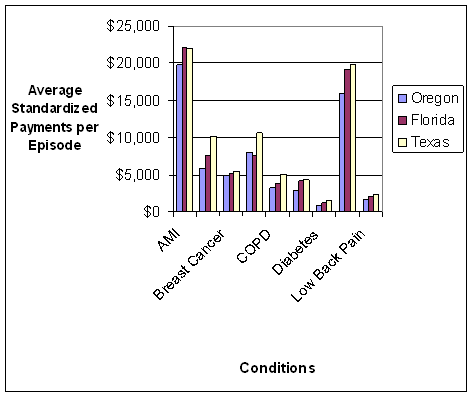
Figure 23 shows the average standardized payments per ETG episode by state for each of the nine conditions. As shown, there is substantial variation in the payments per episode, but the pattern by state is not completely consistent. For most conditions, Oregon has lower standardized payments per episode than either Florida or Texas. For some conditions, Florida and Texas have very similar average standardized payments per episode, but Texas has substantially higher payments for bacterial pneumonia, cerebrovascular disease and hip fracture, while Florida has higher average standardized payments for congestive heart failure. These differences could be driven by differences in the number of episodes per beneficiaries in the three states, which could be interpreted as differences in case mix or health of the beneficiaries.
Figure 24. Types of Facilities Involved in ETG Episodes Related to Hip Fracture by State
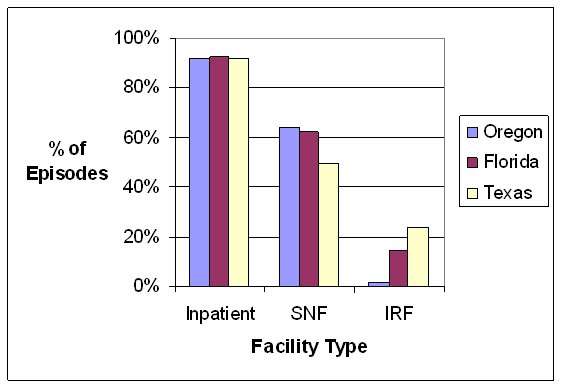
Figure 24 illustrates for hip fracture the state variation in the types of facilities involved in the management of an episode. While approximately 80 percent of episodes related to hip fracture involve an inpatient hospital setting in all three states, there is variation in the use of inpatient rehabilitation facilities (IRFs) and SNFs. Of the three states, Texas has the highest use of IRFs and the lowest use of SNFs, suggesting these two types of facilities are substitutes. Oregon, which has few IRFs, has a much use of SNFs for hip fracture-related episodes.
Figure 25. Percentage of ETG Episodes Involving Providers from More than One State
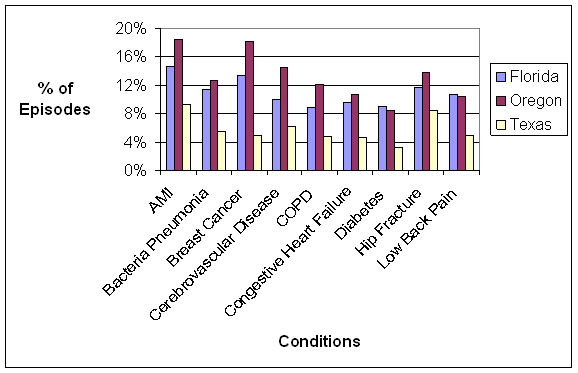
Figure 25 shows the fraction of care delivered outside the primary state of residence of the beneficiary for each of the nine conditions. This out of state care could be due to beneficiaries residing in a different state for part of the year (e.g., snowbirds), referrals to providers or facilities in a different state, or cross border care when a beneficiary lives close to a state line. There was variation among beneficiaries in the three states in the proportion of ETG episodes that involved providers outside of the beneficiaries"™ primary state of residence, with Oregon having the largest fraction. Contrary to our expectations, Florida does not have the highest rate of out of state care due to snowbirds, but this may be because Florida is not the primary state of residence for these individuals. Overall out-of-state care was received for a minority of episodes "“ less than 20 percent. However, when out of state care was involved, it was often a significant portion of the total standardized payments for the episode, with the average ranging from 43 to 57 percent. Similar results were observed using MEGs.
Implications of Beneficiaries with High Disease Burden
To understand the extent to which episodes may differ for complex patients compared to less complex patients, we conducted a series of analyses using the number of episodes experienced by a beneficiary as a proxy for patient complexity. Beneficiaries were separated into three categories based on the number of ETG episodes they were assigned: up to 5 episodes (approximately 25 percent of beneficiaries), 6-11 episodes (approximately 50 percent of beneficiaries), and 12 or more episodes (approximately 25 percent of beneficiaries). In this section, we present selected results from these analyses.
Figure 26. Average Standardized Payment per Episode by Number of Episodes Experienced
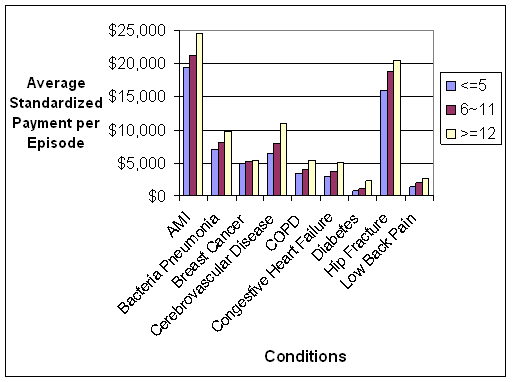
Figure 26 shows there is in general a consistent relationship between the total number of ETG episodes experienced by a beneficiary and the average standardized payment per episode for episodes related to the condition of focus. The more episodes experienced by a beneficiary, the higher the standardized payments. There was one exception to this pattern for congestive heart failure, which was driven by a very high cost outlier with a small number of episodes.
Figure 27. Median Number of Providers per Episode by Number of Episodes Experienced
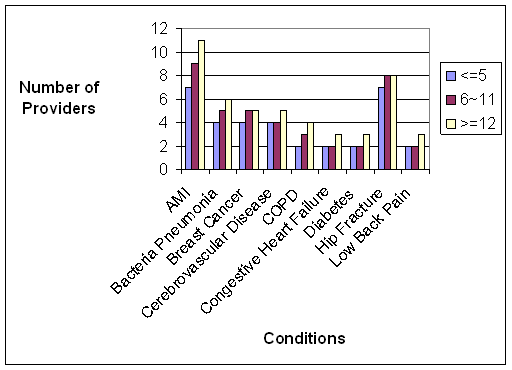
Figure 27 shows that the greater the total number of ETG episodes experienced by a beneficiary, the more providers that tend to be involved in managing their care for a specific episode. This was largely driven by larger numbers of specialists involved when the beneficiary experiences many episodes. This larger number of providers involved doesn"t necessary translate into greater challenges attributing episodes to physicians, however.
Figure 28. Percent of Episodes Attributed to Physicians by Total Number of Episodes Experienced.
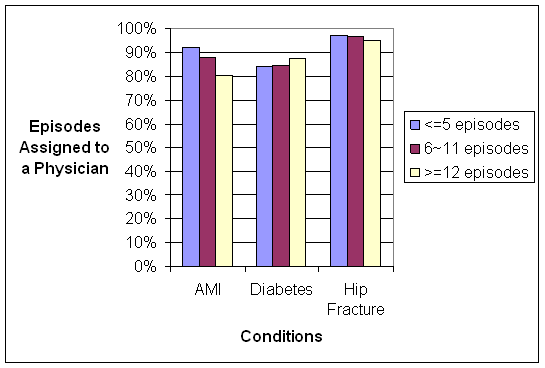
Figure 28 shows the percent of episodes related to AMI, diabetes and hip fracture that could be attributed to a physician using the episode professional services cost plurality rule (single provider accounting for at least 30 percent of professional services costs). While the percent of episodes able to be attributed declined with increasing episodes experience by beneficiaries with AMIs, it actually increased slightly for beneficiaries with diabetes, and remained fairly stable for beneficiaries with hip fractures.
Summary
In this chapter, we presented the results of exploratory analyses to identify issues related to constructing and using episodes of care the purposes of measurement and aligning incentives to deliver high quality care. The episodes of care were constructed for convenience using by two commercial episode groupers, Symmetry ETGs and Thomson MEGs.
We found that beneficiaries with the nine conditions we examined experienced an average of 10 episodes of any kind during the measurement year, most of which were not related to nine conditions of focus in this study. Many of the unrelated episodes were common among a large proportion of beneficiaries across the nine study conditions, such as hypertension, congestive heart failure, and fungal skin infections. It is unclear whether physicians and other providers would view a beneficiary's multiple episodes as defined in this study as distinct issues to be managed separately or as related issues to be managed jointly.
We found that standardized payments per episode varied widely both across and within the nine conditions, In addition, there was an inverse relationship was observed between standardized episode payments and the coefficient of variation. We used fairly broad groupings of patients based on the nine conditions. Heterogeneity within a condition might be reduced if subgroups of patients were created. For example, instead of grouping together all diabetics, separating them into categories based on the degree of advancement of their disease. There is also a need to understand the key sources of variation in standardized payments and which sources need to be accounted for in the episode construction or patient group creation, versus which are sources of variation you could seek to eliminate through the application of episodes for performance measurement or financial incentives.
Beneficiaries who experienced a greater total number of episodes (both related and unrelated to conditions of focus) had higher average standardized payments per episode and more providers involved in the delivery of care for each episode related to the conditions of focus. This suggests the need to not only risk-adjust for the severity of the specific condition of focus, but also the other conditions experienced by the beneficiary.
Across the nine conditions, there was no standard care pattern of types of providers and settings involved for the related episodes. Even for patients with the same condition, there was substantial variation in care trajectories. Often care cuts across three settings of care for any given condition. During a single episode of care, the care provided was often dispersed among multiple specialists, but usually involved a single primary care physician (PCP). These PCPs may offer a foundation for coordinating the care across an episode.
Care patterns showed variation across the three states we examined. Some of the variation that was observed is likely related to differences in the supply of different types of health care providers in different geographic health care markets. For example, inpatient rehabilitation facility (IRF) care was more common for episodes in Texas, where these types of facilities are relatively numerous. In Oregon and Florida, the use of IRFs was less common than in Texas, but use of SNFs was more common. The implications of these supply-related variations in care patterns are not clear.
A significant fraction of episodes could be assigned to a provider for most of the attribution rules we studied. However, we did observe variation in what proportion of the episodes could be assigned depending on the rule and the type of condition. Some conditions are addressed primarily in an ambulatory setting and in these types of episodes, a facility-based rule led to a smaller share of episodes being assigned. For other conditions, an individual provider may represent only a small fraction of total episode payments (e.g., physicians in an AMI episode represent only 6.5% of total costs, whereas the facility represents 66.4%), and in this situation, rules that would assign the episode to this single physician may not be as appropriate. These findings illustrate that a single approach to attributing episodes to providers may not be appropriate.
Variation existed across the three states in the average number of episodes per beneficiaries, both overall and for beneficiaries with each of the nine conditions focus, average standardized payments for episodes related to the nine conditions, the involvement of different post-acute care providers, and the percent of episodes for which beneficiaries received care outside of their state of residence. The mean number of total episodes of all types per beneficiary varied widely among the three states in our analysis, averaging 6.1 episodes per beneficiary in Oregon, 6.9 in Texas and 8.0 in Florida. The average standardized payment per episode for the episodes related to the nine conditions varied in a consistent pattern across the nine conditions, and Oregon consistently had lower average per-episode payments than Florida or Texas. The reasons behind these geographic variations in per episode payments and frequency of episodes are unclear.
These results suggest that the optimal way in which episodes would be constructed would depend on how they would be applied and on policy considerations, such as promoting improved coordination among providers in the delivery of care across a patient's care trajectory within an episode. Because this study relied on the use of two existing commercially available episode groupers, what we observed in the data analyses we performed was influenced by how each of the grouper tools constructs an episode, and those reading this report should bear this in mind. For example, distinguishing between acute events and chronic episodes is an important consideration. There are chronic episodes with acute exacerbations (such as ischemic heart disease with a heart attack), strictly chronic episodes (ongoing management of diabetes), and strictly acute episodes (such as hip fracture), and the policy considerations are likely to differ depending on the type of episode being considered and the application.
6. Conclusion
Current Medicare performance measurement and payment policies are structured in ways that foster setting-based, provider-centric care delivery, as their design emphasizes measurement of and payment for individual services delivered by individual providers in separate settings of care. These design features foster and reinforce a silo-based approach to care management, which contrasts sharply with an average Medicare beneficiary's care needs and care experiences. As the analyses in this study reveal, Medicare beneficiaries frequently have multiple, complex chronic conditions and typically receive care from multiple providers, who often practice in different settings of care. Beneficiaries' needs might be better service by a more coordinated and integrated approach to care delivery.
Existing payment and accountability structures pose challenges in being able to close the quality gap and provide cost-efficient care to an ever-growing population of Medicare beneficiaries. Silo-based approaches to performance measurement, accountability and payments do not provide the stimulus to deliver care in a patient-centered and coordinated fashion. Recent reform proposals have called for approaches that would better align and strengthen provider incentives (both financial and non-financial) to deliver care in a more proactive and holistic way (Baucus, 2008). Applying episodes of care as the basis for performance measurement, accountability and payment is one potential reform mechanism that could drive the system towards a more patient-centered care focus, improve quality and lead to improved efficiencies in the use of resources. Additional research is needed to examine the practical application and implementation options of an episode-based approach to Medicare FFS.
This report summarizes the findings from an exploratory examination of issues related to the construction of episodes of care for different clinical events/conditions and the potential application of episodes within Medicare for payment and performance measurement purposes. As we summarize the key lessons that emerged from our review of the literature, expert discussions, and data analyses and consider the policy implications, we do so within the framework of a building block approach to constructing and applying episodes of care that was outlined at the start of this report. - The findings contained in this report reflect the design features of the two commercially available grouper software tools that were used to construct episodes in this project. Other types of episode constructions could yield different results. Additionally, some of the observed variation in results across states may be an artifact of variations in coding practices in different regions and future work should attempt to understand the extent of variation in coding practices.
Key Findings and Implications
This study identifies a number of important issues that need to be examined in more depth, should Medicare decide to pursue any of the possible paths towards using episodes of care as a basis for performance measurement, accountability, or payment. We highlight seven important findings and consider their implications with respect to constructing and applying episodes of care for various purposes. We remind readers of this report that the observed results are, in part, related to how the commercial episode grouper tools define what claims get assigned to an episode (i.e., the underlying grouper logic used to construct an episode) as well as variations in coding practices among providers in what diagnosis they code as primary versus secondary and the completeness of this coding. - Alternative types of episode constructions could yield different results.
1. Medicare beneficiaries have a large number of different episodes types per year.
The Medicare beneficiaries for the nine conditions we examined had an average of 10 episodes during the year, and the majority of episodes were unrelated to the condition that was used as a criterion for inclusion of the beneficiary in this study. Most episodes were of varying types (i.e. not repeated occurrence of the same type of episode). Many of the other unrelated episode types were common among beneficiaries across the nine study conditions, such as fungal skin infections, hypertension, COPD.
From a performance measurement and payment perspective, the large number of episodes per beneficiary--some of which might benefit from coordinated management--raises questions about the degree to which care for a particular beneficiary should be examined holistically, or alternatively, split into small units of analysis such as within specific types of episodes. How one defines an episode of care represent a point on a continuum of different levels of aggregation of services, ranging from the sum of all services provided to a beneficiary per year (such as a per-capita approach) to each of the separate services that are used as a basis for current FFS payments. However, there is a large middle ground, in terms of the ways in which services could potentially be grouped to better align care delivery and incentives for providing the right care, between these two extremes. - In considering the specific application of the episode it is important to conditioner: 1) What is the optimal way to define an episode? and 2) How much aggregation of services does the episode construction entail?
In general, a broader episode definition lends itself to a more holistic view of patient care, while narrower definitions provide more of a condition-specific (or, with an even narrower definition, a treatment- or service-specific) perspective on care. Broader episode definitions will include more variability in the service content of the episode and a greater number of providers involved in care, creating greater complexities for performance measurement and structuring payments. For example, the inclusion of more services that touch more providers across more settings of care presents challenges for assigning accountability to a single provider or multiple providers who may or may not feel "ownership" of management of the episode depending on their level of involvement. Depending on the amount of variability in the content of the services provided within an episode construct, this could increase the financial risk to providers in the context of a bundled payment if the variation is large.
Ultimately, the specific application should drive the construction of the episode and it is possible that that episode definitions may need to vary depending on the application. For quality measurement, the episodes that were generated from the commercial grouper tools within the context of this study may be too narrow to optimize patient management for some conditions. Many conditions are interrelated and so is their management-such as the case for management of ischemic heart disease, hypertension, hyperlipidemia, and diabetes; in such cases, quality measurement approaches using a broad episode definition encompassing a cluster of related conditions may be more appropriate than measures for tranches of care related to each condition separately. Additional work is required to better articulate what types of episodes are clustered together and represented related conditions, and to assess the implications for coordinated patient management among the array of providers involved in a beneficiary's care. Existing performance measures focus on discrete services within single conditions, and little work has been done to define how to optimize the management of patients with co-occurring conditions and to develop associated integrated performance measures
In contrast, the episode definitions used in this study may be too broad for some payment applications. The substantial variation in standardized payments for some episode types that we observed when applying the ETG and MEG grouper tools suggests that the type of care being delivered within some types of episodes may be heterogeneous and reflect care for different types of patients. Providers may be placed at financial risk when variations are due to underlying differences in the severity or types of cases being managed. Additional work to understand the extent to which the episodes within a given condition reflect similar patient populations would help determine whether the variation is a function of differences in patients vs. care management practices. To the extent that the variations are due to variations in practice patterns for an otherwise homogeneous group of patients, dampening down on the variation through a "bundled" payment may be appropriate while not exposing providers to undue risk.
The episode constructions within the ETGs and MEGs are fairly broad and include all providers and settings, but they were not developed for the purpose of quality measurement or payment applications. 32 Use of off-the shelf grouper tools was done for convenience to illustrate some of the types of issues that would need to be considered if episode-based approaches were applied. Narrower episode definitions could be constructed either by using different algorithms, further limiting the services that were considered to be part of a single episode, or by considering only certain providers or settings within the ETG and MEG episode groupings; additionally, broader definitions, including per-capita analyses, could be considered. In our discussions with experts, they noted that more-narrowly defined episodes, such as those encompassing a single setting (e.g., hospital inpatient) were the most feasible and a good starting point; however, to achieve substantial benefits, multiple settings would have to be grouped together in the episode (e.g., hospital, ambulatory, post-acute care), and doing so would strengthen incentives for care coordination.
It is unclear whether physicians and other providers would view a beneficiary's multiple episodes as defined in this study as distinct issues to be managed separately or as related issues to be managed jointly. If providers viewed certain episodes as related issues that should be managed jointly (e.g., episodes of ischemic heart disease, hypertension, and hyperlipidemia), then it may be appropriate to expand episode definitions under some approaches to group related conditions. One possibility would be to create bundles of episodes that commonly co-occur and which would benefit from a more integrated management approach.
It is also unclear whether the same provider would be attributed primary responsibility for multiple different types of episodes. Our analysis did not assess whether the same or different providers were involved in managing the different types of episodes for a single Medicare beneficiary, and future analyses could examine how many unique providers are involved in managing all the various episodes for a single Medicare beneficiary. It is possible that several related episodes for a patient could be attributed to different providers - for example, a patient with an AMI could have had an ischemic heart disease episode attributed to a cardiologist, a hypertension episode attributed to a primary care physician, and a diabetes episode attributed to an endocrinologist. Future research could test the extent to which different episodes for a single beneficiary are attributed to one or multiple providers using common attribution rules, and whether these assignments match the perceptions of the physicians involved in delivering the care as to who is responsible for managing which aspects of care and whether there should be joint management and accountability (absent explicit organizational relationships such as in integrated provider organizations).
2. Standardized payments varied widely across and within episode types.
Appendix B. Specifications Used to Create Episodes[36]
Constructing Episodes of Care Using Symmetry and Medstat Groupers
The episode groupers utilize the primary diagnosis on claim line items to create and place the line items into episode. Only certain types of claims, as determined by procedure and revenue codes, can start an episode such as evaluation and management procedure codes, surgery procedure codes or specific inpatient facility revenue code. Conceptually, episodes are determined to be complete if one observes an adequate "clean period" ahead of the initial date on the claims and also observes an appropriate clean period after the final date on the claims. Clean periods, or intervals during which there are no claims associated with a given episode type, are used by the grouper packages to determine whether two claims are close enough together in time to be considered part of the same episode. Each episode type (ETG for Symmetry and MEG for Medstat) has an associated clean period that is set by the groupers on consultation with physicians. These clean periods range from 0 days to 999 days. Acute episode types have shorter clean periods; chronic episode types have longer clean periods. The notion of a clean period does not fit well with the concept of a chronic disease. With a three year window of data for our analysis, it is extremely difficult for chronic episodes to be deemed complete (since they need clean periods of 180 to 365 days.37) Recognizing this issue, episode groupers typically set fixed annual lengths for those episodes associated with chronic diseases, and one episode commonly immediately follows another; no clean periods are imposed. Following this convention, we rely on calendar years for measuring the lengths of chronic episodes.
Prior to running the episode groupers, the user must construct files to meet each grouper's specifications. Additionally, options in each grouper's configuration files must be set so the software properly reads the information on the input files and constructs episodes in a manner suiting the user's needs. MaCurdy et al. (2008) evaluated the functionality of each grouper in producing episodes of care using Medicare claims data and developed a set of baseline file configurations and settings adapted to structure of Medicare claims. The episodes for this analysis are created using the baseline settings established by MaCurdy et al., with one exception: Medstat episodes are created using an adaptation of the Build Admissions feature, which groups all claims concurrent with an inpatient stay to the episode associated with the stay. Following is a brief overview of the settings used to construct the episodes of care used in this analysis.
Specifications for Creating Symmetry Records
To create episodes of care, Symmetry inputs service-level records with each input record containing information on a single service item and up to four diagnoses per record. These records also include data on dates of service. Services are always identified on an institutional claim (IP, OP, SNF, HH and HS claims) by a revenue center code, and if there are HCPCS/CPT codes on a claim, each always corresponds to single revenue center code. So in creating service-level inputs from institutional claims, we use a single revenue center code as the principal designator of the service and include procedure codes when present. A service record from an institutional claim also includes up to the first four diagnosis codes listed on parent record38 For non-institutional services, Medicare's PB and DME claims are readily separated into line items associated with individual HCPCS or CPT codes; these claim types have no revenue center codes. Each input record constructed from a PB and DME claim consists of a single procedure code and its corresponding line-item diagnosis. Consequently, in addition to diagnosis information in a Medicare setting, the ETG grouper primarily relies on revenue center codes to group IP/SNF/HS claims, procedure codes to group PB and DME claims, and it can use either or both types of codes to group OP and HH claims.
In addition to using input files, the user can influence grouping outcomes through a configuration file, which we largely set to Symmetry's default settings. Among the default settings we use is Symmetry's link facility records feature, which connects claims associated with hospital stays into "confinements." We use this feature since Medicare IP claims are not necessarily separate admissions. We also use Symmetry's ETG-specific clean periods and default annual truncation of chronic episodes when creating episodes. We do not, however, use the "summarize complete episodes only" feature as suggested by Symmety's documentation because we want to analyze both incomplete and complete episodes.
With non-institutional claims, the cost of the procedure is identified with each line item, thus there is no ambiguity in assigning the cost of services to episodes. However, costs of services on institutional claims cannot be disaggregated from the Medicare payment for the parent claim. This does not pose a problem when all services from the parent claim are grouped to a single episode, but when the input records of an institutional claim are assigned to two or more episodes, the ETG grouper offers no guidance for how to divide the cost of this claim across its associated episodes. We implement a plurality rule to allocate costs when service-level inputs for a single institutional claim are grouped to multiple episodes. This rule assigns the cost of the institutional claim to the episode that captures the largest number of service-level inputs from the parent record. In the case of a tie, costs are evenly split between episodes.
Specifications for Creating Medstat Records
Regardless of whether a Medicare claim comes from an institutional or non-institutional source, the MEG grouper accepts one input record per claim. Medstat primarily relies on diagnosis codes for grouping, thus all available diagnosis codes from a claim are included on a Medstat record. This record distinguishes IP and PB claims from other types of Medicare claims, but it does not differentiate among the other distinct types of Medicare claims as the source of diagnoses. Switching claims from one of these types to another results in no change in constructed episodes. An input record accepts data on procedure codes appearing on the claim (not revenue center codes). This procedure information is primarily used to determine whether a claim represents an x-ray/lab event—which cannot start an episode—and in some instances to assist the grouper in deciding how to interpret secondary diagnoses on the claim.
When inputting files into Medstat, we configure the software's options either to their defaults or to the settings most parallel to Symmetry. The episode length limit in Medstat's configuration file is set to make it comparable to Symmetry's episode limit of 365 days, and the chronic episode length is set to a year so as to construct chronic episodes that are comparable to Symmetry's annually truncated episodes. We also configure the grouper to divide some chronic MEGs into chronic conditions and acute flare-ups. Finally, we create inpatient stays, or admissions, from IP claims using Medstat's Build Admissions feature, which is similar in design to Symmetry's link facility records feature. These admissions are then used to group the episodes; every claim in a given admission will always be placed into the same episode of care.
In addition to the standard grouper configuration options, we rely on an adaptation of Medstat's software that groups all claims concurrent with an IP stay into the same episode as the IP claim. MaCurdy et al. (2008) refer to this adaptation as the “All Services Admissions Build.” We selected this approach for running the Medstat grouper to mimic some common payment patterns observed in Medicare data. Medicare pays for near-daily Evaluation & Management (E&M) services by a physician during a hospital admission, and post acute care in the form of SNF claims, which must closely follow and be directly linked to a related IP stay. Inspection of claims submission patterns in Medicare data clearly reveals the influence of these payment practices. By using the “All Services Admissions Build” adaptation of the Medstat grouper, one ensures that relevant Part B physician claims concurrent with a hospital stay are grouped into the same episode as the IP claim paying for this stay, and, further, that a SNF claim immediately following this stay is also grouped to the same episode. Although the “All Services Admissions Build” adaptation offers a mechanism for guaranteeing the bundling of relevant claims into the same episode, this feature represents a philosophical shift in the meaning of an episode in the sense that claims issued during an IP stay are no longer grouped according to diagnosis but are instead grouped merely on the basis of whether their dates fall within the IP admission. When grouped on the basis of diagnoses, the Medstat software assigns many claims concurrent with a hospital stay to episodes different from IP claim, which more closely corresponds to the grouping results produced by Symmetry.
Unlike Symmetry, which groups service-level items, Medstat groups claim-level items. This is an important distinction for cost allocation. Specifically, whereas services from a parent claim can be grouped to multiple episodes by Symmetry, claims are always grouped to a single episode by Medsat. As a result, the complete cost from an IP claim is always assigned to a single Medstat episode.
References
MaCurdy, Thomas, Jason Kerwin, Jonathan Gibbs, Eugene Lin, Carolyn Cotterman, Margaret O'Brien-Strain and Nick Theobald. 2008. "Evaluating the Functionality of the Symmetry ETG and Medstat MEG Software in Forming Episodes of Care Using Medicare Data." Burlingame, CA: Acumen, LLC.
Appendix C. Episodes Related to Conditions of Focus
| Condition | ETGs (version 6.0) | MEGs |
|---|---|---|
| Acute myocardial infarction | 386500: Ischemic heart disease | 11: Acute myocardial infarction |
| Bacterial pneumonia | 437400: Bacterial lung infections | 510: Pneumonia: bacterial |
| Breast cancer (limited to women) | 635600: Malignant neoplasm of breast | 212: Neoplasm, malignant: breast, female
427: Encounter for Chemotherapy 431: Encounter for Radiation Therapy |
| Cerebrovascular disease | 316000: Cerebral vascular accident | 395: Cerebrovascular disease, chronic maintenance
396: Cerebrovascular disease with TIA 397: Cerebrovascular disease with stroke |
| Chronic obstructive pulmonary disease- - | 439300: Chronic obstructive pulmonary disease (COPD) | 500: Chronic obstructive pulmonary disease |
| Congestive heart failure | 387100: Heart failure, diastolic
386800: Congestive heart failure |
9: Congestive heart failure |
| Diabetes | 163000: Diabetes | 49: Diabetes mellitus type 1 Maintenance 50: Diabetes mellitus type 2 and hyperglycemic states maintenance 51: Diabetes mellitus with complications |
| Hip fracture | 712903: Open fracture or dislocation - thigh, hip & pelvis 713103: Closed fracture or dislocation - thigh, hip & pelvis |
360: Fracture, dislocation or sprain: hip or pelvis 348: Fracture: Femur, Head or Neck |
| Low back pain | 711908: Major joint inflammation, back
712208: Joint degeneration, localized, back 713109: Closed fracture or dislocation of trunk 714608: Minor orthopedic trauma - back 714908: Other minor orthopedic disorders - back 715108: Orthopedic deformity - back 719908: Orthopedic signs & symptoms - back |
365: Herniated intervertebral disc
374: Osteoarthritis 389: Other arthropathies, bone and joint disorders 391: Other spinal and back disorders 405: Injury: spine and spinal cord |
Appendix D. Standardized Payment Methodology
Average payments were standardized for each setting based on 2005 payment rates and payment policy to exclude variation in resource use due to geographic factors (i.e., area wages, geographic differences in medical liability costs, and urban/rural status) and policy considerations (i.e., indirect medical education (IME), and disproportionate share (DSH) payments for hospitals). This was done to make variations in standardized payments reflect differences in the services being delivered rather than differences in the cost of doing business where the services are delivered or policy considerations. Adjustments for high cost and low cost outliers were made for settings that identified outliers; outlier adjustment were made for acute care hospitals, long-term care hospitals, inpatient rehabilitation facilities, inpatient psychiatric facilities, home health care, and hospital outpatient services. In order to more accurately reflect payments that would be paid by Medicare, we reduced standardized payments by setting-specific patient copayment percentage. We did not adjust standardized payments for patient deductibles as these would vary based on the other services the beneficiary had previously received during the calendar year.
Acute Care Hospital
Medicare PPS
Base rate (adjusted for area wages) * DRG weight + IME payment + DSH →
(adjusted for transfers)1 = Payment (adjusted for high cost outliers)
RAND Standardized payment
Base rate * DRG weight → (adjusted for transfers)1 = Payment (adjusted for high cost outliers)
1Transfer adjustment: Apply 2 times the per diem rate for the first day and the per diem for each additional day up to the full DRG rate. The per diem rate = Base DRG rate * weight / average LOS for a specific DRG
- Include transfers to another acute care hospital or a post acute care setting for related care within 3 days
- Length of stay (LOS) is at least one day less than the geometric mean LOS for the corresponding DRG
- Limited to the DRGs that are subject to the transfer policy; for DRGs with a discharge date before 10/01/05, a list of 29 DRGs is used; for discharges after 10/01/05 a list of 182 DRGs is used
- For special pay transfer DRGs (effective 10/01/05), hospitals receive 50 percent of the full DRG payment plus the single per diem for the first day of the stay and 50 percent of the per diem for the remaining days of the stay, up to the full DRG payment
Summary Comments: The difference between the Medicare PPS payment and the RAND standardized payment is that we did not adjust the payment for IME and DSH as these reflect issues associated with achieving certain policy objectives. We did not adjust for area wages so that variations in standardize payments reflect differences in the number and types of admissions rather than differences in the cost of doing business where the services are delivered. We treated Critical Access Hospitals the same as acute care hospitals.
Skilled Nursing Facility (SNF)
Medicare PPS
SNF per diem base rate (adjusted for area wages) * RUG weight * LOS = Payment
RAND Standardized payment
(SNF per diem base rate * RUG weight)1 * LOS = Payment
1There are two SNF base rates, an urban base rate and a rural base rate rather than a more refined set of area wage adjustments as are used for many other provider settings. We used the average of the case-mix adjusted urban and rural per diem rates to reach a blended rate. This blending will remove variation in payments due to the geographic area in which care is being delivered.
Long Term Care Hospital (LTCH)
Medicare PPS
LTCH base rate (adjusted for area wages) * LTC DRG weight = Payment (adjusted for high cost or short stay outliers)
RAND Standardized payment
LTCH base rate * LTC DRG weight = Payment (adjusted for high cost or short stay outliers)
Summary Comments: The difference between the Medicare PPS and RAND standardized payment method is that we did not adjust the payment for area wages. We did not adjust for area wages so that variations in standardized payments reflect differences in the number and types of LTCH admissions rather than differences in the cost of doing business where the services are delivered.
Inpatient Rehabilitation Facility (IRF)
Medicare PPS
IRF base rate (adjusted for area wages) * CMG weight = Payment (adjusted for high cost or short stay outliers)
RAND Standardized payment
IRF base rate * CMG weight = Payment (adjusted for high cost or short stay outliers)
Summary Comments: The methodology is the same for the Medicare PPS and the standardized payment except that we did not adjust the payment for area wages or outliers. We did not adjust for area wages so that variations in standardized payments reflect differences in the numbers and types of admissions rather than the cost of doing business where the services are being delivered.
Inpatient Psychiatric Facility (IPF)
Medicare PPS
IPF per diem base rate (adjusted for area wages) * PPS adjustment factor (DRG, age, comborbidity) * per diem adjusters + payment for ECT treatments = Payment (adjusted for high cost outliers
RAND Standardized payment
IPF per diem base rate * PPS adjustment factor (DRG, age, comborbidity) * per diem adjusters + payment for ECT treatments = Payment (adjusted for high cost outliers)
Summary comments: The methodology is the same for the Medicare PPS and the standardized payment except that we did not adjust the payment for area wages. We did not adjust for area wages so that variations in standardized payments reflect differences in the numbers and types of admissions rather than the cost of doing business where the services are being delivered. In the Medicare PPS system, the per diem adjuster for the first day of the stay is different for facilities that do and do not have an emergency department. We used an average of these two weights.
Home Health
Medicare PPS
Home health base rate (adjusted for area wages) * HHRG weight = Payment (adjusted for high cost or short stay outliers)
RAND Standardized payment
Home health base rate * HHRG weight = Payment (adjusted for high cost or short stay outliers)
Summary comments: The difference in the methodology is that RAND did not adjust the payment for area wages. We did not adjust for area wages so that variations in standardized payments reflect differences in the frequency and types of home health care being delivered rather than differences in the cost of doing business where the services are delivered.
Ambulatory Surgical Center (ASC)
Medicare PPS
ASC Fee Schedule1
RAND Standardized payment
ASC Fee Schedule1
1The fee schedule only applies to the procedure with the highest payment rate, and the payments for other procedures on the same claim are reduced by 50%
Clinical Laboratory Services
Medicare PPS
Payment for the lab service = the lesser of the provider's charge, the carrier fee schedule
amount or the National Limit Amount (NLA is 74% of the median of fee schedule amounts set by 56 carriers)
RAND Standardized payment
Payment for the lab service = NLA
Summary comments: We utilized the same methodology to reach the standardized payment as MedPAC used in the standardization of payments in the June 2006 Report to Congress, “Increasing the Value of Medicare”. According to the MedPAC Payment Basics, most lab services are paid at the NLA rate.
Physician Services
Medicare PPS
Conversion factor * (Work RVU * Work GPCI + PE RVU * PE GPCI + PLI RVU * PLI GPCI) → Payment modifier1 → Adjustment for provider type2 → Geographic adjustment = Payment
RAND Standardized Payment
Conversion factor * (Work RVU + PE RVU + PLI RVU) → Payment modifier1 → Adjustment for provider type2 = Payment
1Modifiers are used when physicians assist in a surgery, when multiple procedures are performed for the same patient on the same day, etc
2Payment is reduced 15% for nurse practitioners and physician assistants
Summary comments: RAND utilized the same methodology as the Medicare PPS but excluded all geographic adjustments (e.g. area wages and medical liability costs). We did not include geographic adjustments so that variations in standardized payments reflect differences in services being delivered rather than differences in the cost of doing business where the services are delivered.
Anesthesia
Medicare PPS
Anesthesia conversion factor (adjusted for geographic area) * (base units + time units) = Payment1
RAND Standardized payment
Anesthesia conversion factor * (base units + time units) = Payment1
1Payment is reduced by 50% for CRNAs
Summary comments: Unlike the Medicare PPS, we did not adjust the conversion factor for geographic area. We did not include geographic adjustments so that variations in standardized payments reflect differences in services being delivered rather than differences in the cost of doing business where the services are delivered.
Hospital Outpatient Services (including Part B drugs)
Medicare PPS
Conversion factor (adjusted for area wages and geographic factors) * APC relative weight + new technology pass-through payments + rural SCH add-on + hold harmless1 = Payment2 (adjusted for high cost outliers)
RAND Standardized Payment
Conversion factor * APC relative weight3 = Payment (adjusted for high cost outliers)
1Hold-harmless payments apply to cancer, children's and small rural hospitals.
2CMS pays for partial hospitalizations in hospital outpatient departments and community mental health centers on a per-diem basis rather than on a per service basis. The per diem is the expected cost of care.
3The CMS website provides an APC fee schedule which is equivalent to the conversion factor * APC relative weight.
Summary Comments: In calculating the standardized payment, we did not adjust for area wages, new technology pass-through payments (which represent no more than 2% of hospital outpatient costs), rural community hospital add-ons, or hold-harmless payments. For partial hospitalization payments, we first calculated the average payment per unit of service by HCPCS code. The standardized payment for each patient hospitalization admission was then computed by multiplying the average payment per unit of service for the corresponding HCPCS code by the number of service units. We did not include geographic adjustments so that variations in standardize payments reflect differences in services being delivered rather than differences in the cost of doing business where the services are delivered.
Hospice
Medicare PPS
Daily base rate for 4 payment categories (adjusted for area wages: labor-related portion varies by payment category) = Daily payment
RAND Standardized payment
Daily base rate for each payment category = Daily Payment
Summary comment: The difference in the methodology is that RAND did not adjust the payment for area wages. We did not include area wage adjustments so that variations in standardize payments reflect differences in use and types of hospice services being delivered rather than differences in the cost of doing business where the services are delivered.
Durable Medical Equipment
Medicare PPS
Lesser of a) state-specific fee schedule (to capture geographic differences in price) or b) provider's charge for HCPC = Payment
RAND Standardized payment
Average of fee schedule across states = Payment
Summary comment: The difference in the methodology is that RAND took an average of the state-specific fee schedules to remove the adjustment for geographic differences in prices for equipment and did not reduce payment if the provider's charge was less than the fee schedule amount.
Ambulance Services
Medicare PPS
Conversion factor (adjusted for wage differences)* RVU → adjusted for geographic factors =Payment
RAND Standardized Payment
Average of the urban and rural rate for each HCPC within each state → average for each HCPC across all states
Summary Comment: The difference in the methodology is that RAND did not adjust for wage and geographic differences and calculated average rates for each HCPCS first within each state, then across all states.
Appendix E. Settings Involved in Episodes, by Condition and Measures Reported to Medicare Reporting Programs
(as of 12/08/2008, includes measures for 2009 reporting)
Figure E1. Settings Involved in Episodes: AMI (MEGS)
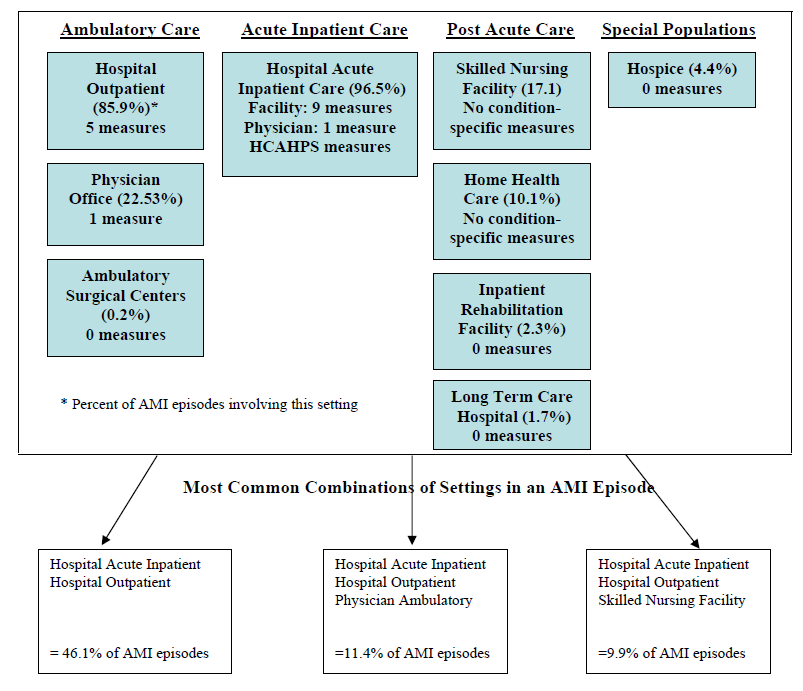
Nearly all (97%) patients with an AMI episode utilized an acute care hospital, 86 percent utilized the hospital outpatient department (which includes the emergency department), and 23 percent visited a physician office for that episode. Additionally, approximately 17 percent of patients utilized home health and 10 percent a skilled nursing facility. The three most common combinations of settings accounted for 67 percent of all AMI episodes in our sample. While there are nine clinical measures reported for the hospital facility (and one for physicians in the hospital setting) and five measures for the emergency department, there is only one measure for care delivered in a physician office. The skilled nursing and home health measures are not condition specific and apply to all patients.
| Measure Condition | Measure | Hospital-Inpatient | Hospital Outpatient/ED | Physician |
|---|---|---|---|---|
| AMI | Aspirin at Arrival- - - - - - - - - - - - - - - - - - - - - - - - - - - - - - - - - - - - - - - - | X | X | X (inpatient)* |
| AMI | Aspirin at discharge- - - - - - - - - - - - - - - - - - - - - - - - - - - - - - - - - - | X | ||
| AMI | ACE-I or ARB for LVSD | X | ||
| AMI | Adult smoking cessation advice/counseling | X | ||
| AMI | Beta blocker at arrival | X | ||
| AMI | Beta blocker prescribed at discharge | X | ||
| AMI | Fibrinolytic medication received within 30 minutes of hospital arrival | X | X | |
| AMI | PCI received within 120 minutes of hospital arrival | X | ||
| AMI | 30-day AMI mortality | X | ||
| AMI | Median time to fibrinolysis | X | ||
| AMI | Median time to electrocardiogram | X | ||
| AMI | Median time to transfer for primary PCI | X | ||
| CAD | Beta blocker therapy for patients with prior MI | X |
*This is a PQRI physician-level measure that would apply in a hospital setting
Other Potentially Relevant Measures
There are number of measures that may apply to subsets of AMI patients. These include CABG/Cardiac Surgery, Heart Failure, and Perioperative measures. Additionally the PQRI measures calling for an electrocardiogram for non-traumatic chest pain or syncope may apply.
Figure E2. Settings Involved in Episodes: Diabetes (MEGS)
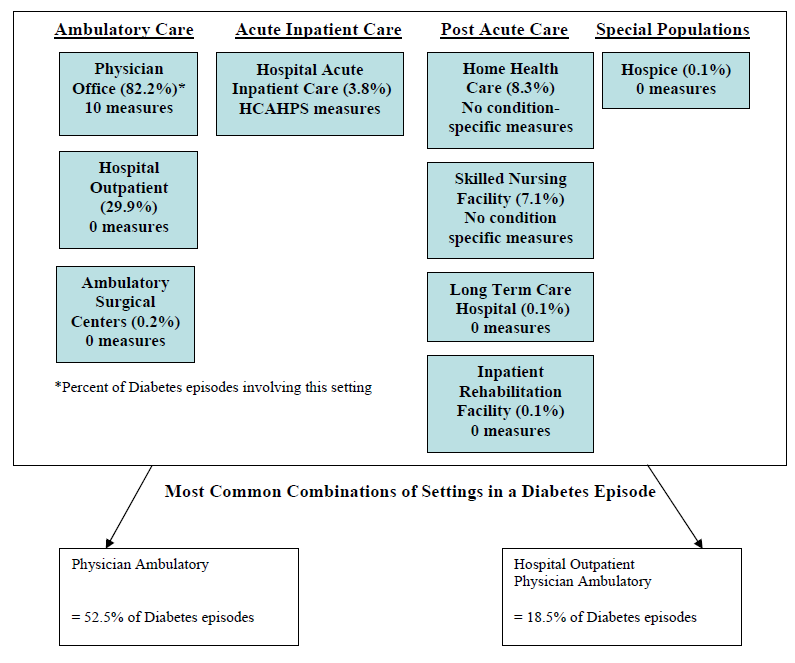
Over 80 percent of patients with a diabetes episode visited a physician office and 30 percent utilized the hospital outpatient department. Only 4 percent had an acute care hospitalization related to the episode. Additionally, 8 percent utilized home health care and 7 percent a skilled nursing facility. The two most common combinations of settings accounted for 71 percent of the diabetes episodes in our sample. There are currently 10 measures reported to CMS for the physician office setting where the majority of the care for diabetes episodes is taking place. The skilled nursing and home health measures are not condition specific and apply to all patients.
| Measure Condition | Measure | Physician (Ambulatory) |
|---|---|---|
| Diabetes | Hemoglobin A1C poor control | X |
| Diabetes | LDL control | X |
| Diabetes | Blood pressure control | X |
| Diabetes | Dilated eye exam | X |
| Diabetes | Urine screening or medical attention for nephropathy | X |
| Diabetes | Foot exam | X |
| Diabetes | Foot and ankle care: neurological evaluation | X |
| Diabetes | Foot and ankle care: evaluation of footwear | X |
| Diabetic Retinopathy | Documentation of presence or absence of macular edema and level of severity of retinopathy | X |
| Diabetic Retinopathy | Communication with the physician managing ongoing diabetes care | X |
Other Potentially Relevant Measures
The PQRI measure for wound care for patients with venous ulcers is also potentially relevant for individuals with diabetes
Figure E3. Settings Involved in Episodes: Hip Fracture (MEGS)
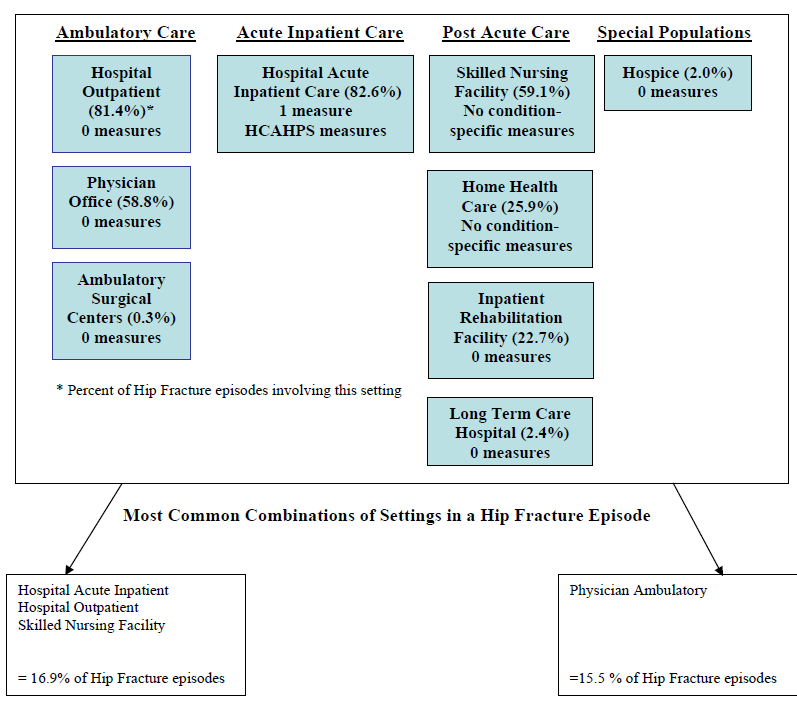
Eighty three percent of patients with a hip fracture episode utilized an acute care hospital, 81 percent utilized the hospital outpatient department (including the emergency department) and 59 percent visited a physician office related to the episode. Additionally, 56 percent utilized a skilled nursing facility, 40 percent home health care 18 percent inpatient rehabilitation. The two most common combinations of settings accounted for 32 percent of the hip fracture episodes in our sample. There is currently only one measure reported to CMS for hip fracture and that is for mortality in the acute care hospital setting. The skilled nursing and home health measures are not condition specific and apply to all patients.
| Measure Condition | Measure | Hospital Inpatient |
|---|---|---|
| Hip Fracture | Hip Fracture Morality Rate | X |
Other Potentially Relevant Measures
As most patients who have a hip fracture will have surgery, the perioperative measures would apply as would the hospital inpatient Patient Safety Indicator for post operative wound dehiscence. Additionally, the PQRI osteoporosis measure calling for management following a fracture would likely apply
Figure E4. Settings Involved in Episodes: Bacterial Pneumonia (ETGs)
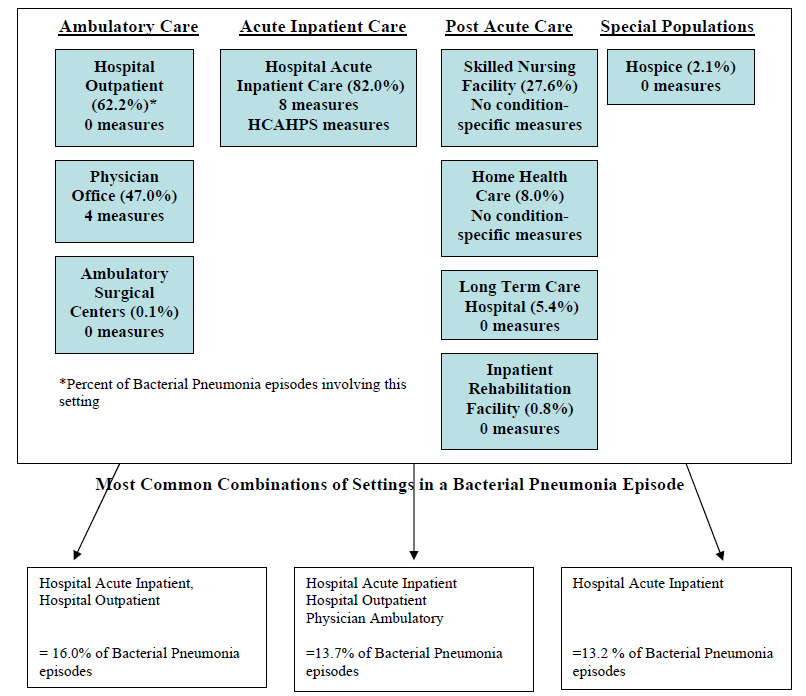
Eighty two percent of bacterial pneumonia episodes involved an acute care hospital, 62 percent involved the hospital outpatient department and 47 percent a physician office visit. Additionally, in nearly 28% of the episodes, patients utilized a skilled nursing facility, in 8 percent they utilized home health care, and 5 percent of episodes involved a stay in a long term care hospital. The three most common combinations of settings accounted for 43 percent of the bacterial pneumonia episodes in our sample. There are eight measures reported for bacterial pneumonia in the acute inpatient setting, no measures reported for the hospital outpatient setting and four measures reported for care in a physician office. The skilled nursing and home health measures are not condition specific and apply to all patients in these settings.
Figure E5. Settings Involved in Episodes: Bacterial Pneumonia (MEGS)
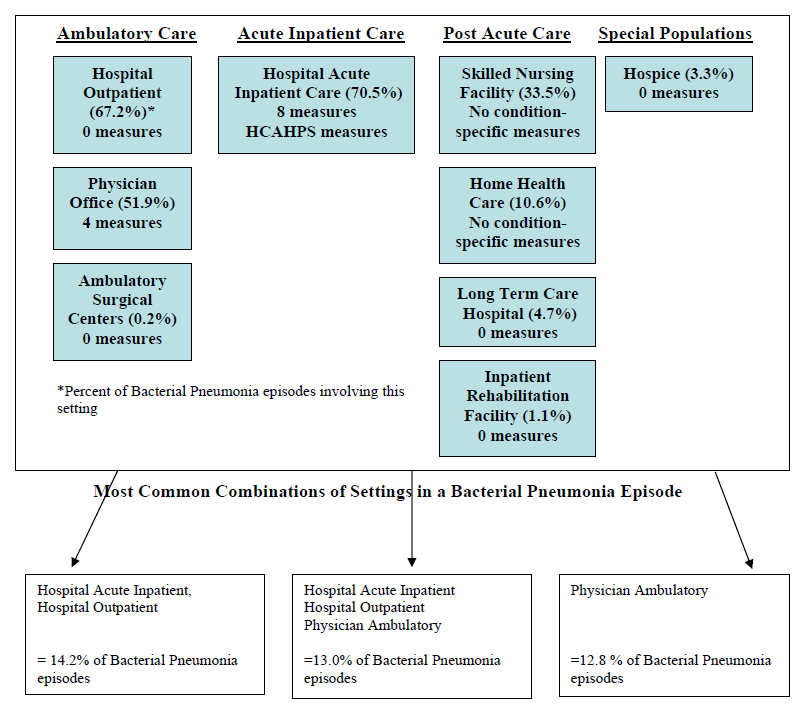
Figure E5 This chart graphic shows that Seventy percent of bacterial pneumonia episodes involved an acute care hospital, 67 percent involved the hospital outpatient department and 52 percent a physician office visit. Additionally, in 34 percent of the episodes, patients utilized a skilled nursing facility, in 11 percent they utilized home health care, and 5 percent of episodes involved a stay in a long term care hospital.- The three most common combinations of settings accounted for 40 percent of the bacterial pneumonia episodes in our sample.- There are eight measures reported for bacterial pneumonia in the acute inpatient setting, no measures reported for the hospital outpatient setting and four measures reported for care in a physician office.- The skilled nursing and home health measures are not condition specific and apply to all patients in these settings.
| Measure Condition | Measure | Hospital Inpatient | Physician (Ambulatory) |
|---|---|---|---|
| PN | Oxygenation assessment | X | |
| PN | Assessed and given pneumococcal vaccination | X | |
| PN | Assessed and given influenza vaccination | X | |
| PN | Blood culture performed in the emergency department before the first antibiotic received in hospital | X | |
| PN | Appropriate initial antibiotic selection | X | X |
| PN | Initial antibiotic received within 4 hours | X | |
| PN | Adult smoking cessation advice/counseling | X | |
| PN | 30-day PN mortality | X | |
| PN | Vital signs | X | |
| PN | Assessment of mental status | X |
Other Potentially Relevant Measures
For patients who are hospitalized with bacterial pneumonia, the "Failure to Rescue" measure may apply. For those patients with HIV/AIDS who are presenting with pneumonia, the PQRI HIV/AIDS measures would be relevant.
Figure E6. Settings Involved in Episodes: Breast Cancer (ETGs)
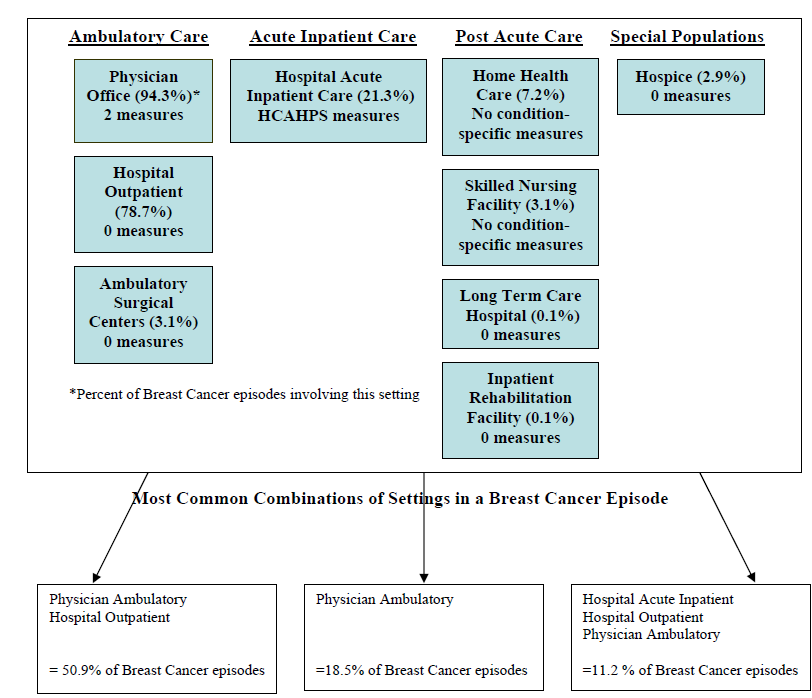
Figure E6 This chart graphic shows that Breast cancer episodes most often involved the physician office (94 percent) and/or the hospital outpatient department (79 percent).- Twenty one percent of breast cancer episodes involved an acute hospital inpatient stay, 7 percent involved home health, and 3 percent a skilled nursing facility.- The three most common combinations of settings accounted for 81 percent of all breast cancer episodes.- There are only two measures reported to CMS for breast cancer, and they are both applicable to care provided by physicians in an ambulatory setting.- The skilled nursing and home health measures are not condition specific and apply to all patients in these settings.
Figure E7. Settings Involved in Episodes: Breast Cancer (MEGS)
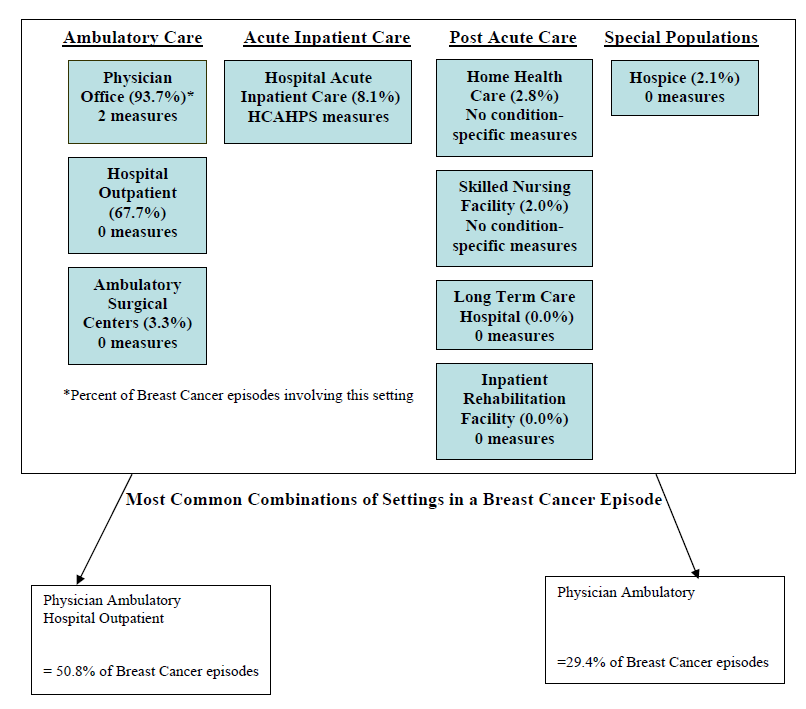
Figure E7 This chart graphic shows that Breast cancer episodes most often involved the physician office (94 percent) and/or the hospital outpatient department (68 percent).- Only 8 percent of breast cancer episodes involved an acute hospital inpatient stay, 3 percent involved home health, and 2 percent a skilled nursing facility.- The two most common combinations of settings accounted for 80 percent of all breast cancer episodes.- There are only two measures reported to CMS for breast cancer, and they are both applicable to care provided by physicians in an ambulatory setting. The skilled nursing and home health measures are not condition specific and apply to all patients in these settings.
| Measure Condition | Measure | Physician
(Ambulatory) |
|---|---|---|
| Breast cancer | Hormonal therapy for stage 1C-III ER/PR positive breast cancer | X |
| Breast cancer | pT and pN category and histologic grade | X |
Other Potentially Relevant Measures
For those patients requiring surgery, the inpatient or outpatient perioperative measures would apply. Additionally, the PQRI measure for nuclear medicine, "Correlation with existing imaging studies for patients undergoing bone scintigraphy" and the mammography follow-up rates measure may be relevant for some patients.
Figure E8. Settings Involved in Episodes: Cerebrovascular Disease (ETGs)
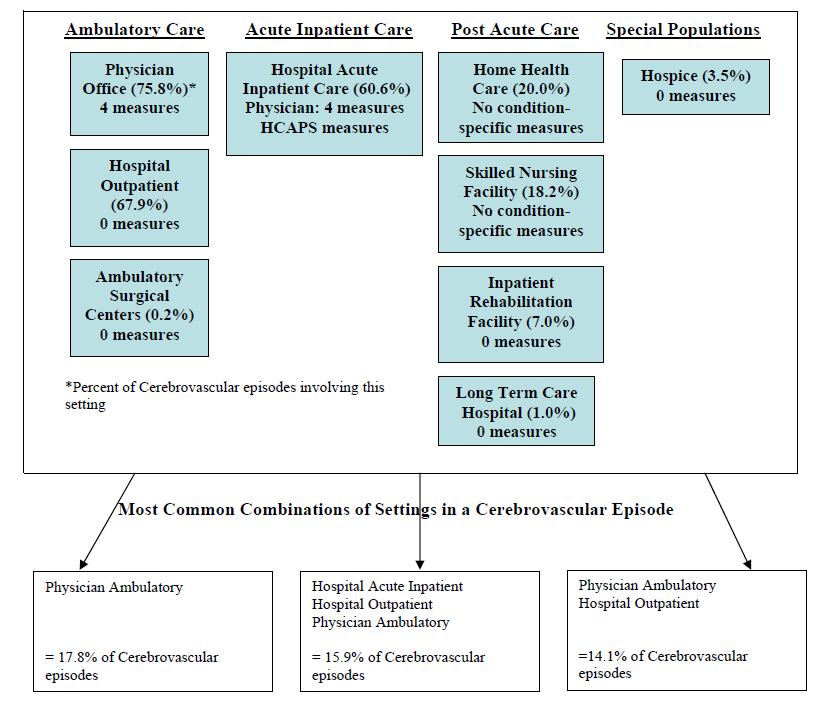
Figure E8 shows that Cerebrovascular episodes most often involved the physician office (75%) and/or the hospital outpatient department (68%).- Sixty one percent of cerbrovascular episodes involved an acute hospital inpatient stay, 20 percent involved home health, and 18 percent a skilled nursing facility.- The three most common combinations of settings accounted for 48 percent of all cerebrovascular episodes.- There are eight stroke measures included in the PQRI, four of which are applicable to physicians in the acute care hospital setting and four of which could be applicable to the physician office setting or the acute care hospital setting.- The skilled nursing and home health measures are not condition specific and apply to all patients in these settings.
Figure E9. Settings Involved in Episodes: Cerebrovascular Disease (MEGS)
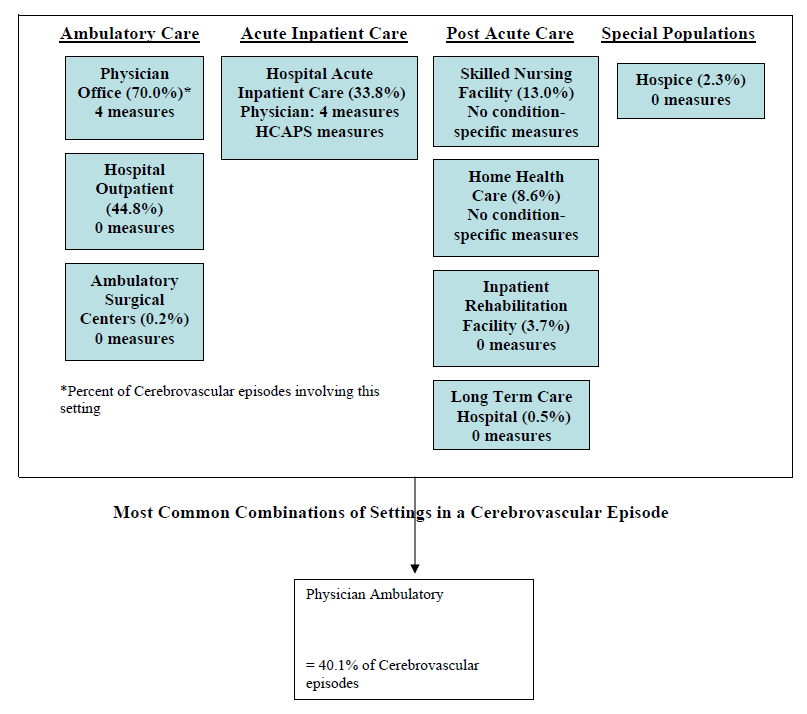
Figure E9 shows that Cerebrovascular episodes most often involved the physician office (70%) and/or the hospital outpatient department (45%).- Thirty four percent of cerbrovascular episodes involved an acute hospital inpatient stay, 13 percent involved a skilled nursing facility, 9 percent home health care, and 4 percent an inpatient rehabilitation facility.- The most common combination of settings was the physician ambulatory setting which accounted for 40 percent of all cerebrovascular episodes.- There are eight stroke measures included in the PQRI, four of which are applicable to physicians in the acute care hospital setting and four of which could be applicable to the physician office setting or the acute care hospital setting.- The skilled nursing and home health measures are not condition specific and apply to all patients in these settings.
| Measure Condition | Measure | Physician |
|---|---|---|
| Stroke | - CT or MRI reports | X |
| Stroke | Carotid imaging reports | X |
| Stroke | DVT for ischemic stroke or intracranial hemorrhage | X (Inpatient)* |
| Stroke | Discharged on antiplatelet therapy | X (Inpatient)* |
| Stroke | Anticoagulant therapy for atrial fibrillation at discharge | X (Inpatient)* |
| Stroke | Tissue Plasminogen Activator (t-PA) considered | X (Inpatient)* |
| Stroke | Screening for dysphagia | X |
| Stroke | Consideration of rehabilitation services | X |
*These are PQRI physician-level measures that would likely apply within the hospital inpatient setting.
Other Potentially Relevant Measures
For a subset of patients with cerebrovascular disease, the PQRI endarterectomy measure would be relevant as would the perioperative measure for recommended venous thromboembolism.
Figure E10. Settings Involved in Episodes: COPD (ETGs)
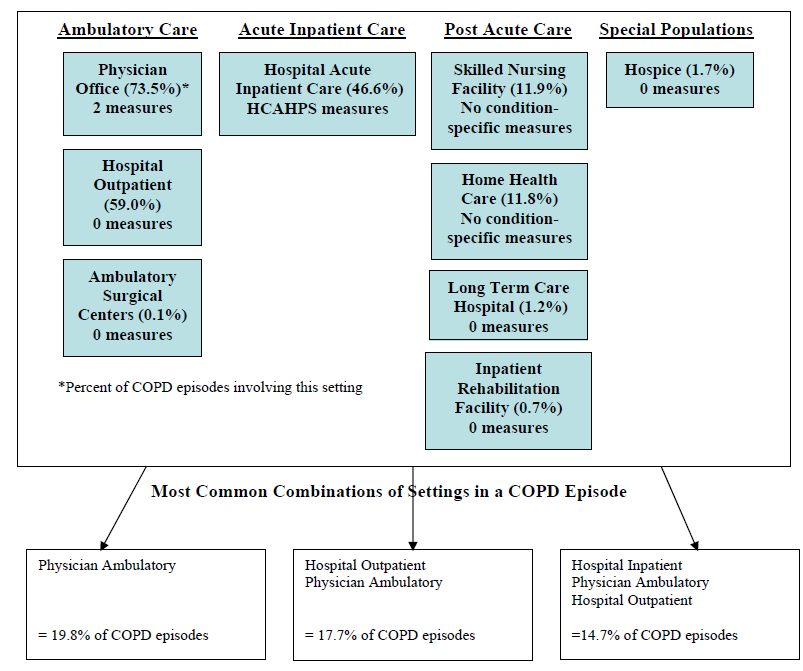
Figure E10 shows that COPD episodes most often involved the physician office (75%) followed by the hospital outpatient department (59%) and the acute care hospital setting (47%). Additionally, 12 percent of episodes involved a skilled nursing facility or home health care. The three most common combinations of settings accounted for 52 percent of all COPD episodes.- There are currently two COPD measures included in the PQRI for physicians.- The skilled nursing and home health measures are not condition specific and apply to all patients in these settings.
Figure E11. Settings Involved in Episodes: COPD (MEGS)
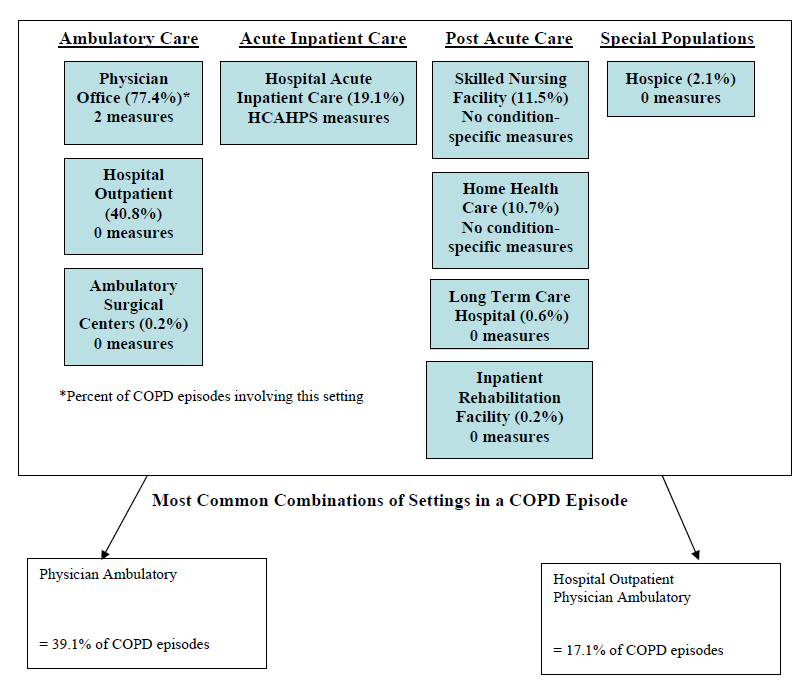
Figure E11 shows that COPD episodes most often involved the physician office (78%) followed by the hospital outpatient department (41%) and the acute care hospital setting (19%). Additionally, 12 percent of episodes involved a skilled nursing facility and 11 percent home health care. The two most common combinations of settings accounted for 56 percent of all COPD episodes.- There are currently two COPD measures included in the PQRI for physicians.- The skilled nursing and home health measures are not condition specific and apply to all patients in these settings.
| Measure Condition | Measure | Physician (Ambulatory) |
|---|---|---|
| COPD | Spirometry evaluation | X |
| COPD | Bronchodilator therapy | X |
Other Potentially Relevant Measures
The inpatient and PQRI pneumonia measures would be relevant to those patients who develop pneumonia as a complication of COPD.
Figure E12. Settings Involved in Episodes: Congestive Heart Failure (CHF) (ETGs)
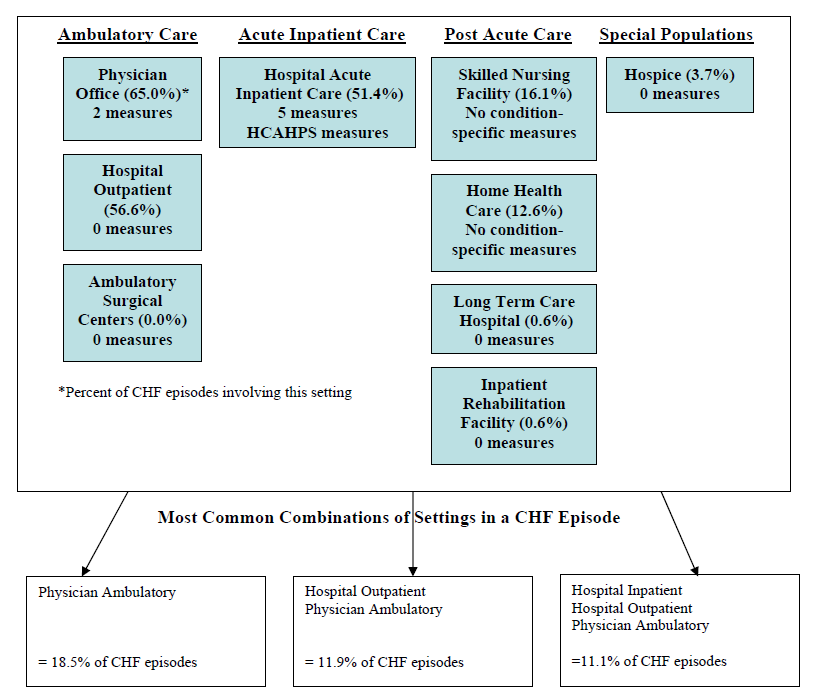
Figure E12 shows that CHF episodes most often involved the physician office (65%) followed by the hospital outpatient department (57%) and the acute care hospital setting (51%). Additionally, 16 percent of episodes involved a skilled nursing facility, 13 percent home health care, and 4 percent hospice. The three most common combinations of settings accounted for 42 percent of all CHF episodes.- There are currently five measures addressing CHF in the acute care hospital setting and two for physicians.- The skilled nursing and home health measures are not condition specific and apply to all patients in these settings.
Figure E13. Settings Involved in Episodes: Congestive Heart Failure (CHF) (MEGSs)
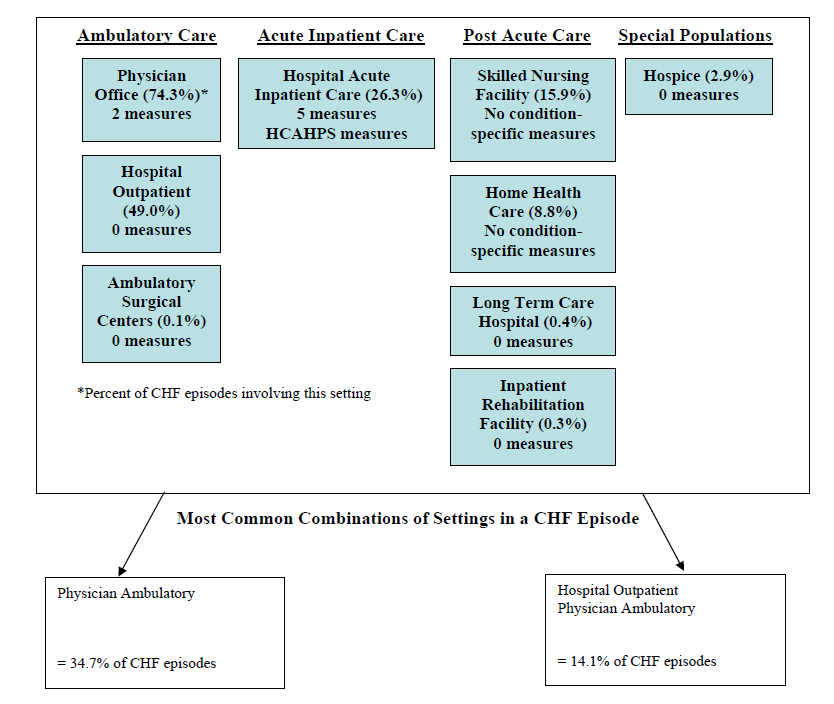
Figure E13 shows that CHF episodes most often involved the physician office (74%) followed by the hospital outpatient department (49%) and the acute care hospital setting (26%). Additionally, 16 percent of episodes involved a skilled nursing facility, 9 percent home health care, and 3 percent hospice. The two most common combinations of settings accounted for 49 percent of all CHF episodes.- There are currently five measures addressing CHF in the acute care hospital setting, a 30 day readmission measure (new for 2009) and two for physicians.- The skilled nursing and home health measures are not condition specific and apply to all patients in these settings.
| Measure Condition | Measure | Hospital Inpatient | Physician (Ambulatory) |
|---|---|---|---|
| HF | Discharge instructions | X | |
| HF | Left ventricular function assessment | X | |
| HF | ACE-I or ARB for LVSD | X | X |
| HF | Adult smoking cessation advice/counseling | X | |
| HF | 30-day HF mortality | X | |
| HF | 30-day HF readmission | X | |
| HF | Beta blocker therapy for LVSD | X |
Other Potentially Relevant Measures
For some patients with congestive heart failure, some of the AMI, cardiac surgery and coronary artery disease measures would be relevant.
Figure E14. Settings Involved in Episodes: Low Back Pain (ETGs)
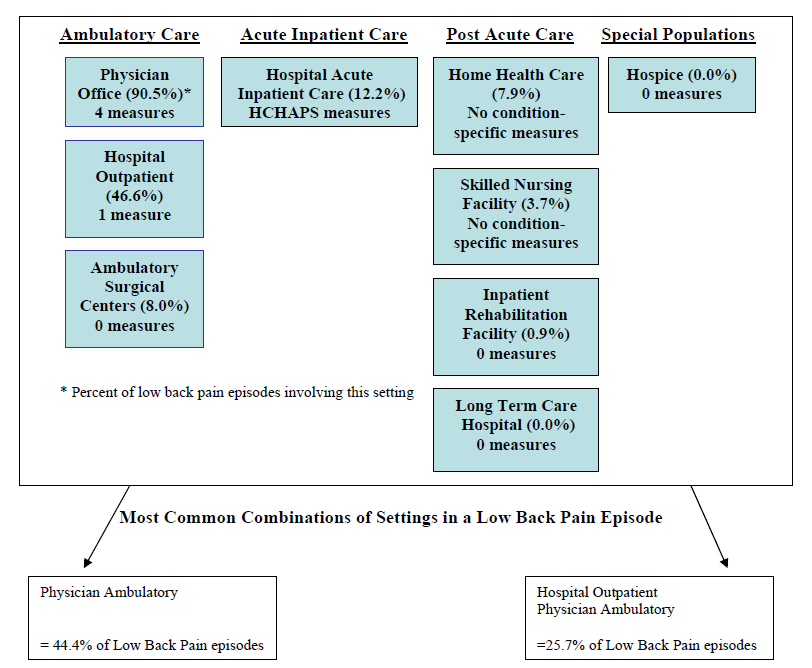
Figure E14 shows that Low back pain episodes most often involved the physician office (91%) followed by the hospital outpatient department (47%) and the acute care hospital setting (12%). Additionally, 8 percent of episodes involved home health care, and 4 percent skilled nursing facilities. The two most common combinations of settings accounted for 70 percent of all low back pain episodes.- There are currently four measures reported to CMS addressing low back pain in the physician office setting and one measure related to imaging appropriateness for the hospital outpatient department.- The skilled nursing and home health measures are not condition specific and apply to all patients in these settings.
Figure E15. Settings Involved in Episodes: Low Back Pain (MEGS)
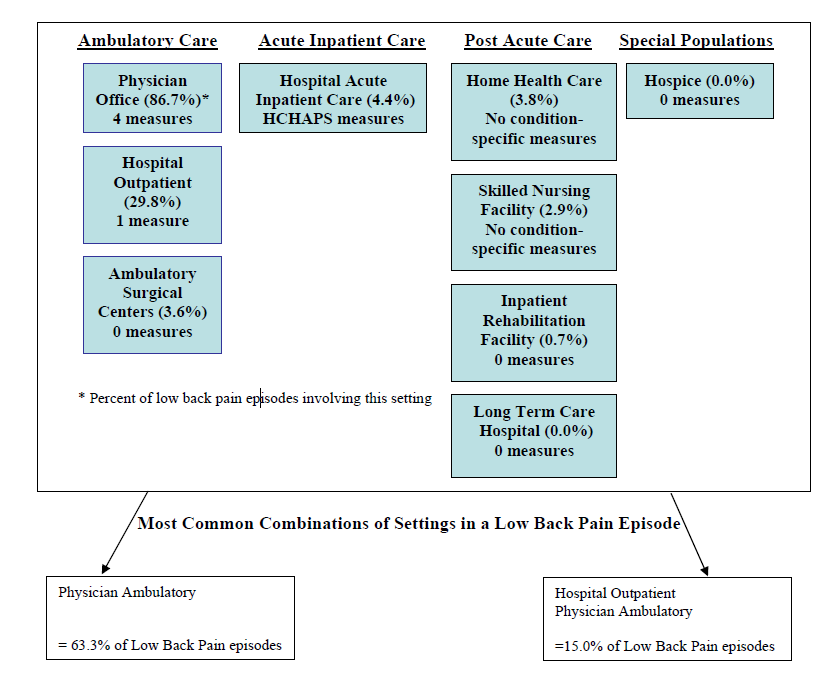
Figure E15 shows that Low back pain episodes most often involved the physician office (87%) followed by the hospital outpatient department (30%) and the acute care hospital setting (4%). Additionally, 4 percent of episodes involved home health care, and 3 percent skilled nursing facilities. The two most common combinations of settings accounted for 78 percent of all low back pain episodes.- There are currently four measures reported to CMS addressing low back pain in the physician office setting and one measure related to imaging appropriateness in the hospital outpatient department.- The skilled nursing and home health measures are not condition specific and apply to all patients in these settings.
| Measure Condition | Measure | Hospital Outpatient | Physician (Ambulatory) |
|---|---|---|---|
| Imaging | MRI lumbar spine for low back pain | X | |
| Back pain | Initial visit | X | |
| Back Pain | Physical Exam | X | |
| Back Pain | Advice for normal activities | X | |
| Back Pain | Advice against bed rest | X |
Other Potentially Relevant Measures
The two PQRI measures for osteoarthritis may be relevant for patients with low back pain. Additionally, the PQRI measure calling for functional outcome assessments for chiropractic care would be relevant to those patients who utilize chiropractic care for low back pain.
Appendix F. Defining Professional Costs and Evaluation and Management (E&M) Visits
Defining Professional Claims for the Purposes of Attribution
Under a narrow definition professional services are care directly rendered by a physician or related provider. This definition therefore excludes pharmacy, facility, and direct medical equipment. Broader definitions might include these services.
For the purpose of attributing episodes to physicians, RAND has utilized a stricter definition. This was primarily because it is difficult to determine which provider ordered a laboratory test or imaging test because ordering physician is inconsistently recorded in Medicare claims data.
Our goal was to use codes in which the delivering physician played a role in evaluating the patient or deciding to choose this procedure. In making this distinction we hoped to eliminate scenarios such as anesthesiologist providing anesthesiology for a surgery, radiologists reading x-rays, or a pathologist reading a PAP smear. In these scenarios, a physician performs a service but they were not the physician who chose to have that test or procedure performed. On the other hand we would like to include tests such as a cardiologist performing a cardiac catheterization, an anesthesiologist placing a pain pump for a person with chronic pain, a pulmonologist placing an arterial line or central venous catheter. In these scenarios it is most typical that the physician most often evaluated the patient before undergoing the procedure and therefore the associated costs should be go into the attribution rule. We are cognizant that no definition is perfect and there will be disagreements on specific scenarios.
Our Definition:
We started with all procedures on the 2007 Medicare National Physician Fee Schedule Relative Value File which includes all services (defined via CPT/HCPCS codes) rendered by providers and their subsequent RVU rates for Medicare. We then used the Berenson Eggers Type of Service (BETOS) system which were developed by CMS and assigns each HCPCS code to categories that are clinically relevant. We first took the subset of codes in the following relevant BETOS categories:
- Evaluation & Management
- Except: - - M5A = Specialist - pathology
- Procedures
- Except: P0- = Anesthesia
- I4A = Imaging/procedure
o Except 0152T
- I4B- Imaging/procedure
- Other (includes chiropractic care, delivery of medications, immunizations, vaccines)
- Except: - - - O1A = Ambulance
- Unclassified (Y) (includes items such as shoulder surgery, physician standby services, birth attendance, certain medication delivery)
This would thereby eliminate most imaging, tests, durable medical equipment, Z codes (exceptions, local, undefined codes).
Defining Evaluation & Management Visits
Some attribution rules assign responsibility to the physician that accounted for the largest fraction of Evaluation & Management (E&M) visits for a patient or within episode. Unfortunately there is no consistent definition of what is an E&M visit.
Some researchers (Pham et al. 2007; Bach et al. 2004) using Medicare data have defined E&M visits as:
Berenson-Eggers type of service code of M1A (office visits, new patient), M1B (office visits, established patient), or M6 (consultations), but excluded Healthcare Common Procedure Coding System codes 99381, 99411, 95115, 99391, 95117, 99236, 99262, 99251, 99255, 99261, 99254, G0175, 99253, or 99252.
We believe that this definition was too restrictive for the purposed of attributing episodes, because it excludes inpatient, consultation, or emergency department visits. These visits might not be important for assigning a physician (likely a PCP) to a patient, but these E&M visits are important for attributing a physician to an episode.
Alternative definitions of E&M visits have been created by the American Medical Association's Current Procedural Terminology (CPT) and the Center for Medicare and Medicaid Service's Berenson-Eggers (BETOS) system. CPT's system, while it likely covers most important line items, does not include several important HCPCS codes. We've therefore started with the BETOS system.
Our Definition:
Using the BETOS system we first selected all E&M visits in the following BETOS categories:
- - - M1A = Office visits - new
- - - M1B = Office visits - established
- - - M2A = Hospital visit - initial
- - - M2B = Hospital visit - subsequent
- - - M2C = Hospital visit - critical care
- - - M3- = Emergency room visit
- - - M4A = Home visit
- - - M4B = Nursing home visit
- - - M5B = Specialist - psychiatry
- - - M5C = Specialist - ophthalmology
- - - M6- = Consultations
We excluded two E&M BETOS categories M5A (Specialist - pathology) and M5D (Specialist - other). For the purposes of attribution, analyses led by pathologists are not applicable and as of 2003 the data fields used have changed so M5A is not likely applicable in our data. M5D was dropped because these line items don't fit the definition of evaluation and management.
There are 276 HCPCS & CPT codes in these remaining BETOS categories. - Of these we dropped 10:
- 6 Category II CPT or F codes which are used for quality measures and do not indicate a new visit. (0500F, 0502F, 0503F, 1000F, 1001F, 2000F)
- 4 HCPCS codes related to giving shots and delivering drugs which were also dropped in previous definitions.
References
- Abt Associates Inc. (1997). Medicare Cataract Surgery Alternate Payment Demonstration: Final Evaluation Report. Cambridge, M.A.
- American Geriatrics Society (AGS) (2007). "Improving the Quality of Transitional Care for Persons with Complex Care Needs: American Geriatrics Society Position Statement." Assited Living Consult March/April: 30-32.
- Asch, S. M., E. A. Kerr, et al. (2006). "Who is at Greatest Risk for Receiving Poor-Quality Health Care?" New England Journal of Medicine 354(11):1147-1156.
- Baucus, M. Call to Action: Health Reform 2009. Senate Finance Committee. www.finance.senate.gov, November 12, 2008.
- Berenson, R. A. (2007). Options to Improve Quality and Efficiency Among Medicare Physicians. Washington, D.C.: U.S. House Ways and Means Subcommittee on Health.
- Berenson, R. A., P. B. Ginsburg, et al. (2007). "Hospital-Physician Relations: Cooperation, Competition, or Separation?" Health Affairs 26(1):W31-W43.
- Boards of Trustees, Federal Hospital Insurance and Federal Supplementary Medical Insurance Trust Funds. (2008). The 2008 Annual Report of the Boards of Trustees of the Federal Hospital Insurance and Federal Supplementary Medical Insurance Trust Funds. Washington, D.C.
- Bodenheimer, T. (2008). "Coordinating Care-A Perilous Journey Through the Health Care System." New England Journal of Medicine 358(10):1064-71.
- Brailer, D. J. and E. A. Kroch. (1999). "Member Risk Adjustment for Ambulatory Episodes of Care." Health Care Management Science 2(3):125-36.
- Bynum, J. P., E. Bernal-Delgado, et al. (2007). "Assigning Ambulatory Patients and Their Physicians to Hospitals: A Method for Obtaining Population-Based Provider Performance Measurements." Health Services Research 42(1 Pt 1): 45-62.
- California Cooperative Healthcare Reporting Initiative (2008) California Physician Performance Initiative: Methodology for Physician Performance Scoring (October 2008)- http://www.cchri.org/programs/documents/CPPI_Methods_Oct2008.pdf (last accessed 12/26/2008).
- Casale, A. S., R. A. Paulus, et al. (2007). "ProvenCareSM': A Provider-Driven Pay-for-Performance Program for Acute Episodic Cardiac Surgical Care." Annals of Surgery 246(4):613-623.
- Centers for Medicare and Medicaid Services. (2008). "Physician Quality Reporting Initiative (PQRI): Reporting." Retrieved from: http://www.cms.hhs.gov/PQRI/20_Reporting.asp#TopOfPage (last accessed December 11, 2008).
- Centers for Medicare and Medicaid Services. (2007a). "Acute Care Episode (ACE) Demonstration Overview." Retrieved from: http://www.cms.hhs.gov/DemoProjectsEvalRpts/downloads/ACE_Summary.pdf.
- Centers for Medicare and Medicaid Services. (2007b). "Medicare Physician Group Practice Demonstration Fact Sheet." Retrieved from: http://www.cms.hhs.gov/DemoProjectsEvalRpts/downloads/PGP_Fact_Sheet.pdf.
- Center for Medicare and Medicaid Services. (2007c). August 1, 2007 Press Release. Retrieved from: http://www.cms.gov.
- Center for Medicare and Medicaid Services. (2006). September 6, 2006 Press Release. Retrieved from: http://www.cms.hhs.gov/apps/media/press/release.asp?Counter=1957
- Coleman E.A., C. Parry, et al. (2006). "The care transitions intervention: results of a randomized controlled trial." Archives of Internal Medicine. 166(17):1822-8.
- Cortese, D. and R. Smoldt. (2007). "Taking Steps Toward Integration." Health Affairs 26(1):68-71.
- Cromwell, J., D. A. Dayhoff, et al. (1998). Medicare Participating Heart Bypass Demonstration: Final Report.
- Damberg C.L., M.E.S. Sorbero, et al. (2007)"An Environmental Scan of Pay for Performance in the Hospital Setting: A Final Report." http://aspe.hhs.gov/health/reports/08/payperform/index.htm.
- Davis, K. (2007). "Paying for Care Episodes and Care Coordination." New England Journal of- Medicine 356(11):1166-68.
- Davis, K. and S. Guterman. (2007). "Rewarding Excellence and Efficiency in Medicare Payments." Milbank Quarterly 85(3):449-68.
- de Brantes, F. and J. A. Camillus. (2007). "Evidence-Informed Case Rates: A New Health Care Payment Model." Retrieved from: http://www.commonwealthfund.org/usr_doc/deBrantes_evidence-informedcaserates_1022.pdf?section=4039. Accessed on February 5, 2008.
- Edmonds, C. and G. L. Hallman. (1995). "CardioVascular Care Providers. A Pioneer in Bundled Services, Shared Risk, and Single Payment." Texas Heart Institute Journal 22(1):72-6.
- Enthoven A.C., F.J. Crosson, S.M. Shortell. (2007). "'Redefining health care': medical homes or archipelagos to navigate?" Health Affairs 26(5):1366-72.
- Fisher, E. S., D. O. Staiger, et al. (2006). "Creating Accountable Care Organizations: The Extended Hospital Medical Staff." Health Affairs (Millwood) 26(1):w44-57.
- Fisher, E. S., D. E. Wennberg, et al. (2003a). "The Implications of Regional Variations in Medicare Spending. Part 1: The Content, Quality, and Accessibility of Care." Annals of Internal Medicine 138(4):273-287.
- Fisher, E. S., D. E. Wennberg, et al. (2003b). "The Implications of Regional Variations in Medicare Spending. Part 2: Health Outcomes and Satisfaction with Care." Annals of Internal Medicine 138(4):288-299.
- Frank, C. and R. Roeder. (1999). "Specialty Contact Capitation." Journal of Health Care Finance 25(3):17-21.
- Gardner, J. (1995). "Thomas Opposes "Bundling' Plan." Modern Healthcare 25(25):12.
- Goroll, A. H., R. A. Berenson, et al. (2007). "Fundamental Reform of Payment for Adult Primary Care: Comprehensive Payment for Comprehensive Care." Journal of General Internal Medicine 22(3):410-15.
- Hanson, B. (1987). "Organized Medicine in US Helps Defeat RAP-DRG Proposal for Medicare Payments." Journal of Nuclear Medicine 28(10):1513.
- Health Partners. (2007). Retrieved from http://www.h.partners.com.
- Higashi, T., N. S. Wenger, et al. (2007). "Relationship between Number of Medical Conditions and Quality of Care." New England Journal of Medicine 356(24):2496-2504.
- Institute of Medicine. (2001). Crossing the Quality Chasm: A New Health System for the 21st Century. Washington, D.C.: National Academy Press.
- Institute of Medicine. (2006) Rewarding Provider Performance: Aligning Incentives in Medicare. Washington, DC: National Academy Press.
- Institute of Medicine Committee on Redesigning Health Insurance Performance Measures, Payment, and Performance Improvement Programs. (2006). Performance Measurement : Accelerating Improvement. Washington, D.C.: National Academy Press.
- Institute of Medicine Committee on Redesigning Health Insurance Performance Measures, Payment, and Performance Improvement Programs. (2007). Rewarding Provider Performance : Aligning Incentives in Medicare. Washington, D.C.: National Academy Press.
- Jencks, S. F. and A. Dobson. (1985). "Strategies for Reforming Medicare's Physician Payments. Physician Diagnosis-Related Groups and Other Approaches." New England Journal of Medicine 312(23):1492-9.
- Jencks, S. F., E. D. Huff, et al. (2003). "Change in the Quality of Care Delivered to Medicare Beneficiaries, 1998-1999 to 2000-2001." Journal of the American Medical Association 289(3):305-312.
- Keehan, S., A. Sisko, et al. (2008). "Health Spending Projections Through 2017: The Baby-Boom Generation is Coming to Medicare." Health Affairs Web Exclusive 27(2):w145-w155.
- Lacewell, L. A. (2007). "Premium Designation." Letter from the State of New York, Office of the Attorney General to UnitedHealthcare, Hartford, CT, July 13, 2007.
- Lake, T., M. Colby, et al. (2007). Health Plans' Use of Physician Resource Use and Quality Measures. Washington, D.C.: Medicare Payment Advisory Commission.
- Leavitt, M. O. (2008). Report to Congress: A Design for a Bundled End Stage Renal Disease Prospective Payment System. Washington, D.C.
- Lee, A. J., R. P. Ellis, et al. (1996). "Bundling Post-Acute Care (PAC) with Medicare DRG Payments: An Exploration of the Distributional and Risk Consequences." Inquiry 33(3):283-91.
- Lee, T. H. (2007). "Pay for Performance, Version 2.0?" New England Journal of Medicine 357(6):531.
- Lindenauer, P. K., D. Remus, et al. (2007). "Public Reporting and Pay for Performance in Hospital Quality Improvement." New England Journal of Medicine 356(5):486-496.
- Liu, C. F., S. Subramanian, et al. (2001). "Impact of Global Bundled Payments on Hospital Costs of Coronary Artery Bypass Grafting." Journal of Health Care Finance 27(4):39-54.
- Massachusetts Medical Society. (2008). "MMS Files Legal Action Against the Group Insurance Commission, its Executive Director, and Two Health Plans." Retrieved from: http://www.massmed.org/AM/Template.cfm?Section=Home&CONTENTID=21943&TEM…. Accessed on July 16, 2008.
- McGlynn, E. A., S. M. Asch, et al. (2003). "The Quality of Health Care Delivered to Adults in the United States." New England Journal of Medicine 348(26):2635-2645.
- McGlynn, E., P. Shekelle, et al. (2008). Identifying, Categorizing, and Evaluating Health Care Efficiency Measures, Agency for Healthcare Research and Quality. Prepared for the Agency for Healthcare Research and Quality.
- "Medicare Funding Warning Response Act of 2008." (H.R. 5480), Title I, Section 101, Introducing Principles of Value-Based Health Care into the Medicare Program. February 25, 2008. Retrieved from: frwebgate.access.gpo.gov/cgi-bin/getdoc.cgi?dbname=110_congbills&docid=f:h5480ih.txt.pdf. Accessed on March 26, 2008.
- Medicare Payment Advisory Commission (MedPAC). (2005). Report to the Congress: Physician-Owned Specialty Hospitals. Washington, D.C.: 44-48.
- Medicare Payment Advisory Commission (MedPAC). (2006). Report to the Congress: Increasing the Value of Medicare. Washington, D.C.: 3-27.
- Medicare Payment Advisory Commission (MedPAC). (2007a). "Bundled Payment for Services Around a Hospitalization." Medicare Payment Advisory Commission Public Meeting, Oct. 3, 2007. Retrieved from: http://medpac.gov/transcripts/1003-04MedPAC.final.pdf. Accessed on February 13, 2008.
- Medicare Payment Advisory Commission (MedPAC). (2007b). "Bundling Payments in the IPPS." Medicare Payment Advisory Commission Public Meeting, January 9, 2007. Retrieved from: http://medpac.gov/meeting_search.cfm?SelectedDate=2007-01-09%2000:00:00…. Accessed on February 13, 2008.
- Medicare Payment Advisory Commission (MedPAC). (2007c). "Moving Toward Bundling Payment Around Hospitalizations." Medicare Payment Advisory Commission Public Meeting, November 8, 2007. Retrieved from: http://medpac.gov/transcripts/1108-09Medpac%20final.pdf. Accessed on February 13, 2008.
- Medicare Payment Advisory Commission (MedPAC). (2007d). Report to Congress: Assessing Alternatives to the Sustainable Growth Rate System. Washington, D.C.
- Medicare Payment Advisory Commission (MedPAC). (2008). Report to Congress: Medicare Payment Policy. Washington, D.C.
- Mehrotra, A. et al. (2007). "Methodological Issues in Measuring Physician-Level Quality and Efficiency." Presentation at the Academy Health conference, Orlando, FL, June 5, 2007.
- Milgate, K. and S. B. Cheng. (2006). "Pay-for-Performance: The MedPAC Perspective." Health Affairs 25(2):413-419.
- Miller, M. E. and W. P. Welch. (1992). "Physician Charges in the Hospital - Exploring Episodes of Care for Controlling Volume Growth." Medical Care 30(7):630-645.
- Mitchell, J. B. (1985). "Physician DRGs." New England Journal of Medicine 313(11):670-5.
- Mitchell, J. B., J. Cromwell, et al. (1987). "Packaging Physician Services: Alternative Approaches to Medicare Part B Reimbursement." Inquiry 24(4):324-43.
- Mitchell, J. B. and R. P. Ellis. (1992). "Alternative Payment Systems for Hospital Medical Staffs." Inquiry 29(1):21-32.
- Mitchell, J. B. and M. L. Rosenbach. (1989). "Feasibility of Case-Based Payment for Inpatient Radiology, Anesthesia, and Pathology Services." Inquiry 26(4):458-67.
- National Quality Forum. (2007). Measurement Framework: Evaluating Efficiency Across Episodes of Care. - Retrieved from: http://www.qualityforum.org/pdf/projects/priorities/NQFFramework%20COMM…. Accessed on February 6, 2008.
- Naylor M.D., K.M. McCauley. (1999). "The effects of a discharge planning and home follow-up intervention on elders hospitalized with common medical and surgical cardiac conditions." Journal of Cardiovascular Nursing. 14(1):44-54.
- Network for Regional Healthcare Improvement. (2007). "Incentives for Excellence: Rebuilding the Healthcare Payment System from the Ground Up." Retrieved from: http://www.prhi.org/docs/IncentivesForExcellence.pdf. Accessed on February 14, 2008.
- O'Kane, M., J. Corrigan, S. M. Foote, et al. (2008). "Crossroads In Quality." Health Affairs 27(3):749-58.
- Pham, H. H. and P. B. Ginsburg. (2007). "Unhealthy Trends: The Future of Physician Services." Health Affairs (Millwood) 26(6):1586-98.
- Pham, H. H., D. Schrag, et al. (2007). "Care Patterns in Medicare and Their Implications for Pay for Performance." New England Journal of Medicine 356(11):1130-9.
- Robinson, J. C. (1999). "Blended Payment Methods in Physician Organizations Under Managed Care." Journal of the American Medical Association 282(13): 1258-63.
- Schoen, C., S. Guterman, et al. (2007). Bending the Curve: Options for Achieving Savings and Improving Value in U.S.Health Spending. The Commonwealth Fund.
- Schuster, M. A., E. A. McGlynn, et al. (1998). "How Good Is the Quality of Health Care in the United States ?" Milbank Quarterly 76(4):517-563.
- Scott, J. S. (1988). "Prospective Payment for Physician Services: A "RAP' (Radiology, Anesthesiology, Pathology) on the Future." Medical Staff Counselor 2(3):9-11.
- Shahian D.M., T. Silverstein, et al. (2007). "Comparison of clinical and administrative data sources for hospital coronary artery bypass graft surgery report cards." Circulation 115(12):1518-27.
- Stukenborg G.J., D.P. Wagner, et al. (2007). "Which hospitals have significantly better or worse than expected mortality rates for acute myocardial infarction patients? Improved risk adjustment with present-at-admission diagnosis." Circulation 116(25):2960-8.
- Thomas, J. W. (2006). "Should Episode-Based Economic Profiles be Risk Adjusted to Account for Differences in Patients' Health Risks?" Health Services Research 41(2):581-98.
- Thomas, J. W., K. L. Grazier, et al. (2004). "Economic Profiling of Primary Care Physicians: Consistency Among Risk-Adjusted Measures." Health Services Research 39(4 Pt 1):985-1003.
- U. S. Office of Technology Assessment. (1986). Payment for Physician Services: Strategies for Medicare. Washington, D.C.
- Welch, W. P. (1989). "Prospective Payment to Medical Staffs: A Proposal." Health Affairs (Millwood) 8(1):34-49.
- Welch, W. P. (1998). "Bundled Medicare Payment for Acute and Postacute Care." Health Affairs (Millwood) 17(6):69-81.
- Wenger, N. S., D. H. Solomon, et al. (2003). "The Quality of Medical Care Provided to Vulnerable Community-Dwelling Older Patients." Annals of Internal Medicine 139(9):740-747.
- Wennberg, J. E., E. S. Fisher, et al. (2007). "Extending the P4P Agenda, Part 2: How Medicare Can Reduce Waste and Improve the Care of the Chronically Ill." Health Affairs 26(6):1575-1585.
- Wilensky, G. R., N. Wolter, et al. (2006). "Gain Sharing: A Good Concept Getting a Bad Name?" Health Affairs (Millwood) 26(1):w58-67.
Footnotes
1 Public Law 109-171, February 8, 2006
2 Public Law 110-275, July 15, 2008
3 Medicare severity diagnostic related groups
4 Prospective payment system
5 Relative value unit
6 Ambulatory payment classification
7 Electroconvulsive therapy
8 Healthcare common procedures coding system
9 Disproportionate share
10 Graduate medical education
11 Sustainable growth rate
12 Annual payment update
13 Resource utilization group
14 Home health resource group
15 Case-mix group
16 Medicare severity long term care diagnosis related groups
17 Rehabilitation, psychiatric and long term care
18 Hierarchical condition category
19 Prescription drug hierarchical condition category
20 Consumer price index for all urban consumers
21 Federal Employee Health Benefits
22 Medicaid statistical information system
23 Public Law 108-173, December 8, 2003.
24 Public Law 109-432, December 20, 2006.
25 Public Law 110-173, December 29, 2007.
26 P=Process, O=Outcome, E=Efficiency, IO=Intermediate Outcome, F=Functional, S=Structural, PE=Patient Experience
27 While the measure names are the same, the specifications of the individual measures may not be the same.
28 The ten conditions are colon cancer, non-small-cell lung cancer, mitral valve regurgitation, non-ischemic stage C congestive heart failure, ST segment elevated myocardial infarction, depression, diabetes mellitus type 2, knee replacement, hip replacement, and preventive care.
29 Provider identifiers used by Medicare, including Unique Provider Identification Numbers (UPINs), Provider Identification Numbers (PINs), and Tax Identifiers (TAXIDs) can be used by a provider group, and providers may have multiple identifiers. These are being replaced by a new provider identifier, the National Provider Identifier, required since May 2007.
30 The two groupers were selected based on their use in analyses by MedPAC and ongoing CMS research. We did not compare them to each other or other existing groupers.
31 The conditions used in the MedPAC analyses include coronary artery disease, bacterial pneumonia, cerebrovascular disease, essential hypertension, congestive heart failure, urinary tract infections, diabetes (both type 1 & type 2), cholecystitis and cholelithiasis, prostate cancer, breast cancer, peptic ulcer disease, and sinusitis.
32 We did not evaluate the clinical validity of the two groupers, examine the logic that was used to define related services, or compare these groupers to other groupers not used in this project.
33 Standardized payments were reduced by the copayment amount for each service and excluded deductibles>
34 Primary care physicians were identified using their specialty code in Medicare claims. We included physicians with specialties internal medicine, family medicine, and hospitalists.
35 Currently, a single physician can bill under multiple tax identifiers, and those tax identifiers may represent "groups" of physicians.
36 The episodes of care were generated by Acumen, LLC using the specifications outlined here.
37 For Medstat, all chronic episode types have an associated clean period of 999 days. Such diseases effectively have a 365-day clean period, because Medstat uses an annual cutoff for chronic episodes. Thus, claims occurring one year apart should always be grouped to different episodes. For this reason, and to make completeness statistics of chronic episode types more comparable between the two groupers, we use 365-day clean periods for these MEGs.
38 Diagnosis codes are not linked to services listed on institutional claims. Additionally, 82% of IP claims, 70% of SNF claims, and 38% of HH claims have more than 4 codes, requiring the user to choose which four claims to include in the service record.