
Monday, October 31, 2016
Printer Friendly Version in PDF Format (7 PDF pages)
Prevalence and Incidence of Dementia in Race/Ethnic Populations in the U.S.
Gwen Yeo, PhD, AGSF
Systematic Review of Prevalence and Incidence of Dementia in US Race/Ethnic Populations
Mehta and Yeo
- Search
- 1229 studies reviewed
- Data Base
- 114 with appropriate recruitment and diagnostic methods included in data base
- Analysis
- Comparisons very difficult
- Different ages, methodologies, reporting styles
What Do We Know About Dementia Prevalence in Race/Ethnic Populations?
African Americans
- (10 of the 19 studies)
- ~ ages of samples from 40+ to 100+
- ~ prevalence ranges from 0.01% to 68%
- ~ four reported age >65: 7%, 8%, 16%, 22%
- ~ four reported age > 85: 18%, 23%, 32%, 59%
In the 8 studies who also had a non-Latino white comparison group, all but one showed lower rates for whites.
Latino/Hispanic Prevalence
- Mexican American
- SALSA > 60: 5%; >85: 31%
- Puerto Rican (PR)
- PR Veterans > 65: 13%
- Cuban American (women)
- > 65: 13%
- Caribbean Hispanic (Dominican, PR, & Cuban)
- 65-74: 8%
- 75-84: 28%
- > 85: 63% in those aged 85 and over.
Asian American Prevalence
- Japanese Americans
- Honolulu Heart Study/HAAS Men
- > 65: 8%; >85: 33%
- Kame Study (Seattle area)
- > 65: 6%
- Korean American MASK-MD
- (screening data only) > 60: 7%
- Honolulu Heart Study/HAAS Men
NO DATA AVAILABLE ON OTHER ASIAN AMERICAN POPULATIONS
American Indian Prevalence
NO RELIABLE REPORTS AMONG AMERICAN INDIAN POPULATIONS
Pacific Islander Prevalence
- Chamorros (indigenous population of Guam)
- > 65: 12% (9% Guam Dementia)
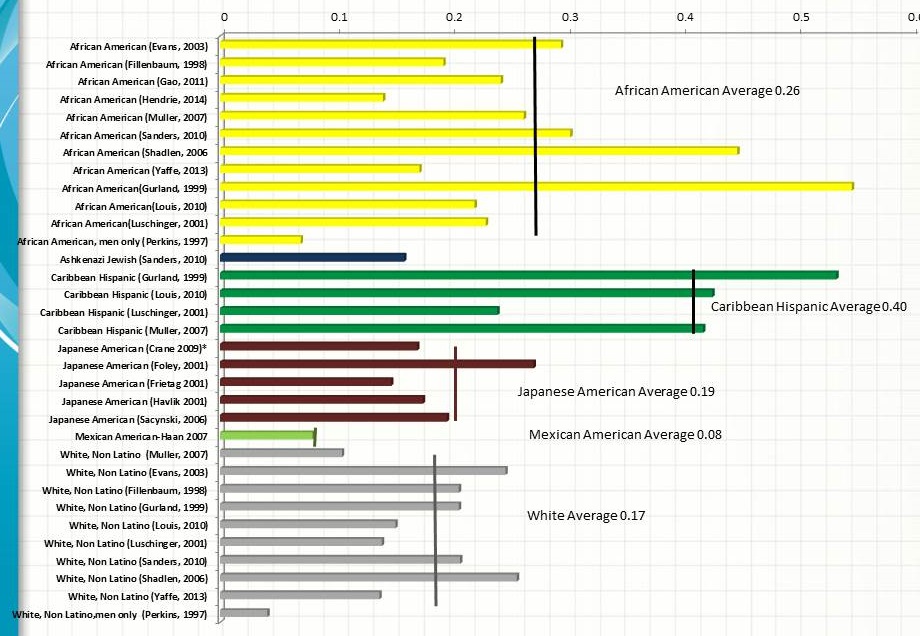
AVERAGE ANNUAL INCIDENCE BY RACE/ETHNICITY
 |
What Did We Learn?
- There are major gaps in the evidence for rates of prevalence or incidence among different race/ethnic populations.
- American Indians
- Most Asian American populations
- Chinese, Filipino, Asian Indian, Vietnamese
- Smaller Asian groups
- Most Pacific Islander populations
- It is impossible to compare results of studies fairly within or across population groups because of differences in:
- Age of subjects
- Recruitment and inclusion strategies
- Diagnostic methods
- How results are reported
- By age categories only?
- By gender categories only?
Result: Disparities cannot accurately be documented
- It is important to disaggregate data on ethnic populations within the large race/ethnic categories used by OMB.
- For example, the lowest and highest rates are found among populations classified as Hispanic/Latino. If lumped together, the results are misleading.
Northern CA Kaiser Permanente Multi-Ethnic Incidence Study, 2016
Followed 274 thousand patients >60 for 14 years, age adjusted dementia incidence rates per 1000 person/years were:
| Asian American | 15.2 |
|---|---|
| NL White | 19.4 |
| Pacific Islander | 19.6 |
| Latino | 19.6 |
| American Indian/AN | 22.2 |
| African American | 26.6 |
| Mayeda et al. | |
Recommendations to Increase our Knowledge about Disparities
- Develop standardized protocol for race/ethnic epidemiological research
- Prioritize funding for ethnic specific populations with little or no data
- Require inclusion of target community members in research team
Next Steps
- Knowledge of Risk Factors
- Interventions
- Decrease in Disparities