
Rosemary Borck and Robert Schmitz
Mathematica Policy Research
Pamela Doty and John Drabek
Office of the Assistant Secretary for Planning and Evaluation
Printer Friendly Version in PDF Format (23 PDF pages)
ABSTRACT
This study is a follow-up to earlier research conducted with 2006 and 2009 Medicaid (MAX) data on interstate variations on the extent of the "re-balancing" of Medicaid long-term services and supports (LTSS) from nursing home care toward greater reliance on home and community-based services (HCBS). The present study reports interstate variations in transition rates of older adult Medicaid enrollees from the community in 2006 to Medicaid-funded nursing home care over the three-year period from 2007 through 2009. Transition rates by state were measured for older Medicaid enrollees residing in the community in 2006 who were receiving HCBS waiver services, those receiving only state plan personal care services, and those receiving no community LTSS. The study also looked for statistically significant correlations between lower transition rates to nursing home care and variations in state Medicaid LTSS program design.
DISCLAIMER: The opinions and views expressed in this report are those of the authors. They do not necessarily reflect the views of the Department of Health and Human Services, the contractor or any other funding organization.
| This study is a follow-up to earlier research conducted with 2006 and 2009 Medicaid (Medicaid Analytic eXtract [MAX]) data on interstate variations on the extent of the "rebalancing" of Medicaid long-term services and supports (LTSS) from nursing home care toward greater reliance on home and community-based services (HCBS). The present study focuses on interstate variations in transition rates of older adult Medicaid enrollees from the community in 2006 to nursing home care over the three-year period from 2007 through 2009. We found that more highly "rebalanced" states (those with proportionately higher spending on HCBS and higher numbers of LTSS users receiving HCBS relative to institutional care) had lower rates of transition to nursing home care among all older adult Medicaid enrollees living in the community, including those who received HCBS while in the community as well as those who did not. Just as our earlier research found certain Medicaid program and other state characteristics that can be influenced by policymaking to be associated with LTSS systems that were more oriented toward HCBS, this study also identified statistically significant correlations between a number of Medicaid and other state characteristics and lower rates of transition of older adult Medicaid enrollees from the community to nursing home care. The state characteristics associated with lower rates of nursing home transition include: greater proportionate levels of LTSS expenditures going to HCBS, higher percentages of LTSS users receiving HCBS, greater likelihood of HCBS rather than nursing facilities being the first LTSS used, higher HCBS spending per HCBS user, lower numbers of nursing facility beds per 1,000 state residents age 65 and older, and lower percentages of nursing facility residents assessed with low care needs. These findings suggest that some features of Medicaid program design and state LTSS infrastructure over which state policymakers can exert considerable influence are associated with lower transitions to nursing home care. |
Introduction
In recent decades, advocates and researchers have stressed the quality of life, health, and potential cost advantages of providing paid LTSS in home and community-based rather than institutional settings (Grabowski et al. 2010; Kaye 2009, 2012; Keenan 2010; Pruchno and Rose 2000; Wodchis et al. 2003). In this study, we examine transition rates of Medicaid enrollees age 65 and older (older adults) from living in the community to long-stay nursing home care and explore state Medicaid program characteristics that are associated with the sizable interstate variations in these rates.
This study focuses on older adults in Medicaid because these individuals continue to be more likely than younger Medicaid enrollees with disabilities to receive LTSS in institutional settings rather than the community. In our prior research comparing interstate variations in Medicaid LTSS spending and service use (Borck et al. 2014; Wenzlow et al. 2011) we observed that "rebalancing" of state Medicaid LTSS systems away from their traditional reliance on institutional care toward HCBS has occurred at a lower rate for older adult LTSS users compared to younger LTSS users with disabilities, especially those with intellectual and developmental disabilities. This pattern is concerning because within the next ten years the oldest members of the baby boom generation will reach the age of 80, increasing the demand for LTSS associated with aging-related chronic disabilities. In particular, research indicates that the risk of experiencing severe aged-related disability and needing paid LTSS continues to be concentrated among low-income older adults, which suggests increasing demand for Medicaid coverage of these services (Johnson 2016).
Although the number of older Americans residing in nursing homes, including the number of Medicaid enrollees, has decreased since 2000 (Eiken et al. 2015), it is unclear whether or how much of the decline in nursing home use can be attributed to increased access to HCBS. In particular, limited information is available about the effectiveness of Medicaid-funded HCBS as a means for preventing or delaying nursing home entry among older adult Medicaid enrollees. An analysis of nationally representative Health and Retirement Survey data found that Medicaid-funded HCBS was associated with a statistically significant decrease in nursing home use only among childless older adults with disabilities (Muramatsu et al. 2007). Another analysis found a statistically significant association between receipt of paid home care and lower likelihood and duration of long-stay nursing home care (Spillman 2016, forthcoming). In that study, the association was somewhat stronger for Medicaid-financed home care and for Medicaid and non-Medicaid older adults with disabilities living in states with higher percentages of Medicaid LTSS expenditures going toward HCBS relative to nursing home care. Nevertheless, the amount of nursing home use deterred was small. It should be noted that nationally representative surveys of older Americans with and without disabilities have limited utility for assessing the effectiveness of state Medicaid-financed LTSS on preventing and postponing nursing home use. The samples for these surveys may not include individuals from all states and the samples may not be statistically representative for the states that contributed sample members. Moreover, a minority of older adults with disabilities who are sampled in national surveys are enrolled in Medicaid.
Studies that focus on Medicaid enrollees and their use of Medicaid-funded LTSS are often case studies of individual states or compare a very limited number of states. For example, Sands et al. (2012) found a statistically significant relationship between more generous Medicaid HCBS benefits (as evidenced by more hours of in-home aide services) and increased time to nursing home admission among Medicaid HCBS users in Indiana. Kane et al. (2013) compared changes in numbers of nursing home residents, expenditures and case mix of nursing home residents across seven states as Medicaid investment in 1915(c) HCBS waiver programs increased from 2001 to 2005. In six of the seven states the number of nursing home residents decreased as the numbers of HCBS recipients grew. However, growth in HCBS recipients outpaced reductions in nursing home users and the authors concluded that efforts to promote substitution of HCBS for nursing home care needed to be more proactive. Few, if any, studies of Medicaid LTSS have focused specifically on particular states that have lower rates of transitions to nursing homes and identifying the characteristics of their Medicaid LTSS programs that might be associated with these lower transition rates.
In our previous research using Medicaid administrative data to measure interstate variations in rebalancing toward HCBS for older adult Medicaid LTSS users, we observed in both 2006 and 2009 a small number of states that were more highly rebalanced than other states. These states had both higher percentages of LTSS expenditures for older adults going toward HCBS relative to nursing home care and relatively more older adult LTSS users receiving HCBS compared to institutional care (Wenzlow et al. 2011; Borck et al. 2014). If these more rebalanced states are effective in using HCBS to prevent or postpone nursing home use among older adult Medicaid enrollees, we might expect to see lower rates of transition from the community to long-stay nursing home care in these states. Similarly, we might expect that lower rates of transition to long-stay nursing home care among older adult Medicaid enrollees would correlate with certain Medicaid program attributes or characteristics of state LTSS systems.
Understanding and Interpreting Interstate Variations in State Medicaid Long-Term Services and Supports Programs
Within general federal guidelines, states have considerable latitude to design their Medicaid LTSS systems and as a result of the different choices they can make, state systems vary on multiple dimensions (Smith et al. 2000; O'Keeffe et al. 2010; Reaves and Musumeci 2015).1 Although differences in state Medicaid programs and LTSS systems may help to explain patterns of LTSS use, these differences can also make it difficult to identify the cause of differences in LTSS use patterns, such as higher or lower rates of transition from the community to nursing home care. For example, it is unclear whether a state with high HCBS use and low transition rates for older adult Medicaid enrollees from the community to long-stay nursing home care is actually preventing and postponing nursing home use or whether some other characteristic of the Medicaid program or the state population accounts for the difference.
Nursing Facility Care
All state Medicaid programs must provide nursing facility care to individuals who meet financial and medical/functional ("level of care") need criteria for this care. Although there are some general federal requirements about Medicaid eligibility, there are no standard federal criteria for determining "level of care" need for nursing home care. As a result, state Medicaid programs vary considerably in the stringency of their nursing facility coverage criteria.
In addition to differences in nursing home eligibility criteria, states vary in the available supply of nursing home beds. In this study, we assess the relationship between nursing home transition rates and the number of nursing home beds per 1,000 state residents age 65 and older (Reinhard et al. 2011). Although we cannot assess causality, we consider the number of available nursing home beds in the context of the maxim known as Roemer's Law that "a built bed is a filled bed" (Roemer and Shain 1959), which was first applied to hospital beds and subsequently to nursing home beds.2 In this argument, the need to assure occupancy rates sufficient to cover fixed costs, expanding the supply of nursing home beds motivates providers to fill those beds.
The reasons why some states have much higher or lower nursing home supply than others likely vary. Geography, history, climate, population demographics, and state-specific idiosyncrasies all may play a role. Most states increased their supply of nursing home beds substantially during the early years of Medicaid, a time period that preceded efforts in most states to invest heavily in HCBS. Then, beginning in the 1970s, many states adopted "certificate of need" (CON) requirements that restrict the number of new nursing home beds in the state, and some states also extended these laws to home health care agencies. Beginning in the late 1980s, growth in the older adult population nationally began to outpace growth in nursing home beds supply (AHRQ 1999). By 2006, the number of nursing home beds relative to the size of the potential nursing home population varied considerably across states. Some states, such as Connecticut, introduced CON requirements only after their states had relatively high numbers of nursing home beds for their older adult population. Other states, such as Florida, implemented these laws when their nursing home bed supply ratios were still well below the national average and, as a result, have kept tighter control on the number of new nursing home beds per state resident. CON laws often resulted in moratoria of varying lengths being imposed on bed supply increases in the states that used these requirements. However, because CON only affected future expansion of nursing home bed supply, these rules did not address the relatively high number of nursing home beds in some states before these requirements were implemented. Another result of CON laws is that these requirements prevented new providers from entering the market and left existing nursing home operators with control of nursing home services. Despite the variation in bed supply to population ratios in CON states, one recent study found that "controlling for other factors, public post-acute and long-term care expenditures in CON states have become dominated by nursing homes" (Rahman et al. 2015). In particular, these researchers observed the slowest growth in community-based care in states with CON laws for both the nursing home and home health industries.
Other states may have lower supplies of nursing home beds because of early investments in residential and/or home care services. For example, since 1913, Alaska has operated, and heavily subsidized, residential facilities (called "pioneer homes") that provide an alternative to nursing home care for older adults in the state who require personal care and/or protective supervision. In another example, California's In-Home Supportive Services program was created in 1974 and provides in-home services to help older adults and individuals with disabilities remain in their homes. It is possible that these early investments in home-delivered and alternative residential services enabled both states to avoid needing as many nursing home beds as other states did during the 1970s and 1980s. In addition, it is possible that some states that have been retirement destinations for the "young-old" (e.g., Florida, and, more recently, North Carolina, South Carolina, and Georgia) may have less need for Medicaid-financed LTSS because many older adult migrants who develop age-related disabilities return to their states of origin to be near family and to use LTSS.3
Section 1915(c) HCBS Waivers
Nursing home care is a federally-required Medicaid benefit, but states also have the option of providing Medicaid-financed HCBS to older adults and individuals with disabilities. In this study we focus on two optional Medicaid HCBS programs: HCBS waivers and state plan personal care services. Because of key differences in the eligibility pathways for these programs, we analyze the two groups and their nursing home transition rates separately. In the following sections we outline some of the important distinctions between the two optional programs and the interstate variation in these programs.
All states have chosen to offer HCBS to older adult Medicaid enrollees via Section 1915(c) waiver programs (called HCBS waivers). HCBS waivers can include a wide range of services and supports, including personal care, homemaker/chore services, respite care, case management, adult day care, home-delivered meals, transportation, assistive technologies and home modifications; some waiver programs cover more than 20 discrete services.
Because HCBS waivers are intended to provide an alternative to nursing home care, waiver program participants must meet the state's nursing home coverage requirements. As discussed previously, while Medicaid enrollees must meet nursing home coverage requirements to enroll in HCBS waiver, there is no national standard for "level of care" criteria for Medicaid nursing home coverage. As a result, the severity of disability required to access HCBS waiver coverage varies across states (Hendrickson and Kyzr-Sheeley 2008).
States can limit their HCBS waiver programs in a few key ways. First, states can target HCBS waivers to specific Medicaid populations, such as individuals who are age 65 or older, individuals with certain types of disabilities, or individuals with specific conditions. States can also limit the number of participants in a waiver program and put other potential waiver users on a waiting list. In most states, there are no or very short waiting lists for older adult HCBS waiver programs, but a handful of states (including Texas, Michigan, Maryland, Louisiana, and Florida) have historically had relatively long waiting lists (Kaiser Family Foundation 2014). For example, in 2006, older adults and younger adults with physical disabilities accounted for 42 percent of 280,176 individuals on HCBS waiver waiting lists (Ng and Harrington 2014). States with stringent nursing home and HCBS waiver coverage standards and lengthy waiting lists might be expected to have higher rates of transition from the community to nursing homes compared to states with less stringent coverage standards. However, states with waiting lists for older adult waivers typically give priority to those judged to be most at risk of nursing home admission in the absence of HCBS. States may also offer more limited HCBS to individuals on waiver waiting lists. These "stop gap" benefits may be state or locally-funded or they may be funded under the state plan personal care services optional benefit.
State Plan Personal Care Services
States can opt to offer personal care services under their Medicaid state plan. The number of states electing this benefit has varied slightly over the years, and in 2006 this benefit was available in 32 states (Kaiser Family Foundation 2016). Unlike HCBS waiver coverage, states do not have to limit state plan personal care services to individuals who meet nursing home eligibility criteria. States can set their own coverage criteria for state plan personal care services and, as with nursing home eligibility criteria, these coverage criteria vary across states. Most states require recipients to need hands-on help with at least 1-2 activities of daily living (i.e., personal care tasks such as bathing, dressing, transferring, toileting, eating). Some states also cover individuals who do not need physical help with personal care tasks but require extensive supervision as well as help with instrumental activities of daily living (especially tasks such as medication management and meal preparation) because of cognitive impairment (O'Keeffe et al. 2010). Unlike HCBS waiver programs, states that elect to offer state plan personal care services must provide these services to all Medicaid enrollees who meet the personal care services eligibility criteria and there can be no waiting lists for coverage. The individuals who receive state plan personal care services are primarily eligible for Medicaid on the basis of low income and resources, and may not have disabilities that have the same level of long-term institutional care as individuals eligible for HCBS waivers (Ruttner and Irvin 2013).
As a general rule, in states that offer both types of Medicaid HCBS, individuals who receive HCBS waiver services meet nursing home level of care criteria, whereas those who receive only state plan services are considerably less likely to meet nursing home level of care criteria. Given the differences in the criteria and potential needs of HCBS and state plan personal care services users, we might expect the rate of transition from the community to nursing home care among older adults who receive only state plan personal care services to be lower than that of HCBS waiver participants because their risk of nursing home admission is lower.4
Special Medicaid Eligibility Criteria for Individuals with Disabilities
In addition to individuals who meet general Medicaid income eligibility criteria, states can also elect to offer nursing home and HCBS waiver coverage to individuals with incomes up to 300 percent of the Supplemental Security Income (SSI) standard (often called the "300 percent rule").5 In contrast, individuals who meet the criteria for state plan personal care services but not nursing home care are not eligible for Medicaid under the 300 percent rule and they are subject to the more stringent financial eligibility rules that apply to all other Medicaid services (O'Malley Watts et al. 2016). The 300 percent rule produces another potential difference between HCBS waiver users and state plan personal care service users across states. In 2006, 38 states used the 300 percent rule for individuals who needed nursing home level of care (Kaiser Family Foundation 2006). In this study we found that just over half of older adults using HCBS waivers in 2006 qualified for Medicaid under eligibility pathways that allowed them to have incomes above the standard Medicaid eligibility levels, whereas about 80 percent of older adult personal care services users qualified under pathways that require lower incomes, at or below the SSI cash assistance level (data not shown).
Addressing the Complexity of Interstate Variations in Medicaid Long-Term Services and Supports Program Design
Our study acknowledges and seeks to address the considerable variation in Medicaid LTSS programs and LTSS infrastructure across states by measuring differences in HCBS use and transition rates to nursing home care at the state-level from 2006 through 2009. We also looked for statistically significant associations between transition rates to nursing home care and state LTSS program and systems characteristics. The major limitations of our study stem from the complexity of state variations in Medicaid programs and LTSS systems and our inability to control simultaneously for the multiplicity of variations that may explain differences in transition rates to nursing home care across states. Accordingly, our findings are more suggestive than definitive. Nevertheless, this analysis provides context for policymakers who are interested in expanding HCBS for older adults toward a goal of reducing long-term nursing home use in this population. Our state-level findings also generate hypotheses for future research on the role of state Medicaid programs in reducing or preventing nursing home use among older adults.
Data and Methods
Data Source. Building on our prior studies of Medicaid-financed LTSS utilization and expenditures, Mathematica analyzed MAX data from 2006 through 2009 to examine patterns in LTSS use over time (Borck et al. 2014; Wenzlow et al. 2011). MAX data contain individual-level demographic, enrollment, and service utilization information for all Medicaid enrollees during a calendar year.
State Exclusions. We excluded 11 states and the District of Columbia from this analysis due to concerns about the reliability or completeness of the state's MAX data during the study period. Although MAX data are uniquely suited for this analysis, limitations remain. First, MAX contains limited information about services provided by capitated managed care plans, so we excluded states where a large portion of older adult enrollees received Medicaid LTSS via capitated managed care arrangements. Second, we excluded states where we identified state-specific data quality issues that were relevant to our analyses during the study period.6
Study Population. Within the 39 states included in the analysis, our study population included Medicaid enrollees who were age 65 or older as of December 31, 2006. From this population, we excluded the following groups of Medicaid enrollees: (1) enrollees who received LTSS via managed care programs, such as Programs of All-Inclusive Care for the Elderly; (2) enrollees identified as having an intellectual or developmental disability; (3) Medicare-Medicaid dual eligibles whose Medicaid benefits were limited to Medicare cost-sharing, and (4) enrollees who died before January 1, 2007.
Identifying Medicaid LTSS Use. For each year, from 2006 through 2009, we categorized older adult Medicaid enrollees into one of the following mutually exclusive categories based on their Medicaid-financed LTSS use during that year:
-
Nursing Home User. Medicaid enrollees who used at least 60 days of Medicaid-financed nursing home care, including enrollees who also used Medicaid-financed HCBS during the year.
-
HCBS User. Medicaid enrollees who used Medicaid-financed HCBS during the year (and were not identified as nursing home users). We distinguished two types of HCBS users: (1) enrollees who used HCBS waiver services (including enrollees who also used state plan personal care services); and (2) enrollees who used state plan personal care services only (and did not use any HCBS waiver services).7
-
Other Community Enrollees. Medicaid enrollees who were not identified as using either nursing home or HCBS during the year.
After categorizing enrollees by their baseline LTSS use in 2006, we followed the cohort of older adult Medicaid enrollees living in the community (including HCBS users and other community enrollees) from 2007 through 2009 to determine future LTSS use among these Medicaid enrollees. Because our analysis focused on the initial transition to nursing home care, we stopped following individuals once they were identified as nursing home users. Enrollees who died after transitioning to nursing home care are included in the population of nursing home users each year.
Long-Term Services and Supports Use and Nursing Home Transitions
National Rate (39 States) of Long-Term Services and Supports Use in 2006
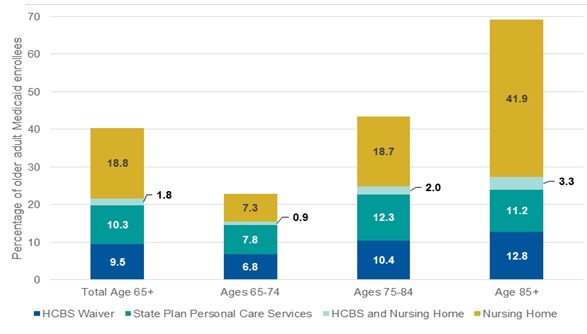
About 40 percent of the 3.2 million older adult Medicaid enrollees in our study used some form of Medicaid-financed LTSS in 2006. About half of these enrollees used HCBS and about half used nursing home services during the year (Exhibit 1). Among HCBS users in the 39 states in our analysis, older adult enrollees were split almost equally between receiving HCBS via waivers (9.5 percent) and using state plan personal care services (10.3 percent). Conversely, just under 60 percent did not use any Medicaid-financed LTSS during the year, representing almost 2 million of the 3.2 million older adult enrollees that year.
Consistent with existing research on nursing home use (CMS 2013), the percentage of enrollees using nursing home services increased with age, from about 8 percent of enrollees ages 65-74 to about 45 percent of enrollees age 85 and older. Rates of HCBS use also increased with age, though not quite as dramatically, from about 15 percent of enrollees ages 65-74 to 24 percent of enrollees age 85 and older. Across all age groups, only a small percentage of enrollees used both HCBS and nursing home service in 2006, suggesting relatively little movement between HCBS and Medicaid-financed nursing home care during the year.
National Rates of Transitions to Nursing Home Care
We followed all older adult Medicaid enrollees who were living in the community in 2006 for the subsequent three years and found that a relatively small percentage of these enrollees transitioned to using at least 60 days of Medicaid-financed nursing home care during that period. In 2007, or within one year, about 3.6 percent of all older adult Medicaid enrollees living in the community transitioned to nursing home care in the 39 states in our analysis (data not shown). By the end of 2009, the percentage had increased to about 7.5 percent (data not shown). Consistent with patterns of nursing home use in 2006, the likelihood of transitioning to nursing home care within three years increased with age, from just under 4 percent of enrollees who were ages 65-74 to 17 percent of enrollees age 85 and older.
The likelihood of transitioning to nursing home care was somewhat higher among older adults who used Medicaid-financed HCBS in 2006 (either waivers or state plan personal care services), but the majority of these enrollees continued to live in the community and use HCBS through 2009 (Exhibit 2). Individuals who used HCBS waiver services in 2006 had the highest rates of transitioning to nursing home care in subsequent years, 17 percent overall and increasing by age group from 12 percent of enrollees ages 65-74 to 23 percent of enrollees age 85 and older transitioning by 2009. However, even within this population with greater overall levels of disability, about half of enrollees remained in the community and continued to use HCBS for the three years we followed them. As Exhibit 2 shows, the proportion of HCBS users who continued to use HCBS waiver services through 2009 ranged from about 60 percent of the youngest older adults to about 33 percent of the enrollees age 85 and older. Individuals who used state plan personal care services in 2006 had lower transition rates than HCBS waiver users (9 percent) but still had higher transition rates than the overall older adult Medicaid population residing in the community (data for total Medicaid older adult population not shown). If Medicaid-financed HCBS use in 2006 can be an indicator of a chronic condition that puts an individual at higher risk for nursing home entry, it is not surprising that the populations who used HCBS, particularly waiver services, were at greater risk for transitioning to nursing home care than individuals who did not use these services. This higher transition rate is consistent with the generally higher level of disability in this population, as compared to the older adult population overall.
Interstate Variation in Medicaid Long-Term Services and Supports Use and Nursing Home Transition Rates
The patterns that we identified at the national level mask considerable interstate variation in the rates of nursing home entry among older adult enrollees who used Medicaid-financed LTSS in 2006.
Interstate Variation in Long-Term Services and Supports Use in 2006
Across states, the proportion of older adult enrollees who used LTSS in 2006 differed substantially. In South Carolina, Tennessee, and Utah, less than one-third of older adult enrollees used LTSS, compared to more than 70 percent of enrollees in Iowa, Kansas, and Wyoming (Exhibit 3). Of particular note for this analysis, the balance between nursing home and HCBS use also varied considerably across states in 2006. For example, in Iowa, about 42 percent of enrollees received nursing home care and an additional 32 percent used HCBS, representing relatively high rates of use for both types of LTSS. In other states, LTSS systems appear much more weighted toward one type of service. In Oregon, half of older adult enrollees used HCBS in 2006, and fewer than 15 percent used nursing home services. In contrast, almost half of older adult Medicaid enrollees in South Dakota used nursing home services and only about 16 percent used HCBS. In addition to contrasts in state Medicaid LTSS offerings, these differences likely result from variation in Medicaid eligibility and access and state demographics, and they highlight how dependent some Medicaid LTSS systems were on nursing home care in 2006.
Exhibit 3 also highlights differences in how states provided HCBS; that is, whether or not they provided HCBS through both waivers and the state plan personal care benefit or only via HCBS waivers. Twenty of the 39 states in our analysis offered both HCBS waivers and state plan personal care services to older adult Medicaid enrollees in 2006. In the other 19 states, eligibility for and access to an HCBS waiver was the sole route to Medicaid-financed personal care services.
In the 20 states that offered personal care services under the state plan as well as HCBS waivers, the relative reliance on these two HCBS funding authorities varied. As discussed previously, this results in part because of the different program rules and options. In many states with both programs, older adults in need of a nursing home level of care are enrolled in waiver programs and older adults who receive only state plan personal care services tend to have lower levels of disability. Some states, most notably California and New York, relied much more heavily on state plan personal care services than on HCBS waivers to provide HCBS. In these states, state plan personal care service users included individuals with disabilities severe enough to qualify them for nursing home admission.
Interstate Variations in Expenditures per Long-Term Services and Supports User
In addition to differences in eligibility to Medicaid-financed HCBS, states also vary considerably in the generosity of HCBS they provide. Previous research found a statistically significant association between higher benefit levels (more hours of in-home aide service) and reductions in nursing home use for certain enrollees in waiver programs (Sands et al. 2012). MAX data did not allow us to measure generosity of benefits in terms of average hours of in-home aide received by HCBS users. Instead, we measured the comparative generosity of HCBS benefits by examining interstate variations in the average expenditures per user of HCBS waiver services and per user of state plan personal care services (in states offering this benefit) to the average expenditures per user of nursing home care (Exhibit 4). Among the 39 states in our analysis, average Medicaid LTSS expenditures in 2006 were more than three times greater for older adults who used nursing home services during the year, compared to HCBS users, but this ratio varied greatly by state. For example, Florida, Mississippi, Missouri, North Dakota, and Utah spent more than five times more per older adult using nursing home care than on HCBS waiver services for older adults using these services. In comparison, in California, Louisiana, Maryland, New York, and North Carolina per user expenditures for HCBS were higher relative to per user expenditures on nursing home care, even though per user spending on HCBS in these states still remained considerably lower than per user spending on nursing home care.
Interstate Variation in Nursing Home Transition Rates
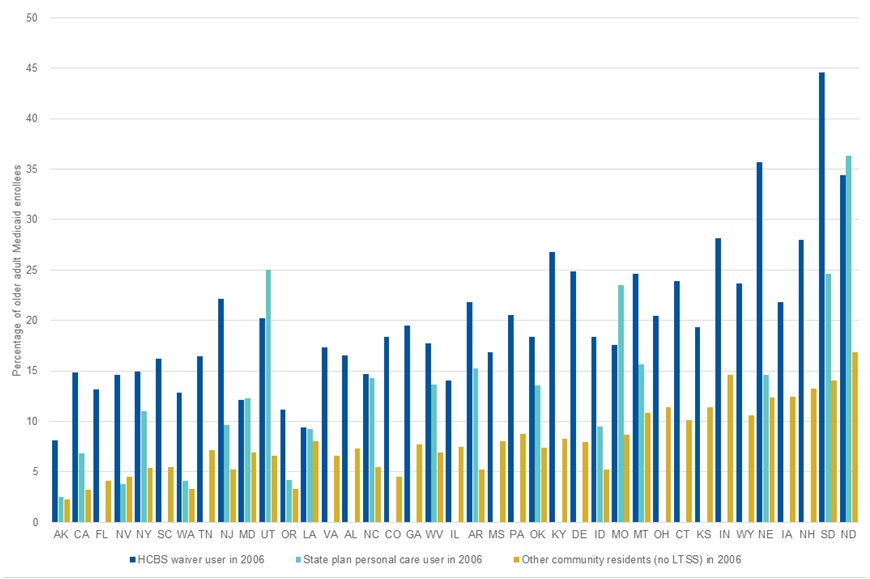
We found considerable interstate variation in the percentage of older adult enrollees who used Medicaid-financed LTSS in 2006 and then transitioned to nursing home care during the 2007-2009 period (Exhibit 5). Rates of nursing home transition for older adult Medicaid enrollees who were in the community in 2006 ranged substantially across states, from less than 5 percent of all older adult enrollees in the community in Alaska and California to at least 20 percent in North Dakota and South Dakota. State-specific transition rates are shown in Appendix Table A-1.
Consistent with national patterns, in most states nursing home transition rates were higher among Medicaid-financed HCBS users (including individuals who used HCBS waivers and individuals who used state plan personal care services) than among the total older adult Medicaid population in the state. However, the differences in the rates of nursing home transition among Medicaid HCBS users across states are notable, from less than 10 percent of Medicaid HCBS users in Alaska to over 30 percent in Nebraska, North Dakota, and South Dakota. Even when we limit our comparisons to enrollees who used Medicaid-financed HCBS, the populations across states are not precisely comparable due to different state eligibility rules and these differences likely account for some unknown percentage of the variations in transition rates. Nonetheless, the substantial difference across states in the likelihood of transitioning from Medicaid-financed HCBS to nursing home care within three years is noteworthy.
State Medicaid Program and Long-Term Services and Supports System Characteristics Associated with Nursing Home Transition Rates
We explored relationships between the characteristics of state Medicaid LTSS programs and state-level nursing home transition rates and identified a few aspects of state Medicaid LTSS systems that appear to be related to the likelihood that an older adult Medicaid enrollee transitioned to nursing home care. Our descriptive analysis found a variety of state program characteristics to be significantly associated with state-level nursing home transition rates in the 39 states in our analysis. Those with statistically significant correlations are listed in Exhibit 6.
First, we looked at the relationship between transition rates and indicators of balance toward HCBS in a state's LTSS system, including: (1) higher percentage of Medicaid LTSS dollars allocated to HCBS; and (2) higher percentage of LTSS users receiving HCBS. States with Medicaid LTSS programs that were more balanced toward HCBS during the analysis period generally had lower rates of transition to nursing home care among older adult Medicaid enrollees over the three year period from 2007 through 2009. More generous benefits as measured by higher average expenditures per user on HCBS waiver and state plan personal care services were also associated with lower rates of transition from the community to nursing home care.
We looked in particular at states that we identified in our previous study that ranked highly on measures of balance toward HCBS in 2006. Five of these states, Alaska, California, Nevada, New York, and Washington, had among the lowest rates of transition to nursing homes through 2009. One commonality is that all five provide Medicaid HCBS through both HCBS waivers and the state plan personal care services benefit. All five states also had more HCBS users self-directing their aide services compared to most states, although only in California, Washington, and Alaska was consumer direction the dominant HCBS delivery mode.8 Otherwise, these states use somewhat different approaches to provide Medicaid-financed HCBS. California and New York, as noted previously, primarily offer HCBS via the state plan personal care services benefit and provide HCBS to relatively few enrollees via waivers. As a result, we expect that although nationally personal care users may have lower levels of disability than HCBS waiver users, the personal care populations in California and New York include more individuals with severe disabilities who could qualify for nursing home admission.
Although we identified a general relationship between balance toward HCBS and low nursing home transition rates, our findings on the relationship between other measures of the generosity of Medicaid-financed HCBS were more mixed. We found that states with higher percentages of older adult LTSS users who first received LTSS in the community generally had lower rates of transition from the community to nursing home care (Exhibit 6). For HCBS to be effective in preventing or postponing nursing home use, it seems logical that new Medicaid LTSS users would need to first receive HCBS in the community. Another expectation with regard to HCBS being effective in preventing or postponing nursing home use is that receiving HCBS should enable individuals with low care needs to remain in the community, thereby reducing the percentage of nursing home residents with low care needs. Consistent with these expectations, we found that states with lower percentages of nursing home residents with low care needs generally had lower rates of transition to nursing homes. Conversely, we found no consistent, statistically significant relationships between nursing home transition rates and measures of the stringency of state HCBS waiver coverage criteria or the size of waiver waiting lists. This may be because, as discussed previously, states can mitigate the impact of stringent waiver coverage criteria and waiver waiting lists. They may do so by making available Medicaid state plan personal care services and/or other state and locally-funded programs that serve some low-income older adults who cannot meet coverage requirements for waiver programs or who met the criteria but were on waiting lists for waiver programs. They can also give priority to higher need individuals on waiting lists when HCBS waiver slots become available.
We also identified a strong, positive relationship between greater nursing home bed supply (beds per 1,000 state residents age 65 and older in 2006) and higher transition rates of older adult Medicaid enrollees from the community into nursing home care. This result is consistent with the previously discussed maxim known as Roemer's Law that "a built bed is a filled bed." In states such as Florida and South Carolina, which do not rank highly on measures of balance toward HCBS or generosity of benefits, the limited number of nursing home beds available for older state residents appears to be the only measure in our analysis that is linked to the low transition rate to nursing home care in those states. Similarly, states that relied heavily on nursing homes to provide LTSS in 2006 continued to rely heavily on these facilities through 2009, with higher rates of nursing home transitions in these states throughout our study period. For example, Indiana, New Hampshire, North Dakota, and South Dakota had among the highest rates of nursing home users in 2006; those states also transitioned larger percentages of older adult Medicaid enrollees into nursing homes from 2007 to 2009. In these states, the relatively higher supply of institutional options appears to be associated with the likelihood that an older adult will move to long-term nursing home care.
Discussion
This study highlights the range of experiences of older adult Medicaid HCBS users across states and identifies some aspects of state Medicaid programs that appear to be related to future trends in LTSS use among HCBS users. Our findings suggest that Medicaid LTSS program design and other policies that affect the supply of LTSS are associated with nursing home use rates and may be able to increase the effectiveness of investments in HCBS with regard to preventing or postponing nursing home use.
Key limitations of our analysis should be acknowledged. First, the transition rates that we report do not account for differences in levels of disability or in resources among the population of older adult Medicaid enrollees across states. Such differences could arise to the extent that states use different criteria to determine eligibility for Medicaid-financed LTSS, but even if Medicaid LTSS criteria were standard across states underlying population differences in income and levels of disability would still result in interstate variation in Medicaid populations. If individual-level information about levels of disability and resources are more readily available in future administrative data resources, controlling for these characteristics of Medicaid enrollees would enable more focused analysis on the predictors of nursing home transitions.
This analysis is also somewhat limited by its reliance on Medicaid data. Most older adult Medicaid enrollees are also dually eligible for Medicare. Because Medicare is the primary payer for most acute care services, we were unable to examine the patterns in service use linked to the transition from the community to nursing home care. For example, one common pathway may be that an individual in the community experiences an acute event (such as a fall) that results in an inpatient hospital stay, followed by a Medicare-financed skilled nursing facility stay which then leads to a long-term Medicaid-financed nursing home stay. We were unable to identify and explore such pathways in this study, but rather provide general estimates of the rates at which individuals in each state make these transitions. Also, because we focus on Medicaid-financed LTSS provided on a fee-for-service basis, our analysis excludes some states that may be achieving lower transition rates through managed LTSS programs. For example, adoption of fully integrated managed care models in organizations that are responsible for delivering all Medicare and Medicaid acute medical services and LTSS could result in more opportunities to intervene to prevent short-term post-acute nursing home use from leading to long-term stays.
This descriptive study provides a high-level overview of the differences in transition rates to long-term nursing home care across states from 2007 through 2009. Our high-level findings suggest additional areas for future research into the causes of transition to nursing home care and the role that state Medicaid LTSS programs may play in helping older adults remain in the community. Further exploration of the service utilization patterns (including services covered by Medicare) of enrollees in the six months before nursing home transition may provide more information about the different pathways from the community to nursing home care among enrollees who are served by HCBS waivers, state plan personal care programs, and who did not use Medicaid-financed LTSS before long-term nursing home entry. In addition, qualitative analyses could further explore the different pathways from the community to nursing home care and the ways that Medicaid-financed HCBS can be most effective at retaining individuals in the community.
Future studies of interstate variations in LTSS use patterns will also be able to explore changes in Medicaid LTSS due to regulatory and policy changes since 2009. In 2010, the Affordable Care Act provided states with additional authority under Medicaid law and financial incentives to expand access to HCBS, which may have implications for future assessments of interstate differences in LTSS patterns. Examples of new or recently expanded options for states include: the Community First Choice 1915(k) program, which allows states to provide HCBS attendant services and supports through the state plan; the 1915(i) state plan HCBS benefit, which allows states to offer services comparable to those provided under 1915(c) waivers to individuals who do not meet nursing home coverage requirements; the Balancing Incentive Program; the Money Follows the Person Program; and temporary grants of additional federal matching payments to help states invest in expansion of HCBS and also enable nursing home residents to return to community living. In addition to these changes, increasing use of managed LTSS programs across state Medicaid programs in recent years can also be expected to influence the patterns and use of LTSS across states.
References
Agency for Healthcare Research and Quality (AHRQ). Chartbook #3: Nursing Home Trends, 1987 and 1996. Rockville, MD: Agency for Healthcare Research and Quality, May 1999. Available at http://www.meps.ahrq.gov/data_files/publications/cb3/cb3.shtml.
Borck, Rosemary, Victoria Peebles, Dean Miller, and Robert Schmitz. Interstate Variation and Progress Toward Balance in Use of and Expenditure for Long-Term Services and Supports in 2009. Report for the U.S. Department of Health and Human Services, Office of the Assistant Secretary for Planning and Evaluation. Cambridge, MA: Mathematica Policy Research, March 2014. Available at https://aspe.hhs.gov/report/interstate-variation-and-progress-toward-balance-use-and-expenditure-long-term-services-and-supports-2009.
Bradley, Don. 2010. "Litwak and Longino's Developmental Model of Later Life Migration: Evidence from the American Community Survey, 2005-2007." Journal of Applied Gerontology, vol. 30, no. 2, 2011, 141-158.
Centers for Medicare & Medicaid Services (CMS). Nursing Home Data Compendium 2008 Edition. 2008. Available at https://www.cms.gov/Medicare/Provider-Enrollment-and-Certification/CertificationandComplianc/downloads/2008NursingHomeDataCompendium_508.pdf.
Centers for Medicare & Medicaid Services (CMS). Nursing Home Data Compendium 2013 Edition. 2013. Available at https://www.cms.gov/Medicare/Provider-Enrollment-and-Certification/CertificationandComplianc/downloads/nursinghomedatacompendium_508.pdf.
Eiken, Steve, Kate Sredl, Brian Burwell, and Paul Saucier. Medicaid Expenditures for Long-Term Services and Supports in FY 2013: Home and Community-Based Services were a Majority of LTSS Spending. Report for the Centers for Medicare & Medicaid Services. Cambridge, MA: Truven Health Analytics, June 2015. Available at https://www.medicaid.gov/medicaid/ltss/downloads/ltss-expenditures-fy2013.pdf.
Grabowski, David C., Rebecca Orfaly Cadigan, Edward Alan Miller, David G. Stevenson, Melissa Clark, and Vincent Mor. "Supporting Home- and Community-Based Care: Views of Long-Term Care Specialists." Medical Care Research and Review, vol. 67, no. 4 (suppl.), 2010, 82S-101S.
Hendrickson, Leslie and Gary Kyzr-Sheeley. Determining Medicaid Nursing Home Eligibility: A Survey of State Level of Care Assessment. New Brunswick, NJ: Rutgers University, Rutgers Center for State Health Policy, March 2008. Available at http://www.cshp.rutgers.edu/downloads/7720.pdf.
Johnson, Richard. Later Life Household Wealth Before and After Disability. Report for the U.S. Department of Health and Human Services, Office of the Assistant Secretary for Planning and Evaluation. Washington, DC: Urban Institute, 2016. Available at https://aspe.hhs.gov/basic-report/later-life-household-wealth-and-after-disability-onset.
Kaiser Family Foundation. "Medicaid Benefits: Personal Care Services 2003, 2004, 2006, 2008, 2010, and 2012." State Health Facts, 2016. Available at http://kff.org/medicaid/state-indicator/personal-care-services/.
Kaiser Family Foundation. Medicaid Facts: Medicaid and Long-Term Care Services. Washington, DC: Kaiser Commission on Medicaid and the Uninsured, July 2006. Available at http://www.allhealth.org/briefingmaterials/Kaiser-Medicaid-and-Long-Term-Care-Services-PDF-631.pdf.
Kaiser Family Foundation. "Waiting List Enrollment for Medicaid Section 1915(c) Home and Community-Based Services Waivers." State Health Facts. 2014. Available at http://kff.org/health-reform/state-indicator/waiting-lists-for-hcbs-waivers/.
Kane, Robert L., Terry Y. Lum, Rosalie A. Kane, Patty Homyak, Shriram Parashuram, and Andrea Wysocki. "Does Home- and Community-Based Care Affect Nursing Home Use?" Journal of Aging and Social Policy, vol. 23, no. 2, 2013, 146-160.
Kaye, H. Stephen. "Gradual Rebalancing of Medicaid Long-Term Services and Supports Saves Money and Serves More People, Statistical Model Shows." Health Affairs, vol. 31, no. 6, 2012, 1195-1203.
Kaye, H. Stephen, Mitchell LaPlante, and Charlene Harrington. "Do Noninstitutional Long-Term Care Services Reduce Medicaid Spending?" Health Affairs, vol. 28, no. 1, 2009, 262-272.
Keenan, Teresa. Home and Community Preferences of the 45+ Population. Washington, DC: AARP Research and Strategic Analysis, November 2010. Available at http://assets.aarp.org/rgcenter/general/home-community-services-10.pdf.
Muramatsu, Naoko, Hongjun Yin, Richard T. Campbell, Ruby L. Hoyem, Martha A. Jacob, and Christopher O. Ross. "Risk of Nursing Home Admission Among Older Americans: Does States' Spending on Home- and Community-Based Services Matter?" Journal of Gerontology: Social Sciences, vol. 62, no. 3, 2007, S169-S178.
Ng, Terence and Charlene Harrington. "Medicaid HCBS Programs and Policies: Data and Trends." Presentation to the National Association of States United for Aging and Disabilities HCBS Waiver Conference, Washington, DC, 2014.
O'Keeffe, Janet, Paul Saucier, Beth Jackson, Robin Cooper, Ernest McKenney, Suzanne Crisp, and Charles Moseley. Understanding Medicaid Home and Community Services: A Primer, 2010 Edition. Report for the U.S. Department of Health and Human Services, Office of the Assistant Secretary for Planning and Evaluation. Research Triangle Park, NC: RTI International, October 29, 2010. Available at https://aspe.hhs.gov/report/understanding-medicaid-home-and-community-services-primer-2010-edition.
O'Malley Watts, Molly, Elizabeth Cornachione, and MaryBeth Musumeci. Medicaid Financial Eligibility for Seniors and People with Disabilities in 2015. Washington, DC: Kaiser Family Foundation, Kaiser Commission on Medicaid and the Uninsured, March 2016. Available at: http://files.kff.org/attachment/report-medicaid-financial-eligibility-for-seniors-and-people-with-disabilities-in-2015.
Pruchno, Rachel A., and Miriam S. Rose. "Effect of Long-Term Care Environments on Health Outcomes." Gerontologist, vol. 40, no. 4, 2000, 422-428.
Rahman, Momotazur, Omar Galarraga, Jacqueline S. Zinn, David C. Grabowski, and Vincent Mor. "The Impact of Certificate of Need Laws on Nursing Home and Home Health Care Expenditures." Medicare Care Research and Review, vol. 73, no. 1, February 2016, 85-105. Available at http://mcr.sagepub.com/content/early/2015/07/28/1077558715597161.
Reaves, Erica L. and MaryBeth Musumeci. Medicaid and Long-Term Services and Supports: A Primer. Washington, DC: Kaiser Family Foundation, Kaiser Commission on Medicaid and the Uninsured, December 2015. Available at http://kff.org/medicaid/report/medicaid-and-long-term-services-and-supports-a-primer/.
Reinhard, Susan C., Enid Kassner, Ari Houser, and Robert Mollica. Raising Expectations: A State Scorecard on Long-Term Services and Supports for Older Adults, People with Physical Disabilities, and Family Caregivers. Washington, DC: AARP, Inc., September 2011. Available at http://assets.aarp.org/rgcenter/ppi/ltc/ltss_scorecard.pdf.
Roemer, Milton, and Max Shain. Hospital Utilization Under Insurance. Chicago, IL: American Hospital Association; 1959.
Ruttner, Laura, and Carol Irvin. Implications of State Methods for Offering Personal Assistance Services. Issue brief for the Centers for Medicare & Medicaid Services. Chicago, IL: Mathematica Policy Research, June 2013. Available at https://www.cms.gov/Research-Statistics-Data-and-Systems/Computer-Data-and-Systems/MedicaidDataSourcesGenInfo/Downloads/MAX_IB18_PA.pdf.
Sands, Laura P., Huiping Xu, Joseph Thomas III, Sudeshna Paul, Bruce A. Craig, Marc Rosenman, Caroline C. Doebbeling, and Michael Weiner. "Volume of Home- and Community-Based Services and Time to Nursing-Home Placement." Medicare and Medicaid Research Review, vol. 2, no. 3, August 6, 2012.
Smith, Gary, Janet O'Keeffe, Letty Carpenter, Pamela Doty, Gavin Kennedy, Brian Burwell, Robert Mollica, and Loretta Williams. Understanding Medicaid Home and Community Services: A Primer. Report for the U.S. Department of Health and Human Services, Office of the Assistant Secretary for Planning and Evaluation. Washington, DC: George Washington University, Center for Health Policy Research, October 2010. Available at https://aspe.hhs.gov/basic-report/understanding-medicaid-home-and-community-services-primer.
Spillman, Brenda. Does Home Care Prevent or Defer Nursing Home Use? Report for the U.S. Department of Health and Human Services, Office of the Assistant Secretary for Planning and Evaluation. Washington, DC: Urban Institute, 2016. Available at https://aspe.hhs.gov/basic-report/does-home-care-prevent-or-defer-nursing-home-use.
Wenzlow, Audra, Rosemary Borck, and Dean Miller. An Investigation of Interstate Variation in Medicaid Long-Term Care Use and Expenditures. Report for the U.S. Department of Health and Human Services, Office of the Assistant Secretary for Planning and Evaluation. Cambridge, MA: Mathematica Policy Research, April 2011. Available at https://aspe.hhs.gov/report/investigation-interstate-variation-medicaid-long-term-care-use-and-expenditures-across-40-states-2006.
Wodchis, Walter P., John P. Hirdes, and David H. Feeny. "Health-Related Quality of Life Measure Based on the Minimum Data Set." International Journal of Technology Assessment in Health Care, vol. 19, no. 3, 2003, 490-506.
Exhibits
| EXHIBIT 1. Medicaid-Financed LTSS Use in 2006 among Older Adult Medicaid Enrollees, 39 States |
|---|
 |
| SOURCE: Mathematica analysis of MAX, 2006. |
| EXHIBIT 2. LTSS Use in 2009 for Older Adult Medicaid Enrollees Who Used Medicaid-Financed HCBS in 2006 |
|---|
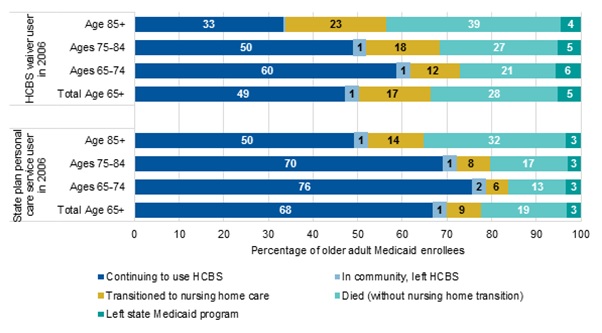 |
| SOURCE: Mathematica analysis of MAX, 2006. NOTE: The group continuing to use HCBS includes individuals who used either HCBS waiver services or state plan personal care services during 2009. |
| EXHIBIT 3. Percentage of Older Adult Medicaid Enrollees using Medicaid-Financed LTSS in 2006 by State |
|---|
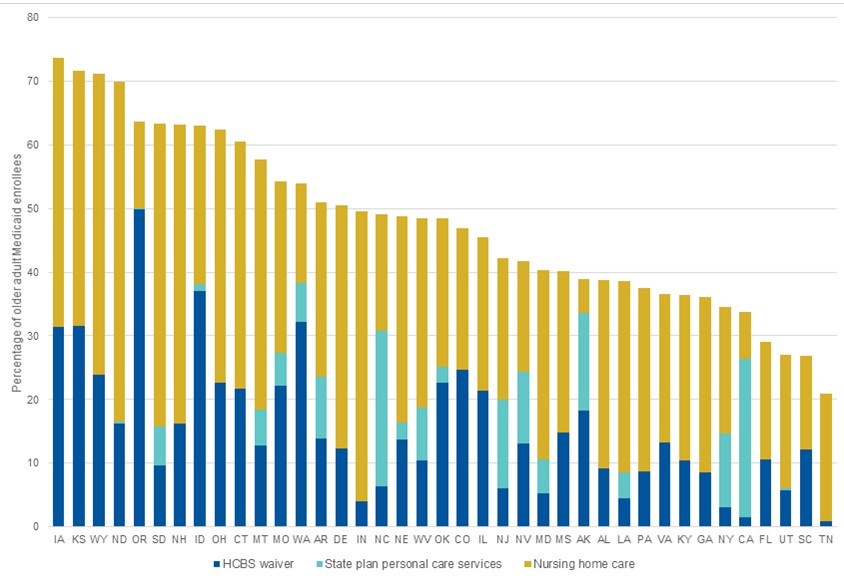 |
| SOURCE: Mathematica analysis of MAX, 2006. NOTE: Exhibit 3 is sorted in descending order of the percentage of older adult Medicaid enrollees using Medicaid-financed LTSS (nursing home or HCBS) in 2006. |
| EXHIBIT 4. States with the Largest and Smallest Differences between Average Medicaid LTSS Expenditures HCBS and Nursing Home Services for Older Adult Medicaid Enrollees in 2006 | |||||
|---|---|---|---|---|---|
| State | Medicaid LTSS Expenditures for HCBS Waiver Users | Medicaid LTSS Expenditures for State Plan Personal Care Services Users | Medicaid LTSS Expenditures for Nursing Home Users | Ratio of Nursing Home Expenditures to HCBS Waiver Expenditures | Ratio of Nursing Home Expenditures to State Plan Personal Care Services Expenditures |
| States with the Largest Differences | |||||
| Missouri | $3,436 | $7,037 | $27,176 | 7.9 | 3.9 |
| Florida | $5,234 | Not offered | $39,760 | 7.6 | n.a. |
| Mississippi | $5,925 | Not offered | $41,915 | 7.1 | n.a. |
| North Dakota | $6,981 | $3,908 | $40,336 | 5.8 | 10.3 |
| Utah | $6,860 | $2,971 | $35,239 | 5.1 | 11.9 |
| States with the Smallest Differences | |||||
| California | $15,745 | $9,246 | $38,444 | 2.4 | 4.2 |
| Montana | $16,070 | $7,636 | $36,798 | 2.3 | 4.8 |
| New York | $28,169 | $33,434 | $59,873 | 2.1 | 1.8 |
| Maryland | $28,321 | $11,799 | $49,413 | 1.7 | 4.2 |
| North Carolina | $21,581 | $6,984 | $34,433 | 1.6 | 4.9 |
| Louisiana | $22,661 | $11,197 | $26,509 | 1.2 | 2.4 |
| SOURCE: Mathematica analysis of MAX, 2006. n.a. = not applicable. | |||||
| EXHIBIT 5. Percentage of Older Adult Medicaid Enrollees Who Transitioned to Nursing Home Care During 2007-2009, by Medicaid LTSS Use in 2006 |
|---|
 |
| SOURCE: Mathematica analysis of MAX, 2006. NOTE: Exhibit 5 is sorted in ascending order of transition rates to nursing home care among all older adult Medicaid enrollees in the community in 2006. |
| EXHIBIT 6. Correlation Coefficients for Significant Relationships between Nursing Home Transition Rates during 2007-2009 and State Medicaid Program Characteristics | |||
|---|---|---|---|
| All Older Adults in the Community in 2006 | Older Adults using HCBS Waivers in 2006 | Older Adults using State Plan Personal Care Services in 2006 | |
| Measures of State LTSS Balance Toward HCBS | |||
| Percentage of expenditures for LTSS attributed to HCBS in 2009, among older adult enrollees (Borck et al. 2014) | -0.43 | -0.51 | -0.73 |
| Percentage of older adult LTSS users receiving HCBS in 2009 (Borck et al. 2014) | -0.39 | -0.49 | -0.68 |
| Percentage of new Medicaid LTSS users first receiving services in the community, 2007 (Reinhard et al. 2011) | -0.44 | -0.58 | -0.68 |
| Average Medicaid LTSS expenditures per older adult HCBS waiver user, 2006 baseline | -0.36 | -0.38 | -0.49 |
| Average Medicaid LTSS expenditures per older adult state plan personal care services user, 2006 baseline | -0.49 | --- | --- |
| Measures of Nursing Home Access and Availability | |||
| Nursing home beds per 1,000 state residents age 65 and older (CMS 2008) | 0.71 | 0.50 | 0.64 |
| Percentage of nursing home residents with low care needs (Reinhard et al. 2011) | 0.34 | --- | --- |
| SOURCE: Mathematica analysis of MAX, 2006-2009. NOTE: All correlation coefficients that are shown in the exhibit are significant at the 0.05 level. --- = relationship is not statistically significant at the 0.05 level. | |||
Appendix
| TABLE A-1. Transitions to Nursing Home Care 2007-2009 Among Full-Benefit Medicaid Enrollees Who Were Age 65 and Older and in the Community in 2006 | |||||
|---|---|---|---|---|---|
| State | Number of Older Adults in the Community in 2006 | Percentage of Older Adults in the Community in 2006 Transitioning to Nursing Home Care by 2009a | |||
| All Older Adults in the Community in 2006 | Older Adults Using HCBS Waivers in 2006b | Older Adults Using State Plan Personal Care Services in 2006b | Older Adults Using No Medicaid LTSS in 2006 | ||
| Total | 2,581,476 | 7.5 | 17.3 | 8.7 | 5.7 |
| Alabama | 34,985 | 8.5 | 16.6 | --- | 7.3 |
| Alaska | 6,946 | 3.4 | 8.1 | 2.5 | 2.3 |
| Arkansas | 29,678 | 9.7 | 21.8 | 15.3 | 5.2 |
| California | 775,150 | 4.4 | 14.9 | 6.8 | 3.2 |
| Colorado | 27,954 | 8.9 | 18.4 | --- | 4.5 |
| Connecticut | 26,037 | 15.0 | 23.9 | --- | 10.1 |
| Delaware | 3,387 | 11.3 | 24.9 | --- | 7.9 |
| Florida | 183,418 | 5.3 | 13.2 | --- | 4.1 |
| Georgia | 60,426 | 9.1 | 19.5 | --- | 7.7 |
| Idaho | 7,192 | 11.7 | 18.3 | 9.5 | 5.2 |
| Illinois | 113,323 | 9.4 | 14.1 | --- | 7.5 |
| Indiana | 26,009 | 15.6 | 28.2 | --- | 14.6 |
| Iowa | 16,019 | 17.6 | 21.8 | --- | 12.4 |
| Kansas | 13,361 | 15.6 | 19.3 | --- | 11.4 |
| Kentucky | 39,014 | 10.9 | 26.8 | --- | 8.3 |
| Louisiana | 38,938 | 8.2 | 9.4 | 9.2 | 8.0 |
| Maryland | 31,208 | 7.7 | 12.1 | 12.3 | 6.9 |
| Mississippi | 34,170 | 9.8 | 16.9 | --- | 8.1 |
| Missouri | 55,397 | 12.4 | 17.6 | 23.5 | 8.7 |
| Montana | 4,382 | 14.2 | 24.6 | 15.6 | 10.9 |
| Nebraska | 12,561 | 17.1 | 35.7 | 14.6 | 12.3 |
| Nevada | 10,492 | 6.0 | 14.6 | 3.8 | 4.5 |
| New Hampshire | 4,810 | 17.8 | 28.0 | --- | 13.2 |
| New Jersey | 87,709 | 7.3 | 22.1 | 9.7 | 5.2 |
| New York | 325,675 | 6.5 | 14.9 | 11.0 | 5.4 |
| North Carolina | 106,587 | 8.8 | 14.7 | 14.3 | 5.5 |
| North Dakota | 2,761 | 23.1 | 34.4 | 36.4 | 16.9 |
| Ohio | 66,151 | 14.8 | 20.5 | --- | 11.4 |
| Oklahoma | 35,718 | 10.8 | 18.4 | 13.6 | 7.4 |
| Oregon | 25,724 | 7.8 | 11.1 | 4.2 | 3.3 |
| Pennsylvania | 117,028 | 10.2 | 20.6 | --- | 8.8 |
| South Carolina | 56,425 | 7.0 | 16.2 | --- | 5.5 |
| South Dakota | 3,710 | 20.9 | 44.6 | 24.6 | 14.0 |
| Tennessee | 72,485 | 7.3 | 16.4 | --- | 7.2 |
| Utah | 8,843 | 7.7 | 20.3 | 25.0 | 6.6 |
| Virginia | 50,709 | 8.5 | 17.3 | --- | 6.6 |
| Washington | 50,582 | 7.0 | 12.8 | 4.1 | 3.3 |
| West Virginia | 14,983 | 9.3 | 17.8 | 13.7 | 6.9 |
| Wyoming | 1,529 | 16.5 | 23.7 | --- | 10.6 |
| SOURCE: Mathematica analysis of MAX, 2006-2009. NOTE: Enrollees in managed long-term care programs and those eligible for only restricted Medicaid benefits are excluded.
--- = State did not report state plan personal care service users in MAX 2006 data. | |||||
Notes
-
Although the term LTSS can include a diverse array of services, this study focuses on a few types of services, including long-term care that is provided in nursing facilities, HCBS that are provided via Section 1915(c) waiver, and personal care services that are provided through a Medicaid state plan. These services represent Medicaid-financed care that is typically provided over a longer period to individuals who may need an institutional level of care.
-
Although growth in nursing home supply might be a response to consumer demand for nursing home care, Roemer's law implies induced demand.
-
Researchers have documented this pattern in Florida (Bradley 2010), but we are unaware of similar research on elderly migration to and from other retirement destination states.
-
Although this pattern may apply in general, two large states -- California and New York -- are anomalous. Both California and New York rely primarily on their personal care services programs to provide HCBS and enroll comparatively few older adult Medicaid enrollees in HCBS waivers. These states have chosen to emphasize the provision of in-home personal care aide services and offer generous benefits (in terms of hours of aide service per month) compared to other states. At the same time, they judge comparatively few elderly beneficiaries who can qualify for nursing home admission as requiring any of the additional services and supports that can be covered under HCBS waivers. As a result, high percentages of older adults who receive only state plan personal care services in both California and New York have severe disabilities and qualify for nursing home coverage than in other states.
-
States may require copayments from individuals who qualify for HCBS waiver services with incomes above SSI; these amounts vary by state.
-
In addition to the District of Columbia, the 11 excluded states are: Arizona, Hawaii, Maine, Massachusetts, Michigan, Minnesota, New Mexico, Rhode Island, Texas, Vermont, and Wisconsin.
-
Federal law prohibits duplicate coverage under different Medicaid benefits. Thus, in states that have both HCBS waiver programs and state plan personal care services benefits, personal care services received by beneficiaries are often charged to the personal care services benefit rather than to the waiver program. Accordingly, in categorizing HCBS recipients for our analyses, we classified all beneficiaries receiving HCBS via waiver programs as HCBS waiver users even though in some states they may also have received personal care aide services under the personal care services optional benefit. Those classified as personal care services recipients received HCBS only via the state plan personal care services benefit.
-
In our previous research (Wenzlow et al. 2011; Borck et al. 2014) we found statistically significant correlations between having a state plan personal care services benefit and allowing consumer-directed HCBS (especially having high rates of consumer direction) and spending proportionately more on HCBS versus nursing home care. In this analysis we found that states offering HCBS via both waivers and the state plan and states that scored higher than others on consumer direction tended to have lower nursing home transition rates among their older adult Medicaid enrollees, but we did not find either of these relationships to be statistically significant.
This Research Brief reports interstate variations in transition rates of older adult Medicaid enrollees from the community in 2006 to Medicaid-funded nursing home care over the three-year period from 2007 through 2009. It was authored by Rosemary Borck and Robert Schmitz from Mathematica Policy Research, and Pamela Doty and John Drabek from the Office of the Assistant Secretary for Planning and Evaluation.
This report was prepared under contract #HHSP233201500035I between the U.S. Department of Health and Human Services (HHS), Office of Disability, Aging and Long-Term Care Policy (DALTCP) and Mathematica Policy Research. For additional information about this subject, you can visit the DALTCP home page at http://aspe.hhs.gov/office-disability-aging-and-long-term-care-policy-daltcp or contact the ASPE Project Officers, John Drabek and Pamela Doty, at HHS/ASPE/DALTCP, Room 424E, H.H. Humphrey Building, 200 Independence Avenue, S.W., Washington, D.C. 20201; John.Drabek@hhs.gov, Pamela.Doty@hhs.gov.