
ASPE RESEARCH BRIEF
Childhood Obesity
By: Jennifer Bishop, Rebecca Middendorf, Tori Babin, Wilma Tilson
Abstract
The document provides an overview of the research literature on causes of childhood obesity.
This research brief is available on the Internet at:
http://aspe.hhs.gov/health/reports/child_obesity/index.cfm
Overweight and obesity in children are significant public health problems in the United States. The number of adolescents who are overweight has tripled since 1980 and the prevalence among younger children has more than doubled. According to the 1999-2002 NHANES survey, 16 percent of children age 6-19 years are overweight (see Figure 1). 1,2,3 Not only have the rates of overweight increased, but the heaviest children in a recent NHANES survey were markedly heavier than those in previous surveys.
Figure 1. Prevalence of overweight among children and adolescents ages 6-19 years
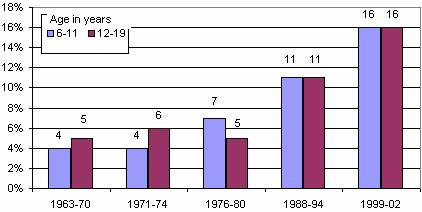
NOTE: Excludes pregnant women starting with 1971-74. Pregnancy status not available for 1963-65 and 1966-70. Data for 1963-65 are for children 6-11 years of age; data for 1966-70 are for adolescents 12-17 years of age, not 12-19 years.
SOURCE: CDC/NCHS, NHES and NHANES.
Obesity disproportionately affects certain minority youth populations. NHANES found that African American and Mexican American adolescents ages 12-19 were more likely to be overweight, at 21 percent and 23 percent respectively, than non-Hispanic White adolescents (14 percent).4 In children 6-11 years old, 22 percent of Mexican American children were overweight, whereas 20 percent of African American children and 14 percent of non-Hispanic White children were overweight.5 In addition to the children and teens who were overweight in 1999-2002, another 15 percent were at risk of becoming overweight.6,7 In a national survey of American Indian children 5-18 years old, 39 percent were found to be overweight or at risk for overweight.8
Being overweight during childhood and adolescence increases the risk of developing high cholesterol, hypertension, respiratory ailments, orthopedic problems, depression and type 2 diabetes as a youth. One disease of particular concern is Type 2 diabetes, which is linked to overweight and obesity and has increased dramatically in children and adolescents, particularly in American Indian, African American and Hispanic/Latino populations.9 The hospital costs alone associated with childhood obesity were estimated at $127 million during 19971999 (in 2001 constant U.S. dollars), up from $35 million during 19791981.10
Looking at the long-term consequences, overweight adolescents have a 70 percent chance of becoming overweight or obese adults, which increases to 80 percent if one or more parent is overweight or obese.11 Obesity in adulthood increases the risk of diabetes, high blood pressure, high cholesterol, asthma, arthritis, and a general poor health status.12 In 2000, the total cost of obesity for children and adults in the United States was estimated to be $117 billion ($61 billion in direct medical costs).13
Understanding the causes of childhood obesity can provide the opportunity to focus resources, interventions and research in directions that would be most beneficial in addressing the problem. The remainder of this document provides an overview of the existing research into the causes of childhood obesity, and a discussion of data limitations.
The causes of childhood obesity are multi-factorial. Overweight in children and adolescents is generally caused by a lack of physical activity, unhealthy eating patterns resulting in excess energy intake, or a combination of the two. Genetics and social factors - socio-economic status, race/ethnicity, media and marketing, and the physical environment also influence energy consumption and expenditure. Most factors of overweight and obesity do not work in isolation and solely targeting one factor may not going to make a significant impact on the growing problem.
To date, research has been unable to isolate the effects of a single factor due to the co-linearity of the variables as well as research constraints.14 Specific causes for the increase in prevalence of childhood obesity are not clear and establishing causality is difficult since longitudinal research in this area is limited. Such research must employ long study times to discern if there is an interaction of factors leading to an increase in the prevalence or the prevention of obesity during childhood and adolescence. Underreporting total food intake, misreporting of what was eaten, and over reporting physical activity are all likely potential biases that may affect the outcomes of studies in this area.15
Nutrition and Eating Habits
It is difficult to correlate nutritional choices and childhood obesity using observational research. However, trend data suggest some changes in eating patterns and consumption that may be correlated with increases in obesity. In general, children and adolescents are eating more food away from home, drinking more sugar-sweetened drinks, and snacking more frequently. Convenience has become one of the main criteria for Americans food choices today, leading more and more people to consume away-from-home quick service or restaurant meals or to buy ready-to-eat, low cost, quickly accessible meals to prepare at home. The nutritional composition of childrens diets as well as the number of calories consumed are of interest to determine the effect of food consumption on childhood obesity.
Below are notable trends gleaned from studies that used the USDAs Nationwide Food Consumption Survey and the Continuing Survey of Food Intakes by Individuals. These studies demonstrate changes in eating patterns among American youth that illustrate the complexity that exists relating food intake to the increased prevalence of obesity.16
- Children are getting more of their food away from home. Energy intake from away-from-home food sources increased from 20 to 32 percent from 1977-1978 to 1994-1996.17
- Daily total energy intake did not significantly increase for children 6-11, but did increase for adolescent girls and boys (ages 12-19 years) by 113 and 243 kilocalories, respectively.18,19
- Daily total energy intake that children derived from energy dense (high calorie) snacks increased by approximately 121 kilocalories between 1977 and 1996.20
- There has been a decline in breakfast consumption - especially for children of working mothers.
- Portion sizes increased between 1977 and 1996. Average portion sizes increased for salty snacks from 1.0 oz to 1.6 oz and for soft drinks from 12.2 oz to 19.9 oz. 21
Figure 2: Proportion of Vegetable Servings, 1999-2000
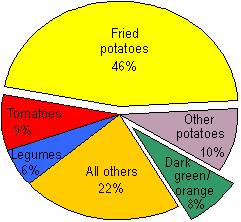
Note: Children 2-19 years.
Source: National Health and Nutrition Examination Survey, NCHS, CDC.
Figure 3: Proportion of Grain Servings, 1999-2000
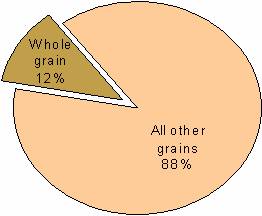
Note: Children 2-19 years.
Source: National Health and Nutrition Examination Survey, NCHS, CDC
Other studies indicate that children are not eating the recommended servings of foods featured in the USDA food pyramid and that there have been significant changes in the types of beverages that children are consuming:
- Only 21 percent of young people eat the recommended five or more servings of fruits and vegetables each day.22 As shown in figure 2, nearly half of all vegetable servings are fried potatoes.
- Percent total energy from fat actually decreased between 1965 and 1996 for children, from 39 to 32 percent for total fat, and 15 to 12 percent for saturated fat.23
- In 1994-1996, adolescent girls and boys only consumed 12 and 30 percent, respectively, of the Food Guide Pyramids serving recommendations for dairy; and 18 and 14 percent, respectively, of the serving recommendations for fruit.24
- Soda consumption increased dramatically in the early to mid 1990s. Thirty-two percent of adolescent girls and 52 percent of adolescent boys consume three or more eight ounce servings of soda per day.25 Soft drink consumption for adolescent boys has nearly tripled, from seven to 22 oz. per day (1977-1978 to 1994).26,27 Children as young as seven months old are consuming soda.28
- Milk consumption has declined during the same period. In 1977-78, children age 6-11 drank four times as much milk as any other beverage. In 1994-1996 that decreased to 1.5 times as much milk as sugar sweetened beverages.29 In 1977-1978, adolescents drank 1.5 times as much milk as any other beverage and in 1996 they consumed twice as much sugar sweetened beverages as milk.30 Milk consumption decreased for adolescent boys and girls 37 and 30 percent respectively, between 1965 and 1996.31
Studies on Diet
Several studies have been published that attempt to link childrens diets with the onset of obesity. However, none have been able to show a causal link between diet and obesity.32,33 Two such studies include the Bogalusa Heart Study and a USDA Economic Research Service study.
- The Bogalusa Heart Study analyzed childrens eating patterns over two decades (1973-1994) using a series of seven cross-sectional surveys given to 1,584 ten year old children. The study discovered changes in childrens eating patterns over this 20 year period including: increased incidence of missed breakfasts, increased numbers of children eating dinners outside the home, and increased snacking. No causal associations were found between changes in meal patterns and overweight status.34
- The USDA Economic Research Service study on fruit consumption indicated that higher fruit consumption is linked with a lower BMI in both adults and children. A large cohort of 3,064 children between the ages of 5 and 18 years were surveyed between 1994 and 1996 using the USDAs Continuing Survey of Food Intakes by Individuals (CSFII). The study hypothesized that people who incorporate nutrient-dense, low-fat foods into their diets like those found in fruits and vegetables will have a healthier BMI. However, the study only found a weak correlation between body weight and vegetable consumption.35
Figure 4: Vigorous Physical Activity for Adolescents by Grade Level: 2001
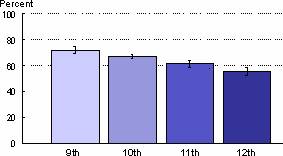
Note: Vigorous physical activity is activity that made students in grades 9-12 sweat or breathe hard for 20+ minutes minutes on 3+ of the past 7 days. I = 95% confidence interval.
Source: Youth Risk Behavior Surveillance System, NCCDPHP, CDC
Figure 5. Vigorous Physical Activity for Adolescents by Sex and Race/Ethnicity
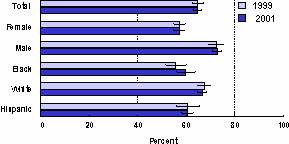
Note: Black and white exclude persons of Hispanic origin. Hispanic can be any race. Vigorous physical activity is activity that made students in grades 9-12 sweat or breathe hard for 20+ minutes minutes on 3+ of the past 7 days. I = 95% confidence interval.
Source: Youth Risk Behavior Surveillance System, NCCDPHP, CDC.
Physical Inactivity and Sedentary Behaviors
Research indicates that a decrease in daily energy expenditure without a concomitant decrease in total energy consumption may be the underlying factor for the increase in childhood obesity. Physical activity trend data for children are limited, but cross sectional data indicates that one third of adolescents are not getting recommended levels of moderate or vigorous activity, 10 percent are completely inactive, and physical activity levels fall as adolescents age (see figures 4 and 5).36 This situation may actually be worse than these data describe. Activity measured by physical activity monitors tends to be significantly lower than what is reported on surveys.37
Watching television, using the computer, and playing video games occupy a large percentage of childrens leisure time, influencing their physical activity levels. It is estimated that children in the United States are spending 25 percent of their waking hours watching television and statistically, children who watch the most hours of television have the highest incidence of obesity.38,39 This trend is apparent not only because little energy is expended while viewing television but also because of the concurrent consumption of high-calorie snacks.
A recent examination of the Department of Educations Early Childhood Longitudinal Survey (ECLS-K) found that a one-hour increase in physical education per week resulted in a 0.31 point drop (approximately 1.8%) in body mass index among overweight and at-risk first grade girls. There was a smaller decrease for boys. The study concluded that expanding physical education in kindergarten to at least five hours per week could reduce the percentage of girls classified as overweight from 9.8 to 5.6 percent.40
Figure 6: Percentage of children aged 9-13 years who reported participation in organized and free-time physical activity during the preceding 7 days, by selected characteristics
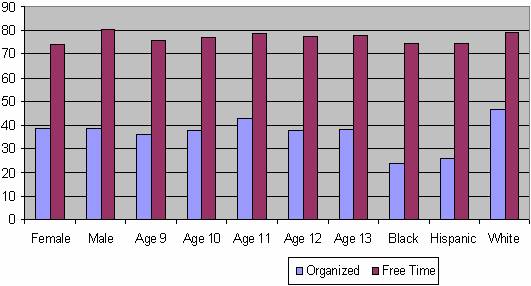
Source: Youth Media Campaign Longitudinal Survey, US 2002
Currently, schools are decreasing the amount of free play or physical activity that children receive during school hours. Only about one-third of elementary children have daily physical education, and less than one-fifth have extracurricular physical activity programs at their schools. Daily enrollment in physical education classes among high school students decreased from 42 percent in 1991 to 25 percent in 1995, subsequently increasing slightly to 28 percent in 2003.41 Outside of school hours, only 39 percent of children ages 9-13 participate in an organized physical activity, although 77 percent engage in free-time physical activity (Figure 6).42
Physical Environment
Experts have increasingly looked to the physical environment as a driver in the rapid increase of obesity in the United States.43 In urban and suburban areas, the developed environment can create obstacles to being physically active. In urban areas, space for outdoor recreation can be scarce, preventing kids from having a protected place to play; neighborhood crime, unattended dogs, or lack of street lighting may also inhibit children from being able to walk safely outdoors; and busy traffic can impede commuters from walking or biking to work as a means of daily exercise. Though few studies are available on the direct effects of the physical environment on physical activity, there are signs of the potential for improvement, evidenced by Torontos 23 percent increase in bicycle use after the addition of bike lanes, and Londons footpath use increase within the range of 34-101 percent (depending on location) as a result of improved lighting.44,45 There has been less research on the relationship between the physical environment and physical activity for children than for adults, however the findings for children appear to be consistent with those of the adult population.46 The percentage of trips to school that children walked declined from 20 percent in 1977 to 12 percent in 2001.47 Because children spend a substantial amount of time traveling to and from school, this may be an area in which to incorporate and increase physical activity into childrens daily habits.48 Additionally, in-school environments have an impact on childrens health. In a study of available school environments such as courts, fields and nets for physical activity in middle schools, environmental characteristics including the area type and size, supervision, temperature and organized activities explained 42 percent of the variance in the proportion of girls who were physically active and 59 percent of the variance in boys.49
In suburban areas, the evolution of sprawl can prevent residents from walking or biking and contributes to the great dependence on rising vehicle use.50 Suburban residents frequently lack adequate resources for physical recreation or sidewalks.51 In the first national study to establish a direct association between the form of the community and the health of the people who live there, analysts from Smart Growth America and the Centers for Disease Control and Prevention (CDC) found that sprawl appears to have direct relationships to BMI and obesity.52 In the study, 488 counties were assigned a sprawl index value, which ranged from 63 for the most sprawling county to 352 for the least sprawling county; the results showed that for a 50-point decrease in sprawl index value, the average BMI rose 0.17 points.53 Results also indicate that at the extremes, residents of the highest sprawling areas are likely to weigh six pounds more, on average, than residents of the most compact areas.54 Researchers reported that people in high sprawl counties were likely to weigh more, walk less, and have a higher prevalence of hypertension.55 Analysts agree that further research is required to determine direct causality between sprawl and health problems such as obesity, overweight, and hypertension.
Socio-Economic Status and Race/Ethnicity
Among adults, a negative relationship between socioeconomic status (SES) (e.g., parental income, parental education, occupation status) and being overweight or obese has been well established, however, the relationship appears weaker and less consistent in children.56,57,58,59 A number of studies find that SES is negatively associated with children being overweight or obese.60 It appears likely that the relationship between SES and obesity varies by race/ethnicity, such that the negative relationship is only apparent among White adolescents and is not apparent among Black or Mexican-American (and presumably other Latino) adolescents.61 In other words, Black and Latino children from families with higher socioeconomic status are no less likely to be overweight or obese than those in families with lower socioeconomic status. Despite the more pronounced impact of SES among White children, they are substantially less likely to be overweight or obese than Black, Latino, or Native American children, who are disproportionately affected by obesity.62,63 In 1998, 21.5 percent of Black children and 21.8 percent of Latino children were overweight, while 12.3 percent of White children were.64 In a 2003 regional survey in the Aberdeen area, American Indian boys ages 5-17 years old had a prevalence of overweight at 22 percent and 18 percent for girls for the same age group.65 Furthermore, the prevalence at which obesity has been increasing in children in the recent years has been even more pronounced and rapid among minority children: between 1986 and 1998, obesity prevalence among African Americans and Hispanics increased 120 percent, as compared to a 50 percent increase among non-Hispanic Whites.66,67
Findings from studies suggest that the effects of race/ethnicity and SES on the prevalence of childhood obesity cannot be individually determined because they are collinear. Therefore evidence is often inconsistent as a result of the difficulty of separating the overlapping factors.68 Furthermore, the relationship among race/ethnicity, SES, and childhood obesity may result from a number of underlying causes, including less healthy eating patterns (e.g., eating fewer fruits and vegetables, more saturated fats), engaging in less physical activity, more sedentary behavior, and cultural attitudes about body weight.69 Clearly these factors tend to co-occur and are likely to contribute jointly to differentials in increased risk of obesity in children.
Parental Influences
Numerous parental influences shape the eating habits of youth including; the choice of an infant feeding method, the foods they make available and accessible, the amount of time children are left unsupervised and their eating interactions with others in the social context. Several studies suggest that breastfeeding offers a small but consistent protective effect against obesity in children.70 This effect is most pronounced in early childhood. It has been hypothesized that exposure to complex sugars and fats contained in bottle formula influence obesogenic factors in infants, which predispose them to weight gain later on in life.71 A recent study postulated that breastfeeding may promote healthier eating habits because breastfed infants may eat until satiated, whereas bottle fed babies may be encouraged to eat until they have consumed all of the formula. Breast feeding also may expose babies to more variability in terms of nutrition and tastes since formula fed infants have experience with only a single flavor, whereas breastfed infants are exposed to a variety of flavors from the maternal diet that are transmitted through the milk.72 Research indicates that the perception of flavors in mothers milk is one of the human infants earliest sensory experiences, and there is support for the idea that early experience with flavors has an effect on milk intake and the subsequent acceptance of a variety of foods73.
Studies suggest that parental food preferences directly influence and shape those of their children. In a study by Oliveria and colleagues, they reported that parents who ate diets high in saturated fats also had children that ate diets high in saturated fats.74 It is suspected that this observation is not merely due to the foods parents feed their children, but rather due to the preferences children develop through exposure to foods that their parents prefer early in their lives. Birch and Fisher posit that exposure to fruits and vegetables and foods high in energy, sugar and fat may play an important role in establishing a hierarchy of food preferences and selection in kids.75 Other studies have confirmed that availability and accessibility of fruits and vegetables was positively related to fruit and vegetable preferences and consumption by school children.76
Additionally, child-feeding practices that control what and how much children eat can also affect their food preferences. Studies have determined that parents who attempt to encourage the consumption of food(s) may inadvertently cause children to dislike the food(s). Whereas parents that attempt to limit food(s) may actually promote increased preference and consumption of the limited food(s) in children.77,78
Researchers also indicate that the social context in which a child is introduced to or has experiences with food is instrumental in shaping food preferences because the eating environment serves as a model for the developing child.79 For many children, eating is a social event that often times occurs in the presence of parents, other adults, older siblings and peers. In these contexts, children observe the behaviors and preferences of others around them. These role models have been found to have an influential effect on future food selection, especially when the model is similar to the child, or perceived as being powerful as in the case of older peers.80,81,82
Over the last three decades there has been an increase in the number of dual income families as more women have entered the workforce and there has been an increase in the number of women serving as the sole supporter for their families.83 It has been hypothesized that increased rates and hours of parental employment may be correlated with the weight increases in American children (particularly for women because they still bear the bulk of the responsibility of caring for children). Studies have demonstrated that children in single-parent families are more likely to be overweight or obese than children in two-parent families and that the rise in women working outside the home coincides with the rise in childhood weight problems.84,85 Several potential mechanisms have been proposed to explain this phenomenon including the following:
- Constraints on parents time potentially contribute to childrens weight problems, as working parents probably rely more heavily than non-working parents on prepared, processed, and fast foods, which generally have high calorie, high fat, and low nutritional content.
- Children left unsupervised after school may make poor nutritional choices and engage in more sedentary activities.
- Child care providers may not offer as many opportunities for physical activity and may offer less nutritious food alternatives.
- Unsupervised children may spend a great deal of time indoors, perhaps due to safety concerns, watching TV or playing video games rather than engaging in more active outdoor pursuits.86
In short, the recent social and economic changes in American society have encouraged the consumption of excess energy and have had a detrimental effect on energy expenditure among youth. These changes have impacted the foods available in the homes, the degree of influence parents have when children make food selections and has led to increases in sedentary behaviors among youth.
Genetics
There is an abundance of evidence that supports genetic susceptibility as an important risk factor for obesity. Evidence from twin, adoption and family studies strongly suggests that biological relatives exhibit similarities in maintenance of body weight, and that heredity contributes between five and 40 percent of the risk for obesity.87,88,89 Other studies indicate that 50-70 percent of a persons BMI and degree of adiposity (fatness) is determined by genetic influences and that there is a 75 percent chance that a child will be overweight if both parents are obese, and a 25-50 percent chance if just one parent is obese.90,91,92
Though this relationship is well established, the role of genetics in obesity is complex. While over 250 obesity-associated genes have been identified, there is no one smoking gun.93 Cases of monogenic obesity and related syndromes do exist, but they are extremely rare and only account for a small number of those who are overweight and obese. To date only six single gene specific defects that result in obesity have been found, and appear to affect fewer than 150 people.94 Genetic susceptibility to obesity in most cases is due to multiple genes that interact with environmental and behavioral factors. Simply having a genetic predisposition to obesity does not guarantee that an individual will develop the disease.
It must also be noted that the recent increases in weight observed in the American population are not correlated with genetics. Despite the strong influence that genetics has on obesity, the genetic composition of a population does not change rapidly, and moreover, the characteristics of the American population have not dramatically changed. Therefore, increases in the incidence and prevalence rates of obesity in the US are likely due to behavioral or environmental factors, which have interacted with genes, and not the effects of genetics alone.
Advertising and Marketing
There has been considerable debate over whether exposure to food advertising affects incidence rates of childhood obesity. While the positive correlation between the hours of television viewed, body mass index, and obesity incidence has been documented, the exact mechanisms through which this occurs are still being investigated. It has been estimated that the average child currently views more than 40,000 commercials on television each year, a sharp increase from 20,000 in the 1970s.95 Moreover, an accumulated body of research reveals that more than 50 percent of television advertisements directed at children promote foods and beverages such as candy, convenience foods, snack foods, sugar sweetened beverages and sweetened breakfast cereals that are high in calories and fat and low in fiber and nutrient density.96 The statistics on food advertising to children indicate that:
- Annual sales of foods and beverages to young consumers exceeded $27 billion in 2002.97
- Food and beverage advertisers collectively spend $10 to $12 billion annually to reach children and youth: more than $1 billion is spent on media advertising to children (primarily on television); more than $4.5 billion is spent on youth-targeted public relations; and $3 billion is spent on packaging designed for children.98,99
- Fast food outlets spend $3 billion in television ads targeted to children.100
A growing body of research suggests that there may be a link between exposure to food advertising and the increasing rates of obesity among youth. In the 1970s and 1980s a number of experimental studies were conducted that demonstrated young children (under age eight) were much more likely than older children to believe that television advertisements were telling the truth; and that exposure to television advertisements influenced the food choices among children (enticing them to choose more sugary foods instead of natural options) which increased requests to parents for high sugar foods they saw advertised.101,102,103,104 Though many of these studies did find significant correlations between advertising and behavioral change, the reliability of these findings are equivocal because many of the studies use small sample sizes, and some of them are more than 25 years old.
A recent literature review by Kaiser Family Foundation highlighted a number of studies that suggested that advertising influenced dietary and other food choices in children, which likely contributed to energy imbalance and weight gain105. One study found that among children as young as three, the amount of weekly television viewing was significantly related to their caloric intake as well as requests and parental purchases of specific foods they saw advertised on television. Several other studies found that the amount of time children spent watching TV was correlated with how often they requested products at the grocery store and their product and brand preferences.
In 2003, Gerald Hastings of the University of Strathclyde in the United Kingdom (UK), conducted a review of the available literature on advertising and obesity to test the relationship between advertising to children and obesity.106 After reviewing more than 30,000 articles, only 120 were determined to be most relevant. Based on these articles, Hastings reported qualified findings that advertising to children does in fact have an adverse effect on food preferences, purchasing behavior and consumption. However, these findings must be weighed against the fact that the strongest and most cited study in the review does not fully support this notion. The study investigated the impact of commercials on 262 children in Ohio, and yielded a statistically significant relationship between a childs exposure to advertising and the number of snacks eaten.107 However, though the commercial exposure did reduce childrens nutrition efficiency (quality of nutrition), it only explained two percent of the change in nutrient intake and had no direct effect on caloric intake.
Since Hastings, more research has been published that supports his conclusion. A notable example from the UK by Halford et al. studied 42 elementary-school aged children and found that lean, overweight and obese children who watched television programs with snack food advertising were more likely to choose high fat savory food options than lower fat sweet options. They also ate a greater volume of food than their similar weight peers in a non-advertisement control group.108 The study also found that weight status modified the ability to recall advertised products among a list of similar products (where more obese children displayed greater recall). The authors suggest that these results support the notion that exposure to food advertising on television can affect eating behavior, stimulating energy intake from a range of advertised foods and exaggerating unhealthy choices in foods. They also proffer that the observed association between remembering food ads and eating more indicates that a susceptibility to food cues could potentially contribute to overeating and promotes weight gain in children.
Those who discount the idea that advertising is a factor in childhood obesity cite the limited research findings, question the methodological validity of much of the available literature and look to observational outcomes of policy changes in Canada and Sweden. In 1980, Quebec banned all food advertising to children, however the rates of obesity for children in Quebec are currently no different from those in other Canadian Provinces. A similar ban on advertising has existed in Sweden for over a decade, and also has not resulted in reductions of obesity rates.109 Though these observations undermine the conclusions of the Hastings review and others, no definitive answers are apparent. In order to close the loop on the causal pathway between food advertising and childhood obesity, many questions need to be answered using longitudinal studies designed with a sufficient statistical power.
Conclusion
The excess intake of calories above the daily expenditure of energy leads to weight gain and can eventually lead to obesity. The main components of this equation are energy intake (diet) and energy expenditure (physical activity, metabolic rate, etc.). The nutrition and physical activity habits of U.S. children have been changing over the past 40 years. Research shows some correlation of these changes to the increases in obesity levels in children. The physical environment, socio-economic status and race/ethnicity, family structure, genetics, and advertising may also influence diet and levels of physical activity among American youth.
Available research shows that there are a number of root causes of obesity in children. Selecting one or two main causes or essential factors is next to impossible given the current data, because the potential influences of obesity are multiple and intertwined. There are large gaps in knowledge, limiting the ability to pinpoint a particular cause and determine the most effective ways to combat childhood obesity. Another research gap stems from lack of a prospective longitudinal study that links dietary and other behavior patterns to development of obesity. Another complication of current data is that there is a need for more precise and reliable measures of dietary intake and activity levels, as individual recall of events and diet are not the most dependable sources for information.
When thinking about early prevention of obesity, it is essential that more is understood about how genetics is involved and how the genes are triggered or react to environmental changes and stimuli. Additionally, research is only beginning to explain how taste preferences develop, their biochemical underpinnings and how this information may be useful in curbing childhood weight gain.
Primary prevention is not an option for many children who are already overweight. Research on successful interventions for children who are overweight or at risk of becoming overweight is extremely important to effectively reduce childhood obesity in this country. Overall, research has just begun to scratch the surface in elucidating the causes of obesity in children. Filling in the knowledge gaps will take time, as implementing some of the study designs that will best illuminate the complex interactions are time consuming and costly. However the fundamentals are clear, to stay healthy, eat a balanced diet and devote adequate time to physical activity.110
1 Childhood is defined for the purposes of this paper as 6-19 years of age
2 Overweight and obesity are used interchangeably and are defined as a BMI on or above the 95th percentile for gender and age (BMI-for-age). Downloaded from: http://www.cdc.gov/nccdphp/dnpa/bmi/bmi-for-age.htm Accessed: Feb. 2005. These terms have different connotations for adults.
3 National Center for Health Statistics. Prevalence of Overweight Among Children and Adolescents: United States, 1999-2002 Downloaded from: http://www.cdc.gov/nchs/products/pubs/pubd/hestats/overwght99.htm Accessed: Feb. 2005.
4 ibid
5 ibid
6 At risk for overweight is considered a BMI-for-age between the 85th and 95th percentiles.
7 National Center for Health Statistics. Obesity Still a Major Problem, New Data Show. Downloaded from: http://www.cdc.gov/nchs/pressroom/04facts/obesity.htm Accessed: Feb. 2005.
8 Jackson, Yvonne. (1993) Height, weight, and body mass index of American Indian schoolchildren, 1990-1991. Journal of the American Dietetic Association. 93(10) 1136-1140.
9 Centers for Disease Control and Prevention. National diabetes fact sheet: general information and national estimates on diabetes in the United States, 2003. Rev ed. Atlanta, GA: U.S. Department of Health and Human Services, Centers for Disease Control and Prevention, 2004.
10 Centers for Disease Control and Prevention. Preventing Obesity and Chronic Diseases Through Good Nutrition and Physical Activity Downloaded from: http://www.cdc.gov/nccdphp/pe_factsheets/pe_pa.htm Accessed: Feb. 2005
11 Torgan, C. (2002). Childhood obesity on the rise. The NIH Word on Health. Downloaded from: http://www.nih.gov/news/WordonHealth/jun2002/childhoodobesity.htm Accessed: Feb. 2005.
12 Centers for Disease Control and Prevention. Overweight and Obesity Health Consequences. Downloaded from: http://www.cdc.gov/nccdphp/dnpa/obesity/consequences.htm Accessed: Feb. 2005
13 CDC, Preventing Obesity and Chronic Diseases, op. cit.
14 Co-linearity occurs when some or all of the independent variables (the variables believed to influence an outcome measure) in a regression model are so highly correlated that it is impossible to come up with reliable estimates of their individual impact on the outcome.
15 Livingstone MBE and Black AE Markers of the validity and reported energy intake, Journal of Nutrition (supplement) 2003; 895S 920S.
16 In the comparison of the 1977-78 and 1994-96 studies, a number of methodological changes should be noted. The earlier studies sampled only the 48 contiguous states (later studies included all 50 states), included 3 days of dietary records (the later study only included 2 days), and asked the parents about dietary intake (later studies asked the children, with assistance from adults).
17 Lin BH, Guthrie J, Frazao E. 1999b. Quality of childrens diets at and away from home: 1994-96. Food Review 2-10.
18 Enns CW, Mickle SJ, Goldman JD. 2002. Trends in food and nutrient intakes by children in the United States. Family Economics and Nutrition Review 14(2):56-58.
19 Enns CW, Mickle SJ, Goldman JD. 2003. Trends in food and nutrient intakes by adolescents in the United States. Family Economics and Nutrition Review 15(2):15-27.
20 Jahns L, Siega-Riz AM, Popkin BM. 2001. The increasing prevalence of snacking among US children from 1977 to 1996. Journal of Pediatrics 138(4):493-498.
21 Nielsen SJ, Popkin BM. 2003. Patterns and trends in food portion sizes, 1977-1998. Journal of the American Medical Association 289(4):450-453.
22 Centers for Disease Control and Prevention. (2004). Physical activity and good nutrition essential elements to preventing chronic disease and obesity. Downloaded from: http://www.cdc.gov/nccdphp/aag/pdf/aag_dnpa2004.pdf Accessed: Feb. 2005.
23 Cavadini C, Siega-Riz AM, Popkin BM. 2000. US adolescent food intake trends from 1965 to 1996. Archives of Diseases in Children 83(1):18-24.
24 USDA (U.S. Department of Agriculture). 2000. Pyramid Servings Intakes by U.S. Children and Adults: 1994-96, 1998. Agricultural Research Service, Community Nutrition Research Group. Table Set No. 1.
25 Gleason P, Suitor C. 2001. Childrens Diets in the Mid-1990s: Dietary Intake and Its Relationship with School Meal Participation. Alexandria, VA: U.S. Department of Agriculture. Report No. CN-01-CD1.
26 Guthrie JF, Morton JF. 2000. Food sources of added sweeteners in the diets of Americans. Journal of the American Dietetic Association 100(1):43-51.
27 French SA, Lin BH, Guthrie JF. 2003. National trends in soft drink consumption among children and adolescents age 6 to 17 years: Prevalence, amounts, and sources, 1977/78 to 1994/1998. Journal of the American Dietetic Association 103(10):1326-1331.
28 Fox MK, Pac S, Devaney B, Jankowski L. 2004. Feeding Infants and Toddlers Study: What foods are infants and toddlers eating? Journal of the American Dietetic Association 104(1, Supplement 1):S22-S30.
29 French SA, Story M, Jeffery RW. 2001. Environmental influences on eating and physical activity. Annual Review of Public Health 22:309-335.
30 Ibid.
31 Cavadini C, Siega-Riz AM, Popkin BM. 2000. US adolescent food intake trends from 1965 to 1996. Archives of Diseases in Children 83(1):18-24.
32 Alexy U, et al. Pattern of long-term fat intake and BMI during childhood and adolescenceresults from the DONALD Study, International Journal of Obesity 2004; 28: 1203-9..
33 Sugimori H, et al. Analysis of factors that influence body mass index from ages 3 to 6 yearsa study based on the Toyama Cohort Study, Pediatrics International 2004; 46: 302-10
34 Nicklas TA et al. Childrens meal patterns have changed over a 21-year period: the Bogalusa Heart Study Journal of the American Dietetic Association 2004 May;104(5):753-61.
35 Lin, B-H and Morrison, RM. Higher fruit consumption linked with lower Body Mass Index, USDA Economic Research Service Food Review Winter 2002; 25(3): 28-32.
36 IOM, Preventing Childhood Obesity: Life in the Balance, 2004
37 Pate RR, Reedson PS, Sallis JF, Tayor WC, Sirard J, Trost SG, Dowda M. (2002) Compliance with physical activity guidelines: prevalence in a population of children and youth. Annals of Epidemiology. 12 (5), 303-308.
38 Robinson, T. N. (2001). Television viewing and childhood obesity. Pediatric clinics of North America, 48(4), 1017-1025.
39 Torgan, op.cit
40 Ashlesha Datar, Roland Sturm. Physical Education in Elementary School and Body Mass Index: Evidence from the Early Childhood Longitudinal Study. American Journal of Public Health. 2004; 94 (9): 1501-1506.
41 YRBSS Fact Sheet: Physical Activity. Found at: http://www.cdc.gov/HealthyYouth/yrbs/pdfs/trends-pa.pdf
42 CDC. (2003). Physical Activity Levels Among Children Aged 9-13 Years --United States. MMWR 52(33), 785-788.
43 J.O. Hill, J. C. Peters, Science. 280. 1371 (1998).; S. A. French, M. Story, R. W. Jeffery. Ann. Rev. Pub. Health 22, 63 (2001).
44 Macbeth AG. 1999. Bicycle lanes in Toronto. ITE Journal 69:38-40, 42, 44, 46.
45 Painter K. 1996. The influence of street lighting improvements on crime, fear, and pedestrian street use, after dark. Landsc Urban Plan. 35:193-201.
46 IOM (Institute of Medicine). 2005. Preventing Childhood Obesity: Health in the Balance. Washington, DC: National Academy Press.
47 Sturm R. 2005b (in press). Childhood obesity What can we learn from existing data on social trends? Part 2. Preventing Chronic Disease.
48 IOM (Institute of Medicine). 2005. Preventing Childhood Obesity: Health in the Balance. Washington, DC: National Academy Press.
49 Sallis J, Conway T, Prochaska J, McKenzie T, et al. The Association of School Environments with Youth Physical Activity. American Journal of Public Health. 2001; 91, 4: 618-620
50 Ewing R, Schmid T, Killingsworth R, Zlot A, Raudenbush S. Relationship Between Urban Sprawl and Physical Activity, Obesity, and Morbidity. The Science of Health Promotion. 2003 Sept/Oct, Vol 18, No 1. 47-57.
51 Environmental Health Perspectives, Vol 112, No 11 Aug 2004, Downloaded from: http://ehp.niehs.nih.gov/docs/allpubs.html Accessed: Feb. 2005
52 Ewing (2003), Relationship Between Urban, op. cit
53 McCann B, Ewing R. 2003. Measuring the Health Effects of Sprawl. Smart Growth America Surface Transportation Policy Project. Downloaded from: www.smartgrowthamerica.org. Accessed: Feb. 2005.
54 Ibid.
55 Ibid.
56 Sobal, J. & Stunkard, A.J. (1989). Socioeconomic status and obesity: A review of the literature. Psychological Bulletin, 105, 260-275.
57 Ibid.
58 Strauss, R.S. & Knight, J. (1999). Influence of the home environment on the development of obesity in children. Pediatrics, 101 (6).
59 National Center for Health Statistics (1998). Health, United States with socioeconomic status and health chartbook. Hyattsville, MD.; Berkowitz, R.I. & Stunkard, A.J. (2002). Development of childhood obesity. In Wadden, & Stunkard (ed). Handbook of obesity treatment (pp. 515-531).
60 Sobal, J. & Stunkard, A.J. (1989).; Strauss, R.S. & Knight, J. (1999). Influence of the home environment on the development of obesity in children. Pediatrics, 101 (6); National Center for Health Statistics (1998). Health, United States with socioeconomic status and health chartbook. Hyattsville, MD.; Berkowitz, R.I. & Stunkard, A.J. (2002). Development of childhood obesity. In Wadden, & Stunkard (ed). Handbook of obesity treatment (pp. 515-531).
61 Troiano, R.P. & Flegal, K.M. (1998). Overweight children and adolescents: Description, epidemiology, and demographics. Pediatrics, 101 (3), 497-504.
62 Crawford, Story, Wang, Ritchie & Sabry (2001). Ethnic issues in the epidemiology of childhood obesity. Pediatric Clinics of North America, 48 (4), 855-878.
63 Strauss & Pollack (2001). Epidemic increase in childhood overweight, 1986-1998. Journal of the American Medical Association, 286 (22), 2845-2848.
64 Ibid.
65 Zephier E, Himes JH, Story M. Prevalence of overweight and obesity in American Indian school children and adolescents in the Aberdeen area: A population study. (1999) International Journal of Obesity. 23, S28-S30.
66 Strauss (2001) op. cit.
67 ibid.
68 Troiano, R.P. & Flegal, K.M. (1998). Overweight children and adolescents: Description, epidemiology, and demographics. Pediatrics, 101 (3), 497-504.
69 Strauss, R.S. & Knight, J. (1999). Influence of the home environment on the development of obesity in children. Pediatrics, 101 (6).
70 Arenz S, Rucker R, and von Kries R. Breast feeding and childhood obesitya systematic review. International Journal of Obesity 2004; 28: 1247-1256.
71 Yajnik, CS. The lifecycle effects of nutrition and body size on adult adiposity, diabetes and cardiovascular disease. Obesity Reviews 2002; 3: 217-224.
72 Bonuck, K et.al. Is late bottle-weaning associated with overweight in young children? Analysis of NHANES III data. Clinical Pediatrics (Philadelphia) Jul.-Aug. 2004; 43(6): 535-40.
73 Sullivan, S., Birch, L. Infant dietary experience and acceptance of solid foods. Pediatrics. 93:271-277; 1993.
74 Oliveria, S. et al. Parent-child relationships in nutrient intake: the Framingham childrens study. American Journal of Clinical Nutrition. 56:593-598;1992.
75 Birch, L., Fisher, J. Development of eating behaviors among children and adolescents. Pediatrics. 101:539-549;1998.
76 Hearn, M., Baranowski, T., and Baranowski, J. et al. Environmental influences on dietary behavior among children: Availability and accessibility of fruits and vegetables enable consumption. Journal of Health Education. 1998.
77 Birch, L., Fisher, J. Op cit.
78 Fisher, J., Birch, L. 3-5 Year-old childrens fat preferences in consumption are related to parental adiposity. Journal of the American Dietetic Assn. 95:759-764; 1995.
79 Birch, L., Fisher, J. Op Cit.
80 Birch, LL. Effects of peer models food choices and eating behaviors on preschoolers food preferences. Child Development. 51: 489-496; 1980.
81 Birch, LL. The relationship between childrens food preferences and those of their parents. Journal of Nutrition Education. 12:14-18, 1980.
82 Duncker, K. Experimental modification of childrens food preferences through social suggestion. Journal of Abnormal Social Psychology.33:490-507, 1983.
83 Sado, S., Bayer, A. The Changing American Family. Downloaded from the Population Resource Centers website: http://www.prcdc.org/summaries/family/family.html. Accessed April, 2004.
84 Ibid.
85 United States Census Bureau. 2000. Statistical Abstract of the United States 2000. Washington, DC: Government Printing Office.
86 Anderson, P., Butcher, K., and Levine, P. (2003). Maternal Employment and Overweight Children. Journal of Health Economics, 22, 477-504.
87 Center for Disease Control. Factors Contributing to Obesity. Downloaded from: www.cdc.gov/nccdphp/dnpa/obesity/contributing_factors.htm. Accessed: Jan. 2005.
88 Bouchard, C., Perusse, L. Genetic Aspects of Obesity. Annals of the New York Academy of Sciences. 699:26-35;1993
89 Bouchard, C., Perusse, L., Rice, T., Rao, D. 2003. Genetics of Human Obesity. In: Bray, G.A, Bouchard, C. Eds. Handbook of Obesity Etiology and Pathophysiology. 2nd Edition. New York: Marcel Dekker.
90 Skelton, J. Childhood Obesity: Overview. Downloaded from: www.meadjohnson.com/professional/newsletters/0300app/0300a3.html. Accessed: Jan. 2005.
91 Ibid.
92 In adults, Overweight is defined as a BMI (Body Mass Index) score of 25-29.9 and Obese is defined as a BMI score of 30 or greater. To calculate your BMI, go to: http://www.cdc.gov/nccdphp/dnpa/bmi/calc-bmi.htm
93 Skelton op cit.n
94 Jeffrey P. Koplan, Catharyn T. Liverman, and Vivica A. Kraak, Editors, Committee on Prevention of Obesity in Children and Youth. 2004. Preventing Childhood Obesity: Health in the Balance. Washington, DC: National Academies Press.
95 Kunkel, D. 2002 Children and Television Advertising, Handbook of Children and the Media. Eds. Singer, D., and Singer, J. Thousand Oaks, CA: Sage Publications.
96 Kaiser Family Foundation. (2004) The Role of Media in Childhood Obesity. Downloaded from: http://www.kff.org/entmedia/entmedia022404pkg.cfm. Accessed: January 2005
97 US Market for Kids Foods and Beverages, 2003. Kids LifestylesUS [Online] Downloaded from: http://www.marketresearch.com/researchindex/849192.html#pagetop. Accessed: Feb. 2005.
98 Brownell, K. 2004. Food Fight: The Inside Story of the Food Industry, Americas Obesity Crisis, and What We Can Do About it. New York, NY: MacGraw-Hill.
99 McNeal, J. 1999. The Kids Market: Myths and Realities. Ithaca, NY: Paramount Marketing Publishing.
100 Schosser, E. 2002. Fast Food Nation. New York, NY: Perennial Publishing.
101 Brody, G., Stoneman, Z., Lane, T.S., and Sanders, A. Television Food Commercials Aimed at Children, Family Grocery Shopping and Mother-Child Interactions. Family Relations. 30:435-439;1981.
102 Clancy-Hepburn, K., Hickey, K. and Nevill, G. Childrens Behaviour Responses to TV Food Advertisements. Journal of Nutrition Education. 63:93-95.
103 Woodward, D., Cumming, F., Ball, P., Williams, H., Hornsby, H., and Boon, J. Does Television Affect Teenagers Food Choices? Journal of Human Nutrition and Dietetics. 10:229-235:1997.
104 Ward, S., Wackman, D. Childrens Purchase Influence Attempts and Parental Yielding. Journal of Market Research. 9:316-321; 1972.
105 Kaiser op.cit.
106 Hastings, G., Stead, M., and McDermott, L. Review of Research on the Effects of Food Promotion to Children. Glasgow: University of Strathclyde Centre for Social Medicine., 2003. Downloaded from www.foodstandards.gov.uk/healtheireating/promotion/readreview
107 Bolton, R. Modeling the Impact of Television Food Advertising on Childrens Diets. In: Leigh, JH; Martin, CR jr. eds, Current Issues and Research on Advertising. Ann Arbor, MI; Division of Research Graduate School of Business Administration. University of Michigan, 1983.
108 Halford, J., Gillespie, J., Brown, V., Pontin, E., and Dovey, T. Effect of Television Advertisements for Foods on Food Consumption in Children. Appetite. 42:221-225;2004.
109 Ashton, D. Food Advertising and Childhood Obesity. Journal of the Royal Society of Medicine. 97(2): 51-52;2004.
110 See US Dietary Guidelines at: http://www.health.gov/dietaryguidelines/dga2005/document/pdf/dga2005.pdf