
Message from the Assistant Secretary
The feature article, “Estimates of the Uninsured: Considerations for Policy Makers,” is a prime example of the important intersection between data and policy. Historically, policy makers have struggled with the fact that the numerous data sources used to calculate the number of uninsured Americans often yield quite different estimates. This article describes work that ASPE is performing in an attempt to reconcile these disparate estimates. This issue also includes an article analyzing several fundamental weaknesses in Federal foster care financing. This ASPE analysis has significantly informed the debate around this issue and was recently used as the basis for Congressional testimony. Our third article describes some of the experiences, both positive and negative, that community health centers are having as they increasingly invest in Health Information Technology. Finally, we present an overview and analysis of the effort to implement parity in the FEHB program for mental health and substance abuse services. I hope that you enjoy reading about these fascinating research findings. They represent a sample of the broad portfolio of research and analysis ASPE develops to inform policy making across the breadth of issues confronting HHS. Michael J. O’Grady, Ph.D. U.S. Department of Health |
 Welcome to the second issue of the ASPE Highlighter. Once again, we are presenting findings from ASPE-supported research on a cross-section of interesting and important policy topics. This research contributes to our understanding of the number of uninsured in America; illustrates flaws in Federal foster care financing; documents the response of community health centers to the new wave of health information technology; and, finally, assesses the impact of mental health and substance abuse parity in the Federal Employees Health Benefits (FEHB) Program.
Health Information Technology and the Health Care Safety Net: HIT Adoption in Community Health Centers
The widespread adoption of interoperable health information technology in the U.S. has the potential to improve the quality and effectiveness of health care, protect and promote public health, and strengthen the nation’s public health preparedness. As a result, a number of efforts are underway within the public and private sectors to promote and accelerate the widespread adoption of interoperable health information technology. Based on a literature review, discussions with key experts, and case studies, this study describes some of the experiences and challenges faced by selected community health centers in adopting and using health information technology and network applications.
OVERVIEW
Many experts believe that the widespread adoption of interoperable health information technology in the U.S. has the potential to improve the quality and effectiveness of health care, protect and promote public health, and strengthen the nation’s public health preparedness. As a result, a number of efforts are underway within the public and private sectors to promote and accelerate the widespread adoption of interoperable health information technology in health care, including a secure and confidential framework for seamless information sharing. While a growing literature is becoming available concerning HIT benefits, costs, and implementation in various market segments of private health care plans and providers, relatively little is known about the experience of public sector community health care organizations, including safety net providers. Based on a literature review, discussions with key experts, and seven case studies, this study describes some of the experiences and challenges that community health centers have faced in adopting health information networks.
CONTEXT AND METHODS
The Office of the Assistant Secretary for Planning and Evaluation (ASPE) contracted with NORC to conduct an assessment of health information technology (health IT) adoption and use in selected community health centers funded under Section 330 of the Public Health Service Act with a focus on health center networks that were leaders in IT adoption. Project activities were divided into two phases: an environmental scan (literature review with thought leader discussions) and case studies of seven sites around the U.S. Case studies involved discussions with over 120 stakeholders at 38 health centers and seven Federally-supported health center networks. Discussions explored the current state of health center and network health IT activities as well as the sustainability and replicability of various approaches to health IT adoption. Sites selected were Oregon, Virginia, New Hampshire, Florida, SE Kentucky, Boston, MA, and Philadelphia, PA.
HEALTH CENTER-LEVEL FINDINGS
Health center experiences exhibited diverse but successful approaches to health IT. Interviews revealed that health centers are increasingly developing strategic plans to guide health IT investments and that these investments have been growing substantially in recent years. Access to adequate hardware and core software is widespread, with the majority of health centers in the study relying heavily on health center networks to provide leadership in the area of systems procurement and management¹.
Major uses of health IT include practice management systems, which promote financial stability and efficiencies, and electronic health records (EHRs), which address quality of care, disease management, patient safety, and practice workflow. Buy-in for adoption of both these technologies is robust among health centers in the study. While overall satisfaction was high, health centers did express specific concerns regarding the cost of and usability of health IT applications, as well as difficulties in procuring and managing software vendors. With practice management systems, health centers indicated that developing custom reports or new billing formats can pose a challenge, while the major challenge with EHR was affording the cost of software licenses.
NETWORK-LEVEL FINDINGS
Health center networks, supported by an array of Federal grant programs, constituted the major focus for each case study. During the 1990s, health care market forces spurred network formation to assist health centers on business issues including billing, purchasing, administrative reporting, and managed care. Over time, these health center-governed networks have increasingly focused on providing IT services. Core network functions typically include convening local stakeholders, directing vendor selections, centralizing IT implementation and support, and administrative management.
Network models differ substantially. Some networks offered health centers access to a common centrally administered application for practice management and/or EHRs, thereby leveraging economies of scale. Other networks have opted for a decentralized approach where they facilitate data analysis and exchange through community-level client tracking programs or data warehouses.
CONCLUSIONS
Findings from this study reflect substantial progress among health centers in adopting health IT to improve administrative and clinical operations, and to validate BPHC-supported health center networks as a primary factor behind much of this improvement. Specific conclusions are elaborated below:
- Network challenges. Although the networks investigated were successful overall, network leadership faces real challenges creating collaboration across diverse health centers. In addition, even though networks are exploring models for self-sufficiency, none of the subject networks indicated that they would be able to sustain their activities without substantial government funding.
- Leadership. Having a highly skilled chief information officer (CIO) at the network or health center level was the key factor for successful health IT adoption. Effective network leadership was able to walk the line between convening, directing, motivating, and building consensus among their health center memberships while providing appropriately targeted services to individual health centers.
- Three levels of costs for EHRs. Health centers implementing EHRs reported benefits in clinical measures and (over time) efficiency, but also reported that the costs for implementation were substantial and the return on investment unclear. In addition to the cost of the software licenses, EHR implementation involves substantial training and design costs up front and sustained costs for leveraging the system for quality benefits.
- Clinician engagement. Significant involvement from clinicians at all phases of an EHR implementation is necessary. Because EHR implementations change clinical work flow in profound ways and must be customized across a number of dimensions to support efficiency as well as improved quality of care and safety, clinical leadership must be involved in making core design decisions at the earliest phases.
- Additional research. The need for further research is demonstrated. For example, federal stakeholders will need information to determine whether to support health center networks that are at the end of their grant cycles, but are not yet able to maintain self-sufficiency. In addition, research will be needed to assist federal officials in determining whether and how to encourage individual health centers to join networks, and in identifying how best to stimulate IT adoption across a diverse array of centers.
1 - This study was prepared for the Office of the Assistant Secretary for Planning and Evaluation and is available on the ASPE website at http://aspe.hhs.gov. For further information, please contact the Project Officer, James Scanlon.
Evaluation of Parity in the
Federal Employees Health Benefits Program
The Office of Personnel Management required all Federal Employees Health Benefits (FEHB) Program carriers to provide mental health and substance abuse coverage that is comparable to traditional health coverage by 2001. Evaluation of the FEHB parity policy found that it was implemented in the context of managed care with little or no significant adverse impact on utilization, spending, or quality, while providing most users of MH/SA care improved financial protection. An independent actuarial analysis of the effects of MH/SA parity estimated a one-percentage point increase in premiums associated with the new policy.
In June 1999, the U.S. Office of Personnel Management (OPM) was directed to achieve mental health and substance abuse (MH/SA) parity in the FEHB program by 2001. The FEHB Program is the largest employer-sponsored health insurance program in the country, serving over eight million Federal employees, their dependents, and retirees. The Program includes about 250 health plans and provides over $29 billion in health care benefits annually. In its 2000 letter to FEHB program carriers, OPM outlined the proposed parity benefit, requiring them to achieve coverage for MH/SA that was identical to traditional medical care with regard to deductibles, coinsurance, copays, and day and visit limitations.
The evaluation of MH/SA parity in the FEHB Program was planned to assess the impact of this policy on utilization and cost. Would increases be within reasonable limits or would increase utilization and cost render MH/SA parity unaffordable? Would implementation of MH/SA parity have an effect on the quality of MH/SA care?
A multifaceted evaluation was undertaken in 2000. Two important questions related to the new parity benefits are:
- How did health care plans implement parity policy, e.g., did they comply, and how did the new benefit affect benefit design and management?
- What was the impact of MH/SA parity on utilization, cost, and quality of MH/SA services?
METHODOLOGY
Evaluation of the implementation of parity policy was conducted by reviewing qualitative data, i.e., MH/SA benefits for all plans on the OPM website and analyzing implementation reports from all FEHB plans with 500 or more enrollees. Site visits to nine selected health care plans were conducted, along with focus groups of providers. Information on the impact on utilization, cost, and quality of MH/SA services before and after parity was quantitatively analyzed. Claims/encounter data from the nine selected FEHB plans were compared to claims from a matched set of non-FEHB group plans. The nine FEHB plans were selected on the basis of geographic location, the breadth of their State parity laws, differences in plan type and structure (e.g., fee-for-service, health maintenance organizations, point of service with a preferred provider option), and size of enrollee population. Approximately 3.2 million persons were enrolled in the nine FEHB plans. The comparison data were matched from private health insurance claims contained in the Medstat Group MarketScan® Benefit Plan Design database. The purpose of the comparison was to determine if changes in utilization and cost of MH/SA services were due to the effects of parity or as part of general trends occurring over the same pre- and post-parity period.
The analytic strategies included descriptive and inferential statistics and differences-in-differences models.
RESULTS
How did the FEHB parity policy affect MH/SA benefit design and management?
All FEHB plans complied with the parity policy. No plan left the FEHB program to avoid implementation. The majority of plans enhanced their MH/SA benefits in the post-parity period consistent with the parity policy; those that did not change were already providing parity benefits.
With the introduction of the parity policy, FEHB plans were more likely to enter into managed care carve-out arrangements with specialty behavioral health care organizations than were comparable non-FEHB plans. While
all plans complied with the parity policy for services offered by in-network providers, no plan extended parity to care delivered by out-of-network providers.
How did the parity policy affect utilization of MH/SA care? How did these changes compare with general trends in MH/SA care?
The probability of utilization of MH/SA services for adults increased slightly post-parity with the increase ranging from 0.38 to 2.99 percentage points across FEHB plans. However, as shown in Figure 1, when compared to matched Medstat plans not under FEHB parity policy, the increase in utilization could not be attributed to the parity policy.
| Figure 1. Probability of Adult MH/SA Service Use from Pre- to Post-Parity: A Comparison of FEHB Plans to Matched Medstat Health Insurance Plans
* p≤0.05 |
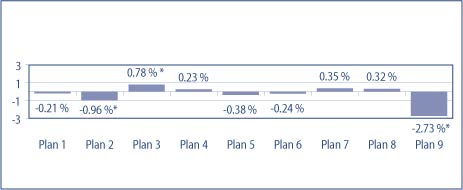
- Three of the nine plans showed a statistically significant difference in probability of use from pre- to post- parity when compared to matched Medstat plans.
- Two of the significantly different plans showed less of an increase in use while only one plan showed a statistically significant greater increase in the probability of use when compared to the matched sample.
How did the parity policy affect cost of MH/SA care? How did these changes compare to secular MH/SA care trends?
The cost of MH/SA services for adults post-parity increased, ranging between 1.06 and 46.87 percentage points across eight FEHB plans, with one plan showing a decrease of 6.44 percentage points. In actual dollars, the post-parity cost of using services increased from a range of about $12.00 to $240.00. One plan’s spending decreased by about $45.00. However, as shown in Figure 2, the probability of spending for the nine FEHB plans was essentially consistent with that for the non-FEHB plans post-parity.
| Figure 2. Estimate of MH/SA Spending per Adult User from
* p≤0.05 |

- No FEHB plan shows a statistically significant increase in spending post-parity when compared to non-FEHB plans.
- Of the four statistically significant differences from the Medstat plans after parity, FEHB spending was less.
A separate analysis showed that in most plans, beneficiary out-of-pocket costs declined:
- Beneficiaries in six of the nine plans experienced decline in out-of-pocket costs for their MH/SA services.
- Increase in out-of-pocket costs to beneficiaries in three of the plans was consistent with the secular trend.
- There was no out-of-pocket cost increase for children’s MH/SA care when secular trends were taken into account.
While only the quantitative results for adults with MH/SA disorders are reported here, the evaluation also analyzed utilization and cost for adults with SA disorders alone, MH disorders alone, and high utilizers of MH/SA services, and for children’s MH/SA services.
Was quality of care affected by the parity policy?
Quality of MH/SA care was evaluated for two tracer conditions—major depressive disorder and substance use disorders. Quality was assessed by comparing claims for type and duration of service with professional treatment standards. Using these criteria on claims from pre- and post-parity, the quality of care for the two conditions was found to be slightly improved or unaffected by the parity policy.
An independent actuarial study of the impact of MH/SA parity on premiums used data on non-Medicare, non-DOD individuals from the FEHB Blue Cross/Blue Shield plans for 1998-2003. The analysis found that MH/SA benefits contributed an additional 0.94 percentage points to total health benefits in 2001. Absent parity, MH/SA benefits should have declined in 2001 as they had been doing in the preceding years. The 0.94 percentage point increase, attributed to MH/SA parity, converts to an equivalent increase in premiums. Therefore, both enrollee premiums and government costs increased nearly one percent.
SUMMARY:
According to the evaluation, all FEHB plans implemented the parity policy, most of them by enhancing their MH/SA benefits. No plans withdrew from the FEHB program to avoid adherence to the policy. The majority of plans reported that they did not incur administrative costs in implementing FEHB parity in 2001. The short-term impact of parity policy in the FEHB Program on utilization, cost and quality of MH/SA services was modest and equivalent to the secular trend. Actuarial analysis also found a modest increase in cost and estimated a one-percentage point rise in enrollee premiums and government costs¹.
1 - This report was prepared by Cille Kennedy, Ph.D., for the office of the Assistant Secretary for Planning and Evaluation, Office of Disability, Aging, and LongTerm Care. For more information on this and related issues, visit the ASPE website: http://aspe.hhs.gov/daltcp/reports/parity.htm.
Estimates of the Uninsured:
Considerations for Policy Makers
The uninsured population consists of various diverse subpopulations. They differ in demographics such as income, employment status, race, and age, as well as in their episodes of being uninsured. Some are uninsured for a few months, others for several years. A college graduate without insurance for a few months before beginning a job is very different from an uninsured fifty-five-year-old with a chronic illness. Priorities and policies must be set with an understanding of the diverse profiles among the uninsured.
Four major federal surveys measure the uninsured. Two are sponsored by the Department of Health and Human Services; the Census Bureau conducts the other two. Disagreement in their estimates creates a tenuous foundation on which to develop policies to help the uninsured. The Current Population Survey (CPS) is the most widely cited of the four surveys. In 2003, the CPS estimated that 45 million Americans were uninsured for the full year, but that figure is much larger than all the other surveys’ estimates. For that reason, some argue that the CPS measures the uninsured at a single point in time, not throughout the year. The Administration, on the other hand, believes that CPS measures the full-year uninsured but undercounts Medicaid enrollees.
| Table 1. Uninsured Estimates from Various National Surveys | ||||
| Survey | Most Recent Year | Method of Estimate | ||
| Uninsured For Full Year | At the Time of the Survey | Uninsured at Any Time During the Year | ||
| Current Population Survey (CPS), Census | 2003 | 45.0 million | N/A | N/A |
| Medical Expenditure Panel Survey (MEPS)*, HHS | 2002 | 32.4 million | 47.3 million | 62.6 million |
| National Health Interview Survey (NHIS), HHS | 2004 | 28.8 million | 42.0 million | 51.4 million |
| Survey of Income and Program Participation (SIPP), Census | 2001 | 18.9 million | 38.7 million** | 66.5 million |
| Notes: *Non-elderly | ||||
HHS has partnered with the Actuarial Research Corporation (ARC) and the Urban Institute to devise two separate models to address CPS’s Medicaid undercount. For 2003, the ARC simulation estimated that more than 9 million people enrolled in Medicaid failed to report it, for a total uninsured population of 36 million. It found close to 9 million non-citizens without insurance, which may make ethnic and racial patterns of insurance particularly useful in developing policy. Another 3.5 million of the uninsured were eligible for Medicaid or SCHIP, but were not enrolled, which reinforces the need for better program outreach. Almost 10 million people without insurance have incomes greater than 300 percent of poverty. More than 5 million are childless adults, some of whom may be uninsured by choice, but others who may be ineligible for public coverage because they have no dependent children, despite an otherwise qualifying need. The Urban Institute model estimated that only 3.6 million of the Medicaid undercount failed to report any coverage and were counted among the uninsured. Other segments of the uninsured population were roughly comparable to ARC’s estimates.
| Table 2. Uninsured Over Time
* Adjusted to smooth the introduction of the 2000 Census weights and the addition of the verification question. The verification question is asked at the end of the insurance questions, and confirms that the individual has no insurance coverage. |
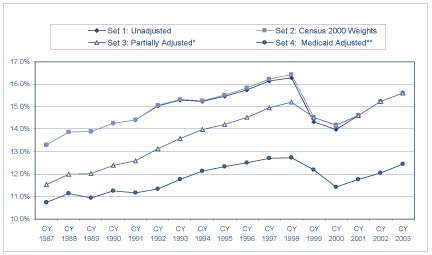
These two particular models, commissioned by the HHS, use differing methods of calculating the size of the Medicaid undercount, and are just an example of two of the many ways that different groups have analyzed CPS data to address the undercount issue. ARC’s model adjusts the survey data to account for changes that have occurred over time as a result of the Census Bureau updating the survey contents and questionnaire format. They make adjustments to the survey weights in order to reflect changes made to the decennial census; to create consistency in the insurance portion of the questionnaire based on modifications implemented in March 1995; to create consistency in the employer-sponsored insurance portion of the questionnaire; and to account for the inclusion of an insurance verification question at the end of the survey. The adjustment for the undercount involves comparing CMS administrative enrollment data with Medicaid reporters on the CPS, and assigning Medicaid to non-reporters who have demographic characteristics similar to those who reported Medicaid.
The Urban Institute takes a different approach in attempting to calculate the size of the Medicaid undercount. Using a micro-simulation model, they use CPS data to simulate eligibility for public insurance. For each person or family in the CPS dataset, the Medicaid module of the model determines eligibility for the program based on citizenship status first, and then applies the Federal and State rules of the program to determine if they are eligible for coverage through any of the eligibility pathways (mandatory, optional, or medically needy). The model assigns eligibility on a month-to-month basis, and individuals are simulated as eligible in some months of the year, but not necessarily all months in order to account for changes in income during the year that would cause someone to lose eligibility and therefore drop off the program. Once the model determines individuals to be eligible, it assigns Medicaid to eligibles in sufficient numbers to match CMS average monthly targets in various eligibility groups by state.
Accurate data on the size and characteristics of the uninsured population must inform policy development. The ARC and Urban Institute models were bipartisan efforts that, while differing on the magnitude of CPS’s Medicaid undercount and the effect of this undercount on the uninsured population, agree on its existence. Even if the uninsured number is actually millions fewer than the CPS-reported 45 million, it remains a significant problem that deserves serious attention.
To further the discussion, upon completion of the commissioned research, HHS hosted a half-day seminar at the American Enterprise Institute (AEI) in April 2005 to examine the variations in the methodologies used to analyze the Medicaid undercount. In addition to presentations on the two HHS-commissioned models, panel participants from Mathematica Policy Research, The University of Minnesota’s State Health Access Data Assistance Center, the US Census Bureau, and the Congressional Research Services participated in a dynamic discussion exploring the issue of the Medicaid undercount and how it affects policy development aimed at covering the uninsured. Included on the panel were Cathi Callahan of ARC and Linda Giannarelli of The Urban Institute, who conducted the research presented on behalf of HHS. Panel discussants included: John Czajka, Mathematica Policy Research; Michael Davern, SHADAC, University of Minnesota; Charles Nelson, US Census Bureau; and Chris L. Peterson, Congressional Research Services¹.
1 - The ARC report can be found on ASPE’s website at http://aspe.hhs.gov/health/reports/05/est-uninsured/index.htm; and the Urban Institute report can be found at http://aspe.hhs.gov/health/reports/05/est-uninsured/index.htm.
ASSESSING AND ADDRESSING FUNDAMENTAL
FLAWS IN FEDERAL FOSTER CARE FINANCING
Federal foster care financing has failed to meet the current needs of a changing child welfare field. A recent Issue Brief explains the weaknesses of the current system, and the Administration’s proposal to change it.
The Federal Government spends approximately $5 billion per year to reimburse States for a portion of their foster care expenditures. Foster care services are intended to provide temporary, safe alternative homes for children who have been abused or neglected until they can safely return home or be placed in other permanent homes. The Office of Human Services Policy has published an Issue Brief, Federal Foster Care Financing: How and Why Current Funding Structure Fails to Meet the Needs of the Child Welfare Field (Foster Care Financing), that provides a brief history of the Federal foster care program, documents critical weaknesses in the way funds are distributed, and concludes with a discussion of the Administration’s legislative proposal to establish a more flexible financing system. The analyses demonstrate how the program has failed to keep pace with the needs of a changing child welfare field.
The Federal Government has, since 1961, shared the cost of foster care services with States. Prior to that time foster care was entirely a State responsibility. Federal foster care funding was part of the Federal welfare program, Aid to Families with Dependent Children (AFDC), until 1980. Since then, however, foster care funds have been authorized separately, under Title IV-E of the Social Security Act. States are reimbursed on an unlimited basis for a share of all eligible expenses.
In large part because definitions of allowable expenditures have expanded, and because States have become more adept at documenting their costs, State claims under the foster care program have long grown more quickly than the population of children served. But in recent years these trends have diverged dramatically. Figure 1 displays the growth in foster care expenditures and the number of children in foster care funded by Title IV-E.
| Figure 1. Federal Claims and Caseload History for Title IV-E Foster Care
|

Foster Care Financing describes the complexity of claiming and eligibility rules that have led to the program’s burdensome documentation requirements. There are four categories of expenditures for which States may claim Federal funds, each reimbursed, or “matched,” at a different rate. In addition, there are several statutory eligibility rules that must also be met in order to justify claims made on each child’s behalf. The time and costs involved in documenting and justifying claims are significant.
Wide variations in reimbursement levels received by States for each eligible child contribute to the program’s inequities. The major appeal of the current program has always been that, as an entitlement, funding levels were supposed to adjust automatically to respond to changes in “need.” The report argues, however, that under current conditions these features do not respond appropriately and equitably to reflect true changes or differences in need among the States. The average annual amount of Federal foster care funds received by States ranges from approximately $4,000 to over $41,000 per eligible child. Disparities this large are unlikely to represent actual differences in the cost of operating programs or to reflect differential needs among children.
Analyses presented document that States’ Title IV-E claims are only weakly related to service quality or outcomes achieved for children. Strengths and weaknesses of States’ child welfare programs are identified through Federal monitoring visits that have found significant flaws in programs across the nation. However, many of the improvements needed cannot be funded through Title IV-E. There are States with both high and low levels of foster care claims at each level of performance. In addition, there is no relationship between the amounts States claim in Title IV-E funds and the proportion of children for whom timely permanency is achieved. Figure 2 graphs each State’s per-child foster care claims against permanency data. These data show that States’ success in either reunifying children with parents within one year or finalizing an adoption within two years of foster care entry varies widely. These disparities in performance on this key child welfare function are unrelated to the amount of funds claimed from the Federal foster care program.
| Figure 2. Permanency Outcomes are Unrelated to
|
Another critical weakness in the program is that the permissible uses of Title IV-E funds are extremely limited, emphasizing foster care over other solutions. Foster care is funded on an unlimited basis, but these monies cannot be spent to provide services that would either prevent the child’s removal from the home or speed permanency. Foster care funding represents 65 percent of Federal funds dedicated to child welfare purposes, and adoption assistance makes up another 22 percent. Funding that may be used for preventive and reunification services represent only 11 percent of monies available in Federal child welfare programs.
The paper concludes by noting that the Federal system for financing foster care does not meet current needs. The proposed Child Welfare Program Option, currently included in the President’s Fiscal Year 2006 budget request, suggests that States be provided a choice between the current Title IV-E program and a five-year capped, flexible allocation of funds equivalent to anticipated Title IV-E expenditure levels. It would allow innovative State and local child welfare agencies to eliminate eligibility determination and claiming functions, and redirect funds toward services and activities that more directly achieve The full text of the Issue Brief is available at http://aspe.hhs.gov/hsp/05/fc-financing-ib/>. Additionally, the Assistant Secretary for Children and Families presented testimony based on the Issue Brief before the House Ways and Means Committee on June 9, 2005. The text of the testimony is available on the HHS website at http://www.acf.dhhs.gov/programs/olab/legislative/testimony/2005/index.html>. The transcript of the full hearing is available on the Committee’s website at http://waysandmeans.house.gov/hearings.asp>. For more information about this and related issues, contact Laura Radel in ASPE’s Office of Human Services Policy, or view reports under Child Welfare on ASPE’s web site (aspe.hhs.gov).
 |
| PRODUCED BY THE POLICY INFORMATION CENTER EDITORIAL BOARD: Michael J. O'Grady, Ph.D. Barbara Broman Marty McGeein James Scanlon Donald Young, MD EDITOR IN CHIEF: EXECUTIVE EDITOR: LIBRARIAN: TECHNICAL STAFF: DESIGNER: WEBSITE: http://aspe.hhs.gov |
CONFERENCES OF INTEREST
American Statistical Association
2005 Joint Statistical Meeting (JSM)
August 5-7, 2005
Minneapolis Convention Center
Minneapolis, MN
http://www.amstat.org
National Association for Welfare Research & Statistics (NAWRS)
The 45th Annual Workshop
August 28-31, 2005
The Madison Concourse Hotel and Governor’s Club
Madison, WI
http://www.nawrs.org/
Association for Public Policy Analysis & Management (APPAM)
Twenty-Seventh Annual APPAM Research Conference
November 3-5
Washington, DC
http://www.appam.org
American Public Health Association (APHA)
133rd Annual APHA Meeting
November 5-9, 2005
Ernest N. Morial Convention Center
New Orleans, LA
http://www.apha.org