
Eunice Park-Lee, Ph.D., Christine Caffrey, Ph.D., Manisha Sengupta, Ph.D., Abigail J. Moss, Emily Rosenoff, M.P.A., and Lauren D. Harris-Kojetin, Ph.D.
This report was prepared under contract #HHS-100-03-0025 between the U.S. Department of Health and Human Services (HHS), Office of Disability, Aging and Long-Term Care Policy (DALTCP) and the Research Triangle Institute, and through Interagency Agreement #10-HS06-894-CPCD-6 with the HHS National Center for Health Statistics. For additional information about this subject, you can visit the DALTCP home page at http://aspe.hhs.gov/_/office_specific/daltcp.cfm or contact the ASPE Project Officer, Emily Rosenoff, at HHS/ASPE/DALTCP, Room 424E, H.H. Humphrey Building, 200 Independence Avenue, S.W., Washington, D.C. 20201. Her e-mail address is: Emily.Rosenoff@hhs.gov.
The opinions and views expressed in this report are those of the authors. They do not necessarily reflect the views of the Department of Health and Human Services, the contractor or any other funding organization. This paper was first published as a NCHS Data Brief, No. 78, http://www.cdc.gov/nchs/data/databriefs/db78.pdf.
Residential care facilities (RCFs)--such as assisted living facilities and personal care homes--provide housing and supportive services to persons who cannot live independently but generally do not require the skilled level of care provided by nursing homes. RCFs are not federally regulated, and state approaches to RCF regulation vary widely (1). The ability to provide a comprehensive picture of the long-term care (LTC) industry has been hampered by the lack of data on RCFs (2, 3). Previous estimates of the size of the RCF sector varied depending on how RCFs were defined (4, 5). Using data from the first nationally representative survey of RCFs with four or more beds, this report presents national estimates of RCFs and compares characteristics and services by facility size.
Keywords: assisted living; long-term care; National Survey of Residential Care Facilities.
| Key findings
|
In 2010, RCFs numbered 31,100, providing 971,900 beds
-
Approximately, one-half of RCFs were small facilities with 4-10 beds (50%) (Figure 1). The rest were medium facilities with 11-25 beds (16%), large facilities with 26-100 beds (28%), and extra large facilities with more than 100 beds (7%).
-
When the number of residents that RCFs were serving at the time of interview was compared by facility size, small facilities were found to serve 10% of all residents in RCFs and medium facilities served 9% of residents, while large RCFs served 52% of all residents in RCFs and extra large RCFs served 29%.
| FIGURE 1. Residential Care Facilities and Residents, by Facility Size: United States, 2010 |
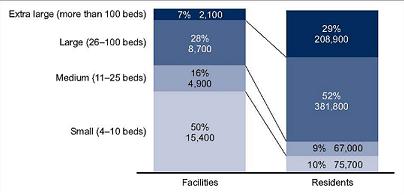 |
| SOURCE: CDC/NCHS, National Survey of Residential Care Facilities, 2010. NOTE: Estimates may not add to totals because of rounding. |
Owner type, chain affiliation, and geographic location of RCFs varied by facility size
| FIGURE 2. Selected Characteristics of Residential Care Facilities, by Facility Size: United States, 2010 |
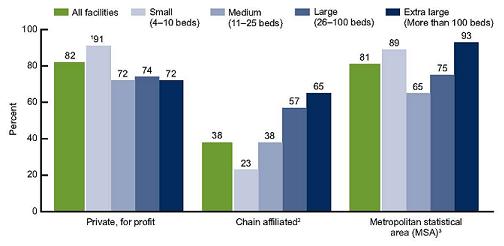 |
SOURCE: CDC/NCHS, National Survey of Residential Care Facilities, 2010.
|
-
Approximately 82% of RCFs were private, for-profit facilities (Figure 2), while the remaining 18% were private, nonprofit facilities or were owned by state, city, or local government (data not shown). Small RCFs were more likely to be for profit (91%) than larger RCFs.
-
About 38% of RCFs were chain-affiliated. As facility size increased, the proportion of chain-affiliated facilities grew: Extra large RCFs, for example, were almost three times as likely (65%) as small RCFs (23%) to be owned by a chain, group, or multifacility system.
-
Small (89%) and extra large (93%) RCFs were most likely to be in a metropolitan statistical area (MSA), while medium RCFs were least likely to be in an MSA (65%).
The mix of facility sizes and the supply of residential care beds differed by region
| FIGURE 3. Residential Care Facilities, by Region and Facility Size: United States, 2010 |
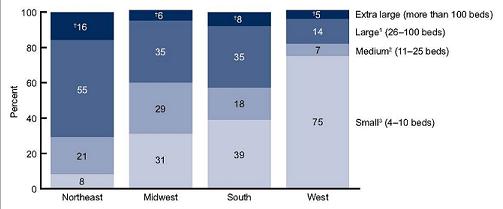 |
| SOURCE: CDC/NCHS, National Survey of Residential Care Facilities, 2010. NOTE: Estimates may not add to totals because of rounding. † Estimate does not meet standards of reliability or precision because the sample size is between the sample size is between 30 and 59, or the sample size is greater than 59 but has a relative standard error of 30% or more.
|
-
RCFs were most commonly located in the West (42% of all RCFs) and least commonly located in the Northeast (8%) (data not shown).
-
RCFs in the West were predominantly small, while RCFs in the Northeast were mostly large. RCFs in the Midwest and South were more evenly distributed among small, medium, and large facilities (Figure 3).
-
In the United States, RCFs provided 177 beds per 1,000 persons aged 85 and over (Figure 4).
-
The West had the largest supply of RCF beds per 1,000 persons aged 85 and over (245 beds), and the Northeast had the smallest supply (131 beds).
| FIGURE 4. Residential Care Beds Per 1,000 Persons Aged 85 and Over, by Region: United States, 2010 |
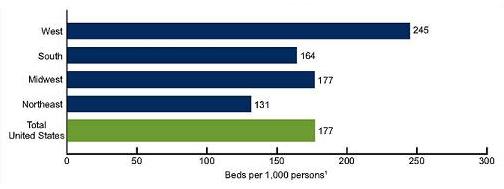 |
| SOURCE: CDC/NCHS, National Survey of Residential Care Facilities, 2010, and 2010 Census Summary File 1. NOTE: Beds per 1,000 persons were calculated by dividing the number of residential care beds by the number of persons aged 85 and over, multiplied by 1,000.
|
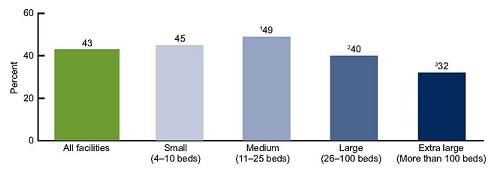
About 4 in 10 RCFs served residents who were receiving LTC services paid by Medicaid
-
Overall, 43% of RCFs had at least one resident who had some or all of his or her LTC services paid by Medicaid (Figure 5).
-
Similar proportions of small (45%) and large (40%) RCFs served residents who were receiving LTC services paid by Medicaid.
-
Extra large RCFs were least likely (32%) to serve residents whose LTC services were paid by Medicaid.
| FIGURE 5. Residential Care Facilities Serving Any Resident Receiving Long-Term Care Services Paid by Medicaid, by Facility Size: United States, 2010 |
 |
| SOURCE: CDC/NCHS, National Survey of Residential Care Facilities, 2010. NOTE: Figure excludes cases with missing data; see “Data sources and methods” for details.
|
The types of services offered at RCFs varied by facility size
| FIGURE 6. Provision of Selected Services, by Facility Size: United States, 2010 |
 |
| SOURCE: CDC/NCHS, National Survey of Residential Care Facilities, 2010. NOTE: Figure excludes cases with missing data; see “Data sources and methods” for details.
|
-
Nearly all RCFs provided basic health monitoring (96%), incontinence care (93%), social and recreational activities within the facility (99%), special diets (93%), and personal laundry services (99%) (data not shown).
-
The provision of occupational and physical therapy increased with size of facility, while the provision of skilled nursing services did not vary by facility size (Figure 6).
-
Small RCFs were less likely to provide social services counseling (24%) and case management (51%) than larger RCFs. Medium RCFs were also less likely to provide case management (57%) than larger RCFs.
-
Extra large RCFs were most likely (91%) and medium RCFs were least likely (73%) to offer transportation to medical or dental appointments.
Summary
RCFs in the United States totaled 31,100 in 2010, with 971,900 state-licensed, certified, or registered residential care beds. About one-half of RCFs were small facilities which served one-tenth of all RCF residents. The remaining RCFs were medium-sized facilities (16%) which served about one-tenth of all RCF residents, large facilities (28%) which served about one-half of all RCF residents, and extra large facilities (7%) which housed about three-tenths of all RCF residents. RCFs were predominantly for profit (82%), not part of a chain (62%), and located in an MSA (81%). Small RCFs were more likely to be for profit than larger RCFs. The proportion of chain-affiliated RCFs grew with increasing facility size. Small and extra large RCFs were most likely to be located in an MSA, while medium RCFs were least likely to be in an MSA.
RCFs were most commonly located in the West. The mix of facility sizes varied by region. The West had almost twice as many residential care beds per 1,000 persons aged 85 and over as the Northeast (245 to 131). Comparing the supply of RCF beds with nursing home beds (data compiled by Centers for Medicare & Medicaid Services) shows that the supply of RCF beds (245) and nursing home beds (203) per 1,000 persons aged 85 and over was relatively comparable in the West, but nursing home beds far outnumbered RCF beds in all other regions. There were about twice as many nursing home beds as RCF beds per 1,000 persons aged 85 and over in the South (325 to 164), Midwest (390 to 177), and Northeast (303 to 131). More research is needed to identify and examine factors that may explain these regional differences in both the supply of residential care beds, including variations in state regulation and financing of different types of LTC providers, and in consumer preferences for different kinds of long-term services and support.
RCFs serve primarily a private-pay adult population (6). However, the use of Medicaid financing for services in residential care settings has gradually increased in recent years (7). About 4 out of 10 RCFs had at least one resident who had some or all of their LTC services paid by Medicaid. The percentage of facilities having residents who received LTC services paid by Medicaid varied by facility size.
Although nearly all RCFs provided basic health monitoring (96%) and incontinence care (93%), larger RCFs were more likely than smaller RCFs to offer occupational and physical therapy. Larger RCFs were also more likely than small RCFs to provide social services counseling and case management. The provision of skilled nursing services did not vary by facility size.
This report presents national estimates of RCFs using data from the first-ever national probability sample survey of RCFs with four or more beds. Findings on differences in selected characteristics and services offered by facility size and on regional variations in the supply of beds provide useful information to policymakers, LTC providers, and consumer advocates as they plan to meet the needs of an aging population. Moreover, these findings establish baseline national estimates as researchers continue to track growth and changes in the residential care industry.
Definitions
Facility size: Categorized by four sizes, based on the number of licensed, registered, or certified residential care beds (both occupied and unoccupied) in a facility: small (4-10 beds), medium (11-25 beds), large (26-100 beds), and extra large (more than 100 beds).
Ownership type: Categorized by two types: 1) private, for profit, and 2) other, which includes private nonprofit and state, county, or local government ownership. The private, for-profit category includes publicly traded facilities.
Chain affiliation: Describes facilities owned by a chain, group, or multifacility system. A chain is more than one facility under common ownership or management, and may include facilities within state or across multiple states.
Metropolitan statistical area (MSA): Designates a county or group of contiguous counties that contains at least one urbanized area of 50,000 or more population. An MSA may contain other counties that are economically and socially integrated with the central county, as measured by commuting.
Region: Created by grouping conterminous states into geographic areas corresponding to groups used by the U.S. Census Bureau. A listing of states included in each of the four U.S. Census regions is available from: http://www.census.gov/geo/www/us_regdiv.pdf.
Residential care bed: Refers to licensed, registered, or certified residential care beds. The number of residential care beds used to calculate beds per 1,000 persons aged 85 and over include both occupied and unoccupied beds.
Residents whose long-term care (LTC) services were paid by Medicaid: Residents who had some or all of their LTC services paid by Medicaid during the last 30 days. If facilities reported not being certified or registered to participate in Medicaid, the facility is coded as having no residents receiving LTC services paid by Medicaid.
Skilled nursing services: Services essential to the maintenance or restoration of health that are provided to sick or disabled persons by a registered nurse or licensed practical nurse.
Basic health monitoring: Monitoring for a health condition or status like blood pressure, blood sugar, and weight.
Social services counseling: Counseling related to obtaining and keeping benefits provided by programs such as Supplemental Security Income, Social Security, and Medicaid.
Case management: A process of assessing, planning, and facilitating options and services for a person.
Data Sources and Methods
Facility data from the 2010 National Survey of Residential Care Facilities (NSRCF), conducted by the Centers for Disease Control and Prevention’s National Center for Health Statistics, Division of Health Care Statistics, were used for these analyses. To be eligible for the study, RCFs must be licensed, registered, listed, certified, or otherwise regulated by the state; have four or more licensed, certified, or registered beds; have at least one resident currently living in the facility; and provide room and board with at least two meals a day, around-the-clock on-site supervision, and help with personal care such as bathing and dressing or health-related services such as medication management. These facilities serve a predominantly adult population. Facilities licensed to serve the mentally ill or developmentally disabled populations exclusively are excluded. Nursing homes are also excluded unless they have a unit or wing meeting the above definition and residents can be separately enumerated.
The 2010 NSRCF used a stratified two-stage probability sample design. The first stage was the selection of RCFs from the sampling frame representing the universe of RCFs. The second stage was the selection of current residents. For the 2010 NSRCF, 3,605 RCFs were sampled with probability proportional to facility size. Interviews were completed with 2,302 facilities, for a first-stage facility unweighted response rate of 79% and a weighted response rate (for differential probabilities of selection) of 81%. Highlights about residents in RCFs will be provided in a forthcoming report. More details about sampling design and data collection are available elsewhere (8).
Two other data sources were used to compare the supply of residential care beds with that of nursing home beds per 1,000 persons aged 85 and over included in the Summary. 2010 Census Summary File 1 was used to estimate the number of persons aged 85 and over in the United States. Centers for Medicare & Medicaid Services Online Survey, Certification and Reporting (CMS OSCAR) data of December 2010 were used for the number of nursing home beds in the United States.
Differences among subgroups were evaluated using chi-square and t tests. If chi-square tests were statistically significant, a post hoc t-test procedure was used to make pairwise comparisons of different facility sizes (Figures 1-3, 5, and 6). Significant results from the post hoc procedure are reported here. Differences between regions were evaluated with t tests for rates per 1,000 persons aged 85 and over (Figure 4). All significance tests were two-sided using p < 0.05 as the level of significance. Terms such as “no significant differences” are used to denote that the estimates being compared are not significantly different statistically. The difference between any two estimates is mentioned in the text only if it is statistically significant. Lack of comment regarding the difference between any two statistics does not necessarily suggest that the difference was tested and found not to be statistically significant. In addition, a weighted least-squares technique was used (9) to test linear trends across four facility sizes. A downward or upward trend is mentioned if it is statistically significant. Data analyses were performed using the SAS-callable SUDAAN version 10.0 statistical package (10). Cases with missing data were excluded from the analyses on a variable-by-variable basis. Variables used in this report had a weighted percentage of cases with missing data between 0.1% and 0.6%. Because estimates were rounded, individual estimates may not sum to totals.
About the Authors
Eunice Park-Lee, Christine Caffrey, Manisha Sengupta, Abigail J. Moss, and Lauren D. Harris-Kojetin are with the Centers for Disease Control and Prevention’s National Center for Health Statistics, Division of Health Care Statistics. Emily Rosenoff is with the Department of Health and Human Services, Assistant Secretary for Planning and Evaluation’s Office of Disability, Aging, and Long-Term Care Policy.
References
-
Polzer K. Assisted living state regulatory review 2011. Washington, DC: National Center for Assisted Living. 2011.
-
Spillman BC, Black KJ. The size and characteristics of the residential care population: Evidence from three national surveys. Prepared for U.S. Department of Health and Human Services, Assistant Secretary for Planning and Evaluation, Office of Disability, Aging, and Long-Term Care Policy. Washington, DC: The Urban Institute. 2006. [ http://aspe.hhs.gov/daltcp/reports/2006/3natlsur.htm]
-
Spillman BC, Black KJ. The size of the long-term care population in residential care: A review of estimates and methodology. Prepared for U.S. Department of Health and Human Services, Assistant Secretary for Planning and Evaluation, Office of Disability, Aging, and Long-Term Care Policy. Washington, DC: The Urban Institute. 2005. [ http://aspe.hhs.gov/daltcp/reports/2005/ltcpopsz.htm]
-
Mollica R, Sims-Kastelein K, O’Keefe J. Residential care and assisted living compendium: 2007. Prepared for U.S. Department of Health and Human Services, Assistant Secretary for Planning and Evaluation, Office of Disability, Aging, and Long-Term Care Policy. Washington, DC: RTI International. 2007. [ http://aspe.hhs.gov/daltcp/reports/2007/07alcom.htm]
-
Stevenson DG, Grabowski DC. Sizing up the market for assisted living. Health Aff 29(1):35-43. 2010.
-
Hawes C, Phillips CD, Rose M, Holan S, Sherman M. A national survey of assisted living facilities. Gerontologist 43(6):875-82. 2003.
-
Mollica RL. State Medicaid reimbursement policies and practices in assisted living. Prepared for National Center for Assisted Living, American Health Care Association. Washington, DC. 2009.
-
Moss AJ, Harris-Kojetin LD, Sengupta M, et al. Design and operation of the 2010 National Survey of Residential Care Facilities. National Center for Health Statistics. Vital Health Stat 1(54). 2011.
-
Sirken MG, Shimizu BI, French DK, et al. Manual on standards and procedures for reviewing statistical reports. Hyattsville, MD: National Center for Health Statistics. 1992.
-
SUDAAN, release 10.0 [computer software]. Research Triangle Park, NC: RTI International. 2008.