Prepared By: Erica E. Meade
The brief describes the characteristics of pockets of concentrated poverty within metropolitan areas and the individuals that live in these communities. Topics covered include race and ethnicity, family type, birth rates, and educational attainment. The figures presented are based on ASPE's analysis of the U.S. Census Bureau's 2007-2011 American Community Survey (ACS) 5-year data file.
"Residents of high poverty neighborhoods experience the negative effects of their surroundings, not just those who are impoverished.
It is well established that living in areas of highly concentrated poverty inhibits opportunity and mobility of poor residents, beyond the obstacles their individual economic circumstances already impose, and it limits the surrounding area’s economic potential and social cohesionI. The outcomes associated with living in areas of concentrated poverty are well documented and extend to non-poor as well as poor residents of these communities. These include: diminished school quality and academic achievement; diminished health and healthcare quality; pervasive joblessness, employment discrimination and reduced employment networks; increased crime, especially violent crime; declining and poorly maintained housing stock and devaluation of home values; and difficulty building wealth and experiencing economic mobilityII. Compounding these problems, individuals living in poverty-saturated areas are less likely to live in the vicinity of non-governmental social service organizations, and proximity to these organizations is a key factor in service utilizationIII. There is evidence to suggest that poor individuals who live in more-advantaged areas are, in some regards, “buffered from the most negative impacts of povertyIV.”
I See William Julius Wilson, The Truly Disadvantaged. Chicago, IL, The University of Chicago Press, 1987; The Federal Reserve System and The Brookings Institution. 2008 “The Enduring Challenge of Concentrated Poverty in America: Case Studies from Communities Across the U.S.” Richmond, VA: The Federal Reserve Bank of Richmond.
II Ibid.
III Kissane, Rebecca Joyce. 2010. “We Call it the Badlands: How Social-Spatial Geographies Influence Social Service Use.” Social Service Review 84(1): 3-28.
IV Dwyer, Rachel E. “Poverty, Prosperity, and Place: The Shape of Class Segregation in the Age of Extremes.” Social Problems 57(1):114-137.
Researchers most often define concentrated poverty as a significantly high proportion of areas residents living below the poverty level.
The concentrated poverty literature typically uses Census tracts as the geographical boundaries for studying high poverty communities. The Zip Code Tabulation Area (ZCTA) is, on average, a larger boundary, reflective in most cases of actual zip code boundaries, in which several Census tracts may exist. Census tract boundaries are determined based on population and, as such, are inconsistent in physical size, and may not reflect community members’ definitions of the local residential area of influence. In most densely populated metropolitan areas Census tracts are smaller than what many would consider a “neighborhood,” and generally are smaller than ZCTAs; but; they often are larger than ZCTAs in less densely-populated areas.1 Since ZCTA boundaries are determined by physical size rather than population, we can think of these as areas in which services would reach the surrounding community.2
The unit of analysis for this research is the Zip Code Tabulation Area (ZCTA). We use a combination of two criteria to define a ZCTA as an area of concentrated poverty. First, the ZCTA must contain a Census tract with an official poverty rate above 40 percent, which is
consistent with the threshold in much of the concentrated poverty literature. The second criterion which must be met for the area to meet our definition as one of concentrated poverty is that a Census tract with poverty rate of 40 percent or higher must be located in a ZCTA where at least 30 percent of residents are poor. For this research, we refer to areas of concentrated poverty as “30/40 ZCTAs” – or ZCTAs with poverty rates over 30 percent that contain at least one Census tract with at least a 40 percent poverty rate. There are 690 ZCTAs that meet these criteria in the 2011 American Community Survey 5-year file.3 Within these 690 ZCTAs are 1,845 Census tracts with poverty rates above 40 percent (see Table 1). This represents 58 percent of all Census tracts with poverty rates exceeding 40 percent.
Table 1: Summary of Concentrated Poverty Areas by Census Boundary Type
| Geography | Number of entities | Total Population | Poor Population | Poverty Rate | Under 18 | Poor - Under 18 | Child Poverty Rate |
|---|---|---|---|---|---|---|---|
| All ZCTAs | ~33,000 | 298.8 M | 42.7 M | 14.3% | 72.9 M | 14.6 M | 20.0% |
| 30/40 ZCTAs | 690 (2.1%) | 12.8 M (4.3%) | 4.5 M (10.5%) | 34.9% | 3.8 M (5.2%) | 1.9 M (13.0%) | 51.5% |
| All Tracts | ~73,000 | 298.8 M | 42.7 M | 14.3% | |||
| Tract Poverty Rate >40% | 3,182 (4.4%) | 10.4 M (3.5%) | 4.7 M (11.0%) | 47.3% | |||
| Tract Poverty Rate >40% within ZCTA with Poverty Rate >30% | 1,845 (2.5%) | 6.1 M (2.0%) | 2.8 M (6.6%) | 46.5% |
Using this definition of concentrated poverty, roughly 12.8 million people, or four percent of the U.S. population, lived in 30/40 ZCTAs and about 35 percent of residents in these areas had incomes below the poverty line. About one in ten of America’s 42.7 million poor people lived in one of these neighborhoods 2009. Almost all of these individuals lived in metropolitan areas (i.e., central city or adjacent suburbs).
The distribution of America’s poor population is spatially uneven, and impoverished individuals, particularly those who live in areas of highly concentrated poverty, are overrepresented in inner-city urban areas, tribal reservations, and certain isolated rural regions. Each of these settings is unique, with distinct implications for possible poverty-alleviating interventions. This brief focuses on the demographics and community characteristics of the 531 high-poverty ZCTAs that are in metropolitan (urban and suburban) areas, most of which are in the central cities of their metropolitan areas. Later briefs will cover the unique characteristics of rural and tribal areas of concentrated poverty.
1 There are roughly 33,000 ZCTAs with an average population of 9,050 and populations ranging from 30 to 114,000. There are 74,000 Census tracts with an average population of 4,090 and a population range of 1,200-8,000.
2 With the caveat that nothing is perfect, by using the ZCTA as the geographic unit of analysis, we identify characteristics using a larger geography that may more closely resemble a service delivery area and is more convenient for aligning data on area needs and services.
3 Although 691 ZCTAs met the criteria outlined above, one of those areas has a population of only 75 and is the site of a Veteran’s Affairs Health Center, so it was excluded from the analysis.
Characteristics of Metropolitan Areas of Concentrated Poverty and The Individuals Who Live In Them
Areas of concentrated poverty look different from less-impoverished areas across several indicators of individual and community well-being that are analyzed in this brief.
Data for this analysis comes from the U.S. Census Bureau’s 2007-2011 American Community Survey (ACS) 5-year estimates. The Zip Code Tabulation Area (ZCTA) is the primary unit of analysis and data were obtained for each of the focal ZCTAs across a number of demographic, social, and economic variables. We examine indicators of racial segregation, economic mobility (e.g., education, employment), immigration (e.g., nativity, citizenship, language proficiency), and family formation (e.g., household structure, birth rates). [In addition to the data highlighted in the brief narrative, supplementary tables and figures are provided in the Appendix].
Racial and ethnic minorities are overrepresented in the concentrated poverty population, and concentrated poor communities in metropolitan areas are often highly segregated.
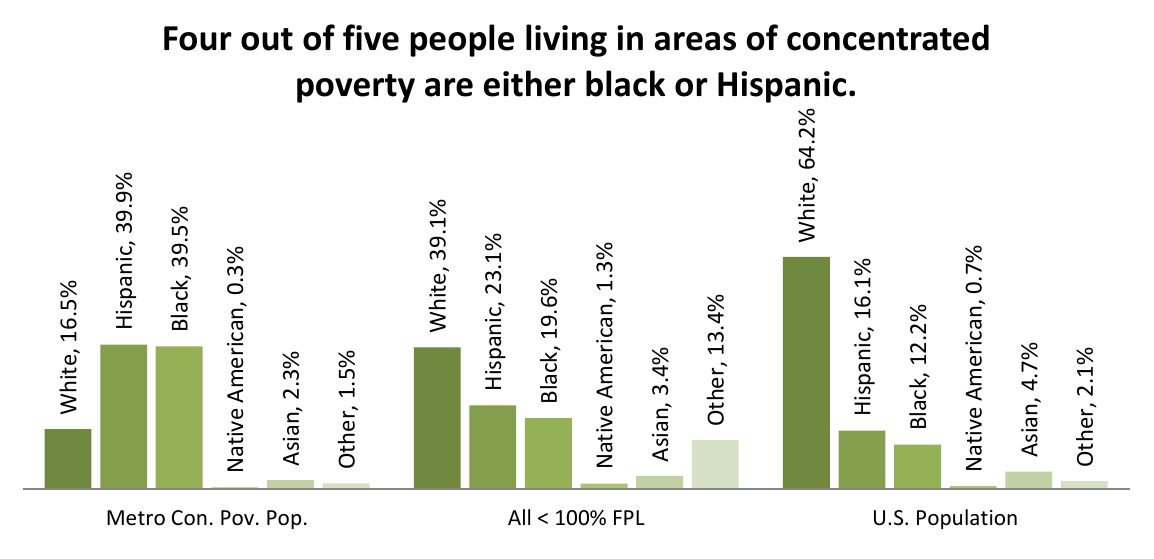
Less than one-third of the U.S. population is black or Hispanic, yet four out of every five people living in metropolitan concentrated poverty communities are black or Hispanic. Although only 12.2 percent of the U.S. population and 19.6 percent of the poverty population is black, nearly 40 percent of people living in areas of concentrated poverty are black. Similarly, just over 16 percent of the U.S. population and 23 percent of the poverty population is Hispanic, but nearly 40 percent of the total population living in communities of concentrated poverty is Hispanic.
Regional variation in the racial composition of these areas is most dramatic for Hispanic and black populations. For example, over two-thirds of individuals living in areas of concentrated poverty in the West are Hispanic, and only one in 10 individuals in these communities is black. Alternatively, in the Midwest region, black individuals account for 60 percent of the region’s high poverty area population, and just over one in 10 individuals is Hispanic.
Figure 1: Racial Distribution by Population Subgroup