
Angela M. Greene, MS, MBA, Joshua M. Wiener, PhD, Galina Khatutsky, MS, Ruby Johnson, MA, MS, and Janet O'Keeffe, DrPH
RTI International
"This report was prepared under contract #HHSP23320095651WC between the U.S. Department of Health and Human Services (HHS), Office of Disability, Aging and Long-Term Care Policy (DALTCP) and the Research Triangle Institute. For additional information about this subject, you can visit the DALTCP home page at http://aspe.hhs.gov/office_specific/daltcp.cfm or contact the ASPE Project Officer, Emily Rosenoff, at HHS/ASPE/DALTCP, Room 424E, H.H. Humphrey Building, 200 Independence Avenue, S.W., Washington, D.C. 20201. Her e-mail address is: Emily.Rosenoff@hhs.gov.
The opinions and views expressed in this report are those of the authors. They do not necessarily reflect the views of the Department of Health and Human Services, the contractor or any other funding organization.
Acknowledgments and Disclaimer
The authors gratefully acknowledge the helpful comments on this report by Emily Rosenoff, Ruth Katz, and Peter Kemper of the Office of the Assistant Secretary for Planning and Evaluation/U.S. Department of Health and Human Services, and the data assistance of Robert Krasowski of the Research Data Center of the National Center for Health Statistics. The views expressed in this paper are solely those of the authors and do not necessarily represent the views of the U.S. Department of Health and Human Services or RTI International.
Acronyms
| ADL | Activity of daily living |
|---|---|
| HCBS | Home and community-based services |
| HPRD | Hours per resident day |
| IADL | Instrumental activity of daily living |
| LOS | Length of stay |
| LPN | Licensed practical nurse |
| LTC | Long-term care |
| LVN | Licensed vocational nurse |
| MSA | Metropolitan statistical area |
| NSRCF | National Survey of Residential Care Facilities |
| RCF | Residential care facility |
| RN | Registered nurse |
| RTI | Research Triangle Institute, RTI International |
Executive Summary
Residential care facilities (RCFs) are important providers of long-term care (LTC) services. RCFs provide services and room and board to persons with chronic illnesses and physical or mental impairments who need assistance with activities of daily living (ADLs), such as bathing and dressing, and help with health-related services, such as managing medications. In 2010, approximately 31,100 RCFs served 733,300 residents of all ages with a wide range of LTC needs. The National Survey of Residential Care Facilities (NSRCF) finds that 43 percent of RCFs have at least one resident for whom Medicaid pays for their LTC services and Medicaid pays for at least some of the LTC services of 19 percent of residents.
An important goal of the Medicaid program is for lower-income Medicaid beneficiaries to receive care and services comparable to non-Medicaid beneficiaries. The characteristics of RCFs that can serve Medicaid beneficiaries are determined by a complex interplay of state licensing and regulatory requirements and Medicaid policy.
Research Questions
This study has two purposes: (1) to determine whether and how facilities that serve Medicaid beneficiaries differ from those that do not; and (2) to determine whether and how RCF residents receiving Medicaid-covered RCF services differ from residents not receiving Medicaid coverage. Specific research questions are:
-
Do facilities participating in Medicaid differ from non-participating facilities in characteristics such as living arrangements, staffing levels, and costs? Do the characteristics of facilities in which Medicaid beneficiaries live differ from those in which non-Medicaid residents live?
-
Do Medicaid and non-Medicaid RCF residents differ in demographic characteristics, health and functional status, and service use?
-
What factors predict RCFs' participation in Medicaid?
Data and Methods
This study uses merged facility and resident data from the 2010 NSRCF, which was sponsored by the U.S. Department of Health and Human Services (the National Center for Health Statistics, the Office of the Assistant Secretary for Planning and Evaluation, the Agency for Healthcare Research and Quality), the U.S. Department of Veterans Affairs, and other federal agencies. The survey focuses on facilities that serve older people and younger people with physical disabilities. As a result, facilities that exclusively served people with severe mental illness or people with intellectual and developmental disabilities were excluded.
We defined facilities as participating in Medicaid if a respondent reported that at least one resident had some or all of his or her LTC services paid by Medicaid in the 30-day period prior to the survey. Medicaid residents were defined as residents for whom Medicaid paid for any of their LTC services provided at the facility in the 30-day period prior to the survey. For this study, we merged the NSRCF facility and resident files so that resident-level analysis could be conducted including resident and facility characteristics that are not included in the public use file.
Data are presented from several perspectives using different units of analysis so as to provide a full understanding of RCFs and their residents. For analyses of resident characteristics, we analyze the resident file and interpretation is straightforward. Amore complex approach is required to fully understand facilities because a large number of RCFs are small (4-10 beds), but only a relatively small proportion of residents live in these facilities. More specifically, 50 percent of RCFs are small, but they serve only 10 percent of residents (Park-Lee et al., 2011). Conversely, although only about half of RCFs are larger than ten beds, they account for 90 percent of residents. Thus, a simple analysis of facilities will give disproportionate weight to the small facilities even though they serve only a small proportion of residents. To address this problem, we show facility characteristics from two perspectives. First, we analyze facility characteristics with the facility as the unit of analysis. Second, to present a perspective that more closely aligns with the number of persons served and to represent the perspective of RCF residents, we also analyze the facility characteristics at the resident level. For these analyses, we match residents with the characteristics of the facilities in which they live and present the facility characteristics with the resident as the unit of analysis. For these types of analyses, we refer to "the facilities in which residents live." This type of analysis can be thought of as facility analyses weighted by the number and type of residents.
Results: Facilities
Medicaid facilities are similar to non-Medicaid facilities on many, but not all, facility characteristics. Medicaid-participating facilities are smaller than non-Medicaid facilities; Medicaid residents are much less likely than non-Medicaid residents to live in facilities with 100 or more beds. In addition, only about a fifth of RCFs reported having a dementia or Alzheimer's special care unit or only serving residents with Alzheimer's disease; however, fewer Medicaid RCFs have a dementia care unit or only serve persons with Alzheimer's disease (Table ES-1a and Table ES-1b), which is possibly indicative of the younger age of Medicaid residents who are less likely to have dementia.
| Characteristics of Residential Care Facilities | Total RCF FacilitiesN=2,302 (%) | Non-Medicaid FacilitiesN=1.292 (%) | Facilities Serving Any Residents on MedicaidN=998 (%) | Significance Test p-value |
|
SOURCE: RTI analysis of the 2010 NSRCF. NOTES:
**p<0.05, ***p<0.001, ns: not significant, p>0.1. |
||||
| Alzheimer's disease services | ||||
| Facility has a dementia or Alzheimer's special care unit or only serves adults with dementia or Alzheimer's disease | 17.3 | 20.2 | 13.5 | *** |
| Facility living quarters1 | ||||
| Rooms or apartments that are rooms designed for one person | 28.0 | 27.7 | 28.4 | ns |
| Rooms or apartments that are rooms designed for two or more persons | 19.6 | 17.2 | 23.7 | ** |
| Rooms or apartments that are studios or 1-3 bedroom apartments | 52.5 | 55.1 | 47.9 | *** |
| Characteristics of Facilities Where Residents Live | All ResidentsN=8,094 (%) | Non-Medicaid FacilitiesN=6,122 (%) | Medicaid ResidentsN=1,904 (%) | Significance Test p-value |
|
SOURCE: RTI analysis of the 2010 NSRCF. **p<0.05, ***p<0.001, ns: not significant, p>0.1. |
||||
| Alzheimer's disease services | ||||
| Facility has a dementia or Alzheimer's special care unit or only serves adults with dementia or Alzheimer's disease | 36.5 | 40.3 | 20.0 | *** |
| Resident lives in a: | ||||
| Room designed for one person | 31.6 | 32.8 | 26.6 | *** |
| Room designed for two or more persons | 26.9 | 22.5 | 45.5 | *** |
| Studio or 1-3 bedroom apartment | 41.5 | 44.7 | 27.9 | *** |
One policy concern is whether RCFs offer the level of privacy expected in a "homelike" environment and whether the level of privacy offered differs by Medicaid status. The living quarters of Medicaid facilities offer less privacy than non-Medicaid facilities: apartments are more likely to be offered in the non-Medicaid facilities (82.8 percent) compared to Medicaid facilities (76.3 percent). Moreover, Medicaid residents are much more likely than non-Medicaid residents to live in multiperson rooms: slightly less than half of Medicaid residents live in rooms that serve two or more persons, whereas just over a quarter of Medicaid residents live in apartments.
FIGURE ES-1. Direct Care Staffing: Facility Level and Facilities Where Residents Live, by Medicaid Status
Facility Level Analysis
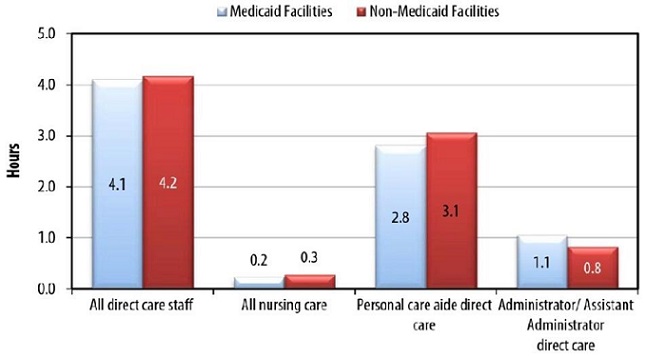
For the chart on facilities serving any residents on Medicaid, differences are not statistically significant at a probability p<0.05.
Facilities in Which Residents Live
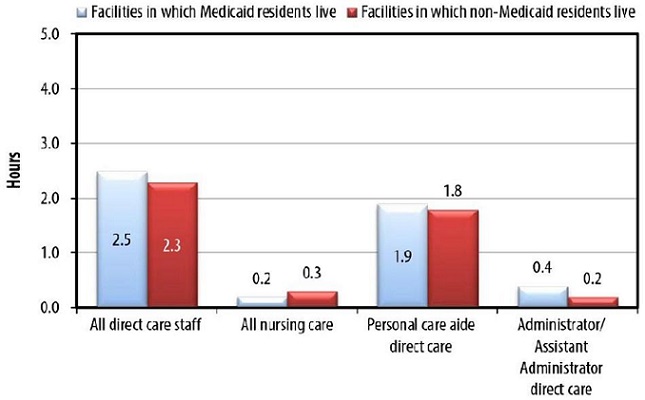
For the chart on facilities where Medicaid and non-Medicaid residents live, all differences are statistically significant at p<0.05 or less.
SOURCE: RTI International analysis of the NSRCF.
Whether a Medicaid-eligible individual is served in a nursing home or an RCF depends, among other factors, on a state's nursing home level of care criteria and whether RCFs can admit or retain people who need nursing home-level services. Admission and discharge policies vary little by facility payment status. Among those admission policies that are of interest to researchers and policy makers, a larger proportion of Medicaid facilities admit individuals who need skilled nursing care, including daily monitoring for a health condition, or have a substance abuse problem. A smaller proportion of Medicaid RCFs admit residents who are unable to leave the facility in an emergency without help, are regularly incontinent, and have moderate to severe cognitive impairment.
Facility services offered are mostly the same by Medicaid status and when significant differences exist, a higher proportion of Medicaid RCFs provide the service. Specifically, more Medicaid facilities than non-Medicaid facilities offer services that may be aimed at a younger population, such as transportation to sheltered workshops and educational programs, social services counseling, and case management services. A higher proportion of Medicaid facilities provide skilled nursing services and daily health monitoring, perhaps reflecting that some states allow facilities to serve residents who require nursing home levels of care under Medicaid home and community-based services (HCBS) waivers. Data at the resident level show a higher proportion of Medicaid residents than non-Medicaid residents receiving each service--with the exception of ADL assistance, incontinence care, and social and recreational activities inside and outside the facility.
An important measure of facility adequacy in meeting residents' needs is the availability of direct care staff. Direct care staffing hours per resident per day do not vary between Medicaid and non-Medicaid facilities (Figure ES-1). Of note, however, is that although staffing ratios in Medicaid and non-Medicaid facilities are not different when facilities are the unit of analysis, the number of direct care hours per resident per day is slightly higher in the facilities in which Medicaid residents live than in the facilities where non-Medicaid residents live.
One of the attractions of RCFs to residents and to state policy makers is that they charge less than nursing homes. Although Medicaid does not cover room and board in these facilities, states can reimburse services in RCFs. The NSRCF facility survey did not collect information on Medicaid payment rates; however, it did collect the average monthly base rate facilities generally charge residents and amount charged sampled residents. The monthly rate charged for a single individual living in a one-bedroom apartment or private room is significantly higher in non-Medicaid RCFs ($3,500 and $2,993, respectively) than in Medicaid RCFs ($2,912 for a one-bedroom apartment and $2,587 for a private room) (Figure ES-2). Similarly, the average total charge to non-Medicaid residents in the month prior to the survey is significantly higher than that charged to Medicaid residents, with non-Medicaid residents paying approximately $1,200 per month more.
FIGURE ES-2. Average Base Rate at the Facility Level and Average Total Amount Facility Charged Residents in the Month Prior to the Survey, by Medicaid Status
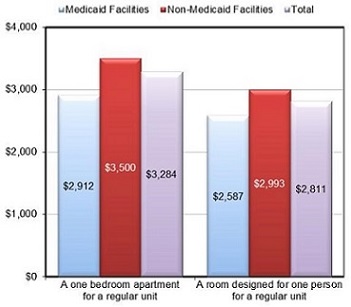
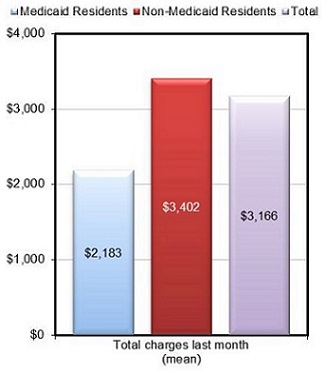
SOURCE: RTI International analysis of the NSRCF.
NOTE: Differences shown are statistically significant at p<0.001.
This study conducted a multivariate logistic regression analysis of predictors of Medicaid participation by RCFs. The odds of facilities participating in Medicaid are higher in states that cover residential care services through Medicaid state plan personal care and in states that cover residential care through both HCBS waiver and state plan personal care. Somewhat surprisingly, state coverage of RCF services only through Medicaid HCBS waivers is not a statistically significant predictor of Medicaid participation, suggesting that the need to serve persons with a nursing home level of care may be a deterrent to participation. The odds that a facility will participate in Medicaid are lower if the facility is located in an urban area. The odds of participating in Medicaid also decrease as the percentage of residents with Alzheimer's disease or other dementia increases in a facility. Moreover, the odds of a facility participating in Medicaid decline as the number of residential care beds in the facility increases (i.e., the larger the facility, the less likely it is to accept Medicaid residents). The direct care staff ratio, for-profit ownership, being part of a chain, and having a high percentage of high-privacy units are not statistically significant predictors of Medicaid participation.
Medicaid vs. Non-Medicaid Residents
Medicaid residents are more likely to be younger, male, to have never married, to be racial and ethnic minorities (non-White), and to have lower levels of education compared to non-Medicaid residents. Medicaid and non-Medicaid residents differ very little with respect to three common chronic health conditions--arthritis, stroke, and congestive heart failure; whereas, a higher proportion of Medicaid residents have diabetes.
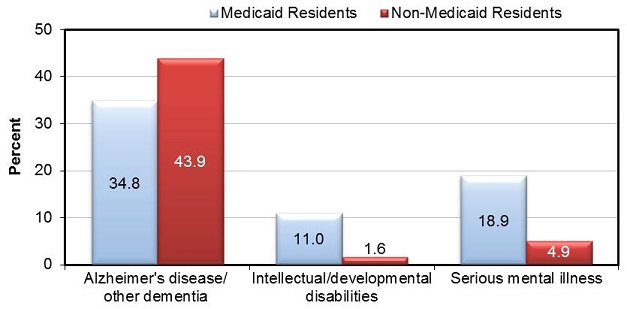
Of particular policy relevance because it relates to need for services is whether and how residents differ on disability levels. Medicaid and non-Medicaid residents are similar on ADLs and instrumental activity of daily living (IADL) impairments. On the other hand, Medicaid residents are significantly more likely than non-Medicaid residents to have severe mental illness or intellectual and developmental disabilities, but are less likely to have Alzheimer's disease and other dementias (Figure ES-3). A higher proportion of Medicaid than non-Medicaid residents exhibit problem behaviors such as being verbally and physically abusive. Among residents exhibiting at least one behavior problem, Medicaid residents are more likely to have a prescription for medications to control their behavior or reduce agitation.
FIGURE ES-3. Residential Care Facility Residents' Cognitive and Mental Health, by Medicaid Status
SOURCE: RTI International analysis of the NSRCF.
NOTE: Differences shown are statistically significant at probability p<0.001.
Conclusions
For many policy-relevant characteristics, Medicaid and non-Medicaid facilities and residents are similar, especially in ADL and IADL disability levels and services offered and used. Although a more detailed analysis is required for a more definitive answer, the lack of differences in staffing levels suggests that Medicaid residents may not be disadvantaged relative to non-Medicaid residents in the availability of facility direct care personnel.
On four dimensions, however, there are important differences. First, Medicaid residents are more likely to be under age 65 and to have severe mental illness and intellectual and developmental disabilities; non-Medicaid residents are more likely to be aged 65 and older and to have Alzheimer's disease and other dementias. Consistent with that difference, non-Medicaid facilities are more likely to have dementia or Alzheimer's special care units or to exclusively serve people with Alzheimer's disease. A question for further research is how well equipped RCFs are to provide services to people with severe mental illness, intellectual and developmental disabilities, and Alzheimer's disease. Second, Medicaid residents are much more likely to have living arrangements that offer less privacy than non-Medicaid residents. In particular, almost half of Medicaid residents live in multiperson rooms compared to less than a quarter of non-Medicaid residents. Third, although Medicaid reimbursement levels are not available from the survey, data are available on facility charges. Although staffing levels are very similar, non-Medicaid facilities charge substantially more than Medicaid facilities, although the reasons for this difference is not clear. Fourth, and finally, Medicaid residents exhibit more behavioral problems and are prescribed more medications to control those behaviors than are non-Medicaid residents, raising questions about facility staffing and training levels in these facilities.
Introduction and Background
Residential care facilities (RCFs) are important providers of long-term care (LTC) services. RCFs provide services and residential settings for persons with chronic illnesses and physical or mental impairments who need assistance with activities of daily living (ADLs), such as bathing and dressing, and health-related services, such as assistance in managing medications. In 2010, approximately 31,100 RCFs served 733,300 residents of all ages with a wide range of physical and mental impairments (Caffrey et al., 2012; Park-Lee et al., 2011). Most RCFs serve individuals who pay privately, but 43 percent of RCFs have at least one resident whose LTC services are at least partly paid by Medicaid (Park-Lee et al., 2011) , and about a fifth of residents had some of their LTC services paid by Medicaid (Caffrey et al., 2012).
States vary in the degree to which they have developed an array of home and community-based services (HCBS) that include a role for RCFs (Stone & Reinhard, 2007). In 1981, Oregon became the first state to use the Medicaid HCBS waiver program to cover services in residential care settings for older people. Initially, few states followed its lead (O'Keeffe & Wiener, 2005), but by 2009, 41 states used Medicaid to pay for services in RCFs (Carlson et al., 2010). State interest in funding Medicaid services in RCFs is fueled by a desire to offer a full array of HCBS, to reduce nursing home use, to achieve the economies of scale of nursing home care without the undesirable characteristics of institutional care, and to achieve cost savings (O'Keeffe & Wiener, 2005).
Some states view RCFs as an important component of efforts to alter the balance between institutional and HCBS spending (Kane & Cutler, 2008; Wiener & Lutsky, 2001). For example, Oregon and Washington State expanded the provision of services in RCFs specifically to reduce nursing home use and to increase options for individuals with LTC service needs who want to live in the community. Both states now serve more Medicaid beneficiaries in RCFs than they do in nursing homes (Carlson et al., 2010).
States have several options to pay for LTC services in RCFs through the Medicaid program. States can cover personal care services under the Medicaid state plan; home health, private duty nursing, and physical or occupational therapy services in RCFs; residential care services and personal care under Medicaid HCBS waivers; as part of Section 1115 research and demonstration waivers; and under HCBS options established by the Affordable Care Act, including the modified Section 1915(i) of the Social Security Act. Under Medicaid HCBS waivers, Medicaid beneficiaries must meet nursing home level of care criteria, while under the personal care and other options, states may serve a less severely impaired population. Whichever Medicaid coverage mechanism the state uses, it may only pay for services. Federal Medicaid law prohibits payment for room and board except in institutions, such as nursing homes, intermediate care facilities for persons with intellectual and developmental disabilities, and hospitals (O'Keeffe et al., 2010). In 2009, 36 states and the District of Columbia used Medicaid HCBS waivers to cover residential care services (Mollica, 2009); 34 states and the District of Columbia covered personal care under their Medicaid state plan (Eiken, Sredl, Burwell, & Gold, 2010); and seven states used both Medicaid HCBS waivers and state plan personal care to serve Medicaid beneficiaries in RCFs.
An important Medicaid policy concern is whether and how RCFs that serve Medicaid beneficiaries differ from those that do not regarding the type and level of residents' needs and the type and level of services available and provided. The characteristics of the RCFs that can serve Medicaid beneficiaries are determined by a complex interplay of state licensing and regulatory requirements and Medicaid policy. For example, not all states allow RCFs to serve people who need nursing home-level care (e.g., Alaska, Mississippi, Nevada, and Virginia). Moreover, Medicaid beneficiaries are, by definition, relatively low income and are likely to be disproportionately ethnic and racial minorities. If RCFs view these groups as less desirable than higher-income White residents, they may discriminate against these populations and Medicaid beneficiaries may be limited to facilities with fewer services and amenities because only those facilities will take them as has occurred with nursing homes (Smith, Feng, Fennell, Zinn, & Mor, 2007). In addition, although few data are available, Medicaid payment rates in RCFs are believed to be substantially below those of private pay residents. Thus, income-maximizing facilities may not accept Medicaid residents or may limit the number they serve. As a result of lower payment levels, facilities accepting Medicaid residents may also have fewer financial resources to provide physical amenities, services, and staff.
Research Questions
This study has two purposes: (1) to determine whether and how facilities that serve Medicaid beneficiaries differ from those that do not; and (2) to determine whether and how RCF residents receiving Medicaid-covered RCF services differ from residents not receiving these services. Specific research questions are:
-
Do facilities participating in Medicaid differ from non-participating facilities on characteristics such as living arrangements, staffing levels, and costs? Do the characteristics of facilities in which Medicaid beneficiaries live differ from those in which non-Medicaid residents live?
-
What factors predict RCFs' participation in Medicaid?
-
Do Medicaid and non-Medicaid RCF residents differ in demographic characteristics, health and functional status, and service use?
Data
This study uses merged facility and resident data from the 2010 National Survey of Residential Care Facilities (NSRCF), which was sponsored by the U.S. Department of Health and Human Services (the National Center for Health Statistics, the Office of the Assistant Secretary for Planning and Evaluation, the Agency for Healthcare Research and Quality), the U.S. Department of Veterans Affairs, and other federal agencies (Moss, Harris-Kojetin, & Sengupta, 2011). The NSRCF, the first nationally representative survey of United States residential care providers, collected a broad array of data on facilities and residents. To be eligible for the survey, facilities had to be licensed, registered, listed, certified, or otherwise regulated by a state; have four or more beds and at least one resident currently living in the facility; and provide room and board (at least two meals a day), round-the-clock onsite care supervision, and help with ADLs (e.g., bathing, eating, or dressing) or health-related services (e.g., medication management).
Facilities also had to serve primarily an adult population and not exclusively serve people with severe mental illness or people with intellectual and developmental disabilities. Because states vary in how they regulate RCFs, sampled facilities were regulated under many names, including assisted living residences, board and care homes, congregate care facilities, enriched housing programs, homes for the aged, personal care homes, adult care homes, and housing with services establishments.
The NSRCF was conducted between March and November 2010 using a two-stage probability sampling design in which RCFs were sampled first, and then, depending on facility size, 3-6 current residents from each facility were sampled. In-person interviews were conducted with facility directors and designated staff. Information on individual residents was collected from staff knowledgeable about the individual residents; no interviews were conducted with residents. Data were collected on 2,302 facilities and 8,094 current residents. The facility weighted response rate was 81 percent and the resident weighted response rate was 99 percent. We also merged a set of state identifiers based on an RTI-developed typology that identified states based on the type of Medicaid residential care coverage (e.g., state plan personal care, HCBS waiver, both state plan and waiver services, or none) with the survey data. The data merge and analyses were conducted at the Research Data Center of the National Center for Health Statistics, with the help of Research Data Center staff. The Research Data Center has special provisions to protect the confidentiality of respondent facilities and residents.
Methods
For the descriptive analyses, we analyzed frequencies for categorical variables and means for continuous variables and tested the statistical differences using chi-square tests for categorical variables and t-tests for continuous variables. The facility-level logistic regression model estimates the effect of various characteristics (such as staffing levels) on facility participation in Medicaid. For the logistic analysis, we calculate odds ratios and corresponding 95 percent confidence intervals for each of the independent variables included in the model. Differences with probability of 0.05 or less are considered statistically significant and are reported in the text.
We follow National Center for Health Statistics' conventions by presenting only those estimates that are statistically reliable and have at least the minimum appropriate sample size. All analyses are conducted in SUDAAN® Software for Statistical Analysis of Correlated Data (Research Triangle Institute [RTI], 2008). The stratification variables of number of beds and census region, in addition to the final sample weights for the facilities and residents and the sampling design method, were incorporated into the SUDAAN procedures to account for the complex sampling design. Only weighted results are presented. With a few exceptions, differences are reported only when there is a statistically significant difference between the Medicaid and non-Medicaid facilities and residents.
We present data for facilities and residents in total as well as for Medicaid and non-Medicaid facilities and residents. We coded facilities as participating in Medicaid if respondents reported at least one resident had some or all of his or her LTC services paid by Medicaid in the 30-day period prior to the survey. Of the 2,302 RCFs in the sample, 998 facilities had at least one Medicaid resident and 1,292 had none.1 We coded residents as Medicaid residents if the facility staff reported that Medicaid paid for any of their LTC services provided at the facility in the 30-day period prior to the survey.2 Of the 8,094 RCF residents, 1,904 had their LTC paid by Medicaid in the 30-day period preceding the survey.3
Data are presented from several perspectives using different units of analysis so as to provide a full understanding of RCFs and their residents. For analyses of resident characteristics, we analyze the resident file and interpretation is straightforward. A more complex approach is required to fully understand facilities because a large number of RCFs are small (4-10 beds), but only a relatively small proportion of residents live in these facilities. More specifically, 50 percent of RCFs are small, but they serve only 10 percent of residents (Park-Lee et al., 2011). Conversely, although only about half of RCFs are larger than ten beds, they account for 90 percent of residents. Thus, a simple analysis of facilities will give disproportionate weight to the small facilities even though they serve only a small proportion of residents. To address this problem, we show facility characteristics from two perspectives. First, we analyze facility characteristics with the facility as the unit of analysis. Second, to present a perspective that more closely aligns with the number of persons served and to represent the perspective of RCF residents, we also analyze the facility characteristics at the resident level. For these analyses, we match residents with the characteristics of the facilities in which they live and present the facility characteristics with the resident as the unit of analysis. For these types of analyses, we refer to "the facilities in which residents live." This type of analysis can be thought of as facility analyses weighted by the number and type of residents.
Results
How Do Facilities Participating in Medicaid Differ from Facilities Not Participating?
A primary policy concern is whether Medicaid-participating facilities offer similar levels of privacy and services as facilities that do not participate in Medicaid. Therefore, one of this study's goals is to highlight important similarities and differences between Medicaid and non-Medicaid facilities for key characteristics. Our descriptive analyses focus on basic facility characteristics, including living arrangements, admission and discharge policies, services offered by facilities and used by residents, facility charges and the average amount charged to residents, and direct care staffing levels.
Facility Characteristics
Of the weighted 30,967 RCFs for which Medicaid participation data were available, 43 percent of facilities (13,358 facilities) had at least one Medicaid resident and 57 percent (17,609 facilities) had none. (We refer to these facilities as Medicaid and non-Medicaid facilities.)
Table 1a and Table 1b present facility characteristics by Medicaid status. Table 1a presents the data at the facility level, and Table 1b presents the same data at the resident level. There are significant differences between the Medicaid and non-Medicaid facilities on bed size. Specifically, Medicaid facilities are somewhat more likely to be smaller (4-25 beds) than non-Medicaid facilities; 69.4 percent of Medicaid facilities are of this size compared to 62.5 percent of non-Medicaid facilities. Although a large proportion of the RCFs are small, most residents live in large or extra-large facilities; 68.0 percent of Medicaid residents live in large or extra-large facilities compared to 83.5 percent of non-Medicaid residents.
At the facility level, ownership status and chain affiliation did not differ between Medicaid and non-Medicaid participation. However, at the resident level, a significantly higher proportion of non-Medicaid than Medicaid residents live in facilities that are chain-affiliated.
| Residential Care Facilities | Total RCF FacilitiesN=2,302 (%) | Non-Medicaid FacilitiesN=1.292 (%) | Facilities Serving Any Residentson MedicaidN=998 (%) | Significance Test p-value |
|
SOURCE: RTI analysis of the 2010 NSRCF. NOTES:
**p<0.05, ***p<0.001, ns: not significant, p>0.1. |
||||
| Size | ||||
| Small (4-10 beds) | 49.6 | 48.3 | 51.3 | ns |
| Medium (11-25 beds) | 15.9 | 14.2 | 18.1 | ** |
| Large (26-100 beds) | 27.8 | 29.3 | 25.6 | ** |
| Extra-large (over 100 beds) | 6.7 | 8.1 | 4.9 | *** |
| Part of a chain1 | 37.7 | 38.9 | 36.1 | ns |
| Ownership | ||||
| Private, for-profit | 82.4 | 83.3 | 81.2 | ns |
| Private non-profit or state/county/local government | 17.6 | 16.7 | 18.8 | ns |
| Alzheimer's disease services | ||||
| Facility has a dementia or Alzheimer's special care unit or only serves adults with dementia or Alzheimer's disease | 17.3 | 20.2 | 13.5 | *** |
| Facility living quarters2 | ||||
| Rooms or apartments that are rooms designed for one person | 28.0 | 27.7 | 28.4 | ns |
| Rooms or apartments that are rooms designed for two or more persons | 19.6 | 17.2 | 23.7 | ** |
| Rooms or apartments that are studios or 1-3 bedroom apartments | 52.5 | 55.1 | 47.9 | *** |
Only about a fifth of all RCFs (17.3 percent) have dementia or Alzheimer's special care units or only serve individuals with Alzheimer's disease. Statistically significant differences exist between Medicaid and non-Medicaid-participating facilities: 13.5 percent of Medicaid-participating facilities compared to 20.2 percent of non-Medicaid facilities have Alzheimer's disease special care units or only serve Alzheimer's disease residents. Likewise, a statistically significant difference exists between facilities where Medicaid and non-Medicaid residents live. Fewer Medicaid residents live in facilities with dementia or Alzheimer's special care units or facilities that only serve people with Alzheimer's disease: approximately 20 percent of Medicaid residents live in this type of facility whereas about 40 percent of non-Medicaid residents do.
| Characteristics of Facilities Where Residents Live | All ResidentsN=8,094 (%) | Non-Medicaid ResidentsN=6,122 (%) | Medicaid ResidentsN=1,904 (%) | Significance Test p-value |
|
SOURCE: RTI analysis of the 2010 NSRCF. NOTES:
*p<0.1, ***p<0.001, ns: not significant, p>0.1. |
||||
| Size | ||||
| Small (4-10 beds) | 10.3 | 8.7 | 17.2 | *** |
| Medium (11-25 beds) | 9.1 | 7.8 | 14.9 | *** |
| Large (26-100 beds) | 52.1 | 52.8 | 49.5 | ns |
| Extra-large (over 100 beds) | 28.5 | 30.7 | 18.5 | *** |
| Part of a chain1 | 56.0 | 58.3 | 47.2 | *** |
| Ownership | ||||
| Private, for-profit | 74.6 | 74.1 | 78.0 | * |
| Private non-profit or state/county/local government | 25.4 | 25.9 | 22.0 | * |
| Alzheimer's disease services | ||||
| Facility has a dementia or Alzheimer's special care unit or only serves adults with dementia or Alzheimer's disease | 36.5 | 40.3 | 20.0 | *** |
| Resident lives in a: | ||||
| Room designed for one person | 31.6 | 32.8 | 26.6 | *** |
| Room designed for two or more persons | 26.9 | 22.5 | 45.5 | *** |
| Studio or 1-3 bedroom apartment | 41.5 | 44.7 | 27.9 | *** |
One of the policy concerns is whether RCFs offer the level of privacy one would expect in a "homelike" environment and whether the level of privacy offered differs by Medicaid status. For this analysis of living arrangements by payment status, facility units (i.e., rooms and apartments), rather than facilities, are the unit of analysis. The denominator is the number of rooms and apartments across all facilities and the numerator is the number of rooms and apartments across all facilities that are a particular type of living quarter. The majority of all units are apartments (52.5 percent) or rooms designed for one person (28 percent). The remainder of the units (19.6 percent) are living quarters designed for two or more people. Significant differences exist between the Medicaid and non-Medicaid facilities: apartments are less likely to be offered in Medicaid facilities. Approximately 47.9 percent of the units in Medicaid facilities are apartments compared to 55.1 percent of units in non-Medicaid facilities. Further, Medicaid residents live in places that offer less opportunity for privacy. Almost half of Medicaid residents (45.5 percent) live in rooms designed for two or more persons compared to about a quarter (22.5 percent) of non-Medicaid residents.
Admission and Discharge Policies
Facility admission and discharge policies largely determine who lives in these settings. These policies are determined by a combination of facility preferences, state regulations, and for RCFs serving Medicaid residents, Medicaid regulations and contract requirements. Although states give facilities some flexibility over admissions and discharges, RCFs may have little or no discretion on certain policies. For example, if state regulations prohibit RCFs from serving individuals who need skilled nursing care or who cannot self-evacuate the facility in an emergency, then RCFs will not be able to admit or retain these individuals. On the other hand, many states allow RCFs to determine whether they can safely and adequately serve--and continue to serve--residents with high levels of need. In addition, facilities may decide to waive certain general policies for particular individuals.
Table 2a presents data on admission policies for all RCFs and for RCFs by Medicaid status at the facility level. Table 2b presents similar data but at the resident level (i.e., facilities in which the residents live). A high percentage of RCFs admit individuals who are regularly incontinent of urine (81.6 percent) and who need daily health monitoring (81.3 percent). A smaller but still large percentage admit individuals who are regularly incontinent of feces (68.9 percent), require end-of-life care (61.5 percent), are unable to leave the facility in an emergency without help (56.3 percent), and have moderate to severe cognitive impairment (55.3 percent). A smaller percentage of facilities admit individuals with behavior problems (40.0 percent), need a two-person assist to get in and out of bed (32.7 percent), or require skilled nursing care (20.4 percent).
| Residential Care Facilities | Total RCF FacilitiesN=2,302 (%) | Non-Medicaid FacilitiesN=1.292 (%) | Facilities Serving Any Residents on MedicaidN=998 (%) | Significance Test p-value |
|
SOURCE: RTI analysis of the 2010 NSRCF. *p<0.1, **p<0.05, ***p<0.001, ns: not significant, p>0.1. |
||||
| Facility Admission Policies | ||||
| Facilities will admit residents who: | ||||
| Are unable to leave the facility in an emergency without help | 56.3 | 59.4 | 52.2 | ** |
| Have moderate to severe cognitive impairment | 55.3 | 56.3 | 54.1 | ns |
| Need skilled nursing care on a regular basis | 20.4 | 17.5 | 24.2 | *** |
| Need daily monitoring for a health condition | 81.3 | 78.1 | 85.7 | *** |
| Are regularly incontinent of urine | 81.6 | 83.9 | 78.5 | ** |
| Are regularly incontinent of feces | 68.9 | 72.4 | 64.2 | *** |
| Need two people/Hoyer lift to help them get in and out of bed | 32.7 | 32.7 | 32.6 | ns |
| Exhibit problem behavior | 40.0 | 36.0 | 35.9 | ns |
| Have history of drug or alcohol abuse | 45.5 | 43.8 | 47.8 | ** |
| Require end-of-life care | 61.5 | 63.4 | 58.7 | * |
The admissions policies of Medicaid and non-Medicaid facilities show a similar pattern as for RCFs overall. However, there are statistically significant differences between Medicaid and non-Medicaid facilities on several admission policies. A higher proportion of Medicaid facilities admit individuals who need skilled nursing on a regular basis or daily monitoring for a health condition, or who have a history of alcohol or drug abuse. On the other hand, a higher proportion of non-Medicaid facilities report admitting residents who are unable to leave the facility in an emergency without help and who are regularly incontinent of urine or feces. There are no statistically significant differences between Medicaid and non-Medicaid facilities on the remaining admission policies.
| Residential Care Facilities Where Residents Live | All ResidentsN=8,094 (%) | Non-Medicaid ResidentsN=6,122 (%) | Medicaid ResidentsN=1,904 (%) | Significance Test p-value |
|
SOURCE: RTI analysis of the 2010 NSRCF. *p<0.1, **p<0.05, ***p<0.001, ns: not significant, p>0.1. |
||||
| Residents Living in Facilities with the Following Admission Policies | ||||
| Facilities will admit residents who: | ||||
| Are unable to leave the facility in an emergency without help | 53.2 | 54.8 | 45.9 | ** |
| Have moderate to severe cognitive impairment | 49.6 | 50.8 | 44.4 | * |
| Need skilled nursing care on a regular basis | 11.6 | 10.6 | 15.9 | ** |
| Need daily monitoring for a health condition | 85.0 | 83.8 | 90.5 | *** |
| Are regularly incontinent of urine | 78.6 | 79.1 | 76.8 | ns |
| Are regularly incontinent of feces | 62.5 | 63.7 | 58.1 | ** |
| Need two people/Hoyer lift to help them get in and out of bed | 26.0 | 26.3 | 28.4 | ns |
| Exhibit problem behavior | 32.8 | 33.2 | 31.1 | ns |
| Have history of drug or alcohol abuse | 50.1 | 49.4 | 54.1 | ns |
| Require end-of-life care | 59.4 | 60.9 | 53.5 | ** |
The patterns of admission policies of the facilities where Medicaid and non-Medicaid residents live are similar to those at the facility level. However, the differences regarding policies on admitting residents who are regularly incontinent (urine) and those with substance abuse problems are not statistically significant.
Discharge policies are important because they determine whether residents whose needs change over time can age in place. Some discharge criteria mirror admission criteria. If regulations do not allow RCFs to serve individuals with certain conditions, this prohibition applies to both admissions and retentions. As with admission policies, beyond regulatory constraints, facilities have substantial discretion about whether to retain residents who develop specific impairments or become more severely impaired.
Table 3a and Table 3b present data on discharge policies for all RCFs and RCFs by Medicaid status. Table 3a shows the data at the facility level and Table 3b presents the same data for facilities in which the residents live (the resident level). More than half (56.5 percent) of all RCFs discharge residents who need skilled nursing care on a regular basis. A somewhat smaller percentage discharge individuals who need a two-person assist to get in and out of bed (43.7 percent), those with behavior problems (42.9 percent), and those who have a history of drug or alcohol abuse (33.9 percent). Fewer facilities discharge individuals who have moderate to severe cognitive impairment (18.3 percent), are unable to leave the facility in an emergency without help (14.7 percent), and those who are regularly incontinent of feces (12.5 percent). A small percentage of RCFs discharge residents who require end-of-life care (8.8 percent), those who need daily health monitoring (8.0 percent), and those who are regularly incontinent of urine (5.3 percent).
| Residential Care Facilities | Total RCF FacilitiesN=2,302 (%) | Non-Medicaid FacilitiesN=1.292 (%) | Facilities Serving Any Residents on MedicaidN=998 (%) | Significance Test p-value |
|
SOURCE: RTI analysis of the 2010 NSRCF. NOTES: Estimate cannot be assumed to be reliable. Sample size is between 30 and 59, and/or the sample size is greater than 59 but has a relative standard error of 30% or more. **p<0.05, ***p<0.001, ns: not significant, p>0.1. |
||||
| Facility Discharge Policies | ||||
| Facilities will discharge residents who: | ||||
| Are unable to leave the facility in an emergency without help | 14.7 | 14.1 | 15.4 | ns |
| Have moderate to severe cognitive impairment | 18.3 | 18.1 | 18.5 | ns |
| Need skilled nursing care on a regular basis | 56.5 | 60.3 | 51.5 | ** |
| Need daily monitoring for a health condition | 8.0 | 10.1 | 5.4 | *** |
| Are regularly incontinent of urine | 5.3 | 4.3 | 6.6 | *** |
| Are regularly incontinent of feces | 12.5 | 10.6 | 15.0 | *** |
| Need two people/Hoyer lift to help them get in and out of bed | 43.7 | 42.9 | 44.7 | ns |
| Exhibit problem behavior | 42.9 | 42.4 | 43.6 | ns |
| Have history of drug or alcohol abuse | 33.9 | 33.7 | 34.2 | ns |
| Require end-of-life care | 8.8 | 8.0 | 9.9 | ** |
Medicaid and non-Medicaid facilities have similar discharge policies but there are statistically significant differences on several policies. A smaller proportion of Medicaid RCFs discharge residents who need skilled nursing care (51.5 percent compared to 60.3 percent of non-Medicaid facilities) and daily monitoring for health conditions (5.4 percent compared to 10.1 percent of non-Medicaid facilities), but a larger proportion of Medicaid RCFs discharge residents who become regularly incontinent of urine (4.3 percent compared to 6.6 percent of non-Medicaid facilities), incontinent of feces (10.6 percent compared to 15.0 percent) or who need end-of-life care (8.8 percent compared to 9.9 percent of non-Medicaid facilities). Although statistically significant, the absolute percentage differences are not large, except for policies regarding discharge of residents who need skilled care.
| Residential Care Facilities Where Residents Live | All ResidentsN=8,094 (%) | Non-Medicaid ResidentsN=6,122 (%) | Medicaid ResidentsN=1,904 (%) | Significance Test p-value |
|
SOURCE: RTI analysis of the 2010 NSRCF. **p<0.05, ***p<0.001, ns: not significant, p>0.1. |
||||
| Residents Living in Facilities with the Following Discharge Policies | ||||
| Facilities will discharge residents who: | ||||
| Are unable to leave the facility in an emergency without help | 16.7 | 16.3 | 18.2 | ns |
| Have moderate to severe cognitive impairment | 23.5 | 23.5 | 23.8 | ns |
| Need skilled nursing care on a regular basis | 66.4 | 67.3 | 62.4 | ns |
| Need daily monitoring for a health condition | 5.5 | 6.2 | 2.5 | *** |
| Are regularly incontinent of urine | 6.2 | 6.1 | 7.0 | ns |
| Are regularly incontinent of feces | 16.4 | 15.8 | 18.8 | ns |
| Need two people/Hoyer lift to help them get in and out of bed | 52.2 | 51.4 | 55.7 | ns |
| Exhibit problem behavior | 46.3 | 45.5 | 49.8 | ns |
| Have history of drug or alcohol abuse | 27.9 | 27.2 | 31.1 | ** |
| Require end-of-life care | 6.7 | 5.8 | 10.8 | *** |
Discharge policies are largely the same for the facilities where Medicaid and non-Medicaid residents live; however, there are a few differences, all of which are statistically significant. Fewer facilities serving Medicaid residents report that they will discharge residents who need daily monitoring for a health condition (2.5 percent of facilities in which Medicaid residents live compared to 6.2 percent of RCFs serving non-Medicaid residents). Almost a third (31.1 percent) of Medicaid residents live in facilities that will discharge residents who have substance abuse problems compared to just over a quarter of the facilities in which non-Medicaid residents live (27.2 percent). The proportion of Medicaid residents who live in facilities that will discharge residents who require end-of-life care (10.8 percent) is twice that of non-Medicaid residents (5.8 percent).
Services: Provided and Used
A major policy question is whether RCFs that serve Medicaid residents offer the same type and level of services as RCFs that do not serve Medicaid beneficiaries and whether Medicaid residents use the same services as non-Medicaid residents. Table 4a and Table 4b present services offered by all RCFs and by Medicaid status. The table is divided into two sections. Table 4a presents the data at the facility level and Table 4b includes the same data, but is for facilities in which the residents live (i.e., the resident level). Data show that almost all RCFs--between 93.4 percent and 99.4 percent--provide basic health monitoring, incontinence care, and assistance with ADLs. In contrast, fewer than half of RCFs provide skilled professional services (nursing, occupational and physical therapy, and counseling), and only 57.2 percent provide case management. Fewer facilities provide transportation to educational programs (26.7 percent); transportation to a sheltered workshop, work training program, or supported employment (19.4 percent); or social services counseling (34.6 percent).
| Services Offered by Facility1 | Total RCF FacilitiesN=2,302 (%) | Non-Medicaid FacilitiesN=1.292 (%) | Facilities Serving Any Residents on MedicaidN=998 (%) | Significance Test p-value |
|
SOURCE: RTI analysis of the 2010 NSRCF. NOTES:
*p<0.1, **p<0.05, ***p<0.001, ns: not significant, p>0.1. |
||||
| Special diets | 92.6 | 92.9 | 92.2 | ns |
| Skilled nursing | 38.8 | 31.0 | 49.1 | *** |
| Basic health monitoring | 96.2 | 94.9 | 97.8 | ** |
| Assistance with ADLs | 99.4 | 99.5 | 99.2 | ns |
| Incontinence care | 93.4 | 94.3 | 92.2 | * |
| Social/recreational activities in the facility | 98.8 | 98.5 | 99.2 | ns |
| Social/recreational activities outside the facility | 78.8 | 76.8 | 81.3 | ** |
| Transportation to medical appointments | 80.7 | 81.4 | 79.8 | ns |
| Transportation to stores/elsewhere | 75.0 | 74.5 | 75.6 | ns |
| Transportation to educational programs | 26.7 | 23.7 | 30.7 | ** |
| Transportation to a sheltered workshop/work training program/supported employment | 19.4 | 15.4 | 24.7 | *** |
Services offered by facilities are generally the same by Medicaid status and when differences exist, a higher proportion of Medicaid RCFs provide the service. Of note, 49.1 percent of Medicaid RCFs provide skilled nursing services compared to only 31.0 percent of non-Medicaid RCFs, a statistically significant difference.
More statistically significant differences exist at the resident level. A statistically significantly higher proportion of Medicaid residents than non-Medicaid residents use each of the services listed, with the exception of ADL assistance and social and recreational activities inside and outside the facility. The survey did not collect data at the resident level for several services: transportation to educational programs or a sheltered workshop, work training program, or supported employment; case management services; and occupational and physical therapies.
| Services Used by Residents1 | All ResidentsN=8,094 (%) | Non-Medicaid ResidentsN=6,122 (%) | Medicaid ResidentN=1,904 (%) | Significance Test p-value |
|
SOURCE: RTI analysis of the 2010 NSRCF. NOTES:
*p<0.1, **p<0.05, ***p<0.001, ns: not significant, p>0.1. |
||||
| Social services counseling | 34.6 | 28.6 | 42.5 | *** |
| Case management services | 57.2 | 54.2 | 61.0 | ** |
| Occupational therapy | 40.0 | 41.1 | 39.1 | ns |
| Physical therapy | 43.9 | 43.0 | 45.0 | ns |
| Personal laundry | 99.3 | 99.2 | 99.5 | ns |
| Linen laundry services | 97.1 | 97.2 | 97.0 | ns |
| Special diets | 30.7 | 28.8 | 38.5 | *** |
| Skilled nursing | 12.6 | 11.1 | 18.7 | *** |
| Basic health monitoring | 75.1 | 74.0 | 80.8 | *** |
| Assistance with ADLs | 69.2 | 69.1 | 70.6 | ns |
| Incontinence care | 37.6 | 37.2 | 40.4 | * |
| Transportation to medical appointments | 58.9 | 55.6 | 72.4 | *** |
| Transportation to stores/elsewhere | 39.3 | 37.8 | 45.3 | *** |
| Social service counseling | 15.8 | 12.5 | 29.9 | *** |
| Personal laundry | 86.6 | 84.9 | 94.4 | *** |
| Linen laundry services | 84.4 | 83.5 | 88.6 | ** |
| Social/recreational activities in the facility | 80.3 | 80.9 | 78.5 | ns |
| Social/recreational activities outside the facility | 44.7 | 44.3 | 46.8 | ns |
Staffing Characteristics
Residential care is largely a service provided by direct care staff. Thus, the availability of staff may be an important indicator of how well facilities meet the needs of their residents. The NSRCF asked about the total number of hours of direct resident care each type of staff worked in the past seven days. Work hours were collected for personal care aides, licensed practical nurses/licensed vocational nurses (LPNs/LVNs), registered nurses (RNs), and the administrator, if he or she provides direct care to residents. The survey collected data on the number of hours of direct care provided by administrators because in small facilities--which make up half of RCFs--administrators often provide a substantial portion of direct care to residents. However, because the administrators' hours are estimates of the amount of time they spend on direct care rather than management tasks, their staff hours may be less accurate than for other staff whose sole job is to provide resident care.
Figure 1 provides data on the average number of hours of direct staff care provided in Medicaid and non-Medicaid facilities. Care hours are provided for all staff combined and for four staff categories--RNs, LPNs/LVNs, personal care aides, and administrators. The top chart shows staffing with facilities as the unit of analysis. This chart shows that there are no statistically significant differences in the mean hours of care provided by all direct care staff per resident per day between Medicaid and non-Medicaid facilities at the facility level.
FIGURE 1. Direct Care Staffing: Facility Level and Facilities Where Residents Live, Average Hours per Resident Day, by Medicaid Status
Facility Level Analysis
For the chart on facilities serving any residents on Medicaid, differences are not statistically significant at p<0.05.
Facilities in Which Residents Live
For the chart on facilities where Medicaid and non-Medicaid residents live, all differences are statistically significant at p<0.05 or less.
SOURCE: RTI International analysis of the NSRCF.
The bottom chart in the figure shows the average number of direct care hours per resident per day in the facilities in which residents live. The resident is the unit of analysis in the second chart. Overall, staffing levels for all direct care staff are much lower if the unit of analysis is residents rather than facilities. For facilities in which residents live, the difference in the number of total direct care staff hours by resident Medicaid status is statistically significant but the difference is small (2.5 hours per resident per day for Medicaid residents compared to 2.3 hours per resident per day for non-Medicaid residents).
The figure also shows that, at the facility level, the mean number of personal care aide hours and total nursing care hours (i.e., LPN and RN hours) do not differ by Medicaid status. At the resident level, however, the differences for these staffing categories are statistically significant, with the facilities in which Medicaid residents live having higher average staffing levels. The differences, however, are small: 0.3 hours per resident per day of total nursing care (LPN/LVN and RN) for non-Medicaid residents compared to 0.2 hours per resident per day for Medicaid residents, and 1.9 hours of personal care hours for Medicaid residents compared to 1.8 hours for non-Medicaid residents.
With the facility as the unit of analysis, the average direct care hours per resident per day provided by facility administrators are somewhat higher in Medicaid RCFs (1.1 hours) than in non-Medicaid RCFs (0.8 hours); however, the difference is not statistically significant. This difference also exists in facilities where Medicaid residents live; on average, administrators provide a higher number of hours of direct care per resident per day (0.4 hours per resident per day) than in facilities where non-Medicaid residents live (0.2 hours per resident per day), a statistically significant difference. This difference in administrator hours by Medicaid status likely occurs because a larger proportion of the Medicaid facilities are small facilities, with relatively few staff other than the administrator.
Facility Charges
One reason RCFs are attractive to residents and state policy makers is that they charge less than nursing homes. Although Medicaid cannot cover room and board in these facilities, it can cover services in RCFs. The NSRCF facility survey collected the average monthly base rate facilities generally charge residents, but it did not collect information on Medicaid payment rates.4 Among facilities, the mean of the average monthly base rate for a single individual living in a one-bedroom apartment (not designated as special dementia units) is $3,284, almost $500 higher than that for a single individual living in room designed for one person (not shown).5 In addition to this base rate, facilities often charge fees for additional services that are not a part of the base rate. For each resident sampled, the NSRCF also collected data on the total amount individual residents were charged, which includes the base rate as well as any charges for additional services the resident received.6 The average total charge for residents in RCFs regardless of living arrangement is $3,166.
Figure 2 presents the average monthly base rate charged by the facility for a one-bedroom apartment and a private room (not designated as special dementia units), by Medicaid status (the chart on the left).7 In addition, the figure presents, at the resident level, the average amount charged the sampled residents in the month prior to the survey, by Medicaid status (the chart on the right). Again, actual Medicaid reimbursement amounts are not available at either the facility or resident level. The monthly rate charged for a single individual living in a one-bedroom apartment or private room is significantly higher in non-Medicaid RCFs ($3,500 and $2,993, respectively) than in Medicaid RCFs ($2,912 for a one-bedroom apartment and $2,587 for a private room). Similarly, at the resident level, the average total charge to non-Medicaid residents in the month before the survey is significantly higher than the charge to Medicaid residents: non-Medicaid residents were charged approximately $1,200 per month more. These differences are statistically significant at both the facility and resident level.
FIGURE 2. Average Base Rate at the Facility Level and Average Total Amount Facility Charged Residents in the Month Prior to the Survey, by Medicaid Status
SOURCE: RTI International analysis of the NSRCF.
NOTE: Differences shown are statistically significant at p<0.001.
Multivariate Analysis: Predicting Residential Care Facilities' Participation in Medicaid
To better understand the predictors of facility participation in Medicaid, we conducted multivariate analyses of factors that were hypothesized to be related to serving Medicaid residents. The dependent variable for this analysis is the bivariate variable indicating facility Medicaid participation, which is defined as a facility serving at least one resident whose LTC services are paid by Medicaid. Medicaid participation is coded zero if the facility reports that it does not have residents whose LTC services are paid by Medicaid and one if the facility reports that it does. The multiple logistic regression model used in our analysis is:
Facility Medicaid Participation = intercept +state RCF Medicaid coverage category + the number of residential care beds + the total direct staff hours per resident day (HPRD) ratio + MSA + facility chain status + private/for-profit ownership + high privacy facility + percentage of residents with short-term memory problems or disoriented all or most of the time during the last 7 days + error term
Because the multivariate analysis is conducted at the facility level, the direct staff ratio used in the model is at the facility level.
Table 5 presents descriptive data for the variables used in the multivariate analysis, by Medicaid payment status. States are categorized by Medicaid coverage of RCFs: whether the state Medicaid program covers residential care with HCBS waivers, state plan personal care, both, or neither, with neither as the reference category. Most facilities are located in states where Medicaid HCBS cover services in RCFs.8 Facilities have an average of slightly more than 30 beds, an average direct care ratio of 4.2 hours per resident per day. In addition, most facilities are located in Metropolitan Statistical Areas (MSAs), are not part of a chain, and have for-profit ownership. Facilities are about evenly split between high-privacy and low-privacy living arrangements. In the average facility, almost half of residents have some signs of cognitive impairment. Facilities serving Medicaid residents statistically significantly differ from facilities not serving Medicaid residents on all of the variables used in the regression model, except for staffing levels and ownership type.
| Model Predictive Variables | Total RCF FacilitiesN=2,302 (% or mean2); | Non-MedicaidFacilitiesN=1.292 (% or mean2) | Facilities Serving Any Residents on MedicaidN=998 (% or mean2) | Significance Test p-value1 |
|
SOURCE: RTI analysis of the 2010 NSRCF. NOTES:
**p<0.05, ***p<0.001, ns: not significant, p>0.1. |
||||
| State Medicaid RCF coverage category | ||||
| HCBS waivers only | 59.9% | 66.9% | 50.8% | *** |
| State plan personal care only | 13.4% | 10.0% | 17.6% | *** |
| Both HCBS waivers and state plan personal care | 15.6% | 9.0% | 24.2% | *** |
| Neither HCBS waivers nor state plan personal care | 11.1% | 14.1% | 7.4% | *** |
| Number of RCF beds | 31.3 | 34.5 | 26.8 | *** |
| Direct care staff ratio3 | 4.2 | 4.2 | 4.1 | ns |
| Located in a MSA | 80.5% | 85.8% | 73.7% | *** |
| Part of a chain4 | 37.7% | 38.9% | 36.1% | ns |
| Private, for-profit | 82.4% | 83.3% | 81.2% | ns |
| High-privacy (>80% of units are single rooms or apartments) | 46.7% | 49.1% | 43.8% | ** |
| Percent of residents with short-term memory problems or are disoriented all or most of the time during the last 7 days | 43.8% | 48.0% | 38.3% | *** |
In our logistic regression model, we hypothesize that type of Medicaid coverage of RCFs services will be significant predictors of facility participation in Medicaid. In general, our expectations are that Medicaid participation will be associated with lower cost, including smaller facilities, lower direct care staffing ratio, location outside of a MSA, not being part of a chain, for-profit ownership, lower privacy in living arrangements, and lower prevalence of people with Alzheimer's disease and other dementias.
Table 6 presents the odds ratios and confidence intervals for the full model. The R2 for the model is 10.3 percent, which suggests that most of the variation is accounted for by variables not in the model. The Medicaid state plan personal care and the category representing states with both HCBS waiver and personal care coverage were statistically significant predictors of Medicaid participation. Somewhat surprisingly, coverage of RCF services only through HCBS waivers was not a statistically significant predictor of Medicaid participation, suggesting that the need to serve persons with a nursing home level of care may be a deterrent to participation.
| Model Predictive Variables | Odds Ratios (95% confidence interval) | Significance Test p-value1 |
|
SOURCE: RTI analysis of the 2010 NSRCF. NOTES:
*p<0.1, **p<0.05, ***p<0.001, ns: not significant, p>0.1. |
||
| Intercept | 1.61 (0.95, 2.73) | * |
| Medicaid coverage category | ||
| HCBS waivers only | 1.32 (0.88, 1.98) | ns |
| State plan personal care only | 2.57 (1.65, 4.00) | *** |
| Both HCBS waivers and state plan personal care | 5.12 (3.17, 8.28) | *** |
| Neither HCBS waivers nor state plan personal care | ref | --- |
| Number of residential beds | 0.99 (0.99, 1.00) | *** |
| Direct care staff ratio2 | 0.98 (0.95, 1.02) | ns |
| Located in a MSA | 0.48 (0.38, 0.61) | *** |
| Part of a chain3 | 1.17 (0.93, 1.47) | ns |
| Private, for-profit ownership (vs. private non-profit or state/county/local government) | 0.88 (0.68, 1.16) | ns |
| High-privacy (>80% of units are private, i.e., for 1 person) | 0.86 (0.69, 1.08) | ns |
| Percent of residents with short-term memory problems or are disoriented all or most of the time during the last 7 days | 0.99 (0.99, 1.00) | *** |
| Model Fit | R2 = 0.103990 | --- |
The odds that a facility will participate in Medicaid are lower if the facility is located in an urban area. Higher incomes in urban areas may contribute to residents or their families being better able to pay higher rates, making facilities less willing to participate in Medicaid where the payment rates are believed to be lower. The odds of participating in Medicaid decrease as the percentage of residents with short-term memory problems or who are confused or disoriented most of the time in the last seven days increases. In other words, the higher the number of residents with short-term memory problems, most likely associated with Alzheimer's disease, the less likely the facility is to participate in Medicaid. Moreover, the odds of a facility participating decrease as the average number of residential care beds in the facility increases (i.e., the larger the facility, the less likely it is to accept Medicaid residents). The direct care staff ratio, for-profit ownership, being part of a chain, and having a high percentage of high-privacy units were not statistically significant predictors of Medicaid participation.
How Do Medicaid and Non-Medicaid Residential Care Facility Residents Differ?
One goal of this study is to highlight similarities and differences between Medicaid and non-Medicaid residents. This section presents data on important resident demographic characteristics, health and functional status, and service use. Because the NSRCF was designed primarily to gather information on facilities oriented toward older people, settings that exclusively served people with severe mental illness or people with intellectual and developmental disabilities were excluded. As a result, the survey sample does not include a large number of younger people with mental illness and intellectual and developmental disabilities who live in residential care. Thus, the data below describe a large portion, but not all people living in residential care.
Resident Demographic, Health, and Functional Characteristics
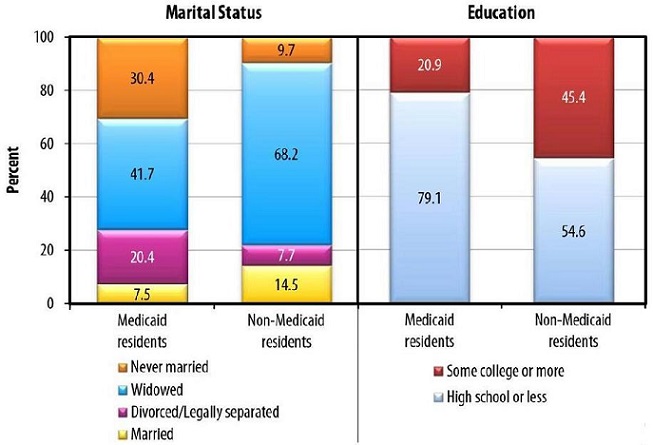
FIGURE 3. Resident Characteristics, by Medicaid Status
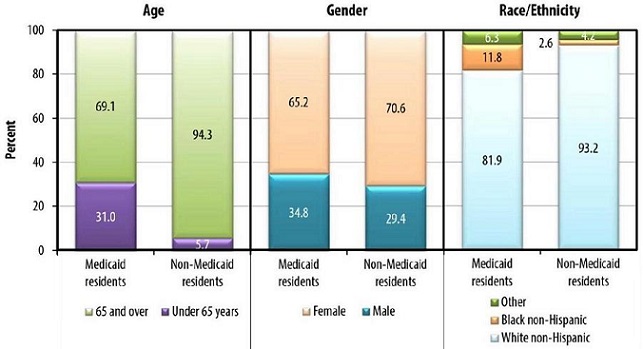
SOURCE: RTI International analysis of the NSRCF.
NOTE: Differences shown are statistically significant at p<0.05.
Of the estimated 727,125 RCF current residents in 2010, 137,655 residents (19 percent) had their LTC services paid by Medicaid in the 30-day period preceding the survey. Figure 3 compares Medicaid and non-Medicaid residents on five demographic characteristics. Non-Medicaid residents are older than Medicaid residents--94.3 percent are 65 years or older compared to 69.1 percent of Medicaid residents; only 5.7 percent of non-Medicaid residents are under age 65, whereas 31.0 percent of Medicaid residents are non-elderly. A larger proportion of Medicaid residents than non-Medicaid residents are male, minority, and unmarried. Medicaid residents are less well-educated than non-Medicaid residents. Almost four-fifths (79.1 percent) of Medicaid residents had a high school education or less compared to about half (54.6 percent) of non-Medicaid residents. All of these differences are statistically significant.
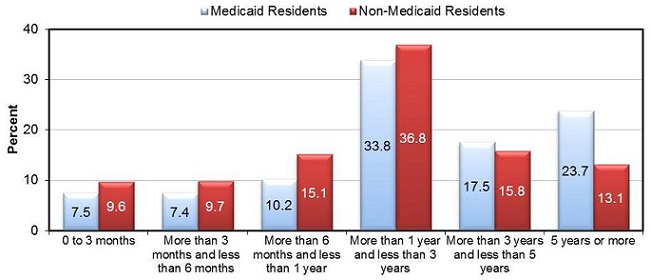
Medicaid residents generally have longer length of stay (LOS) than do non-Medicaid residents, especially among people with very long LOS (Figure 4). About a quarter (23.7 percent) of Medicaid residents have stays in excess of five years compared to 13.1 percent of non-Medicaid residents, a statistically significant difference.
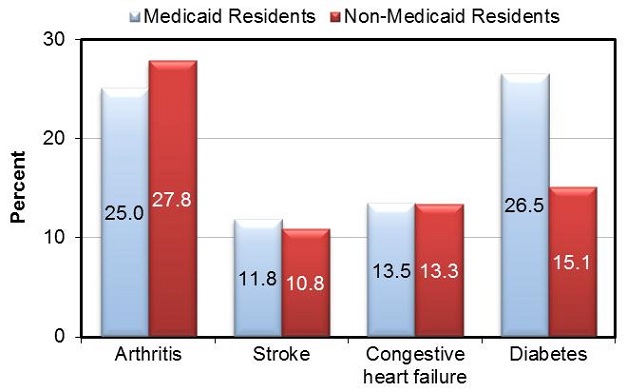
FIGURE 5. Resident Health Conditions, by Medicaid Status
SOURCE: RTI International analysis of the NSRCF.
NOTE: Differences for comparisons for residents with diabetes, by Medicaid status are statistically significant at p<0.001. Other comparisons are not statistically significant at p<0.05 or less.
Figure 5 presents data showing whether a doctor or other health professional ever told residents whether they had four common chronic health conditions: arthritis, stroke, congestive heart failure, and diabetes. Medicaid and non-Medicaid residents differ very little with respect to these health conditions, with the exception of diabetes. A higher proportion of Medicaid than non-Medicaid residents have diabetes (26.5 percent compared to 15.1 percent), a statistically significant difference. The reasons for this difference are unclear, but one possible explanation is that Medicaid residents are more likely to be minorities who have a higher prevalence of type 2 diabetes (Centers for Disease Control & Prevention, 2011).
FIGURE 6. Residential Care Facility Residents' Cognitive and Mental Health, by Medicaid Status
SOURCE: RTI International analysis of the NSRCF.
NOTE: Differences shown are statistically significant at p<0.001.
The NSRCF excluded facilities that exclusively serve individuals with intellectual disabilities or serious mental illness, but a small proportion of the sampled residents have these conditions. As shown in Figure 6, a significantly higher proportion of Medicaid than non-Medicaid residents have intellectual disabilities or serious mental illness. On the other hand, a significantly higher proportion of non-Medicaid than Medicaid residents have Alzheimer's disease or other dementias, reflecting the greater proportion of individuals aged 75 and older among non-Medicaid residents. These differences are statistically significant.
FIGURE 7. Residential Care Facility Residents: ADL Limitations, by Medicaid Status
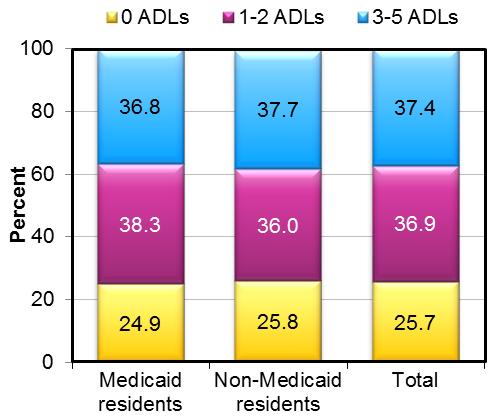
SOURCE: RTI International analysis of the NSRCF.
NOTE: Differences are not statistically significant at p<0.05 or less.
FIGURE 8. Residential Care Facility Residents: IADL Limitations, by Medicaid Status
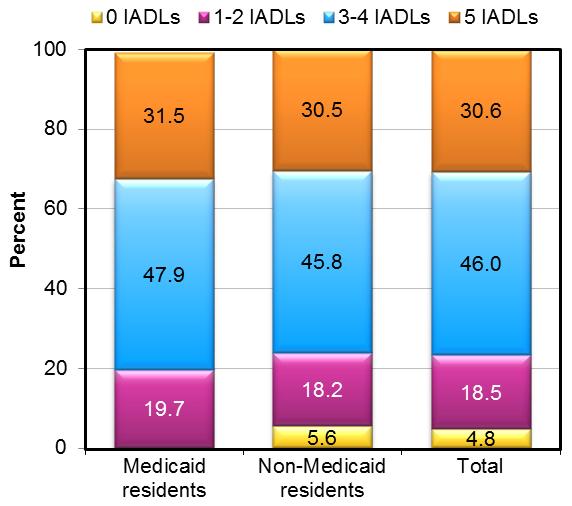
SOURCE: RTI International analysis of the NSRCF.
NOTES: The proportion of Medicaid residents with no IADL limitations is not displayed because the sample size is too small (n<30) to report by National Center for Health Statistics Standards. Differences shown are not statistically significant at p<0.05 or less.
Three-quarters of all residents have limitations in ADLs, with 37.4 percent having three or more. The mean number of ADL limitations for all residents is 1.9 and the mean number of instrumental activity of daily living (IADL) limitations is 3.5 (not shown). Figure 7 and Figure 8 show that virtually no differences by Medicaid status exist in the distribution of the number of ADL and IADL limitations.9 On these two measures, Medicaid and non-Medicaid residents appear to be about equally disabled.
Resident Behavior Problems
Given the high proportion of RCF residents with cognitive impairment, Alzheimer's disease, intellectual and developmental disabilities, and serious mental illness, behavior issues are common in RCFs. The NSRCF asked whether, in the past 30 days, residents exhibited any of the following behaviors: refusing to take prescribed medicines; creating disturbances or being excessively noisy; wandering; refusing to bathe or clean him or herself; rummaging through or taking other people's belongings; damaging or destroying property; verbally threatening staff or other residents; being physically aggressive toward others; removing clothing in public; or making unwanted sexual advances toward staff or other residents.
As shown in Figure 9, there are significant differences in the proportion of Medicaid and non-Medicaid residents who exhibit specific behavior problems. A significantly higher proportion of Medicaid residents exhibit each of the behaviors asked about in the survey except refusing to take prescribed medicines and removing clothing in public. Approximately half of the Medicaid residents (49.5 percent) exhibited at least one of the problem behaviors in the 30 days prior to the survey compared to just over a third of the non-Medicaid residents (34.8 percent), which is a statistically significant difference. Among persons with behavior issues, a significantly higher proportion of Medicaid than non-Medicaid residents were prescribed medication to control the behavior or to reduce agitation--62.6 percent of Medicaid residents compared to 55.5 percent of non-Medicaid residents.
FIGURE 9. RCF Residents: Resident Behaviors, by Medicaid Status
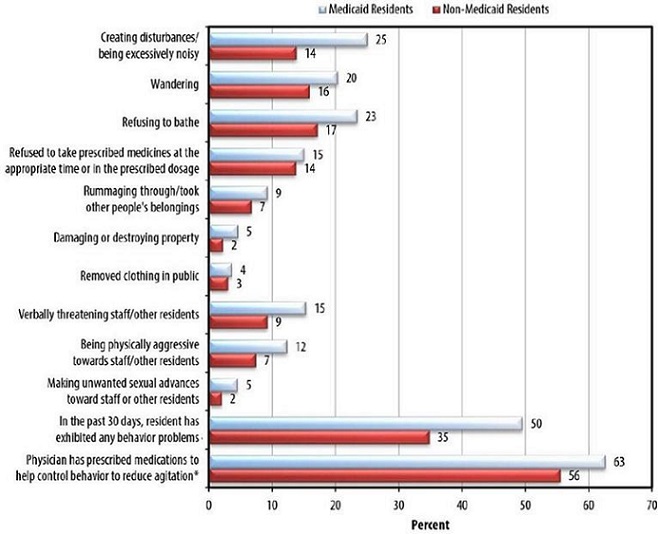
SOURCE: RTI International analysis of the NSRCF.
NOTES: Differences shown are statistically significant at p<0.001 or less, with the exception of wandering, rummaging through others belongings and physician has prescribed medication to control behaviors, which are statistically significant at p<0.05 or less. Differences shown for refusing to take prescribed medication at the appropriate time or in the prescribed dose and removing clothing in public are not statistically significant.*Only for residents who had at least one of the behaviors show in the figure.
Summary and Conclusions
An important goal of the Medicaid program is for lower-income Medicaid beneficiaries to receive mainstream care--that is, to receive roughly the same care as non-Medicaid beneficiaries. Although most people living in RCFs pay privately, 43 percent of RCFs have at least one resident for whom Medicaid pays their LTC services and Medicaid pays for at least some of the LTC services of 19 percent of residents. This study uses the 2010 NSRCF to examine whether Medicaid and non-Medicaid-participating RCFs and Medicaid and non-Medicaid residents differ, and if so, on what characteristics.
Medicaid vs. Non-Medicaid Facilities
Medicaid facilities are roughly similar to non-Medicaid facilities on many characteristics, with a few important exceptions. Medicaid facilities are smaller than non-Medicaid facilities, and a higher proportion of Medicaid than non-Medicaid residents live in facilities with 4-25 beds. Only about a fifth of RCFs nationally reportedly have a dementia or Alzheimer's special care unit or only serve residents with Alzheimer's disease; however, a higher proportion of these are non-Medicaid than Medicaid facilities, reflecting the younger age of Medicaid residents who are less likely to have dementia.
An important difference between Medicaid and non-Medicaid-participating facilities is that the living quarters of Medicaid facilities offer less privacy than non-Medicaid facilities. A large majority of the living quarters in non-Medicaid facilities (82.8 percent) are apartments or rooms designed for one person compared to about three-quarters of the units in Medicaid facilities (76.3 percent). Even with this differential, most of the units in Medicaid facilities are designed for one person. The difference in living arrangements at the resident level is larger. Although 77.5 percent of non-Medicaid residents live in apartments or rooms designed for one person, 54.5 percent of Medicaid residents live in that type of setting.
Whether a Medicaid-eligible individual is served in a nursing home or an RCF depends on a complex interplay of the supply of nursing home beds and occupancy rates, a state's nursing home level of care criteria, and whether RCFs can admit or retain people who need a nursing home level of care. Analyses show that the admission and discharge policies are largely the same for Medicaid and non-Medicaid facilities. Nevertheless, a larger proportion of non-Medicaid RCFs admit residents who are unable to leave the facility in an emergency without help, are regularly incontinent, and have moderate to severe cognitive impairment. Conversely, however, a higher proportion of Medicaid facilities admit individuals who need skilled nursing care or have substance abuse problems. Comparing the admission policies for facilities in which the Medicaid and non-Medicaid residents live, we found that the admission policies are comparable and several differences noted at the facility level are no longer statistically significant.
Medicaid and non-Medicaid facilities differ on a few discharge policies, most notably their willingness to retain residents who require skilled care. Although most facilities discharge residents who need skilled nursing care, a significantly larger proportion of non-Medicaid RCFs do so. In contrast, a larger proportion of Medicaid facilities discharge residents who are regularly incontinent of urine or feces or who need end-of-life care. Discharge policies are primarily the same for the facilities where Medicaid and non-Medicaid residents live, and differences are not large.
In services and staffing, Medicaid facilities appear to be similar to non-Medicaid facilities, but again there are a few exceptions. More Medicaid facilities offer services aimed at a younger population, such as transportation to sheltered workshops and educational programs, social services counseling, and case management services. Further, more Medicaid facilities provide skilled nursing services and daily health monitoring, perhaps reflecting that some states allow facilities to serve residents who require nursing home levels of care under Medicaid HCBS waivers.
Service use by Medicaid and non-Medicaid residents is about the same with regard to assistance with ADLs, incontinence care, and social and recreational activities inside and outside the facilities, but more Medicaid residents use other services (i.e., skilled nursing; special diets; basic health monitoring; transportation to medical appointments, stores, and elsewhere; and social service counseling). The low percentages for use of skilled nursing services are likely the result of two factors. First, small facilities (4-10 beds) account for 50 percent of RCFs and cannot afford having skilled personnel on staff. In addition, many RCFs are not permitted by state regulation to serve individuals who need nursing care on a regular basis. Of note, although staffing ratios in Medicaid and non-Medicaid facilities are not different when facilities are the unit of analysis, the number of direct care hours per resident in facilities where Medicaid residents live is higher than in the facilities where non-Medicaid residents live, although the difference is not large.
It is not clear what accounts for the difference in the base rate that Medicaid and non-Medicaid facilities charge, but the higher costs in the non-Medicaid facilities may be to provide additional amenities or to cover higher staff wages. Although more extensive analyses are needed to definitively answer the question, higher staffing and offering more services do not appear to be the reasons for the higher charges in non-Medicaid facilities. Medicaid RCFs may be in older buildings, while non-Medicaid RCFs may be in newer, more expensive purpose-built buildings.
Multivariate Analysis of Facility Medicaid Participation
This study conducted a multivariate logistic regression analysis of predictors of Medicaid participation by RCFs. The Medicaid state plan personal care and the coverage category for both HCBS waiver and state plan personal care were statistically significant predictors of Medicaid participation. Somewhat surprisingly, state coverage of RCF services only through HCBS waivers was not a statistically significant predictor of Medicaid participation, suggesting that the need to serve persons with a nursing home level of care may be a deterrent to participation. The odds that a facility will participate in Medicaid are lower if the facility is located in an urban area. The odds of participating in Medicaid also decrease as the percentage of residents with Alzheimer's disease or other dementia increases in a facility. Moreover, the odds of a facility participating in Medicaid decline as the number of residential care beds in the facility increases (i.e., the larger the facility, the less likely it is to accept Medicaid residents). The direct care staff ratio, for-profit ownership, being part of a chain, and having a high percentage of high-privacy units were not statistically significant predictors of Medicaid participation.
Medicaid vs. Non-Medicaid Residents
A profile of Medicaid and non-Medicaid residents suggests both similarities and differences. Of particular policy relevance is how these residents compare on levels of disability, an important indicator of need for services. Medicaid and non-Medicaid residents have a similar distribution of ADL and IADL impairments, but Medicaid residents are much more likely to have severe mental illness or intellectual disabilities, and non-Medicaid residents are much more likely to have Alzheimer's disease and other cognitive impairments.
Compared to non-Medicaid residents, Medicaid residents are more likely to be younger and male, to have never married, to be racial and ethnic minorities (non-White), and to be less educated, all characteristics consistent with lower income and assets. Of the chronic conditions examined, the prevalence is similar by Medicaid status, except that a higher proportion of Medicaid residents have diabetes, which is likely related to a higher proportion of Medicaid residents being minorities. Consistent with the higher proportion of Medicaid residents having severe mental illness or intellectual and developmental disabilities, a higher proportion of Medicaid than non-Medicaid residents exhibit problem behaviors such as being verbally and physically abusive. Among persons with at least one problem behavior, Medicaid residents are more likely to be prescribed medications to control their behaviors.
Limitations
This study analyzes the 2010 NSRCF, which is the most current and comprehensive source of nationally representative data on RCFs. This research study provides the first comprehensive examination of RCFs serving Medicaid residents and of the characteristics of Medicaid beneficiaries living in those facilities. Like all studies, however, it has limitations. First, the survey was designed to analyze facilities and residents at the national level; although state licensure requirements vary by state, the NSRCF is not designed to produce state estimates. Second, the measures of Medicaid facility and resident participation were self-reports and were not verified against Medicaid agency records. Third, although data are available on the provision of services, the NSRCF was not explicitly designed to address questions of the adequacy of RCF services and staffing. Fourth, residents were not directly interviewed for this survey; facility staff reported resident health and functional status based on their knowledge of the resident and facility records. To the extent that their knowledge is limited or biased, their reports may contain errors. Finally, facilities that exclusively serve people with severe mental illness or intellectual and developmental disabilities were excluded from the survey because of its focus on facilities that serve older people and younger people with physical disabilities. Thus, the survey does not fully represent younger people living in RCFs.
Conclusions
RCFs play an important role in state strategies to change the balance of the long-term services and supports system. Many states provide Medicaid coverage for services in RCFs through HCBS waivers, state plan personal care, and research and demonstration waivers. As a result, policy makers are increasingly interested in the characteristics of facilities that serve Medicaid residents and how they compare to non-Medicaid-participating facilities. In addition, to better understand the needs of residents, policy makers want to know more about the characteristics of Medicaid RCF residents and how they compare to non-Medicaid residents.
For many policy-relevant characteristics, Medicaid and non-Medicaid facilities and residents are similar, especially in terms of the ADL and IADL disability levels, the services offered and used, and the staffing available. Although a more detailed analysis would be required for a definitive answer, the lack of differences in staffing levels suggests that Medicaid residents are not disadvantaged relative to non-Medicaid residents in terms of the availability of facility personnel.
On four dimensions, however, there are important differences. First, Medicaid residents are more likely to be under age 65 and to have severe mental illness and intellectual and developmental disabilities; non-Medicaid residents are more likely to be aged 65 and older and to have Alzheimer's disease and other dementias. Consistent with that difference, non-Medicaid facilities are more likely to have dementia or Alzheimer's special care units or to exclusively serve people with Alzheimer's disease. A question for further research is how well equipped RCFs are to provide services to people with severe mental illness, intellectual and developmental disabilities, and Alzheimer's disease. Second, Medicaid residents are much more likely to have living arrangements that offer less privacy than non-Medicaid residents. In particular, almost half of Medicaid residents live in multiperson rooms compared to less than a quarter of non-Medicaid residents. Thus, Medicaid residents are less likely to live in "homelike" environments. Third, although Medicaid reimbursement levels are not available from the survey, data are available on facility charges. Although staffing levels are very similar, non-Medicaid facilities charge substantially more than Medicaid facilities, although the reasons for this difference is not clear. Fourth, and finally, Medicaid residents exhibit more behavioral problems and are prescribed more medications to control those behaviors than are non-Medicaid residents, raising questions about facility staffing and training levels in these facilities.
References
Caffrey, C., Sengupta, M. Park-Lee, E., Moss, A., Rosenoff, E., & Harris-Kojetin, L. (2012). Residents living in residential care facilities: United States, 2010. NCHS Data Brief, no. 91. Hyattsville, MD: National Center for Health Statistics.
Carlson, E., Coffey, G., Fecondo, J., & Newcomer, R. (2010). Medicaid funding for assisted living care: A five-state examination.Journal of Housing for the Elderly, 24(1), 5-27. doi:10.1080/02763890903547047.
Centers for Disease Control and Prevention (2011). National diabetes fact sheet: National estimates and general information on diabetes and prediabetes in the United States, 2011. Atlanta, GA: U.S. Department of Health and Human Services, Centers for Disease Control and Prevention.
Eiken, S., Sredl, K., Burwell, B., & Gold, L. (2010). Medicaid long-term care expenditures in FY 2009. Cambridge, MA: Thomson Reuters. Retrieved from http://hcbs.org/files/193/9639/2009LTCExpenditures.pdf.
Kane, R.A., & Cutler, L.J. (2008). Community-based care settings as rebalancing vehicles: State strategies to make them more like home than like institutions. Minneapolis, MN: University of Minnesota. Retrieved from http://www.sph.umn.edu/hpm/ltcresourcecenter/research/rebalancing/attachments/topicpapers/Topic_6_Community_Group_Residential_Settings_as_Rebalancing_Vehicles.pdf.
Mollica, R. (2009). State Medicaid reimbursement policies and practices in assisted living. Washington, DC: National Center for Assisted Living.
Moss, A.J., Harris-Kojetin, L.D., & Sengupta, M. (2011). Design and operation of the 2010 National Survey of Residential Care Facilities. Hyattsville, MD: National Center for Health Statistics. Vital Health Statistics, 1(54).
O'Keeffe, J., Saucier, P., Jackson, B., Cooper, R., McKenney, E., Crisp, S., & Moseley, C. (2010). Understanding Medicaid home and community services: A primer, 2010 edition. Research Triangle Park, NC: RTI International. Retrieved from http://aspe.hhs.gov/daltcp/reports/2010/primer10.htm.
O'Keeffe, J., & Wiener, J.M. (2005). Public funding for long-term care services for older people in residential care settings. Journal of Housing for the Elderly, 18(3-4), 51-79.
Park-Lee, E., Caffrey, C., Sengupta, M., Moss, A.J., Rosenoff, E., & Harris-Kojetin, L.D. (2011). Residential care facilities: A key sector in the spectrum of long-term care providers in the United States. Hyattsville, MD: National Center for Health Statistics. Retrieved from http://www.cdc.gov/nchs/data/databriefs/db78.pdf.
Research Triangle Institute (2008). SUDAAN Language Manual (Version Release 10.0). Research Triangle Park, NC: RTI International.
Smith, D.B., Feng, Z., Fennell, M.L., Zinn, J.S., & Mor, V. (2007). Separate and unequal: Racial segregation and disparities in quality across U.S. nursing homes. Health Affairs, 26(5), 1448-1458. doi:10.1377/hlthaff.26.5.1448.
Stone, R.I., & Reinhard, S.C. (2007). The place of assisted living in long-term care and related service systems. Gerontologist, 47 (Spec No 3), 23-32.
Wiener, J.M., & Lutsky, S.M. (2001). Medicaid home and community-based services for older people and younger persons with physical disabilities in Wisconsin. Washington, DC: The Urban Institute.
APPENDIX A. Resident Health and Functional Characteristics by Medicaid Status and Age
Because of significant differences in the age distribution of Medicaid and non-Medicaid residents, we examined health and functional characteristics by age within each Medicaid status and by Medicaid status within each age group. Table A-1 presents the data on resident characteristics by age group and Medicaid status. The first two columns of statistical significance indicators show whether the difference between the proportions of residents in each age group within each Medicaid status category is significant. The last two columns of statistical significance indicators for this table show whether the difference between the proportions of residents in each Medicaid status category within each age group is statistically significant.
Differences exist between the under-65 and 65+ age groups on all but one health condition, diabetes, which had a higher incidence for non-Medicaid residents under age 65 than those aged 65 and older. For residents aged 65 and older, Medicaid residents had a higher incidence of diabetes than non-Medicaid residents. Also, a greater proportion of both Medicaid and non-Medicaid residents under age 65 have intellectual disabilities and serious mental illness, and a greater proportion of both Medicaid and non-Medicaid residents aged 65 and older have Alzheimer's disease or other dementia. A significant difference is observed for residents aged 65 and older with serious mental illness: 10.1 percent of Medicaid residents aged 65 and older have this condition compared to 2.8 percent of non-Medicaid residents aged 65 and older. For residents aged 65 and older, Medicaid residents had a higher incidence of both intellectual disabilities and serious mental illness than non-Medicaid residents. All of the aforementioned differences are statistically significant.
When examining ADL and IADL limitations, we found that age is a significant factor accounting for differences in severity. On average, older residents, regardless of Medicaid status, have more impairments. For both Medicaid and non-Medicaid residents, a significantly greater proportion of residents under age 65 have no limitations and a significantly greater proportion of residents aged 65+ have three or four ADL limitations. The same pattern is found for IADL limitations. A higher proportion of the older residents have IADL impairments--and more IADL impairments--regardless of Medicaid status. On average, for all residents, regardless of age, Medicaid residents had more ADL and IADL limitations than non-Medicaid residents.
| Resident Characteristics | Total RCFPopulation | Non-Medicaid ResidentsUnder Age 65 | Non-Medicaid ResidentsAge 65 & Over | Medicaid ResidentsUnder Age 65 | Medicaid ResidentsAge 65 & Over | Significance Testp-value for Test ofDifference Between <65 & 65+Non-Medicaid | Significance Testp-value for Test ofDifference Between <65 & 65+Medicaid | Significance Testp-value for Test ofDifference Between Medicaid &Non-MedicaidUnder age 65 | Significance Testp-value for Test ofDifference Between Medicaid &Non-MedicaidAge 65 & Over |
|
SOURCE: RTI analysis of the 2010 NSRCF data. NOTES:
# : Sample size is too small (n<=30) to report by National Center for Health Statistics standards. † : Estimate cannot be assumed to be reliable; sample size is between 30 and 59 and/or the sample size is greater than 59 but has a relative standard error of 30 percent or more. * p<0.1, ** p<0.05, *** p<0.001, ns: not significant p>0.1 |
|||||||||
| Unweighted n=8,094 | | (A) | (B) | (C) | (D) | (A vs B) | (C vs D) | (A vs C) | (B vs D) |
| Weighted n=733,309 | n=8,094 | n=552 | n=5,570 | n=666 | n=1,238 | --- | --- | --- | --- |
| Resident characteristics | % | % | % | % | % | --- | --- | --- | --- |
| Gender | |||||||||
| Male | 30.4 | 58.8 | 27.7 | 54.6 | 25.9 | *** | *** | ns | ns |
| Female | 69.6 | 41.2 | 72.3 | 45.4 | 74.1 | *** | *** | ns | ns |
| Race/Ethnicity | |||||||||
| Hispanic/Latino | 2.9 | # | 2.8 | # | 3.4† | ns | ns | ns | ns |
| White non-Hispanic | 91.1 | 82.1 | 93.9 | 72.3 | 86.3 | *** | *** | ** | *** |
| Black non-Hispanic | 4.3 | 12.9 | 2.0 | 20.9 | 7.7 | *** | *** | ** | *** |
| Asian | 1.1 | # | 1.0 | # | # | ns | ns | ns | ns |
| Other | 0.7 | # | 0.4 | # | # | ns | ns | ** | ns |
| Marital status | |||||||||
| Married | 13.1 | # | 14.9 | # | 9.3 | *** | *** | ns | *** |
| Divorced/Legally separated | 10.1 | 30.5 | 6.3 | 28.4 | 16.8 | *** | *** | ns | *** |
| Widowed | 63.2 | 5.6 | 72.0 | 5.3 | 58.0 | *** | *** | ns | *** |
| Never married | 13.7 | 57.7 | 6.8 | 62.7 | 15.9 | *** | *** | ns | *** |
| Education | |||||||||
| High school or less | 59.4 | 68.9 | 53.7 | 84.7 | 76.5 | *** | ** | *** | *** |
| Some college or more | 40.6 | 31.1 | 46.3 | 15.3 | 23.5 | *** | ** | *** | *** |
| Resident LOS in a facility | |||||||||
| 0-3 months | 9.2 | 10.7 | 9.5 | 9.6 | 6.7 | ns | * | ns | ** |
| More than 3 month less than 6 months | 9.2 | 6.0 | 9.9 | 6.8 | 7.8 | ** | ns | ns | ns |
| More than 6 months and less than 1 year | 14.2 | 12.5 | 15.3 | 9.0 | 10.6 | ns | ns | ns | *** |
| More than 1 year and less than 3 years | 36.2 | 27.7 | 37.3 | 30.2 | 35.6 | *** | * | ns | ns |
| More than 3 years and less than 5 years | 16.0 | 14.1 | 15.8 | 13.8 | 19.1 | ns | ** | ns | ** |
| 5 years or more | 15.2 | 29.0 | 12.1 | 30.6 | 20.3 | *** | *** | ns | *** |
| Health conditions | |||||||||
| Arthritis | 27.2 | 10.3 | 28.9 | 13.3 | 30.3 | *** | *** | ns | ns |
| Stroke | 11.0 | 8.6 | 11.0 | 10.1 | 12.6 | ns | ns | ns | ns |
| Congestive heart failure | 13.3 | # | 13.9 | 5.1 | 17.2 | *** | *** | ns | ns |
| Diabetes | 17.3 | 22.9 | 14.6 | 25.8 | 26.9 | ** | ns | ns | *** |
| Mental and cognitive health | |||||||||
| Alzheimer's disease/ other dementia | 42.1 | 11.3 | 45.9 | 12.0 | 45.1 | *** | *** | *** | ns |
| Intellectual and developmental disabilities | 3.4 | 16.9 | 0.6 | 23.8 | 5.2 | *** | *** | ns | *** |
| Serious mental illness such as schizophrenia or psychosis | 7.6 | 40.5 | 2.8 | 38.4 | 10.1 | *** | *** | ns | *** |
| IADL limitations1 | |||||||||
| Any IADL limitations | 95.2 | 95.7 | 94.3 | 98.7 | 99.2 | ns | ns | * | *** |
| Number of IADL limitations | --- | --- | --- | --- | --- | --- | --- | ns | *** |
| 0 IADLs | 4.8 | # | 5.7 | # | # | ns | ns | ** | *** |
| 1-2 IADL | 18.5 | 31.1 | 17.4 | 32.3 | 14.0 | *** | *** | ns | ** |
| 3-4 IADLs | 46.0 | 48.1 | 45.6 | 43.0 | 50.1 | ns | ** | ns | ** |
| 5 IADLS | 30.6 | 16.5 | 31.3 | 23.4 | 35.1 | *** | *** | ** | * |
| Mean IADL score (0-5) | 3.5 | 3.0 | 3.5 | 3.2 | 3.8 | *** | *** | ** | *** |
| ADL assistance2 | |||||||||
| Any ADL limitations | 74.3 | 48.7 | 75.7 | 58.7 | 82.5 | *** | *** | ns | ** |
| 0 ADLs | 25.4 | 51.3 | 24.3 | 41.3 | 17.5 | *** | *** | ** | *** |
| 1-2 ADL | 37.0 | 34.0 | 36.7 | 35.4 | 39.6 | ns | ns | ns | ns |
| 3-4 ADLs | 31.8 | 13.1 | 32.8 | 21.7 | 35.8 | *** | *** | ** | ns |
| 5 ADLS | 5.9 | # | 6.2 | # | 7.1 | *** | *** | ns | ns |
| Mean ADL score (0-5) | 1.9 | 1.0 | 2.0 | 1.4 | 2.2 | *** | *** | ** | ** |
Notes
-
Information on Medicaid participation is not available for 12 facilities and those cases were dropped from the analysis.
-
The question wording from the facility questionnaire is "During the last 30 days, how many of the residents had some or all of their long-term care services paid by Medicaid?" and the question wording from the resident questionnaire is "During the last 30 days did [RESIDENT INITIALS] have any of (his/her) long-term care services at this facility paid by Medicaid?".
-
The survey question asks "During the last 30 days did [RESIDENT INITIALS] have any of (his/her) long-term care services at this facility paid by Medicaid?".
-
The survey questions used in the facility level analysis are "What is the average monthly base rate for a single individual living in a 1-bedroom apartment for a regular, non-Alzheimer's unit?" and "What is the average monthly base rate for a single individual living in a room designed for one person (for a regular, non-Alzheimer's unit)?".
-
These means are only for the facilities that have these types of living quarters.
-
The survey question asks "For last month, what was the total charge for [RESIDENT INITIALS] to live in this facility? Include the basic monthly charge and charges for any additional services.".
-
Facilities that do not have these types of units are not included in the calculations for this analysis.
-
Of the 13,358 Medicaid facilities, 158 (1.2 percent of all Medicaid facilities) are in states that do not use these Medicaid options to cover services in RCFs. These 158 facilities may have responded that they participate in Medicaid because Medicaid is paying for other state plan services, such as home health or private duty nursing.
-
The survey question asked whether the resident receives any assistance to do the ADLs, including help from another person, special equipment, or both.