


SUMMARY:
Drug pricing has become central to public policy debates, yet the measures most often used in those debates - total pharmaceutical spending, or average drug prices - are not directly matched to the economic object that matters for innovation. The relevant pull-side incentive is the expected revenue accruing to the innovator firm over the life cycle of the drug, once appropriately discounted by the firm’s cost of capital. Using quarterly IQVIA MIDAS data for OECD countries from 2020 through 2025, this study estimates each country's share of aggregated cost-of-capital-discounted revenues accruing to innovative branded products and interprets those revenues as the best feasible empirical proxy for pull-side innovation incentives. We compare these revenue shares with shares of population and GDP, examine their sensitivity to a range of differential gross-to-net assumptions between the U.S. and the remainder of the OECD, and calculate the share of each country's actively used drug portfolio that U.S. revenues constitute. We find that across OECD markets, the United States accounts for 79.87 percent of revenues for innovative drug products launched during the 2020-2025 period and 66.98 percent of revenues for all innovative drug products (regardless of launch date), versus 62.57 percent of revenues when all drug products including generics, biosimilars, etc. are considered—indicating that broad pharmaceutical spending measures understate the concentration of innovation finance in the United States. The results remain qualitatively unchanged in sensitivity analyses that consider a wide range of potentially differential gross-to-net price adjustments in the U.S. and abroad. One such sensitivity analysis assuming a uniform 37.7% gross-to-net cut for the U.S. with no comparable adjustment for the remainder of the OECD, finds our headline estimates of 79.87 and 66.98 percent fall only to 71.20 and 55.83 percent respectively. By comparison, no other OECD country approached the United States’ contribution, with Japan—the second-largest contributor—accounting for 5.46 percent of new innovative drug revenues and 5.83 percent of all innovative drug revenues. Moreover, the United States remains a clear outlier after normalization by population or GDP, equaling 3.24 and 2.72 times its OECD population share and 2.32 and 1.94 times its OECD GDP share for newly launched innovative drugs and all innovative drugs respectively. Repeating the analysis separately for each country-specific drug basket yields only modest attenuation. Finally, disaggregated molecule-level patterns indicate that the U.S. burden reflects both price- and volume-driven differences rather than utilization or price alone. Taken together, these findings suggest that the global financing of pharmaceutical innovation remains highly concentrated in the United States and helps clarify the burden-sharing issues embedded in international debates over drug pricing and access.
INTRODUCTION:
Prescription drug pricing remains a recurring point of conflict in health policy because it sits at the intersection of affordability, access, and innovation. For many policy questions, overall expenditure or cross-national price comparisons are informative. For questions about innovation incentives, however, those measures are incomplete. The economic return relevant to pharmaceutical research and development is the cost-of-capital-discounted stream of expected revenues accruing to the innovator firm, not total sector spending and not the average price of a heterogeneous bundle of originator, follow-on, and generic products. Since pharmaceutical R&D costs are largely fixed, sunk, and globally joint, the distribution of those revenues across countries has direct implications for how the burden of financing innovation is shared internationally.
That distinction is well grounded in the economics literature. Studies of market size and drug development show that expected revenue affects the rate and direction of innovation, whether the source of market expansion is demographic change, insurance coverage, or broader purchasing capacity (Acemoglu and Linn 2004; Blume-Kohout and Sood 2013; Dubois, de Mouzon, Scott-Morton, and Seabright 2015). Related work on price regulation, launch delay, and global diffusion shows that lower expected returns can influence where new drugs launch and how quickly they become available (Danzon, Wang, and Wang 2005; Kyle 2007; Cockburn, Lanjouw, and Schankerman 2016). Normative analyses of differential pricing and international cost-sharing similarly emphasize that the joint costs of R&D are not naturally allocated in proportion to population alone and may rationally be borne more heavily by richer or less price-sensitive markets (Danzon and Towse 2003; Barros and Martinez-Giralt 2008; Danzon, Towse, and Mestre-Ferrandiz 2015).
Existing empirical comparisons, however, usually stop short of measuring that burden directly. International price-index studies show that U.S. manufacturer prices are substantially above those in other high-income countries, especially for brand-name originator products, while unbranded generic prices are often lower in the United States (Danzon and Furukawa 2008; Mulcahy, Schwam, and Lovejoy 2024). Those findings are important for affordability and spending, but they do not isolate the revenues actually accruing to innovative branded products. This issue brief addresses that gap by measuring the share of cost-of-capital-discounted revenues flowing to innovative branded products across OECD countries. The resulting estimates provide a more targeted empirical proxy for pull-side innovation incentives and, by construction, a more informative measure of international burden sharing of providing this innovative incentive.
DATA AND METHODS:
The analysis uses quarterly IQVIA MIDAS data from the first quarter of 2020 through the fourth quarter of 2025 for all OECD countries contained in MIDAS. There are four OECD countries that this data availability excludes: Costa Rica, Denmark, Iceland, and Israel. We retain drug product-country-quarter observations with positive revenue and standard unit volume measures greater than one, and we exclude vaccines, vitamins, minerals, and non-prescription-bound products. We refer to this data sample as the “Full Drug Market” sample in our later empirical analyses, and note that it is inclusive of non-innovative products such as generics, branded generics, biosimilars, and biocomparables—which distinguishes it from our more restrictive second sample, “Innovative Drugs.” These Innovative drug products are identified using the IQVIA MIDAS Innovation Insights variable by an entry of "Innovative Branded Product," that is then cleaned to ensure that branded biosimilar or biocomparable follow-on products which are sometimes classified here are removed. Importantly, this “Innovative Branded Products” category includes revenues from other firms through licensing deals, so those revenues are also accounted for. Among the “Innovative Drug” sample, we distinguish between “new drugs”—those launched during the sample period after Q1 2020—and the “All Innovative Drug” sample which includes any innovative drug product regardless of launch date.
The core outcome measure of this study is each country's share of cost-of-capital-discounted revenue accruing to innovative branded products when appropriately discounted from the firm’s ex ante perspective, which we term “innovative revenues” going forward. To achieve this, we would ideally employ a discount rate equal to the weighted average cost of capital (WACC) for each product. We follow the Oxford Handbook of the Economics of the Biopharmaceutical Industry which proxies for this by utilizing capital asset pricing models (CAPM) to estimate (annual) costs of equity of 9.8 percent for small-molecule products, and 14.2 percent for biologics. The Handbook notes that debt financing in these sectors is sufficiently limited that WACC is similar to the cost of equity, and therefore uses the reported CAPM equity-cost estimates as practical proxies for the opportunity cost of capital facing firms evaluating pharmaceutical R&D investments. We then convert these annual rates into quarterly rates as (1 + r)1/4 - 1, to match our quarterly MIDAS data. Aggregating these discounted revenues to the country level yields an empirical proxy for the pull-side incentive each country contributes to pharmaceutical innovation. For comparison, we also report analogous revenue shares using the full drug market sample rather than only innovative drug products. Comparing these two measures is informative since total pharmaceutical spending can overstate the innovative contribution of countries with relatively large follow-on or generic markets and comparatively weak intellectual property protection for new innovative products.
To place those country-level revenue shares in context, we divide them by each country's share of OECD population and, separately, by its share of aggregate OECD GDP (of those OECD countries contained in our sample). Population and GDP data are taken from the World Bank and averaged over 2020 through 2024 to be as closely analogous to the aggregation of revenues given that World Bank data was not yet available for 2025 at time of this publication. These two normalizations show whether a country contributes more or less to pull-side innovation incentives than would be naively implied by its demographic or macroeconomic weight alone.
Two additional analyses address potential concerns about interpretation. First, because IQVIA MIDAS reflects ex-manufacturer price-based revenues rather than net price-based revenues after all rebates have been processed (see Appendix), we estimate a gross-to-net sensitivity analysis that allows the assumed gross-to-net conversion to differ between the U.S. and the rest of the OECD. This analysis tests whether the primary results are robust to a wide range of plausible rebate differentials between the U.S. and remainder of the OECD. Second, we recalculate the U.S. revenue share using each OECD country's actively sold drug basket as the reference cohort, defined by drug molecule active ingredients. If the core result were driven mainly by cross-country differences in drug basket composition, the U.S. share should vary materially when the denominator is restricted to drug molecules actually sold in each given country. If it does not, the interpretation shifts toward genuine disproportionate concentration of innovative revenues being accrued in the U.S. market.
Finally, we provide two visual analyses that are disaggregated to the underlying molecule (active ingredient) level. The first will evaluate the U.S. innovative revenue share against volume share giving clear insight into price-based versus volume-based explanations for the U.S. disproportionate significance in the aggregate. The second compares the relative prices (U.S. to other OECD countries) for innovative and non-innovative versions of the same active ingredients. Table 1 establishes the central result. Aggregating over 2020-2025, the U.S. accounts for 79.87 percent of innovative revenues for drugs launched during the sample period and 66.98 percent of innovative revenues for all innovative drug products. The U.S. share for the full drug market sample (including non-innovative drug products) is smaller at 62.57 percent - which means that restricting attention to innovative branded products raises the measured U.S. contribution to the global pull-side incentive when compared to simple aggregate calculations that do not differentiate between innovative and non-innovative products. Moreover, no other country approaches the United States on the metrics presented in Table 1. Japan, the second largest contributor, accounts for 5.46 percent of innovative revenues for new innovative drugs and 5.83 percent for all innovative drugs, while Germany, France, Italy and the United Kingdom remain in the low single digits. In other words, the burden of financing expected returns to innovative products is heavily concentrated in the U.S. Importantly, the U.S. role is particularly pronounced for newly launched drugs, for which revenues are expected to be most tightly connected to ongoing R&D incentives.
RESULTS:
Country Shares of Innovative Revenue
Table 1 establishes the central result. Aggregating over 2020-2025, the U.S. accounts for 79.87 percent of innovative revenues for drugs launched during the sample period and 66.98 percent of innovative revenues for all innovative drug products. The U.S. share for the full drug market sample (including non-innovative drug products) is smaller at 62.57 percent - which means that restricting attention to innovative branded products raises the measured U.S. contribution to the global pull-side incentive when compared to simple aggregate calculations that do not differentiate between innovative and non-innovative products. Moreover, no other country approaches the United States on the metrics presented in Table 1. Japan, the second largest contributor, accounts for 5.46 percent of innovative revenues for new innovative drugs and 5.83 percent for all innovative drugs, while Germany, France, Italy and the United Kingdom remain in the low single digits. In other words, the burden of financing expected returns to innovative products is heavily concentrated in the U.S. Importantly, the U.S. role is particularly pronounced for newly launched drugs, for which revenues are expected to be most tightly connected to ongoing R&D incentives.
Table 1: Revenue Shares by OECD Country 2020 – 2025.
New Innovative Drugs | All Innovative Drugs | Full Drug Market | |
(Launched After Q1 2020) | (Any Launch Date) | (Any Launch Date) | |
Australia | 0.98 | 1.09 | 1.05 |
Austria | 0.36 | 0.55 | 0.59 |
Belgium | 0.32 | 0.70 | 0.69 |
Canada | 0.98 | 2.35 | 2.54 |
Chile | 0.00 | 0.05 | 0.13 |
Colombia | 0.00 | 0.02 | 0.08 |
Czech Republic | 0.27 | 0.33 | 0.37 |
Estonia | 0.01 | 0.02 | 0.03 |
Finland | 0.06 | 0.24 | 0.27 |
France | 1.85 | 3.43 | 3.83 |
Germany | 3.35 | 4.32 | 4.73 |
Greece | 0.02 | 0.23 | 0.28 |
Hungary | 0.05 | 0.23 | 0.26 |
Ireland | 0.03 | 0.25 | 0.27 |
Italy | 1.45 | 3.25 | 3.53 |
Japan | 5.46 | 5.83 | 6.27 |
Korea | 0.21 | 0.83 | 1.31 |
Latvia | 0.00 | 0.03 | 0.03 |
Lithuania | 0.02 | 0.06 | 0.07 |
Luxembourg | 0.01 | 0.02 | 0.02 |
Mexico | 0.10 | 0.34 | 0.68 |
Netherlands | 0.05 | 0.27 | 0.37 |
New Zealand | 0.05 | 0.11 | 0.11 |
Norway | 0.09 | 0.25 | 0.31 |
Poland | 0.37 | 0.66 | 0.83 |
Portugal | 0.15 | 0.38 | 0.44 |
Slovakia | 0.05 | 0.14 | 0.17 |
Slovenia | 0.04 | 0.08 | 0.08 |
Spain | 1.32 | 2.65 | 2.89 |
Sweden | 0.17 | 0.42 | 0.48 |
Switzerland | 0.29 | 0.62 | 0.65 |
Turkey | 0.06 | 0.48 | 0.78 |
United Kingdom | 1.95 | 2.78 | 3.29 |
United States | 79.87 | 66.98 | 62.57 |
Source: ASPE analysis of IQVIA MIDAS data 2020 – 2025. Peer countries being considered in current U.S. MFN style drug policies are highlighted in grey. Columns 1 and 2 consider revenue shares restricted to “Innovative Drugs” which are identified by an IQVIA MIDAS Innovation Insights variable entry = "Innovative Branded Product." Drugs launched after Q1 2020 are termed “New Drugs.” Column 3 considers the “Full Drug Market” which includes generics, branded generics, biosimilars, biocomparables, follow-ons, etc.
Normalization by Population and GDP
Table 2 and Table 3 build upon the core results presented above in Table 1, by showing that these results are robust to straightforward normalization to both population and GDP respectively. Despite having both the largest population and the largest GDP among OECD countries, the U.S. contributes 3.24 times its population share and 2.32 times its GDP share for new innovative drug revenues. Moreover, for all innovative drugs, the corresponding ratios are 2.72 and 1.94 respectively. By contrast, Japan and the large European markets are generally below parity (1.0) on both dimensions. For all innovative drugs, Japan is at 0.63 of its population share and 0.73 of its GDP share, France is at 0.68 and 0.67, Germany at 0.71 and 0.58, Italy at 0.75 and 0.76, and the United Kingdom at 0.56 and 0.56. Similarly, for new innovative drugs, Japan is at 0.59 of its population share and 0.68 of its GDP share, France is at 0.37 and 0.36, Germany at 0.55 and 0.45, Italy at 0.33 and 0.34, and the United Kingdom at 0.39 and 0.39.
Table 2: Ratio of Revenue Share to Population Share by OECD Country 2020 – 2025.
New Innovative Drugs | All Innovative Drugs | Full Drug Market | |
(Launched After Q1 2020) | (Any Launch Date) | (Any Launch Date) | |
Australia | 0.51 | 0.57 | 0.54 |
Austria | 0.54 | 0.82 | 0.89 |
Belgium | 0.37 | 0.82 | 0.80 |
Canada | 0.34 | 0.81 | 0.88 |
Chile | 0.00 | 0.03 | 0.09 |
Colombia | 0.00 | 0.01 | 0.02 |
Czech Republic | 0.34 | 0.42 | 0.47 |
Estonia | 0.11 | 0.23 | 0.26 |
Finland | 0.15 | 0.58 | 0.66 |
France | 0.37 | 0.68 | 0.77 |
Germany | 0.55 | 0.71 | 0.77 |
Greece | 0.03 | 0.30 | 0.36 |
Hungary | 0.07 | 0.33 | 0.37 |
Ireland | 0.09 | 0.65 | 0.71 |
Italy | 0.33 | 0.75 | 0.81 |
Japan | 0.59 | 0.63 | 0.68 |
Korea | 0.05 | 0.22 | 0.34 |
Latvia | 0.03 | 0.20 | 0.25 |
Lithuania | 0.10 | 0.31 | 0.34 |
Luxembourg | 0.22 | 0.50 | 0.44 |
Mexico | 0.01 | 0.04 | 0.07 |
Netherlands | 0.04 | 0.21 | 0.29 |
New Zealand | 0.14 | 0.30 | 0.30 |
Norway | 0.22 | 0.63 | 0.78 |
Poland | 0.14 | 0.24 | 0.31 |
Portugal | 0.20 | 0.50 | 0.57 |
Slovakia | 0.11 | 0.35 | 0.41 |
Slovenia | 0.27 | 0.53 | 0.54 |
Spain | 0.37 | 0.75 | 0.82 |
Sweden | 0.22 | 0.54 | 0.62 |
Switzerland | 0.45 | 0.95 | 1.00 |
Turkey | 0.01 | 0.08 | 0.13 |
United Kingdom | 0.39 | 0.56 | 0.66 |
United States | 3.24 | 2.72 | 2.54 |
Source: ASPE analysis of IQVIA MIDAS data 2020 – 2025 and World Bank World Development Indicators, 2020–2024. Peer countries being considered in current U.S. MFN style drug policies are highlighted in grey. Columns 1 and 2 consider revenue shares restricted to “Innovative Drugs” which are identified by an IQVIA MIDAS Innovation Insights variable entry = "Innovative Branded Product." Drugs launched after Q1 2020 are termed “New Drugs.” Column 3 considers the “Full Drug Market” which includes generics, branded generics, biosimilars, biocomparables, follow-ons, etc.
Table 3: Ratio of Revenue Share to GDP Share by OECD Country 2020 – 2025.
New Innovative Drugs | All Innovative Drugs | Full Drug Market | |
(Launched After Q1 2020) | (Any Launch Date) | (Any Launch Date) | |
Australia | 0.44 | 0.49 | 0.47 |
Austria | 0.44 | 0.67 | 0.73 |
Belgium | 0.31 | 0.69 | 0.67 |
Canada | 0.31 | 0.74 | 0.80 |
Chile | 0.00 | 0.06 | 0.16 |
Colombia | 0.00 | 0.02 | 0.06 |
Czech Republic | 0.37 | 0.46 | 0.52 |
Estonia | 0.14 | 0.29 | 0.32 |
Finland | 0.14 | 0.53 | 0.61 |
France | 0.36 | 0.67 | 0.75 |
Germany | 0.45 | 0.58 | 0.64 |
Greece | 0.05 | 0.45 | 0.54 |
Hungary | 0.09 | 0.43 | 0.48 |
Ireland | 0.04 | 0.29 | 0.32 |
Italy | 0.34 | 0.76 | 0.83 |
Japan | 0.68 | 0.73 | 0.78 |
Korea | 0.05 | 0.21 | 0.34 |
Latvia | 0.04 | 0.28 | 0.35 |
Lithuania | 0.11 | 0.35 | 0.38 |
Luxembourg | 0.09 | 0.19 | 0.17 |
Mexico | 0.03 | 0.09 | 0.17 |
Netherlands | 0.03 | 0.16 | 0.21 |
New Zealand | 0.15 | 0.31 | 0.31 |
Norway | 0.13 | 0.36 | 0.45 |
Poland | 0.17 | 0.30 | 0.37 |
Portugal | 0.25 | 0.64 | 0.74 |
Slovakia | 0.15 | 0.46 | 0.55 |
Slovenia | 0.30 | 0.59 | 0.60 |
Spain | 0.42 | 0.85 | 0.93 |
Sweden | 0.18 | 0.45 | 0.51 |
Switzerland | 0.29 | 0.61 | 0.64 |
Turkey | 0.01 | 0.12 | 0.19 |
United Kingdom | 0.39 | 0.56 | 0.66 |
United States | 2.32 | 1.94 | 1.82 |
Source: ASPE analysis of IQVIA MIDAS data 2020 – 2025 and World Bank World Development Indicators, 2020–2024. Peer countries being considered in current U.S. MFN style drug policies are highlighted in grey. Columns 1 and 2 consider revenue shares restricted to “Innovative Drugs” which are identified by an IQVIA MIDAS Innovation Insights variable entry = "Innovative Branded Product." Drugs launched after Q1 2020 are termed “New Drugs.” Column 3 considers the “Full Drug Market” which includes generics, branded generics, biosimilars, biocomparables, follow-ons, etc.
To ease interpretation, Figure 1 provides a graphical representation of Table 2 and Table 3 via a scatterplot that plots the normalized drug revenue ratios of each country. The Y-axis measures the innovative revenue ratio for new drugs launched during the sample period and the X-axis measures the innovative revenue ratio for all innovative drugs independent of launch date. Countries are labelled by their two-digit country codes. Panel A shows this relationship when the normalization is performed relative to population shares (referencing Table 2), and Panel B shows the same relationship when the normalization is performed using GDP shares (referencing Table 3). In both cases we see a fairly strong clustering of all countries below parity (i.e. below 1.0) with the U.S. as a strong outlier on all metrics.
These normalized comparisons sharpen the burden-sharing interpretation. A country that contributes roughly in proportion to its size would have a ratio near one. Ratios below one imply that the country bears less of the innovation burden than its population or GDP would otherwise suggest and ratios above one imply the opposite. On that basis, the United States appears to shoulder a disproportionate share of pull-side incentives not only in absolute terms but also relative to its scale within the OECD. The result is therefore not simply a byproduct of market size; it reflects unusually high innovative spending intensity.
Figure 1: New vs. All Innovative Revenue Ratios by Country.

Source: ASPE analysis of IQVIA MIDAS data 2020 – 2025 and World Bank World Development Indicators, 2020–2024.
Sensitivity to differential gross-to-net assumptions
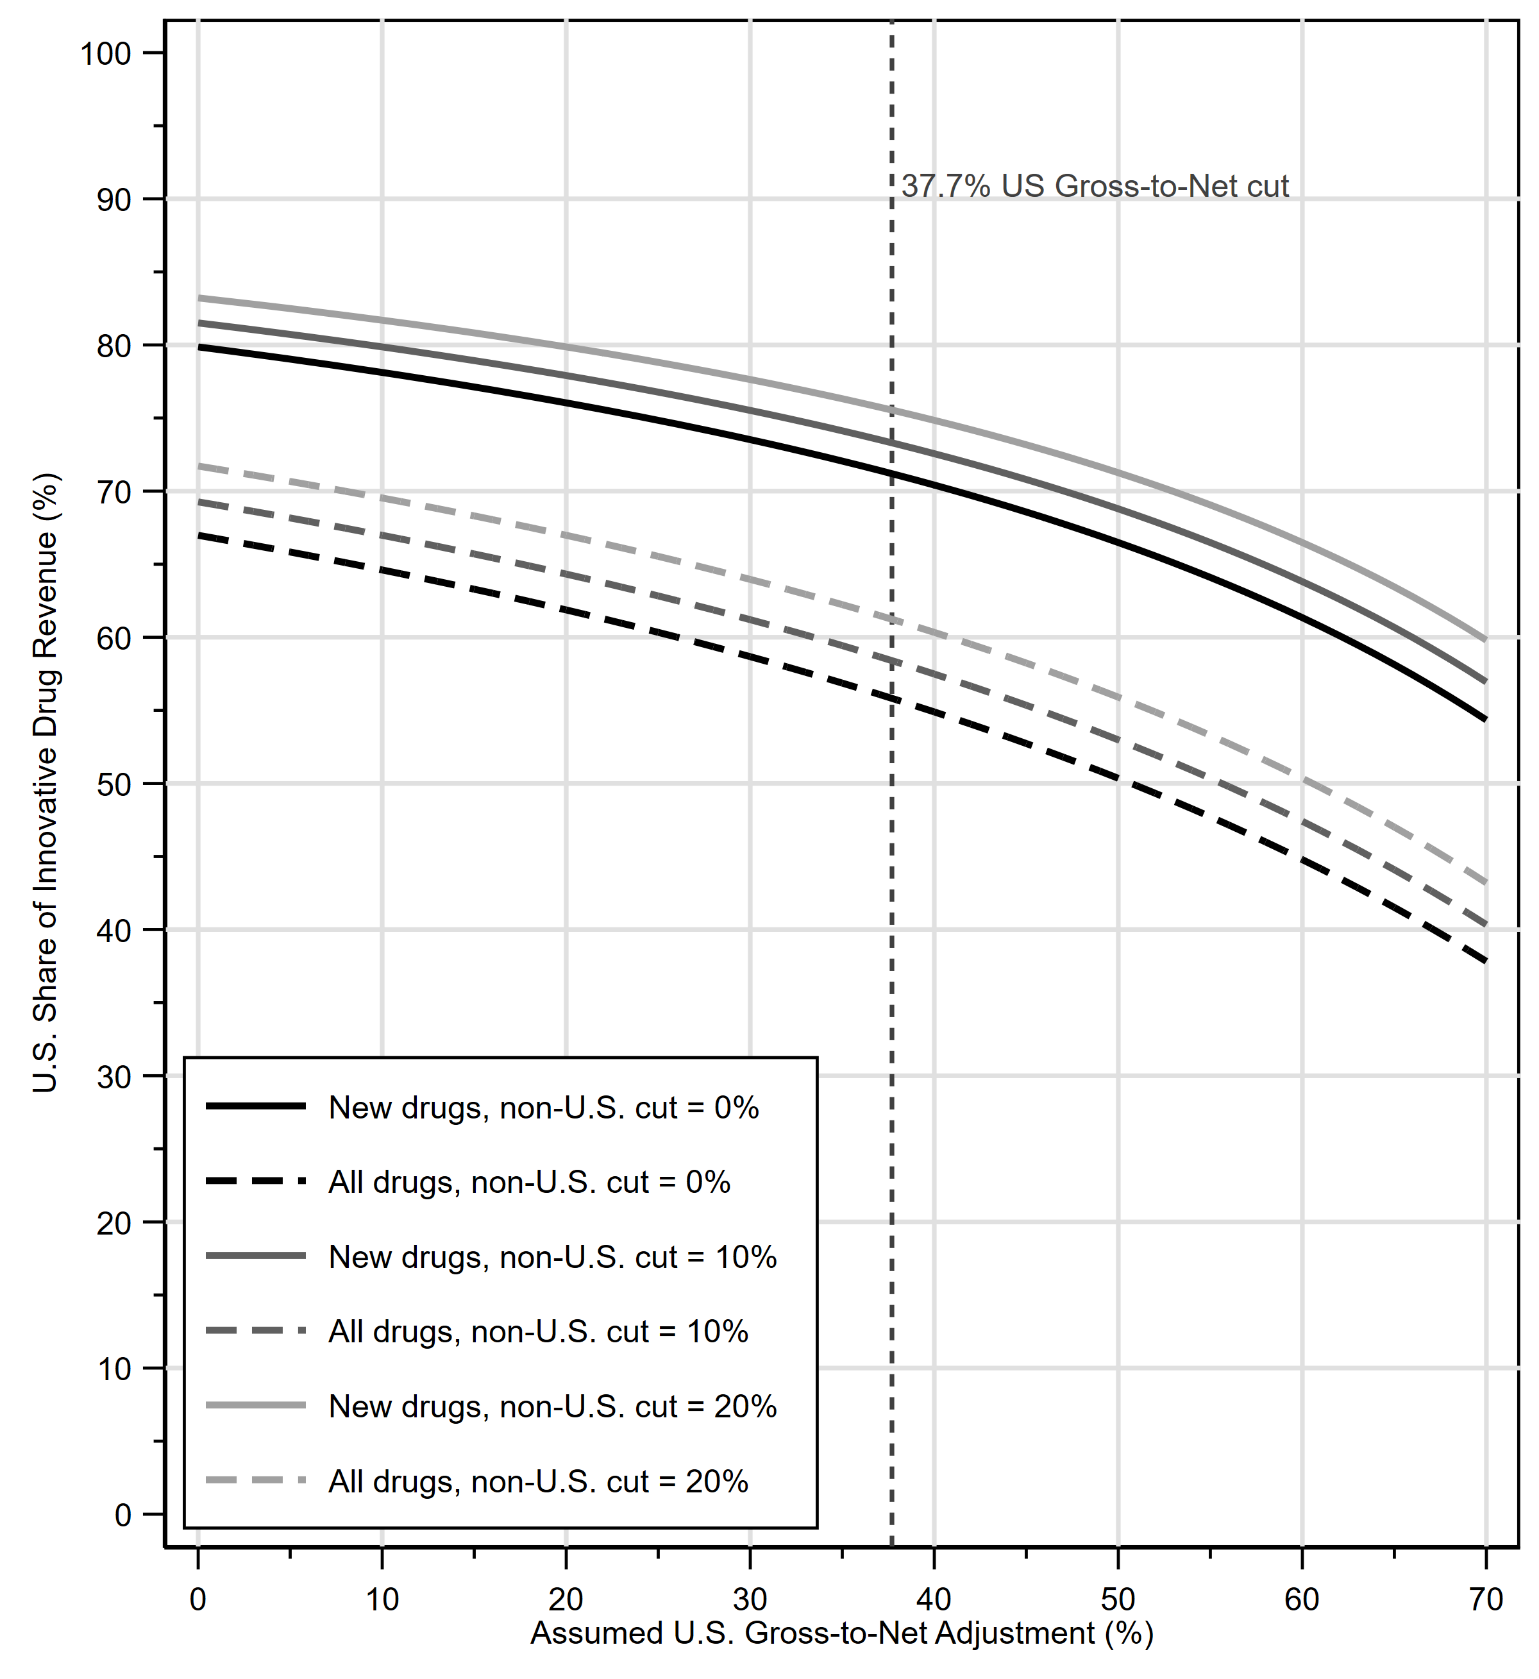
Next, we provide an analysis in Figure 2 that investigates the robustness of the prior results to consideration of potentially differential rebates on innovative drugs between the U.S. and the rest of the OECD. While it is generally thought that the U.S. has higher rates of rebating for brand name drugs than most other countries do, the qualitative results that we find appear robust. Specifically, Figure 2 plots the implied U.S. share of innovative drug revenues both for the newly launched cohort as well as the all innovative drugs cohort with three separate hypotheticals considered for the non-U.S. OECD countries’ average rebating including zero, ten and twenty percent gross-to-net adjustments (cuts), while letting the U.S. gross-to-net adjustment range continuously from a zero to a seventy percent cut. As the assumed U.S. gross-to-net adjustment increases, the implied U.S. share of innovative revenue declines mechanically. But across the wide range shown in the figure - including scenarios that pair large U.S. adjustments with much smaller non-U.S. adjustments - the U.S. remains the dominant contributor to innovative revenues. This robustness is important since the private nature of rebates remains one of the central empirical challenges in international drug price comparisons. While the sensitivity analysis cannot reveal what the true underlying net calculations are, it can show how robust our core results are to a range of possibilities typically considered in the literature. For example, the vertical dashed line in the figure demarcates a uniform gross-to-net adjustment for the U.S. of 37.7 percent, which was employed as one simple uniform estimate in the 2024 RAND Corporation report on international drug price comparisons citing IQVIA estimates of gross-to-net adjustments. Even assuming no gross-to-net cuts for the rest of the OECD that would only lower our headline estimates of the U.S. new innovative revenue share from 79.87 to 71.20 percent and the U.S. all innovative drug revenue share from 66.98 to 55.83 percent. Similarly with the normalized ratios found in Tables 2 and 3: the U.S. new innovative sales ratio would fall from 3.24 to 2.89 for population, and from 2.32 to 2.07 for GDP, while the U.S. all innovative sales ratio would fall from 2.72 to 2.27 for population, and from 1.94 to 1.62 for GDP. Thus, even under generous assumptions about differentially large U.S. rebates, the global distribution of pull-side incentives remains highly concentrated in the U.S. market.
Figure 2: U.S. Share of Innovative Drug Revenue Under Alternative Gross-to-Net Assumptions
Source: ASPE analysis of IQVIA MIDAS data 2020 – 2025.
Country-specific drug portfolios
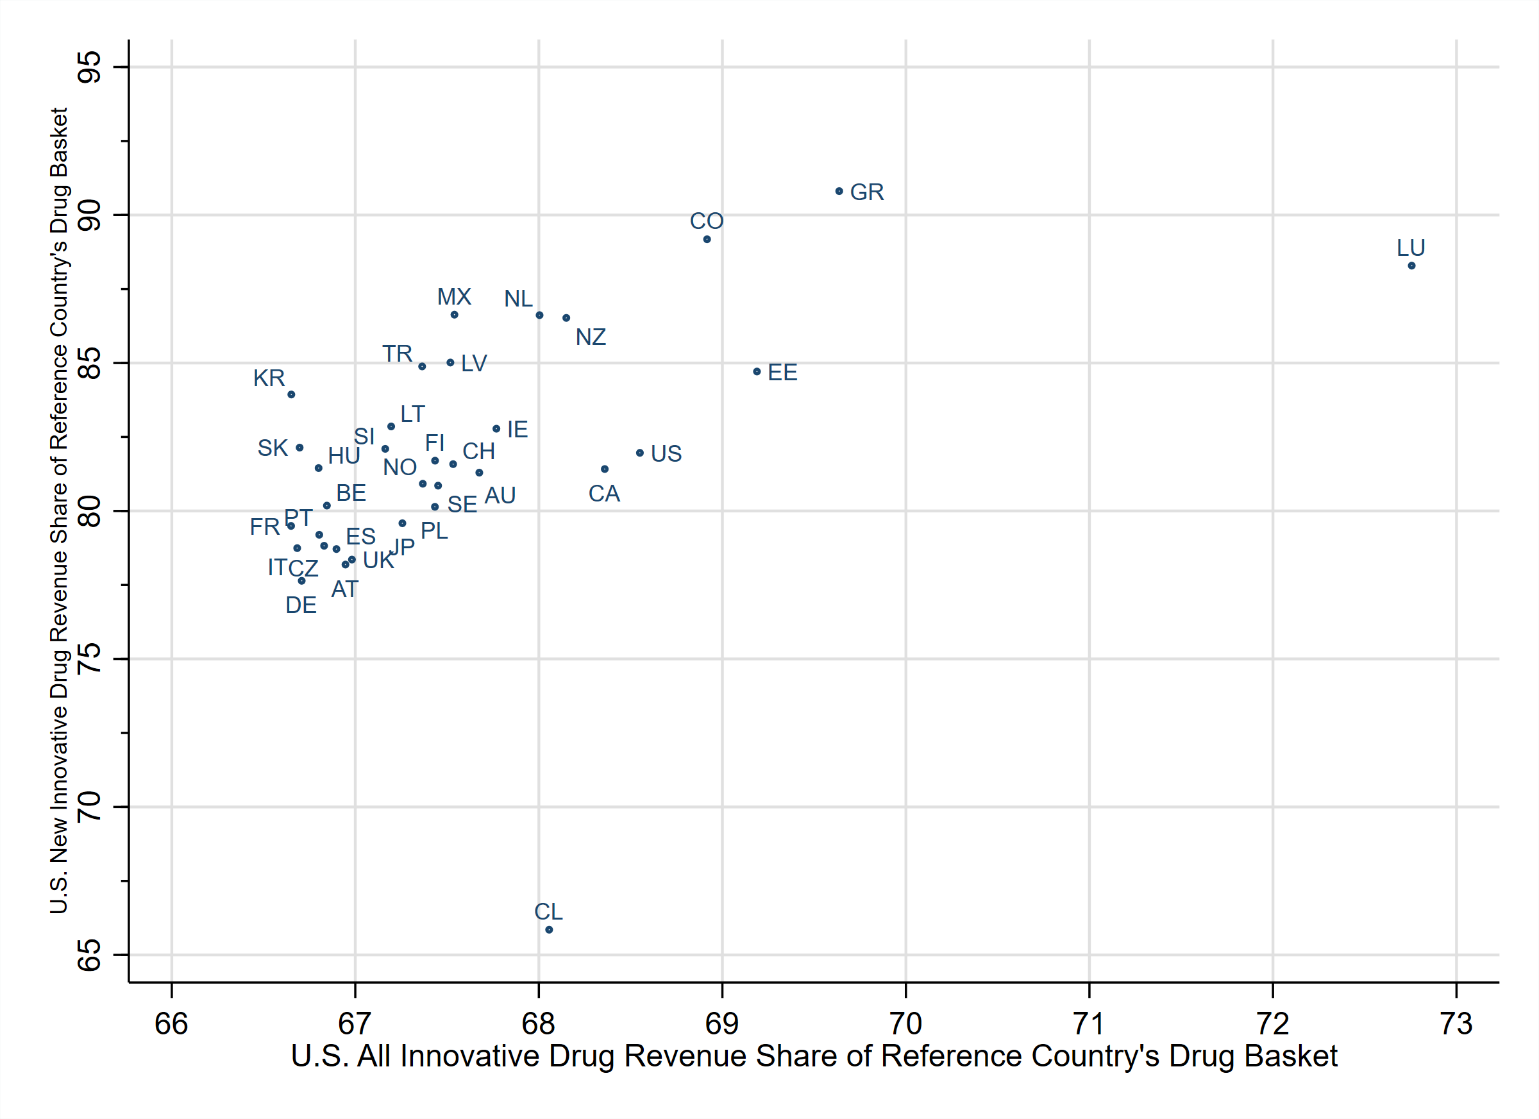
Table 4 investigates heterogeneity in our results based on each country’s potentially differential drug product availability. When the denominator is restricted to the products actively sold in each OECD country during our MIDAS sample period, the U.S. share changes only modestly. For new innovative drugs that were launched during the sample period, the U.S. finances about 66 to 91 percent of each country's actively used innovative portfolio. Moreover, for all innovative drugs, the comparable range is about 67 to 73 percent. Using the U.S. portfolio itself as the reference cohort yields shares of 81.97 percent for new innovative drugs and 68.55 percent for all innovative drugs—roughly in the middle of the range along both dimensions. Figure 3 helps visualize the full set of data more intuitively by displaying a scatterplot of the table labeled by two-digit country code showing the U.S. new innovative drug share on the Y-axis and the U.S. all innovative drug share on the X-axis permuting through the active drug portfolios of each country. The most visible deviations from an otherwise tight cluster are Chile at the low end for new innovative drugs, Greece and Colombia at the high end for new innovative drugs, and Luxembourg at the high end for all innovative drugs. The modest dispersion across countries indicates that differences in country-specific product baskets attenuate the estimates only slightly. Put differently, the result is not primarily that other countries use different drugs. It is that, conditional on the drugs that are used, U.S. revenues dominate the innovative segment of the market.
Table 4: U.S. Revenue Share of Each OECD Reference Country’s Drug Basket 2020 – 2025.
New Innovative Drugs | All Innovative Drugs | Full Drug Market | |
Launched After Q1 2020 | Any Launch Date | Any Launch Date | |
Australia | 81.30 | 67.67 | 63.50 |
Austria | 78.19 | 66.95 | 62.70 |
Belgium | 80.19 | 66.84 | 62.62 |
Canada | 81.42 | 68.36 | 64.63 |
Chile | 65.86 | 68.06 | 63.16 |
Colombia | 89.19 | 68.92 | 63.83 |
Czech Republic | 78.83 | 66.83 | 62.62 |
Estonia | 84.72 | 69.19 | 64.05 |
Finland | 81.71 | 67.43 | 63.32 |
France | 79.50 | 66.65 | 62.42 |
Germany | 77.65 | 66.71 | 62.47 |
Greece | 90.81 | 69.64 | 63.57 |
Hungary | 81.46 | 66.80 | 62.52 |
Ireland | 82.78 | 67.77 | 63.44 |
Italy | 78.75 | 66.68 | 62.54 |
Japan | 79.59 | 67.26 | 62.75 |
Korea | 83.94 | 66.65 | 62.06 |
Latvia | 85.02 | 67.52 | 62.99 |
Lithuania | 82.86 | 67.19 | 62.85 |
Luxembourg | 88.29 | 72.76 | 66.68 |
Mexico | 86.64 | 67.54 | 63.01 |
Netherlands | 86.62 | 68.00 | 62.73 |
New Zealand | 86.53 | 68.15 | 63.84 |
Norway | 80.93 | 67.37 | 63.27 |
Poland | 80.15 | 67.43 | 63.05 |
Portugal | 79.20 | 66.80 | 62.66 |
Slovakia | 82.15 | 66.70 | 62.43 |
Slovenia | 82.10 | 67.16 | 63.00 |
Spain | 78.72 | 66.90 | 62.61 |
Sweden | 80.86 | 67.45 | 63.42 |
Switzerland | 81.59 | 67.53 | 63.31 |
Turkey | 84.89 | 67.36 | 62.60 |
United Kingdom | 78.36 | 66.98 | 63.05 |
United States | 81.97 | 68.55 | 64.96 |
Source: ASPE analysis of IQVIA MIDAS data 2020 – 2025. Peer countries being considered in current U.S. MFN style drug policies are highlighted in grey. Columns 1 and 2 consider revenue shares restricted to “Innovative Drugs” which are identified by an IQVIA MIDAS Innovation Insights variable entry = "Innovative Branded Product." Drugs launched after Q1 2020 are termed “New Drugs.” Column 3 considers the “Full Drug Market” which includes generics, branded generics, biosimilars, biocomparables, follow-ons, etc.
Figure 3: U.S. Innovative Revenue Share (%) of Each OECD Reference Country’s Drug Basket.
Source: ASPE analysis of IQVIA MIDAS data 2020 – 2025.
Disaggregated Drug Molecule-level Evidence
Figure 4 compares the U.S. innovative volume share with the U.S. innovative revenue share for all drugs via a scatterplot that separately distinguishes new drugs launched during the sample period as red circles and older drugs launched before the start of the sample as black squares. The size of the data marker is proportionate to aggregate innovative sales for the drug molecule over the full sample period. Most drug molecules, especially the largest molecules based on innovative revenues, lie above the 45-degree line, indicating that the U.S. revenue share generally exceeds the corresponding U.S. volume share. Moreover, the figure plots dashed lines that demarcate the U.S. population share and GDP share of the OECD countries included in our sample. This shows that both the U.S. revenue and volume share of innovative drugs exceeds both the U.S. population and GDP shares. This pattern is consistent with the view that the disproportionate U.S. pull-side innovation burden stems from both a utilization effect and price effect for innovative drugs relative to other OECD countries. This result is also highly robust to considerations of differential gross-to-net discounts between the U.S. and the remainder of the OECD. In panel B of Figure 4, we replot the original analysis but apply a 37.7% gross-to-net adjustment only to U.S. revenues with no corresponding adjustment to non-US OECD revenues, finding qualitatively similar results.
Figure 4: U.S. Innovative Revenue and Volume Share by Molecule.
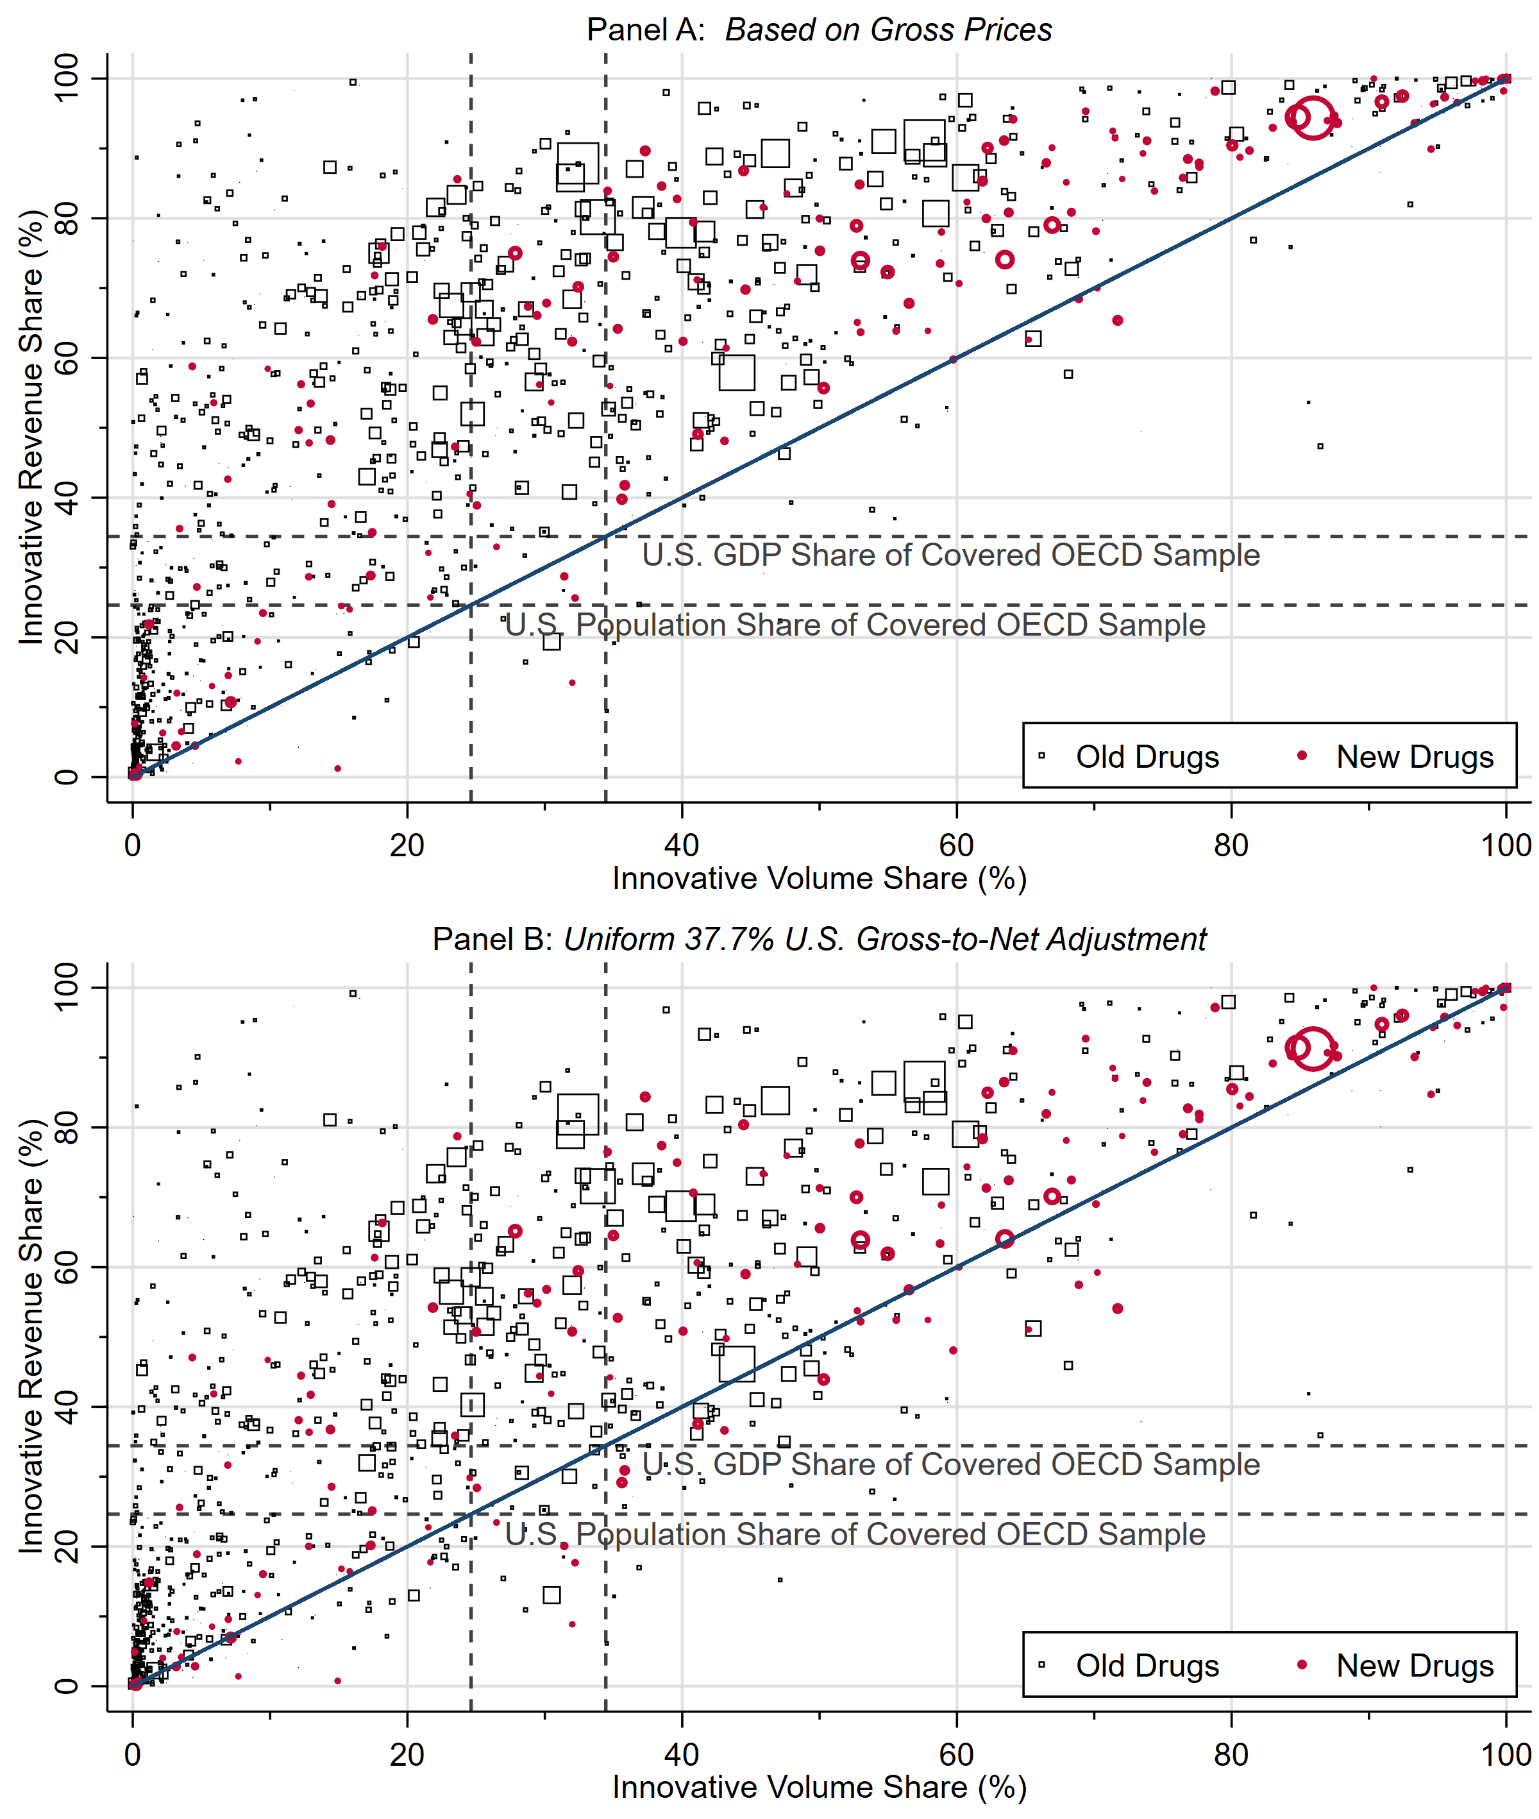
Source: ASPE analysis of IQVIA MIDAS data 2020 – 2025. Data markers are scaled by aggregate innovative revenues for each molecule over the full sample period. Dashed lines denote U.S. population share and GDP share of the covered OECD sample.
Moreover, Figure 5 compares U.S.-to-other OECD relative prices for innovative and non-innovative products at the molecule (active ingredient) level for drugs old enough to have both versions present in the data. Most observations lie above the 45-degree line, implying that the relative U.S. price premium is often larger for innovative products than for their non-innovative counterparts. The figure also plots vertical and horizontal dashed lines at unity (1.0) to easily discern when a given molecule is more expensive in the U.S. versus the average of the OECD (excluding the U.S.). To examine the robustness of this analysis to differential gross-to-net discounts between the U.S. and the remainder of the OECD, panel B of Figure 5 replots the same analysis applying a uniform 37.7% gross-to-net adjustment to all U.S. revenues with no corresponding adjustment to OECD revenues. This shifts the results modestly toward the bottom left corner of the figure as it reduces both the innovative and non-innovative relative US:OECD price ratios, however, the qualitative results remain robust.
Figure 5: Molecule-Level Price Ratios US:OECD for Innovative and Non-Innovative Products.
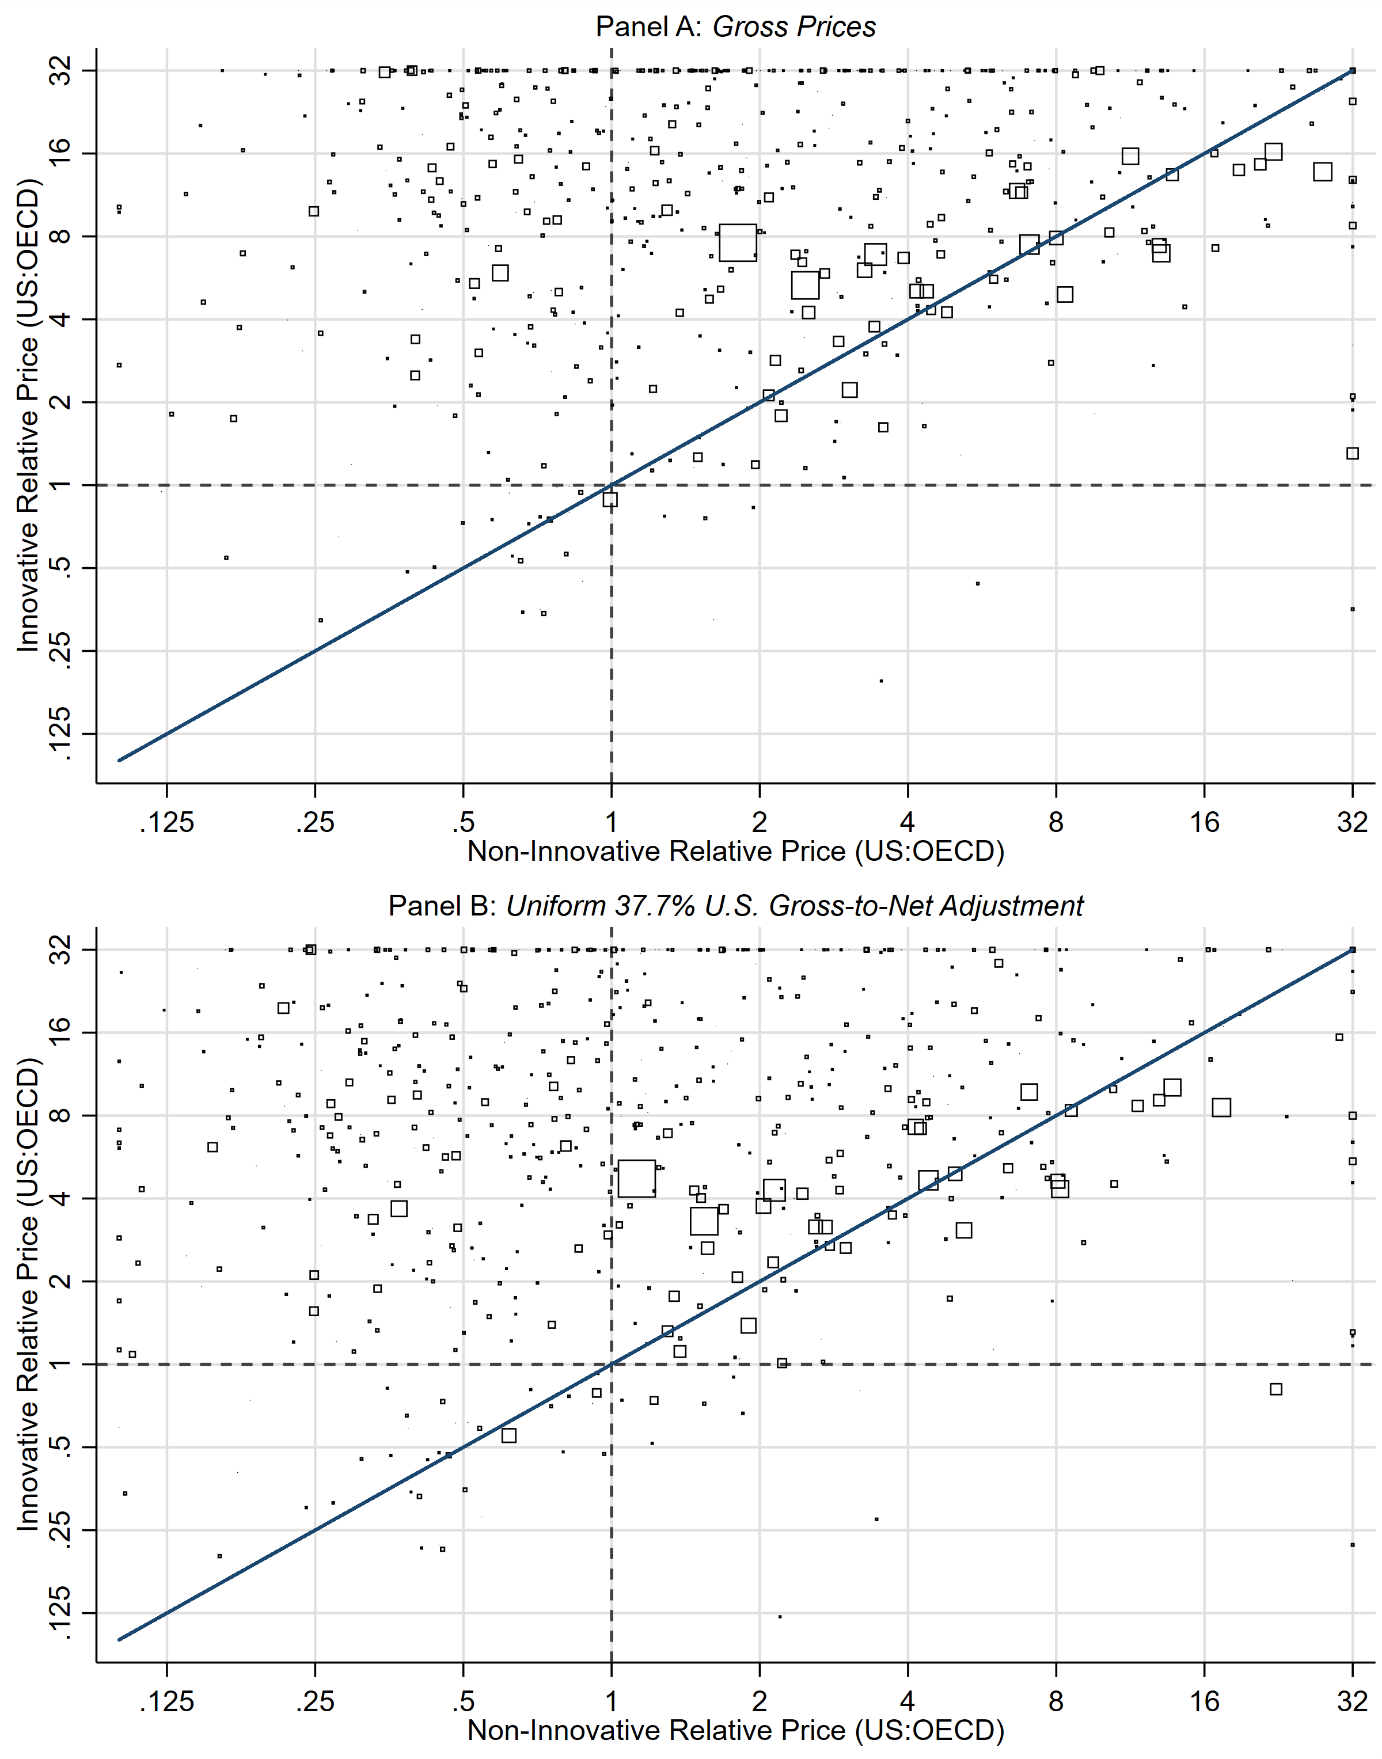
Source: ASPE analysis of IQVIA MIDAS data 2020 – 2025. Data markers are scaled by aggregate innovative revenues for each molecule over the full sample period. Dashed lines denote price parity between US and non-US OECD countries.
Taken together, Figures 4 and 5 suggest that both price and volume contribute to the robustly disproportionate U.S. pull-side burden, but that higher relative prices for innovative products remain an important part of the explanation.
Push-Side Public Funding for Health-Related R&D
This issue brief is predominantly focused on implementing the best empirical proxy for pull-side innovation financing as this is the primary market incentive for pharmaceutical research and development. Nevertheless, it is useful to briefly consider the complementary “push-side” innovation financing distribution across countries as well—both for completeness and as a point of comparison.
Using data published in the OECD’s Health at a Glance 2025: OECD Indicators report we find that the U.S. contributes disproportionately on the public push-side of medical innovation as well, although the available cross-country measure (“GBARD”) is broader than pharmaceutical drugs which the rest of this issue brief has focused on. The OECD reports that, in 2022, governments in 35 OECD countries budgeted $73 billion for health-related R&D, with the U.S. accounting for $49.5 billion, or about two-thirds of the OECD total. However, cross checking these numbers using the (separate) OECD Data Explorer applied to Government Budget Allocations for R&D (GBARD), socioeconomic objective “Health,” expressed in current PPP-converted U.S. dollars, the U.S. total was verified at approximately $49.5 billion, but summing the other OECD Data Explorer country observations yields an OECD total of approximately $82 billion instead of $73 billion reported in the Health at a Glance report.
This second estimate differs from OECD’s published Health at a Glance report because the report appears to use a different U.S.-dollar conversion convention (market exchange rates) than the Data Explorer, which uses PPP. However, the substantive conclusion remains unchanged under either convention: public health-related R&D budgets are highly concentrated in the U.S. at approximately 68 percent or 60 percent of the total OECD level depending on method used. This implies that U.S. public health-related R&D budgets were about 1.5 - 2.1 times those of the rest of the OECD combined depending on currency conversion method. For comparison, the United Kingdom was the second largest contributor at $3.7 billion (or $4.7 billion PPP adjusted), and Japan was the third largest contributor at $3.3 billion or ($4.6 billion PPP adjusted).
We note that these estimates should be interpreted as public support for health-related R&D, which can be somewhat more general than pharmaceutical-specific R&D, but also excludes some support channels as well. The GBARD measure is defined to include R&D aimed at protecting, promoting, and restoring human health, including medical and social care, and therefore includes public R&D on non-pharmaceutical areas such as diagnostics, medical devices, public health, health services, clinical procedures, behavioral interventions, rehabilitation, and health-system research. Conversely, it excludes or incompletely captures several support channels relevant to drug innovation, including most R&D tax incentives, general university funding that is later used for health research, and R&D by publicly owned enterprises outside the budget process. The estimates should therefore be interpreted as a standardized measure of public health-R&D budgets, not as a product-focused estimate of public funding for pharmaceutical drugs more narrowly.
Given that the U.S. also has a disproportionately high contribution to the push-side of innovation financing it is useful to decompose that $49.5 billion calculation for context. The U.S. government’s public push-side contribution to health-related R&D is highly concentrated in the National Institutes of Health (NIH). Using U.S. National Center for Science and Engineering Statistics (NCSES) and U.S. Department of Defense Budget Estimates for 2022, that $49.5 billion total can be approximately reconciled as follows: about $43.8 billion for NIH/ARPA-H (NCSES Table 18), $2.6 billion for Defense Health Program medical RDT&E (U.S. D.o.D), $1.6 billion for VA medical R&D (NCSES Table 21), and $1.4 billion for other health-related R&D at FDA, CDC, AHRQ, HRSA, and related agencies (NCSES Table 17). Thus, NIH/ARPA-H accounts for nearly 90 percent of the U.S. public health-related R&D total, while defense health, veterans’ medical research, and other HHS agencies account for most of the remainder.
DISCUSSION:
These results complement, rather than substitute for, the better-known literature on international drug price comparisons. Price-index studies are designed to answer a different question: how much higher or lower are prices for comparable market baskets across countries? The contribution of the present study is to shift the lens from average prices to innovative revenues. When the objective is to understand who finances the cost-of-capital-discounted expected returns to R&D, innovative branded revenue is the more appropriate empirical concept.
Several implications follow. First, the international burden of financing pharmaceutical innovation appears considerably more concentrated than a simple reading of total pharmaceutical spending would suggest. The fact that the U.S. share rises from 62.57 percent in the all-drug sample to 66.98 percent in the innovative-drug sample implies that broader expenditure aggregates understate the degree to which innovation finance is centered in the United States. Second, the concentration is strongest for newly launched innovative drugs, where we observe a much larger 79.87 percent U.S. share—which are exactly the products most likely to drive the ex-ante incentives facing firms when they allocate R&D capital. The results remain qualitatively unchanged in sensitivity analyses that take into account gross-to-net price adjustments in the U.S. and abroad. Third, the combination of the population and GDP normalizations, the gross-to-net sensitivity analysis, the country-portfolio heterogeneity analysis as well as the molecule-level disaggregations indicate that the result is not explained away by one narrow mechanism, whether it be nation size or wealth, differential private rebating intensity, fundamentally different drug pipelines utilized across countries, or only price or only volume mechanisms. The U.S. bears a larger burden because innovative products command high revenues there, and those revenues reflect both high relative prices for innovative drugs and robust uptake, especially for new drugs.
CONCLUSION:
Cross-country comparisons of pharmaceutical spending are often used as shorthand for cross-country contributions to innovation. The evidence here shows why that shorthand is incomplete. Once attention is restricted to cost-of-capital-discounted revenues accruing to innovative branded products, the U.S. emerges as the overwhelmingly dominant source of pull-side innovation finance within the OECD, especially for newly launched drugs. That conclusion survives normalization by population and GDP, remains robust to a wide range of differential rebate assumptions, and changes little when the analysis is limited to the differential drug portfolios actively sold in each country. The international debate over drug pricing is therefore also a debate over how the global returns to pharmaceutical innovation are financed. A system in which one country finances most pull-side incentives while many peer countries contribute substantially less than their population or GDP weight is unlikely to be stable indefinitely. Making that burden explicit is a necessary step toward a productive policy discussion of pricing, access, and innovation policy.
REFERENCES:
Acemoglu D, Linn J. Market Size in Innovation: Theory and Evidence from the Pharmaceutical Industry. Quarterly Journal of Economics. 2004;119(3):1049-1090.
Barros PP, Martinez-Giralt X. On International Cost-Sharing of Pharmaceutical R&D. International Journal of Health Care Finance and Economics. 2008;8(4):301-312.
Blume-Kohout ME, Sood N. Market Size and Innovation: Effects of Medicare Part D on Pharmaceutical Research and Development. Journal of Public Economics. 2013;97:327-336.
Cockburn IM, Lanjouw JO, Schankerman M. Patents and the Global Diffusion of New Drugs. American Economic Review. 2016;106(1):136-164.
Danzon PM, Furukawa MF. International Prices and Availability of Pharmaceuticals in 2005. Health Affairs. 2008;27(1):221-233.
Danzon PM, Nicholson S, eds. The Oxford Handbook of the Economics of the Biopharmaceutical Industry. New York, NY: Oxford University Press; 2012.
Danzon PM, Towse A. Differential Pricing for Pharmaceuticals: Reconciling Access, R&D and Patents. International Journal of Health Care Finance and Economics. 2003;3(3):183-205.
Danzon PM, Towse A, Mestre-Ferrandiz J. Value-Based Differential Pricing: Efficient Prices for Drugs in a Global Context. Health Economics. 2015;24(3):294-301.
Danzon PM, Wang YR, Wang L. The Impact of Price Regulation on the Launch Delay of New Drugs: Evidence from Twenty-Five Major Markets in the 1990s. Health Economics. 2005;14(3):269-292.
DiMasi JA, Grabowski HG, Hansen RW. Innovation in the Pharmaceutical Industry: New Estimates of R&D Costs. Journal of Health Economics. 2016;47:20-33.
Dubois P, de Mouzon O, Scott-Morton F, Seabright P. Market Size and Pharmaceutical Innovation. RAND Journal of Economics. 2015;46(4):844-871.
Kyle MK. Pharmaceutical Price Controls and Entry Strategies. Review of Economics and Statistics. 2007;89(1):88-99.
Mulcahy AW, Schwam D, Lovejoy SL. International Prescription Drug Price Comparisons: Estimates Using 2022 Data. Santa Monica, CA: RAND Corporation; 2024.
National Center for Science and Engineering Statistics. 2024. Federal R&D Funding, by Budget Function: Fiscal Years 2022–24. NSF 24-310. Alexandria, VA: National Science Foundation.
OECD. 2025. Health at a Glance 2025: OECD Indicators. Paris: OECD Publishing.
OECD. 2026. OECD Data Explorer: Government Allocations for R&D (GBARD), Socio-Economic Objective: Health. OECD R&D Statistics. Extracted June 4, 2026, current PPP-converted U.S. dollars, current prices.
OECD. Pharmaceutical Innovation and Access to Medicines. OECD Health Policy Studies. Paris: OECD Publishing; 2018.
U.S. Department of Defense. 2023. Defense Health Program: Fiscal Year (FY) 2024 Budget Estimates, R-1 Research, Development, Test and Evaluation Programs. Office of the Under Secretary of Defense (Comptroller).
World Bank. Population, total (SP.POP.TOTL). World Development Indicators. World Bank Group. Accessed April 14, 2026.
World Bank. GDP, PPP (constant 2021 international $) (NY.GDP.MKTP.PP.KD). World Development Indicators. World Bank Group. Accessed April 14, 2026.
Appendix: IQVIA MIDAS Data:
IQVIA collects unit volume distribution data. To estimate sales volume in dollars from the unit volume distribution data, IQVIA uses country-specific price sources to obtain pack price data. For example, pack prices for the Netherlands are sourced from wholesaler price lists and for the UK, the Drug Tariff, Chemist and Druggist is used. This data is collected at different price levels (ex-manufacturer, trade, and public price) based on where Pack Price data is available. The ex-manufacturer (MNF) price represents the wholesaler purchase price and the manufacturers’ selling price. The trade level price represents the pharmacy purchase price and the wholesaler’s selling price. The public price represents the consumer purchase price and the pharmacy selling price. IQVIA uses a proprietary adjustment factor to convert all price levels to the MNF price for reporting purposes.
Definition of a standard unit: “The number of standard ‘dose’ units sold. It is determined by taking the number of counting units sold divided by the standard unit factor which is the smallest common dose of a product form as defined by IQVIA. For example, for oral solid forms the standard unit factor is one tablet or capsule whereas for syrup forms the standard unit factor is one teaspoon (5 ml) and injectable forms it is one ampoule or vial. Standard units should be used when the packs or products being compared are different in form.”
*This content is in the process of Section 508 review. If you need immediate assistance accessing this content, please submit a request to Stephen Murphy, stephen.murphy@hhs.gov. Content will be updated pending the outcome of the Section 508 review.