
U.S. Department of Health and Human Services
Home Health Aide (HHA) Partnering Collaborative Evaluation: Final Report
Penny Feldman, Ph.D., Miriam Ryvicker, Ph.D., Robert Rosati, Ph.D., Theresa Schwartz, B.A., and Gil Maduro, Ph.D.
Visiting Nurse Service of New YorkCenter for Home Care Policy and Research
September 2007
PDF Version: http://aspe.hhs.gov/daltcp/reports/2007/HHAPartfr.pdf (59 PDF pages)
This report was prepared under contract #HHSP23320044304EC between the U.S. Department of Health and the Center for Home Care Policy and Research. For additional information about this subject, you can visit the DALTCP home page at http://aspe.hhs.gov/_/office_specific/daltcp.cfm or contact the ASPE Project Officer, Marie Squillace, at HHS/ASPE/DALTCP, Room 424E, H.H. Humphrey Building, 200 Independence Avenue, S.W., Washington, D.C. 20201. Her e-mail address is: Marie.Squillace@hhs.gov.
The opinions and views expressed in this report are those of the authors. They do not necessarily reflect the views of the Department of Health and Human Services, the contractor or any other funding organization.
TABLE OF CONTENTS
I. INTRODUCTION
Organizational Context
II. OVERVIEW OF THE INTERVENTION
Goals of the HHA Partnering Collaborative
The Collaborative Model
Improvement Strategies
III. EVALUATION DESIGN AND METHODS
Research Design
Data Sources
Analytic Methods
IV. RESULTS
HHA Retention and Job Perceptions Analyses
Patient Outcomes and Service Use Analyses
Implementation Analysis
V. CONCLUSIONS
ATTACHMENT: The Home Health Aide Partnering Collaborative: Implementation Manual [http://aspe.hhs.gov/daltcp/reports/2007/HHAPartmnl.htm]
LIST OF FIGURES
FIGURE 1: Patient Outcomes: Transferring
FIGURE 2: Patient Outcomes: Ambulation
FIGURE 3: Evaluation Timeline and Study Group Classification
FIGURE 4: Data for Evaluating the HHA Partnering Collaborative
FIGURE 5A: Clinically Reported Measures: Transferring
FIGURE 5B: Clinically Reported Measures: Ambulation
LIST OF TABLES
TABLE 1: Patient Admissions Characteristics: Phase I
TABLE 2A: HHA Retention Analyses: Summary Statistics of HHA Characteristics
TABLE 2B: HHA Retention: Logistic Regression for Phase I
TABLE 2C: HHA Retention: Logistic Regression for Phase II
TABLE 3A: Summary Statistics of HHA Characteristics: Respondents vs. Non-Respondents
TABLE 3B: Summary Statistics of HHA Survey Respondent Characteristics by Study Group
TABLE 3C: Summary Statistics of HHA Job Perceptions Survey
TABLE 3D: Regressions on HHA Job Perceptions Survey at Phase I
TABLE 4A: Unadjusted Patient Outcomes and Service Use Measures: Phase I
TABLE 4B: Unadjusted Patient Outcomes and Service Use Measures: Phase II
TABLE 5A: Patient Outcomes: Change in Transferring, Phase I
TABLE 5B: Patient Outcomes: Change in Ambulation, Phase I
TABLE 5C: Patient Outcomes: Change in Bathing, Phase I
TABLE 5D: Patient Outcomes: Length of Stay, Phase I
TABLE 5E: Patient Outcomes: Natural Log of Length of Stay, Phase I
TABLE 5F: Patient Outcomes: Discharged to Community, Phase I
TABLE 5G: Patient Service Use: Nurse Visits per Week, Phase I
TABLE 5H: Patient Service Use: Therapy Visits per Week, Phase I
TABLE 5I: Patient Service Use: HHA Hours per Week, Phase I
TABLE 6A: Patient Outcomes: Change in Transferring, T1P1 vs. T1P2
TABLE 6B: Patient Outcomes: Change in Ambulation, T1P1 vs. T1P2
TABLE 6C: Patient Outcomes: Change in Bathing, T1P1 vs. T1P2
TABLE 6D: Patient Outcomes: Length of Stay, T1P1 vs. T1P2
TABLE 6E: Patient Outcomes: Natural Log of Length of Stay, T1P1 vs. T1P2
TABLE 6F: Patient Outcomes: Discharged to Community, T1P1 vs. T1P2
TABLE 6G: Patient Service Use: Nurse Visits per Week, T1P1 vs. T1P2
TABLE 6H: Patient Service Use: Therapy Visits per Week, T1P1 vs. T1P2
TABLE 6I: Patient Service Use: HHA Hours per Week, T1P1 vs. T1P2
TABLE 7A: Patient Outcomes: Change in Transferring, Control vs. T2P2
TABLE 7B: Patient Outcomes: Change in Ambulation, Control vs. T2P2
TABLE 7C: Patient Outcomes: Change in Bathing, Control vs. T2P2
TABLE 7D: Patient Outcomes: Length of Stay, Control vs. T2P2
TABLE 7E: Patient Outcomes: Natural Log of Length of Stay, Control vs. T2P2
TABLE 7F: Patient Outcomes: Discharged to Community, Control vs. T2P2
TABLE 7G: Patient Service Use: Nurse Visits per Week, Control vs. T2P2
TABLE 7H: Patient Service Use: Therapy Visits per Week, Control vs. T2P2
TABLE 7I: Patient Service Use: HHA Hours per Week, Control vs. T2P2
TABLE 8A: Coordinator of Care Survey: Distribution of "Focused Communication"
TABLE 8B: Coordinator of Care Survey: Distribution of Question 4
TABLE 8C: Coordinator of Care Survey: Distribution of Question 7
ABSTRACT
BACKGROUND AND PURPOSE
The purpose of this evaluation was to assess the impact of the Home Health Aide (HHA) Partnering Collaborative -- a quality improvement initiative implemented at the Visiting Nurse Service of New York (VNSNY) -- in three main areas: (1) patient outcomes; (2) patient service use; and (3) aide job perceptions and retention. The Collaborative was designed to improve the quality of work life and retention of home care paraprofessionals, as well as increase clinicians and aides support for patients self-management and improvement in key activities of daily living.
Beginning in 2003, a small group of VNSNYs service delivery teams and partnering Licensed Agencies (through which VNSNY ensures access to qualified HHAs) participated in a 12-month learning Collaborative process. A core set of strategies emerged, aimed at increasing field support to aides and establishing a framework for aides involvement in patients self-management. Beginning in 2005, the Collaborative strategies were spread throughout the remaining service teams and Licensed Agencies through a two-phase process. First, teams were randomly assigned to control and intervention groups, allowing for a randomized trial of the Collaborative. After ten months, the Collaborative strategies were spread to the original control teams. This design allowed us to address the short-term impact of the Collaborative, as well as the sustainability and effectiveness of the intervention when spread agency-wide.
METHODS
During the randomized trial, the intervention teams received the tools, strategies, and training developed during the early pilot period. During the subsequent spread period, the original control teams implemented the Collaborative strategies, while the original intervention teams continued using them. The evaluation used patient and aide samples drawn from the service teams included in the randomized trial and subsequent spread period. Independent samples were collected for each period.
The evaluation used several data sources, including: (1) a HHA Job Perceptions Survey; (2) human resource and administrative data; and (3) the Outcomes Assessment and Information Set (OASIS). We conducted descriptive and multivariate analyses on aide job perceptions and retention, and risk-adjusted analyses on patient outcomes and service use. The project staff collected and analyzed qualitative data on field staffs perceptions of the Collaborative strategies and the successes and challenges of the spread process.
RESULTS
The major impact of the Collaborative was on patients functional outcomes. During the randomized trial, patients in the intervention group had significantly better outcomes on two of three targeted areas of daily living -- transferring and ambulation -- than patients in the control group. In transferring, 61% of patients in the intervention group showed improvement from the start-of-care to discharge, compared to only 53% in the control group. Although the differences were smaller in ambulation, they were still statistically significant, with 37% showing improvement in the intervention group, compared to 36% in the control group. These improvements were achieved without any significant change in service use (i.e., visits per week) or length of stay. Follow-up analyses determined that the original intervention group sustained these improvements during the agency-wide spread. However, the original control group did not achieve the same results after joining the intervention during the final spread period. Qualitative analyses shed light on the difficulties of achieving improvements in patient outcomes, suggesting that cultural barriers prevented both clinicians and patients from adopting a self-management approach to care.
The intervention did not show an impact on aide job perceptions or retention. Rather, aide work hours were the strongest predictor of job retention; the more hours an aide worked per week, the more likely he/she was to remain in the workforce.
CONCLUSIONS
The most significant results of the Collaborative were the improvements in patients ability to perform the basic functions of transferring and walking with no additional visit intensity. These outcomes have important implications for patient well being. The lack of impact on HHAs job perceptions or retention, however, was a shortcoming of the initiative. These findings suggest several lessons that should be considered in future efforts to adapt the Collaboratives tools and strategies. First, future efforts to improve job retention among paraprofessionals should more fully involve aides as direct participants throughout the improvement process and address structural barriers that prevent aides from obtaining a full workload. Second, in order to improve patients involvement in their care, organizations will need to move beyond implementing a specific tool to address both clinicians and patients attitudes about self-care management. Finally, the difficulties of achieving improvement during the final spread period underscore the importance of not only identifying appropriate improvement strategies, but also addressing the challenges of spreading and sustaining improvement throughout a large organization.
EXECUTIVE SUMMARY
BACKGROUND AND PURPOSE
In the United States, over 600,000 home health aides (HHAs) provide supportive services and personal assistance to patients receiving home health care.1 Although aide services are essential to the health and well being of patients who receive them, the nurses and therapists who comprise the professional home care workforce all too often treat HHAs as unskilled workers with little potential to enhance the overall effectiveness of patient care. The devaluing of aide services has, in turn, been cited as a contributor to aide dissatisfaction, aide turnover and less than optimal patient outcomes. Recent years have seen a growing interest in strategies to develop the capacity of the aide workforce and better integrate these paraprofessionals into care delivery. The Visiting Nurse Service of New York (VNSNY) launched such an initiative in 2003.
The VNSNY Home Health Aide (HHA) Partnering Collaborative was designed to better integrate professional and paraprofessional services and employ established principles of quality improvement to achieve two main goals: (1) improving the quality of work life of home care paraprofessionals, and (2) increasing nurses and aides support for patients improvement in key activities of daily living. The Collaborative also aimed to facilitate change in the culture of health services, moving away from a purely professional model and toward self-care management. In the traditional, professional model of health services, patients, family members, and paraprofessionals have limited roles in decision-making about important aspects of a patients care. Typically, patients are seen as care recipients, and aides as unskilled workers who do for the patient. The self-care management model is centered on patients and informal caregivers as active participants in decision-making and goal-setting, with HHAs playing a key supportive role.
VNSNY is the largest not-for-profit home care agency in the United States serving an average of 25,500 patients daily throughout New York City, Nassau and Westchester County. Like other home care agencies VNSNY has struggled to integrate aide services into its service delivery teams of nurses, therapists and social workers, who provide frontline care under the leadership of their respective teams patient service manager (PSM). The complex structure of home health services -- with a widely dispersed patient population, a widely distributed workforce and heavy reliance on contracted aides -- poses several challenges to integration. First, except for the bi-weekly face-to-face supervision required by Medicare and Medicaid, nurses visits often cannot be scheduled to coincide with the aides assigned schedule. Second, it is not generally feasible for aides to leave their patients to attend team meetings scheduled at a more central location. Third, most aides report to both an aide coordinator or manager and to a nurse or therapist who is responsible for the patients overall care plan. Mixed messages and a lack of coordination between clinical and aide services create barriers to providing high quality care and achieving high levels of satisfaction among nurses, aides, and patients.
In light of this complexity, the Collaborative intervention included four main strategies to address both workforce issues and the need for increasing support for patients self-management (see the attached Implementation Manual at http://aspe.hhs.gov/daltcp/reports/2007/HHAPartmnl.htm for more detail on the improvement strategies and the Collaborative model):
-
Implementation of the "Five Promises" -- a set of field supervision practices designed to promote positive and effective communication among all caregivers while in the patient's home.
-
Use of an "Activities of Daily Living (ADL) Tool" -- a functional health improvement tool used to structure common goal-setting among nurses, patients, and aides.
-
Proactive communication between PSMs and Licensed Agency coordinators -- a recommended weekly phone call or fax to cover aide supervision and service delivery issues.
-
Increase in field support and supervision provided to aides, with required documentation.
These strategies emerged from a 12-month learning Collaborative process modeled after the learning Collaboratives developed and widely disseminated by the Institute for Healthcare Improvement (IHI) to promote sustainable change across the health care industry (IHI, 2003). This model has become increasingly prominent across health care settings as a way of jumpstarting improvement, testing new strategies, and adapting them to continuously achieve better results.
After an initial pilot period, the Collaboratives tools and strategies were tested through a randomized trial conducted between April and September 2005. At the beginning of this period, a total of 45 VNSNY acute and congregate care service teams throughout the Bronx, Brooklyn, Manhattan, and Queens were randomly assigned to control and intervention groups. Following the randomized trial, the strategies were spread to the original control teams between February and July 2006, completing the agency-wide implementation of the Collaborative.
EVALUATION
The project staff at the Center for Home Care Policy and Research conducted a two-phase evaluation, examining the impact of both the randomized trial and the subsequent agency-wide spread on a range of measures, including: (1) HHA job perceptions and retention; (2) case-mix adjusted patient outcomes and discharge dispositions; and (3) patient service use. The evaluation also aimed to identify the successes and challenges of the Collaborative implementation. The two-phase structure of the evaluation allowed us to address the short-term impact of the Collaborative, as well as issues related to the sustainability and effectiveness of the intervention when spread agency-wide.
Several data sources were used in the evaluation, including: (1) a HHA Job Perceptions Survey; (2) human resource and administrative data; and (3) the Outcomes Assessment and Information Set (OASIS), which is a nationally used, standardized patient assessment instrument collected at the start-of-care, at discharge, and every 60 days, whichever is sooner. We also collected qualitative data on the implementation process, including interviews with field managers and observation of team meetings and training sessions.
RESULTS2
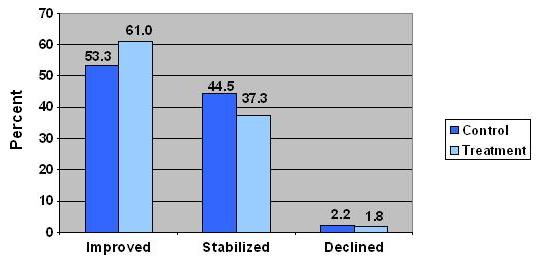
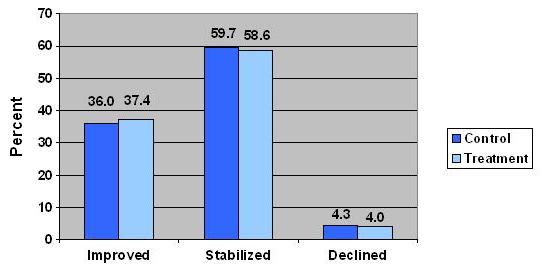
Short-Term Impact: Randomized Trial. The major impact of the Collaborative was on patients functional outcomes. During the randomized trial, patients in the intervention group had significantly better case-mix adjusted outcomes on two of three targeted areas of daily living -- transferring and ambulation -- than patients in the control group. In transferring (Figure 1), 61% of patients in the intervention group showed improvement from the start-of-care to discharge, compared to only 53% in the control group.3 Thus, approximately 14% more patients improved in the intervention group than in the control group. Although the differences were smaller in ambulation (Figure 2), they were still statistically significant, with 37% showing improvement in the intervention group, compared to 36% of the control group. The larger impact in transferring is consistent with national data indicating that it is more difficult to generate improvement in ambulation than in transferring.4
The improvements in patients functional outcomes were achieved without any major change in service use. Thus, increased focus on communication and common goal-setting yielded better outcomes without the need for more visits. Nevertheless, functional improvements were not associated with a significant reduction in length of stay, nor were they associated with greater likelihood of discharge to the community. Across both treatment and control groups, length of stay was approximately 55 days, while approximately 89% of patients were discharged to the community.
At both baseline and follow-up, aides who responded to short job perceptions surveys reported that they were generally treated as an important member of the team, received necessary help from nurses and therapists to do their job and had their opinions about patients heard and appreciated. They reported that they often discussed patients progress in walking, bathing and getting out of bed -- both with nurses and therapists and with patients themselves. There were no significant differences between aides working with Collaborative teams and aides in the control group, perhaps because aide respondents might in general have been more satisfied with these aspects of their job than non-respondents, who had shorter job tenure at the agency and worked fewer hours.
Job retention was relatively high across the board. Approximately 72% of aides employed during each phase of the evaluation were still actively employed and serving at least one VNSNY patient seven months after the start of the intervention (or spread period). Of all the factors analyzed, aide work hours proved to be the most powerful predictor of job retention; the more hours an aide worked per week, the more likely she or he was to remain in the workforce. Association with a Collaborative team did not increase an aides likelihood of being in the VNSNY aide workforce seven months after the start of the Collaborative.
Long-Term Sustainability: Agency-Wide Spread. Follow-up analyses during the agency-wide spread showed that the original intervention group sustained the improvement in patient ADL outcomes ten months after the randomized trial. This suggests that the Collaborative tools and strategies generated changes in frontline practice that were maintained over the long-term. However, the original control group did not show significant improvement after joining the intervention during the agency-wide spread. The spread also did not show an impact on the other patient outcomes examined (discharge disposition and length of stay), service use measures, aide job perceptions, or aide retention. It is possible that the original control group did not show significant improvement because it was difficult to maintain a certain level of intensity in peer-to-peer communication -- which was a major driver of the Collaborative -- as the initiative expanded (discussed further below).
IMPLEMENTATION: SUCCESSES AND CHALLENGES
Collaborative Tools and Strategies. Interviews with managers and observation of team meetings suggested that some of the Collaborative strategies spread more easily than others. Both professional and paraprofessional staff widely embraced the Five Promises. Licensed Agency personnel credited the Five Promises for improvement in nurse-aide relationships, reporting that aides felt more appreciated on the job and more comfortable communicating directly with nurses.
The proactive communication strategies between PSMs and Licensed Agency Coordinators also spread with relative success. Managers reported that, despite the time commitment required, the conference calls and in-person meetings helped to solve problems more efficiently by strengthening the partnering relationship. The new strategies also set the context for innovation. In particular, one team developed a protocol for the coordinator to send the PSM a daily log of aide-patient assignments, aide schedules, and service issues. Additional teams adopted the new protocol, reporting to the Collaborative faculty that it was a useful tool for preventing miscommunications about aide services.
Spreading the ADL Tool proved more challenging. Although anecdotal evidence suggested that aides were in favor of the tool because it helped them make better use of their skills, clinicians were less open to using it. Some PSMs were not persuaded of the immediate value of the tool and resisted extra work for their field nurses. Others who were more enthusiastic about the tool nevertheless struggled to gain buy-in from the field nurses, who actually would be responsible for initiating its use. During the agency-wide spread, the Collaborative faculty implemented a revised version of the tool, which was designed to be more patient-centered and user-friendly. The faculty continued to meet resistance, however, and decided to pursue a broader initiative to improve both clinician and patient readiness for a self-management approach to care.
That patient outcomes improved even while the Collaborative struggled to spread the ADL Tool suggests that it was not the tool itself that led to better outcomes. Rather, the results may have stemmed from the overall emphasis on functional improvement and on collaboration among the clinician, aide, and patient to motivate and enable patients to achieve concrete improvements.
Moving From Experiment to Agency-Wide Spread. Throughout each phase, the Collaborative emphasized peer-to-peer communication as the main driver of the spread. In designing the spread process, the Collaborative faculty recruited frontline staff to be champions of the Collaborative tools and strategies, rather than relying on traditional educational approaches. Discussions with members of the Collaborative faculty suggested that this spread method was more effective during the early adopter phase and randomized trial than it was during the agency-wide spread. As the Collaborative grew larger, the messages communicated from peer-to-peer became more diluted. This may help to explain why the final spread period did not result in new improvements in patient or aide outcomes.
CONCLUSIONS
The most significant results of the Collaborative were improvements in patients ability to perform the basic function of transferring with no additional visit intensity. This outcome may have important implications for patient well being. The lack of impact on HHAs job perceptions or retention, however, was a shortcoming of the initiative. These findings suggest four key lessons that should be considered in future efforts to adapt the Collaboratives tools and strategies.
First, in order to generate improvement in aides perceptions of the job and quality of work life, future efforts need to involve aides more directly throughout the improvement process. Although aides were involved in the Collaborative during its pilot period, sustaining aides participation in subsequent phases of dissemination proved more challenging. Aides work schedules and geographic dispersion make it difficult for aides to attend in-person meetings, where participants provide feedback on their perceptions of the new strategies and share their experiences with implementing and adapting them. Future efforts at replicating and adapting the Collaborative intervention need to address the challenges of involving aides as full participants in the process.
Second, the fact that work hours were the strongest predictor of aide job retention may highlight the need to address structural issues that currently prevent aides from obtaining a full workload. For example, organizations may choose to focus on the scheduling of aide services to minimize travel issues that may make it difficult for aides to take on multiple cases.
Third, although the intervention had a positive and statistically significant effect on both patient transferring and ambulation, only the transferring outcome was substantially improved, while the increased improvement in ambulation was modest. In order to enhance the impact of an evidence-based strategy (such as the ADL Tool) on patient function, the strategy needs to be streamlined into usual practice. Clinicians perceptions of the ADL Tool as redundant and time-consuming underscore the importance of allowing for adaptation to achieve better results. Perhaps more important, organizations need to move beyond implementing a specific tool to address larger cultural issues and attitudes about self-care management. Both nurses and patients expectations of patients involvement in their care can pose barriers to improvement. Improving patients functional self-management therefore calls for widespread support throughout an organization in promoting a self-management model of care.
Finally, the two-phase evaluation design allowed us to assess the interventions sustainability at a ten-month follow-up point. Although we saw sustained improvement in patient outcomes in the original intervention group, it was difficult to achieve these results in the larger spread throughout the rest of the agency. These findings highlight the challenges of spreading and sustaining improvement throughout a large organization. It is therefore critical that leaders not only identify and implement appropriate improvement strategies, but also address the challenge of how to communicate the change message most effectively within the contexts of their organizations.
| FIGURE 1. Patient Outcomes: Transferring (Randomized Trial) |
 |
| FIGURE 2. Patient Outcomes: Ambulation (Randomized Trial) |
 |
I. INTRODUCTION
In 2004, approximately 624,000 home health aides (HHAs) provided supportive services and personal assistance to patients receiving home health care in the United States (Bureau of Labor Statistics, 2006). Although aide services are often essential to the health and well being of home care patients, the nurses and therapists who comprise the professional home care workforce all too often treat HHAs as unskilled workers with little potential to enhance the overall effectiveness of patient care. The devaluing of aide services has, in turn, been cited as a contributor to aide dissatisfaction, aide turnover and less than optimal patient outcomes. Recent years have seen a growing interest in strategies to develop the capacity of the aide workforce and better integrate these paraprofessionals into care delivery. However, little research has been conducted to rigorously evaluate such strategies or assess the linkages between aide integration and job satisfaction, on the one hand, and patient outcomes, on the other.
To address this knowledge gap, we evaluated the Home Health Aide (HHA) Partnering Collaborative implemented at the Visiting Nurse Service of New York (VNSNY). The overarching goal of the HHA Collaborative was to employ established principles of quality improvement (QI) to integrate professional and paraprofessional services, create effective cross-disciplinary learning and yield positive changes in employee, organizational, and patient outcomes. The specific aim of the Collaborative was to optimize the role of the HHA as part of a care team, resulting in patient services matching need, better [patient] self-care management, continuity of care, and improved satisfaction (HHA, patient and staff).
The evaluation staff at the Center for Home Care Policy and Research, VNSNY, examined the impact of both a randomized trial of the Collaborative and a subsequent agency-wide spread. The evaluation addressed three main areas: (1) HHA job perceptions and retention; (2) patient outcomes and discharge dispositions; and (3) patient service use. The evaluation also aimed to identify the successes and challenges of the Collaborative implementation. Further, the two-phase structure of the evaluation allowed us to address issues of sustainability and effectiveness beyond the period of the randomized trial.
ORGANIZATIONAL CONTEXT
VNSNY is the largest not-for-profit home care agency in the United States serving an average of 25,500 patients daily (2006 average daily census) throughout New York City, Nassau and Westchester County. At home care admission, patients are assigned to an acute, long-term, or congregate care service team based on specific needs and location of residence. Managed by a Patient Service Manager (PSM), teams meet bi-weekly to discuss pressing team and patient issues, agency initiatives and practice improvement. VNSNY maintains contracts with multiple Licensed Agencies, in addition to their own subsidiary agency Partners in Care, to ensure that each team has access to a primary and secondary source of qualified HHAs. Aide services are managed by Licensed Agency Coordinators, who work with PSMs to coordinate aide-patient assignment, aide scheduling, and implementation of patient care plans. At VNSNY, and even in smaller agencies that directly employ their aides, the complex structure of home health services poses several challenges for integrating aides into the care team. First, except for the bi-weekly face-to-face supervision required by Medicare and Medicaid, nurses visits often cannot be scheduled to coincide with the aides assigned schedule. Second, it is often not feasible for aides to leave their patients to attend team meetings scheduled at the organizations regional offices. Third, nurses tend to focus on hands-on care and few have received formal training in clinical supervision. Finally, nurses and aides often report to different supervisors from whom they receive different messages. Mixed messages and a lack of coordination between clinical and aide services create barriers to providing high quality care and achieving high levels of satisfaction among nurses, aides, and patients.
II. OVERVIEW OF THE INVERVENTION
GOALS OF THE HHA PARTNERING COLLABORATIVE
The goal of the HHA Partnering Collaborative was to optimize the role of the HHA as part of the care team, resulting in a better match between aide services and patient need, increased aide satisfaction and increased aide retention. Further, the Collaborative sought to move patients toward greater functional independence by changing the aides role from doer to supporter of care and by encouraging nurses and aides to work together to promote patients involvement in their care.
THE COLLABORATIVE MODEL
Beginning in 2003, the Collaborative engaged in an intensive Plan, Do, Study, Act (PDSA) process, a method for accelerating improvement by continuously testing changes and adapting them to their environment to obtain better outcomes (Langley, et al, 1996). The PDSA Cycle is part of the Breakthrough Series model of Collaborative learning developed by the Institute for Healthcare Improvement (IHI), in which participants commit to making measurable improvement through rapid-cycle tests of change (IHI, 2003). On the basis of their reputation for excellence and innovation, seven teams were selected for inclusion in this early pilot phase (two teams from Queens, and one team each from Bronx, Brooklyn, Manhattan, and Staten Island). Three HHAs and three nurses from each of these teams participated in a learning Collaborative process. Over the course of 12 months, the Collaborative faculty -- consisting of QI specialists, senior managers from Contracts Administration, and Clinical Directors -- worked closely with the selected participants to develop field support and supervision strategies meant to foster mutual respect among aides and nurses. (An additional nineteen teams were brought in later as early adopters of the tools and practices the learning Collaborative developed.)
Participants in the early Collaborative created and tested a range of tools and practices, culminating in a set of improvement strategies to be spread agency-wide. The seven teams completed three main tasks to better integrate HHAs as members of the care team and improve the quality of services provided. The tasks were:
-
Developing and testing a functional health improvement tool to structure common goal-setting and regular, ongoing communication among nurse coordinators of care, patients and aides, and to track patient progress in performing activities of daily living (ADLs).
-
Developing and testing improved field support/supervision strategies to foster mutual respect between professional and paraprofessional workers and to increase involvement of aides and licensed agencies in team meetings.
-
Identifying key concepts, tools and goals to be implemented in the agency-wide spread of the Collaborative.
IMPROVEMENT STRATEGIES
The intervention that emerged from the early Collaborative period included four main strategies to be spread agency-wide:5
-
Implementation of the Five Promises -- a set of field supervision practices designed to promote positive and effective communication between all caregivers while in the patients home.
-
Use of an Activities of Daily Living (ADL) Tool -- a functional health improvement tool used to structure common goal-setting among nurses, patients, and aides.
-
Proactive communication between PSMs and Licensed Agency coordinators -- a recommended weekly phone call or fax to cover aide supervision and service delivery issues.
-
Increase in field support and supervision provided to aides, with required documentation.
III. EVALUATION DESIGN AND METHODS
RESEARCH DESIGN
To provide a rigorous evaluation of the HHA Collaborative intervention, the research staff stratified the remaining service delivery teams that had not participated in earlier pilot activities according to the region where they were located (Bronx, Brooklyn, Manhattan and Queens). Then within each region, these teams were randomized to intervention or control status. This sampling strategy yielded a total of 45 teams included in the Evaluation. Twenty-two teams were assigned to the intervention group and 23 teams to the control group. This sample consisted of both acute and congregate care teams.
The Evaluation consisted of two phases. During Phase I, which lasted from April through September 2005, the intervention teams received the tools, strategies, and training developed in the pilot period. The control teams engaged in usual practice during this phase. Phase II took place from February through July 2006. During this phase, the original control teams also received the intervention, thereby spreading the tools, strategies, and best practices developed by the Collaborative to the whole of VNSNYs HHA workforce. The original intervention teams continued with the Collaborative practices (see Figure 3).
For evaluation purposes, the research staff designated the intervention teams during Phase I as T1P1 (standing for Treatment 1, Phase 1). In Phase II, these teams continued in the intervention, becoming T1P2. Since the original control teams joined the intervention in Phase II, they became T2P2. The evaluation timeline and classification of study groups are illustrated in Figure 3.
The evaluation addressed the following hypotheses:
-
HHAs on intervention teams will have more positive perceptions of their integration into the care team and significantly greater retention than aides on teams randomized to usual practice.
-
Controlling for case-mix severity, patients served by intervention teams will have greater likelihood of functional improvement at discharge, shorter lengths of stay, and greater likelihood of discharge to the community than patients served by teams randomized to usual practice.
-
Case-mix adjusted service use will be lower for patients served by intervention teams than for those served by teams randomized to usual practice.
DATA SOURCES
The evaluation utilized quantitative data from several sources to address the above hypotheses. We also collected and analyzed qualitative data to document the successes and challenges of the implementation process and the perceptions of field staff of the Collaboratives tools and strategies. The data sources are listed below in Figure 4.
Quantitative Data. Quantitative data were derived from secondary sources, including the results of HHA job perceptions surveys administered by VNSNYs Office of Contract Administration in conjunction with its Licensed Agency partners; demographic and work history data on HHAs derived from VNSNY and Licensed Agencies human resources files; patient assessment data from the Outcomes Assessment and Information Set (OASIS); and patient service use and billing records.
Job Satisfaction Data. For operational purposes, both Partners in Care (VNSNYs home health care affiliate) and the other Licensed Agencies with which VNSNY contracts for HHA services collected job perceptions data from their HHAs by means of a short survey. The survey instrument contains the following questions:
-
How often do the nurses and therapists you work with give you the help you need to do a good job? »» Never/Sometimes/Usually/Always
-
How often do the nurses and therapists you work with treat you as an important member of the care team? »» Never/Sometimes/Usually/Always
-
How often are your opinions about patients heard and appreciated by the nurses and therapists you work with? »» Never/Sometimes/Usually/Always
-
How often do you discuss patients progress walking, bathing, and getting out of bed with the nurses and therapists you work with? »» Never/Sometimes/Usually/Always
-
How often do you talk to patients themselves about the progress they are making walking, bathing, and getting out of bed? »» Never/Sometimes/Usually/Always
-
Do you agree or disagree with the following statement? Overall, I am a satisfied employee. »» Strongly Disagree/Disagree/Not Sure/Agree/Strongly Agree
In the past, Partners in Care and the other Licensed Agencies administered HHA surveys by mail. However, during the Collaborative implementation, the survey was administered by phone and accessed by aides via an 800 number in three languages: English, Russian, Spanish.6 Coordinators at Partners in Care and the other Licensed Agencies alerted the aides on their service delivery teams (with whom they are in frequent contact) to the survey and gave them the 800 number. HHAs entered their unique Employee Identification Number on the phone, as well as their responses to the survey questions. The research staff received digitized downloads of the survey responses from VNSNYs data vendors. The survey data were linked via the employees ID numbers to demographic and work history data derived from VNSNY and Licensed Agencies human resources and payroll files.
The research staff analyzed three waves of the survey: the first was collected at baseline at the start of the Phase I intervention (April 2005), the second was a follow-up at the end of Phase I (October 2005), and the third was a follow-up at the end of the Phase II spread (October 2006).
OASIS Data.As part of their usual practice, VNSNY nurses and therapists collect data using the OASIS, which all certified home health agencies are required to administer at patients start-of-care, discharge, and 60-day re-certification. Along with items on patient demographics, living arrangements, and informal supports, OASIS captures detailed information on physiologic conditions and comorbidities, symptom severity, risk factors, prognosis, therapies, medication and equipment management, pain, wounds, neurological/cognitive/behavioral status, physical status, functional status (ADL/instrumental activity of daily living), and discharge disposition. Patient-level data were linked to internal claims files (see Service Use and Billing Records below) and transformed into analytic datasets for use in multivariate models to compare the service use, discharge dispositions, and functional outcomes achieved by the control and intervention teams. Full assessment data were utilized in order to adjust for differences in patient case-mix at the start-of-care that might otherwise have confounded the relationship between the intervention and selected outcomes.
Service Use and Billing Records. Patient service use and billing records were used to track length of stay, HHA hours, and numbers of visits provided by nurses and therapists.
Coordinator of Care (COC) Survey.During the course of the Collaborative, the Collaborative faculty sought more information about how COCs perceived key aspects of the intervention. With input from the research team, the faculty developed a short survey. The eight-question survey (below) addressed key points such as communication between COCs and HHAs and the usefulness of the functional improvement tool.7 Questions 1, 2, 3, 5 and 8 inquired about communication with the HHA; questions 2 and 3 were more focused on communication with the patient. Question 4 inquired about the usefulness of the functional improvement tool as a vehicle for communication, while Question 7 asked about tapering hours as the patient becomes more independent.
-
How often do you talk to HHAs about patients general health? »» Never/Seldom/Occasionally/Frequently/Always
-
How often do you talk to patients about the HHAs role as supporter rather than doer of care? »» Never/Seldom/Occasionally/Frequently/Always
-
How often do you engage patients and HHAs in a conversation about patients functional progress? »» Never/Seldom/Occasionally/Frequently/Always
-
How useful do you find the What I Can Do for Myself Tool8 in facilitating these conversations? »»Not Useful/Somewhat Useful/Useful/Very Useful
-
How often do you talk to HHAs about patients Paraprofessional Plan of Care? »» Never/Seldom/Occasionally/Frequently/Always
-
How often do you make changes to patients Paraprofessional Plan of Care? »» Never/Seldom/Occasionally/Frequently/Always
-
How often do you taper HHA hours as patients become more independent? »» Never/Seldom/Occasionally/Frequently/Always
-
How often do you let HHAs know when you will be making your next visit? »» Never/Seldom/Occasionally/Frequently/Always
Separate packets were prepared for each participating team, containing a letter of instructions and copies of the survey. The Regional Administrators instructed team PSMs to introduce the survey and then briefly leave the room to allow for voluntary and anonymous participation. The baseline survey was administered to intervention teams during the last two weeks of September 2005. The second survey was administered to both intervention and control teams during the second two weeks of September 2006. Completed surveys were collected by the Regional Administrators and sent to the Research Team for data entry and analysis.
Qualitative Data.The only primary data collected for the evaluation were qualitative in nature. These data included semi-structured interviews with HHA Partnering Collaborative managers and staff, and observation of service delivery team meetings and other Collaborative events. Training curricula, meeting minutes, and other related documents and records were also reviewed.
ANALYTIC METHODS
The two-phase design of the study allowed for multiple sets of comparisons for the aide and patient analyses. Separate pools of both aide and patient data were extracted for both phases. Aides and patients in the Phase I sample were thus designated as either T1P1 or Control, depending on team affiliation. Individual cases in the Phase II sample were classified as either T1P2 or T2P2. The methods sections that follow include descriptions of how the different comparison groups were treated for both the aide and patient analyses.
HHA Retention and Job Perceptions Analyses
HHA Retention
The purpose of these analyses was to assess the impact of the intervention on HHA job retention. The relevant group in these analyses was aides who served at least one visit to a VNSNY patient during either Phase I of the intervention (April 1, 2005 - September 30, 2005), or Phase II (February 1, 2006 - July 31, 2006). The sample excluded all aides with any prior exposure to pilot versions of the intervention implemented before April 2005.
Phase I. The dependent variable in this analysis was HHA job retention, defined as whether or not an aide served at least one visit between October 15, 2005 and October 31, 2005. We conducted both descriptive analyses and logistic regressions predicting the likelihood that an aide provided care during this two-week window.
The main independent variable of interest was a dichotomous study group measure, coded as 1 for T1P1 and 0 for Control. Aides were classified using an intent-to-treat approach based on their team affiliation at the start of the intervention. (However, since aides often move across multiple teams, they varied widely in their degree of exposure to the intervention. Although we conducted additional analyses using a continuous intervention measure to capture the proportion of hours served to an intervention team, we do not report them here because they yielded results similar to the intent-to-treat analyses.)
In addition to the study group measure, we controlled for the number of teams an aide served, gender, work tenure, and work hours during the intervention period. The number of teams served counted all teams for which an individual aide provided at least one visit during the intervention period. This variable was used as an indicator of a workers flexibility to move across multiple geographic areas. Gender was coded as 1 for female and 0 for male. Work tenure was a dichotomous measure, coded as 1 for aides employed 12 months or less prior to the September 30, 2005 end of the intervention period, and 0 for greater than 12 months prior to September 30, 2005. The work hours variable was defined as the average hours worked per week from April through September 2005.
In the descriptive analyses, we also tested for differences in HHA work hours prior to the intervention to detect any differences in workload at baseline that might have confounded our results. This variable was defined as the average hours worked per week from June 2003 through the end of March 2005. We did not find any significant differences between T1P1 and Control and therefore did not include this measure in the model.
Phase II. To determine the impact of the Phase II spread on HHA retention, we combined the HHA samples extracted during Phase I and Phase II into one dataset, treating the two samples as independent observations. The retention variable for the Phase II sample was calculated for the last two weeks of August 2006. Similarly, the measures of work hours and number of teams served were calculated during the Phase II spread period, and job tenure was calculated as of July 31, 2006. The Phase I and Phase II samples therefore had equivalent variables for their respective timeframes.
We used two main independent variables to separate the effects of the intervention and time. The intervention variable was a dummy variable, referred to as Received Treatment, coded as 1 for all treatment groups (including T1P1, T1P2, and T2P2) and 0 for aides who served the control group during Phase I. The time variable was a dummy indicator for Phase II, coded as 1 for aides employed in Phase II and 0 for Phase I. Using both variables in the regression allowed us to assess whether receiving the treatment affected an aides likelihood of remaining in the workforce, controlling for the timeframe of the treatment.
HHA Job Perceptions
The three waves of the HHA Job Perceptions survey were each linked to the dataset used to analyze HHA retention, allowing us to examine the demographic and work characteristics of survey respondents (gender, tenure, work hours, number of teams served). In order to assess whether any selection biases existed among the survey respondents, we conducted descriptive analyses of these measures across all three survey samples. These analyses examined internal comparisons of respondents characteristics across study groups, as well as external comparisons between respondents and non-respondents.
To determine whether there were significant differences in job perceptions between the Control and T1P1 groups at baseline, we conducted descriptive analyses of the survey collected in April 2005 (prior to start of intervention). We conducted regression analyses on the responses to the follow-up Phase I survey (conducted in October 2005) to assess the impact of the intervention on HHA job perceptions. Each survey question served as a unique independent variable. Questions 1-5 were coded on a scale of 1 to 4, with 1 indicating a response of Never, 2 as Sometimes, 3 as Usually, and 4 as Always. Question 6 was on a scale of 1 to 5, with 1 as Strongly Disagree, 2 as Disagree, 3 as Not Sure, 4 as Agree, and 5 as Strongly Disagree. We also conducted descriptive analyses of the follow-up Phase II survey (conducted in October 2006) to assess any changes that may have occurred between the first and second intervention periods.
Patient Outcomes and Service Use Analyses
The objective of the patient analyses was to assess the impact of the Collaborative on patient functional outcomes, discharge disposition, length of stay, and service use (nurse, therapist, and aide services). A unique sample of patient cases was selected for each phase according to the following timeframes:
-
Phase I: Cases admitted between April 1, 2005 and September 30, 2005, and discharged by December 31, 2005.
-
Phase II: Cases admitted between February 1, 2006 and July 31, 2006, and discharged by October 31, 2006.
The following criteria were used to define the study population, adapted from the work of Tinetti and Baker et al. (2002) in their evaluation of a functional health intervention for home care patients:
- Patient had at least one HHA visit;
- Patient was not severely cognitively impaired;
- Patient was not bedridden;
- Patient did not require 24-hour care;
- Patient was not expected to die within six months;
- Patient did not have highest levels of dependency in ADLs at start-of-care; and
- Patient had room for improvement in at least one of the three ADLs studied (score of 1 or greater at start-of-care).
The selection criteria yielded a total of 3,548 patient cases for Phase I and 3,644 for Phase II. However, additional criteria applied to particular analyses. The analyses of functional outcomes were restricted only to those cases with a discharge assessment, which is not filled out in cases in which the patient was transferred to an in-patient facility or died at home. This restriction yielded a sample of 3,290 cases for the Phase I functional outcomes analyses, and 3,353 for Phase II. Moreover, the sample sizes varied for the analyses of each ADL, since a patient needed to have room for improvement at the start-of-care in the specific ADL studied. For example, a patient with a start-of-care score of 1 in Bathing and 0 in Transferring would have been included in the analysis for Bathing, but not for Transferring.
Phase I Analyses
This phase of the evaluation tested for differences between the T1P1 and Control groups. We used a two-step procedure to conduct a case-mix adjusted analysis of variance, controlling for the clustering of patients within teams (described below). In order to translate our findings into a format typically used for clinical reporting, we also conducted descriptive analyses on dichotomous measures of improvement, stabilization, and decline in each of the ADLs studied.
Dependent Variables. The outcome measures considered were: (1) the change in ADL score from admission to discharge for three ADLs: Ambulation, Bathing and Transferring; (2) Length of Stay and natural log of Length of Stay; and (3) Discharge Disposition. The functional variables were defined as the difference between the ADL score from start-of-care to end of care. (A negative score indicated an improvement -- i.e., a reduction in ADL dependency.) Length of Stay was defined as the number of days per episode. Discharge disposition was measured with a dichotomous categorical variable, coded as 1 for discharged to the community and 0 for all other discharge categories.
Three service use measures were considered: (1) nurse visits per week; (2) therapy visits per week; and (3) HHA hours per week. Since services provided by professional staff are charged by visit (as opposed to an hourly charge), the number of visits per week was the unit of measurement for nursing and therapy services. Nurse visits included services provided by registered nurses, licensed practice nurses, and nurse practitioner consultants. Therapy visits included services provided by physical, occupational, and speech therapists. HHA services are charged on an hourly basis; we therefore used hours per week as the measure for HHA service use.
Independent Variables. The intervention measure -- Study Group -- was defined as a dichotomous variable using an intent-to-treat approach. Cases were coded as 1 for T1P1 and 0 for Control. We also included a categorical measure of team effects with a unique value for each team. The purpose of this variable was to adjust for the clustering of patients within service teams (described in more detail below).
Risk-Adjustment Variables.We used a core set of variables to adjust for patients demographic, clinical and functional risk factors at start-of-care. These were drawn from agency administrative data as well as from the OASIS assessments administered within 24 hours of a patients admission to care. Along with patient demographics, living arrangements, and informal supports, we controlled for patients primary diagnosis, comorbidities, pain, wounds, cognitive status, and functional status. (See Table 1 for measures included in risk-adjustment.)
Modeling Procedures
Step I: Risk-Adjustment Regressions. In order to gauge the effect of the intervention we used a two-step analytic approach. The first step began by running an OLS regression on each outcome to control for the core set of demographic and clinical factors. For Discharge Disposition (binary) the adjustment was performed by a logistic regression. From the estimates we retained the generated adjusted outcomes for the second step of the analysis. For the outcomes analyses, the R-square values for the adjustment models were as follows: Transferring (0.24), Ambulation (0.33), Bathing (0.32), Length of Stay (0.13), log of Length of Stay (0.15) and Discharged to Community (0.06). For the service use analyses, the R-square values were: Nurse visits per week (0.08), Therapy visits per week (0.15), and HHA hours per week (0.17). The Study Group variable (treatment vs. control) was not included in these models since the purpose was to adjust for the effect of the core demographic, clinical and functional patient risk factors.
Step II: Testing for Study Group and Team Effects.Patient outcomes might also be influenced by differences across teams that are unrelated to the intervention. Because of the design of both the VNSNY service delivery system and the study, patients were nested within teams, which were then nested within study groups. This created the potential for confounding team effects and study group effects, making it important to control for any team-level variation unrelated to the intervention.
We therefore conducted analyses of variance on the adjusted outcome measure from Step I, controlling for team-level effects. This step separated out any team-level effects from study group effects. The dependent variable in this step was the residual from the risk-adjustment regression.
Accounting for unbalanced design.The estimates of the variances were obtained by a set of normal equations in the variances. Since our design was unbalanced (we had unequal number of cases per team) we selected proper denominators in performing the F-tests. This was important because the F-tests used were ratios of means of squared sums, which were in turn equated to the normal equations.
Phase II Analyses
The Phase II analyses made cross-time comparisons to address two main questions:
-
Did the original treatment teams sustain the results achieved in the Phase I spread? To address this question, we compared T1P1 and T1P2.
-
Did the original control teams show improvement after joining the intervention in Phase II? For this question, we compared Control and T2P2.
For each set of comparisons, we examined all of the same outcomes and service use measures as we did in the Phase I analyses. The same two-stage method was also utilized for each set of comparisons.
For the comparisons of T1P1 to T1P2, the R-square values for the adjustment models were as follows: Transferring (0.22), Ambulation (0.33), Bathing (0.32), Length of Stay (0.15), log of Length of Stay (0.15), Discharged to Community (0.05), Nurse visits per week (0.08), Therapy visits per week (0.12), and HHA hours per week (0.18).
For the comparisons of Control to T2P2, the R-square values for the adjustment models were: Transferring (0.25), Ambulation (0.34), Bathing (0.31), Length of Stay (0.12), log of Length of Stay (0.13), Discharged to Community (0.05), Nurse visits per week (0.09), Therapy visits per week (0.15), and HHA hours per week (0.18).
Implementation Analysis
Our strategy for understanding the dissemination of Collaborative practices within the agency was two-fold. First, to understand the perspectives and challenges of Collaborative leaders, we observed Collaborative faculty meetings (usually conducted by phone) and convened a bi-weekly meeting of the Evaluation Steering Committee with the Collaborative director and senior adviser. Second, we observed and interviewed field staff and managers directly involved in the implementation process. By attending team meetings, we were able to document COC opinions, PSMs support, as well as the extent and manner in which Collaborative ideas were discussed and presented. Observation of team meetings and Collaborative events allowed us to gain a fuller perspective on the Collaborative implementation. We also analyzed a brief COC Survey about nurses perceptions of Collaborative themes and strategies and their communication with aides.
Qualitative Data
Phase I. During Phase I, field notes were recorded at 11 intervention team meetings, four non-intervention team meetings and four intervention team PSM interviews. Interviews were also conducted at two Licensed Agencies, including two Licensed Agency Coordinators at each agency and one Office Manager. Intervention teams were selected based on ratings of strong and weak given by the clinical directors in each region. The criteria for strong versus weak were subjective and included: (a) the perceived strength of the team leader and facilitator; (b) the strength of the relationship with the primary Licensed Agency; and (c) the number of aides assigned to the team, with the assumption being that the Collaborative could be better managed with fewer aides. Two strong teams and two weak teams were selected for observation. Within a three-month period one or two members of the research team silently observed all meetings held by these four intervention teams, and the PSMs of each team were interviewed. In order to gain perspective on how the Collaborative fit into usual practice improvement efforts, a control team in each region was also selected for silent observation.
In order to analyze the field observations, the research team developed a list of codes used to identify key themes related to the Collaboratives tools and goals. These codes were applied to all field notes from intervention team meetings, PSM interviews, and Licensed Agency Coordinator interviews. A separate code list was developed for analyzing observations of control teams. This list was structured to allow for comparisons between control and intervention teams in particular areas, such as the use of team-level data and discussions about matching services to patients needs. After all field notes were coded, tables were developed to summarize each observation according to theme. These tables formed the basis of the qualitative analysis.
Phase II. The research staff observed four additional team meetings during Phase II to gain insight into any changes that may have occurred in either the implementation process or the views of field managers and staff. We conducted two additional PSM interviews, as well as two interviews with Licensed Agency Coordinators. With the exception of one team meeting, all observations during Phase II included different teams and personnel from those of the Phase I observations. The protocol for coding and analyzing field notes also remained the same.
Coordinator of Care Survey
The research staff conducted descriptive statistics on COCs survey responses and found that there were high correlations among a number of questions. Based on this analysis, we concluded that four of the eight survey questions could be grouped together as a composite variable, which we labeled Focused Communication with HHA and Patient. A composite score was calculated as the average of all COC responses to Questions 1 through 3 plus Question 5. The composite did not include Question 8, which involved general communication not focused on the patients health (How often do you let HHAs know when you will be making your next visit?). A factor analysis further supported this decision by determining there to be one underlying factor in the survey in which Questions 1 through 3 plus Question 5 loaded most highly. We determined the distribution of the composite variable, Focused Communication, among the intervention teams, as well as the distribution of other key variables not included in the composite.
| FIGURE 3. Evaluation Timeline and Study Group Classification | ||||
| PRIOR TOAPRIL 1, 2005 | R A N D O M I Z A T I O N | PHASE IAPRIL 1, 2005 -SEPT. 30, 2005 | PHASE IIFEB. 1, 2006 -JULY 31, 2006 | |
| TreatmentTeams(N=22) | UsualPractice | Intervention»» »» »»T1P1 | Intervention (cont.)»» »» »»T1P2 | |
| ControlTeams(N=23) | UsualPractice | Usual practice»» »» »»CONTROL | Intervention»» »» »» T2P2 | |
| FIGURE 4. Data for Evaluating the HHA Partnering Collaborative | |
| QUANTITATIVE DATA | |
| Data on Home Health Aides | Source |
| Demographic characteristics & employment experience | Human Resources (HR) files (VNSNY/Licensed Agency) |
| Job perceptions | HHA Survey |
| Retention/turnover | HR files (VNSNY/Licensed Agency) Administrative/billing records (VNSNY/Licensed Agency) |
| Data on Patients | Source |
| Length of stay | Administrative/billing records (VNSNY) |
| Case-mix severity (includes demographic, clinical, and functional characteristics) | Administrative/billing records (VNSNY) Outcome and Assessment Information Set (OASIS) data (VNSNY) |
| Functional outcomes | OASIS data (VNSNY) |
| Discharge disposition | Administrative/billing records (VNSNY) OASIS data (VNSNY) |
| Service use | Administrative/billing records (VNSNY/Licensed Agency) |
| Data on Implementation | Source |
| Clinicians perceptions of Collaborative goals and strategies | Coordinator of Care (COC) Survey |
| QUALITATIVE DATA | |
| Data on Implementation | Source |
| Issues related to implementation of Collaborative tools and strategies | Interviews with field managers and Licensed Agency Coordinators Observation of Collaborative events and team meetings Review of Collaborative documents |
| TABLE 1. Patient Admissions Characteristics: Phase I | |||||||
| Control (N=1,904) | T1P1 (N=1,644) | P-val. | |||||
| N | %/mean | Std Dev. | N | %/mean | Std Dev. | ||
| Demographics, % | |||||||
| Age, mean (SD) | 1904 | 75.74 | 12.34 | 1644 | 74.47 | 13.65 | 0.0040 |
| Non-White, % | 814 | 42.75 | 804 | 48.91 | 0.0002 | ||
| Male, % | 534 | 28.05 | 435 | 26.46 | 0.29.03 | ||
| English-speaking, % | 1396 | 73.32 | 1199 | 72.93 | 0.7951 | ||
| Live alone, % | 886 | 46.53 | 830 | 50.49 | 0.0188 | ||
| No primary caregiver, % | 345 | 17.07 | 324 | 19.71 | 0.0426 | ||
| Payer, % | |||||||
| Medicare FFS | 1230 | 64.70 | 1021 | 62.18 | 0.1198 | ||
| Medicaid FFS | 100 | 5.26 | 106 | 6.46 | 0.1295 | ||
| Dually Eligible | 234 | 12.31 | 211 | 12.85 | 0.6281 | ||
| HMO Private | 239 | 12.57 | 231 | 14.07 | 0.1905 | ||
| Admitted from, % | |||||||
| Hospital | 1040 | 54.62 | 922 | 56.08 | 0.3828 | ||
| Nursing or Rehab Facility | 477 | 25.05 | 410 | 24.94 | 0.9380 | ||
| Non-Inpatient Facility | 382 | 20.06 | 305 | 18.55 | 0.2561 | ||
| Diagnosis, % | |||||||
| CHF | 103 | 5.41 | 82 | 5.05 | 0.6304 | ||
| Diabetes | 135 | 7.09 | 141 | 8.58 | 0.0993 | ||
| Hypertension | 94 | 4.94 | 100 | 6.08 | 0.1344 | ||
| COPD | 69 | 3.62 | 59 | 3.41 | 0.7259 | ||
| Ischemia | 69 | 3.62 | 59 | 3.59 | 0.9554 | ||
| HIV | 20 | 1.05 | 27 | 1.64 | 0.1241 | ||
| Stroke | 106 | 5.57 | 91 | 5.54 | 0.9669 | ||
| Clinical Status, % | |||||||
| Regimen Change | 1081 | 56.78 | 957 | 58.21 | 0.3882 | ||
| Wound | 771 | 40.49 | 637 | 38.75 | 0.2889 | ||
| Pressure Ulcer | 73 | 3.83 | 70 | 4.26 | 0.5221 | ||
| Stasis Ulcer | 20 | 1.05 | 17 | 1.03 | 0.9619 | ||
| Surgical Wound | 506 | 26.58 | 434 | 26.40 | 0.9054 | ||
| Urinary Incontinence | 401 | 21.06 | 283 | 17.21 | 0.0038 | ||
| Urinary Catheter | 23 | 1.21 | 30 | 1.82 | 0.1309 | ||
| Bowel Incontinence | 115 | 6.09 | 97 | 5.97 | 0.8762 | ||
| Medium Dyspnea | 956 | 50.21 | 890 | 54.14 | 0.0196 | ||
| High Dyspnea | 26 | 1.37 | 15 | 0.91 | 0.2079 | ||
| Medium Pain | 995 | 52.26 | 878 | 53.41 | 0.4946 | ||
| High Pain | 70 | 3.68 | 96 | 5.84 | 0.0023 | ||
| Medium Cognitive Impairment | 345 | 18.12 | 343 | 20.86 | 0.0393 | ||
| High Cognitive Impairment | 78 | 4.10 | 67 | 4.08 | 0.9746 | ||
| Medium Confusion | 72 | 3.78 | 90 | 5.47 | 0.0160 | ||
| High Confusion | 3 | 0.16 | 6 | 0.36 | 0.2207 | ||
| Comorbidities, mean | 1904 | 407 | 1.21 | 1644 | 4.12 | 1.17 | 0.2271 |
| Functional Characteristics, mean | |||||||
| Ambulation score at SOC | 1904 | 1.27 | 0.63 | 1644 | 1.23 | 0.63 | 0.0931 |
| Bathing score at SOC | 1904 | 2.64 | 0.73 | 1644 | 2.62 | 0.73 | 0.2777 |
| Transferring score at SOC | 1904 | 0.92 | 0.57 | 1644 | 0.86 | 0.59 | 0.0011 |
IV. RESULTS
HHA RETENTION AND JOB PERCEPTIONS ANALYSES
HHA Retention
In Phase I, the sample for both models was restricted to aides whose work hours fell within two standard deviations from the mean, yielding a total N of 11,499. Unadjusted measures of the independent and dependent variables by study group are shown in Table 2A. For purposes of interpretation, the mean and standard deviation are shown for the raw measure of work hours per week, as well as for the natural log of work hours per week. The average hours worked per week for all aides in Phase I was 30.72. The overall retention rate indicated that 72% of all aides who served at least one visit between April 2005 and September 2005 were still actively employed (serving at least one visit) during the last 15 days of October 2005.
The logistic regression on retention did not show an intervention effect during Phase I (Table 2B). The work hours measure was the strongest predictor of retention, with an odds ratio of 2.79 (p=<0.0001). The more hours an aide worked between April and September 2005, the greater the likelihood of retention during the last 15 days of October 2005. The more teams an aide served, the more likely he/she was to stay in the workforce (p=<0.0001). Women had a greater probability of retention than men, and aides employed 12 months or less had a lower probability than aides employed more than 12 months (p=<0.0001 for both measures). The model explained about 12% of the variation in aide retention.
Consistent with the Phase I analyses, the Phase II analyses were restricted to aides whose work hours fell within two standard deviations from the mean, yielding a total N of 22,552 for the combined sample. The average hours worked per week for all aides was 30.24 (Table 2A). The overall retention rate indicated that 71.9% of all aides who served at least one visit during either phase were still actively employed (serving at least one visit) during the last 15 days of month following the end of the relevant intervention period.
As shown in Table 2C, neither time nor the intervention showed significant effects on job retention. Similar to Phase I, the work hours measure was the strongest predictor of retention, with an odds ratio of 2.83 (p=<0.0001). Gender, tenure, and the number of teams served also showed similar effects to the Phase I analyses (p=<0.0001 for all variables). The model accounted for roughly 12% of the variation in job retention.
HHA Job Perceptions
The response rates for all three surveys were low, with 16%, 6%, and 8% for the baseline, Phase I, and Phase II surveys, respectively. The analyses of respondents employee characteristics indicated that there were statistically significant differences between respondents and non-respondents across timeframes (Table 3A). Across all three surveys, respondents worked significantly more hours than non-respondents. In all cases, respondents were employed for more months than non-respondents, but these differences were particularly pronounced at baseline and in the follow-up Phase II survey. In both of the follow-up surveys, respondents served more teams than non-respondents. It is therefore important to take into account that a selection bias may have prevented us from detecting potential changes in job perceptions that might have occurred in the larger pool of HHAs. Slight differences were detected between Control and T1P1 among respondents to the second survey (Table 3B), namely in the log of hours worked per week and the number of teams served; however, these differences only bordered on significance.
Survey respondents scored relatively highly on all six questions at baseline (Table 3C), during Phase I, and during Phase II, regardless of study group. Aides reported that they were generally treated as an important member of the team (an average of roughly 3.3 on a scale of 1-4), received necessary help from nurses and therapists to do their job (3.1 on a scale of 1-4), and had their opinions about patients heard and appreciated (3.2 on a scale of 1-4). They reported that they often discussed patients progress in walking, bathing and getting out of bed -- both with nurses and therapists and with patients themselves (3.5 on a scale of 1-4). Regressions conducted on the Phase I survey (Table 3D) did not show any significant intervention effects on job perceptions, controlling for worker characteristics.
PATIENT OUTCOMES AND SERVICE USE ANALYSES
Admissions Characteristics and Unadjusted Outcomes
Admissions characteristics at the start-of-care for Phase I are shown in Table 1, all of which were included in the patient case-mix adjustment. The Control and T1P1 groups differed on certain demographic measures, such as age, race, living alone, and the presence of a primary caregiver. The two groups were equivalent in payer status, referral source, and diagnosis. Some significant differences were detected in clinical status, namely in urinary incontinence, dyspnea, pain, cognitive impairment and confusion. Significant differences were also detected in transferring at the start-of-care, with the Control group having higher levels of dependency than T1P1. Since all measures shown in Table 1 were included in the risk-adjustment for both phases of the analyses, the start-of-care characteristics for the Phase II sample are not reported here. However, the patient profile for Phase II was comparable to that of Phase I.
The unadjusted outcomes and utilization measures for Phases I and II are shown in Table 4A and Table 4B, respectively. The means of all three ADL outcomes indicate improved functional independence from admission to discharge across all groups (negative values indicate a decrease in severity). In Phase I, Length of Stay was approximately 55 days, while approximately 89% of patients were discharged to the community. The service use measures were similar across groups, with an average of roughly 1.4 nurse visits per week, 1.7 therapy visits per week, and 13 aide hours per week. Length of Stay was slightly lower in Phase II (54 days), and roughly 90% of patients were discharged to the community. Patients in Phase II had similar levels of service use to patients in Phase I.
Phase I Analyses
As intended by the HHA Partnering Collaborative and hypothesized by the research team, the intervention had a positive effect on patient functional outcomes. Both Transferring and Ambulation (Table 5A and Table 5B) showed a statistically significant study group effect after controlling for team effect, with p-values of 0.0436 and 0.0496, respectively. The adjusted means for Transferring and Ambulation showed improvement for T1P1 vs. Control (a negative value signals a decrease in severity). Although Bathing (Table 5C) did not show a significant study group effect, the adjusted means showed that the treatment group was lower in severity than the control group.
For both Transferring and Ambulation, however, the effect sizes for Study Group were modest and accounted for only a small proportion of the variance explained. The remaining variation was explained by significant team effects, with p-values of <0.0001 and 0.0903 for Transferring and Ambulation, respectively. For Transferring, study group accounted for 0.37% of the variation after case-mix adjustment, whereas the team effect accounted for 3.75%. For Ambulation, study group accounted for 0.17% and team effect for 1.84%. Bathing also had a highly significant team effect (p<0.0001).
Figure 5A and Figure 5B illustrate how the control and intervention groups compared using measures of improvement, stabilization, and decline that are typically used for clinical reporting.9 In transferring, 61% of patients in the intervention group showed improvement from the start-of-care to discharge, compared to only 53% in the control group. Therefore, approximately 14% more patients improved in the intervention group than in the control group. The differences were smaller in ambulation, with 37% showing improvement in the intervention group, compared to 36% of the control group. The larger impact in transferring is consistent with national data indicating that it is more difficult to generate improvement in ambulation than in transferring (Granger, 2005).
Length of Stay and log of Length of Stay (Table 5D and Table 5E) showed no significant study group effects after controlling for team effects. Discharge Disposition (Table 5F) did not show a significant study group effect, and the adjusted means indicated that the control and treatment groups had roughly equal distribution of discharge to community vs. other discharge categories. All of these outcomes showed significant team effects: Length of Stay (p=0.0023), log of Length of Stay (p=0.0064), and Discharge Disposition (p=0.0017).
After performing the risk-adjustment and controlling for possible team effects, no significant Study Group effects were found in any of the three service use measures (Table 5G, Table 5H and Table 5I) in Phase I. All three models showed significant team effects (p<0.0001), as found in the patient outcomes models.
Phase II Analyses
The patient outcomes and service use models for Phase II can be found in Tables 6A-6I and Tables 7A-7I. Tables 6A-6I show the set of analyses comparing the original intervention teams during Phase I (T1P1) to the same set of teams during Phase II (T1P2). Tables 7A-7I show the comparisons of the original control teams during Phase I (Control) to the same teams after having joined the intervention in Phase II (T2P2).
Comparison of T1P1 and T1P2. The analyses of Transferring and Ambulation (Table 6A and Table 6B) -- both of which showed a positive intervention effect during Phase I -- did not show significant study group effects. The lack of significant differences between T1P1 and T1P2 suggests that the improvements shown in Phase I were sustained in Phase II. No significant study group effects were shown on the other four outcomes (Bathing, Length of Stay, log of Length of Stay, and Discharged Disposition) or any of the service use measures. This indicates that continuing in the intervention during Phase II did not influence how these teams performed on these measures.
With the exception of Transferring, all of the measures showed significant team effects, which is consistent with our findings in the Phase I analyses. In each of these cases, the effect size was only slightly smaller than the R-square, indicating that the team effects accounted for most of the variation explained in each model.
Comparison of Control and T2P2. None of the outcomes or service use measures showed significant study group effects when comparing the Control group with T2P2. This suggests that joining the intervention in Phase II did not influence how these teams performed on these measures. With the exception of Ambulation, all of the models showed significant team effects. Similar to the first set of analyses, the team effects accounted for most of the variation explained in the model.
IMPLEMENTATION ANALYSIS
Field Observation in Phase I
In analyzing the field observations, we focused on five main themes that were identified a priori as important to the Collaborative. The first three themes related to particular Collaborative strategies: the Five Promises, proactive communication between teams and Licensed Agencies, and the ADL Tool. Some of the strategies spread more easily than others. The other two themes related to key goals of the Collaborative: increasing the regularity of aide supervision and improving work relationships by redefining roles and expectations among patients, aides, and nurses. We also looked for additional themes that we had not identified in advance. One such theme was the relationship between the implementation of the Collaborative and usual practice improvement efforts.
The extent to which PSMs of intervention teams promoted Collaborative tools and goals in team meetings varied, as did nurses responses to the Collaborative. One important observation is that the responsiveness of nurses to the Collaborative did not necessarily reflect whether they were on a strong or weak team. In fact, the PSM and nurses on one of the weak teams expressed some of the most positive views. It is also important to note that the views expressed by Licensed Agency Coordinators suggest that the perspectives of aides on the success and utility of the Collaborative differed from those of nurses. The section below provides an overview of the range of responses to the tools and goals of the Collaborative.
The Five Promises. The Five Promises was discussed in four out of the 11 intervention team meetings observed, and nurses expressed some skepticism in these conversations. After watching a video developed by the faculty to promote the Collaboratives goals and strategies, one nurse expressed the opinion that the Five Promises was unnecessary: Its just logical that you would introduce yourself and talk with the aide. Its just human, its just how to socialize. We dont need a video to show us this. Another nurse replied, If someones not going to interact with the aide, the video wont help. Nevertheless, the Collaborative faculty reported that the Five Promises spread quickly and widely. Licensed Agency personnel expressed positive views about the new strategy. For example, one Coordinator said, The Five Promises really works. Coordinators credited the Five Promises for improvement in nurse-aide relationships, reporting that aides felt more appreciated on the job and more comfortable communicating directly with nurses.
Proactive Communication Strategies.The proactive communication strategies between PSMs and Licensed Agency Coordinators also spread with relative success. Managers reported that, despite the time commitment required, the conference calls and in-person meetings helped to solve problems more efficiently by strengthening the partnering relationship. The new strategies also set the context for innovation. In particular, one team developed a protocol for the Coordinator to send the PSM a daily log of aide-patient assignments, aide schedules, and service issues. Additional teams adopted the new protocol, reporting to the Collaborative faculty that it was a useful tool for preventing miscommunications about aide services.
ADL Tool.In contrast to other Collaborative strategies, the faculty met resistance in spreading the ADL Tool. Nurses and PSMs comments suggested that the ADL Tool had limited utility. Some nurses felt that the ADL Tool was too time-consuming and added unnecessary paperwork to efforts they already made in promoting and tracking patients functional progress. Several nurses expressed concern that patients with cognitive limitations were unable to benefit from the Tool, and that the criteria10 for its use did not sufficiently account for this. One PSM, however, felt that the criteria were too restrictive, and that more patients could benefit from the Tool. Based upon independent feedback from clinicians involved in the intervention, the Collaborative faculty reported to the research team that the ADL Tool was not widely embraced by nurses. This feedback supported our observations of the teams, as well as our findings in the COC Survey (described below).
Informants from two Licensed Agencies also expressed mixed views about the ADL Tool. Two Licensed Agency Coordinators from one agency felt that the Tool reinforced what the aides were already doing to help patients make functional progress. They also perceived that nurses did not always cooperate with aides in using the Tool Collaboratively. In an interview that included two coordinators and an office manager from a different agency, the office manager said that it was difficult to coordinate training on the ADL Tool because she needed to introduce the Tool selectively to aides who served patients on intervention teams. This office manager relied on one-on-one conversations with aides for introducing and reviewing the Tool. The coordinators from the same agency reported that use of the ADL tool did help patients become more independent, but aides did not respond to this positively because it led to a cut in their hours and, therefore, a loss of pay.
Aide Supervision.The goal of improving nurses supervision of aides was discussed in meetings for only one of the four intervention teams observed. The PSM for this team expressed on numerous occasions that the Collaborative has led nurses to document their supervision of aides more consistently. This team saw an improvement in the frequency of supervision, as captured on monthly team Scorecard reports.11 The PSM of a different team said in an interview that nurses had improved the regularity of supervision since the implementation of the Collaborative. Unlike the ADL Tool and Five Promises, however, team-level supervision scores are part of the normal structure of team reporting and practice improvement. In one of the four control teams, the PSM also addressed improvement on supervision while discussing the monthly team Scorecard.
Work Relationships and Culture Change.Despite the conflicting views about the usefulness of Collaborative tools, there was some agreement between PSMs and Licensed Agency coordinators about the effect of the Collaborative on work relationships. All four coordinators interviewed felt that the aides had become better integrated into the intervention teams and aides were more comfortable communicating with nurses. Two of the four PSMs interviewed felt that VNSNYs communication with the Licensed Agencies about aide assignments and patients Plans of Care had become more direct and efficient. The other two PSMs, however, felt that the Five Promises did not introduce anything new to their teams that was not done before. Coordinators still felt that there were obstacles toward improving aide-nurse relationships, such as language barriers and nurses failure to coordinate their visits with the aides assigned schedules.
Several nurses, PSMs, and coordinators cited patients resistance to change in the role of the aide from doer to supporter of care as a common obstacle to culture change. In some team meetings nurses raised concerns about patients who wanted aides to do things for them that were not on the Plan of Care, and the aides felt pressure to comply. Two coordinators reported that patients still tried to get aides to do household chores even when the nurse reviewed the Plan of Care, and that patients expected aides to take instructions from family members. One PSM said that it was the patients, not the nurses or aides, who were most resistant to change.
Follow-Up Observations in Phase II
Field staff, PSMs, and coordinators expressed similar views about key Collaborative strategies during the Phase II spread. In general, the interviews with coordinators and discussions with the Collaborative faculty suggested that the Five Promises spread widely and quickly, despite some continued skepticism from nurses. The proactive communication strategies also continued to spread successfully. However, two key themes emerged from the follow-up observations in Phase II. The first theme pertained to the facultys response to the difficulties of spreading the ADL Tool, and the second related to the lessons learned about the methods of spreading the Collaborative tools and strategies agency-wide.
Refining Collaborative Strategies. To address clinicians resistance to using the ADL Tool, the faculty revised the tool with input from field managers and nurses. The revised version, referred to as the What I Can Do for Myself Tool, was spread during Phase II. In contrast to the earlier version, which was originally designed as a training tool for aides, the second version of the ADL Tool was more focused on patients self-care management. Written from the patients perspective, it was designed to be more user-friendly and had a simpler layout. It was also more flexible, as there was space for patients to define broader goals not necessarily related to the three original ADLs. Another change in the Tool was that, rather than being distributed only to patients who fit certain functional criteria, the new Tool was distributed to all patients upon admission. Nurses could initiate the new Tool with those patients whom they felt could benefit.
Although there was general agreement among the faculty that the new version of the Tool was an improvement, gaining buy-in from nurses during Phase II still proved difficult. After receiving feedback from field staff, the faculty identified a key barrier: clinicians were often unprepared to integrate self-care management into their routine practice or did not believe in the viability of a self-care management model. To respond to this problem, the faculty initiated an effort to address not only the adoption of the Tool but to move the agency toward a wide-scale cultural shift that emphasizes self-care management.
Moving From Experiment to Agency-Wide Spread. Throughout each intervention phase, the Collaborative emphasized peer-to-peer communication as the main driver of the spread. In designing the spread process, the Collaborative faculty recruited frontline staff to be champions of the Collaborative tools and strategies, rather than relying on traditional educational approaches. Discussions with members of the Collaborative faculty suggested that this spread method was more effective during the early adopter phase and randomized trial than it was during the agency-wide spread. As the Collaborative grew larger, the messages communicated peer-to-peer became more diluted. This may help to explain why the final spread period did not result in new improvements in patient or aide outcomes.
Coordinator of Care Survey
In Phase I, each of the 22 intervention teams participated in the survey, yielding a total of 159 RNs, 7 Physical Therapists (PTs) and one other respondent. For the Phase II survey, all 45 intervention and control teams participated, totaling 306 RNs, 35 PTs and six other respondents. An average of seven COCs per team responded to both surveys.
As described earlier, the research staff found high correlations among some of the survey questions and therefore created a composite variable, Focused Communication (Table 8A). In Phase I, 37% of survey respondents scored always (rating = 5) on communication, while 56% scored frequently (rating = 4), and 7% scored occasionally (rating = 3). Similar responses for communication were seen in the Phase II survey, with 35% scoring always, 54% frequently, and 11% occasionally. For both surveys, 0% responded with ratings of seldom or less. This variable did not differ significantly between Phases I and II.
We also analyzed COCs responses on the usefulness of the ADL Tool (or What I Can Do for Myself Tool in Phase II) in facilitating conversations with the HHA and patient about the HHAs role and the patients health and progress (Table 8B). COCs responses supported our qualitative observations that clinicians resisted using the Tool. In Phase I, 71% found the Tool to be somewhat or not useful (rating=1 and 2), 24% useful (rating=3), and 5% very useful (rating=4). Responses in the Phase II survey were nearly identical to the first. This finding supports our observations that the revised Tool did not significantly change COCs views on the usefulness of the Tool.
Finally, we analyzed COCs responses to how often they tapered HHA hours as patients became more independent (Table 8C). Although tapering HHA hours was one of the goals in the early stages of the Collaborative, this goal was de-emphasized as the Collaborative progressed. About 7% of COCs reported in Phase I that they tapered hours seldom or never, 30% occasionally, 45% frequently and 17% always. There were no significant differences between the Phase I and Phase II results on this question.
| FIGURE 5A. Clinically Reported Measures: Transferring (Phase I) |
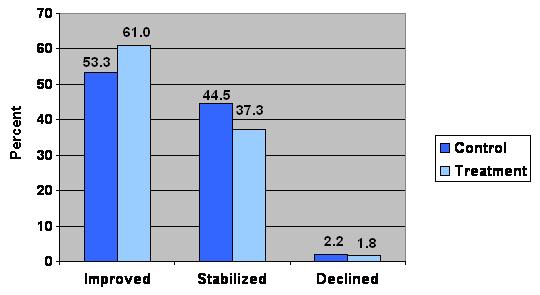 |
| FIGURE 5B. Clinically Reported Measures: Ambulation (Phase I) |
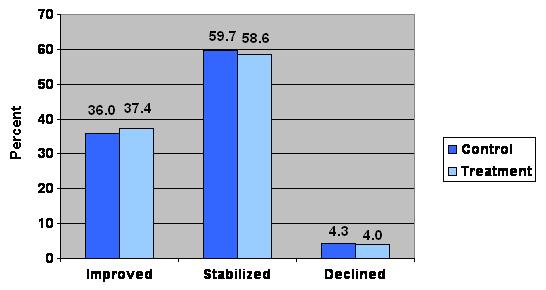 |
| TABLE 2A. HHA Retention Analysis: Summary Statistics of HHA Characteristics | |||||||
| Phase I | Phase II | Both Phases | |||||
| T1P1 (N=5,181) | Control (N=6,318) | Total (N=11,499) | T1P1 (N=5,951) | Control (N=5,102) | Total (N=11,053) | Total (N=22,552) | |
| Number of teams served, mean (SD) | 4.11 (3.38) | 4.52 (3.72) | 4.34 (3.58) | 3.91 (2.99) | 4.18 (3.43) | 4.06 (3.24) | 4.20 (3.42) |
| Female, % | 96.2 | 96.0 | 96.1 | 96.6 | 96.1 | 96.4 | 96.2 |
| Tenure of 12 months or less, % | 33.39 | 36.44 | 35.1 | 33.2 | 36.2 | 34.8 | 34.9 |
| Hours worked per wk, mean (SD) | 30.62 (16.31) | 30.81 (15.85) | 30.72 (16.06) | 29.67 (15.45) | 29.79 (15.23) | 29.73 (15.33) | 30.24 (15.71) |
| Natural log of hrs worked per wk, mean (SD) | 3.27 (0.59) | 3.28 (0.57) | 3.27 (0.58) | 3.24 (0.58) | 3.25 (0.57) | 3.25 (0.57) | 3.26 (0.58) |
| Retained in workforce, % | 71.9 | 72.62 | 72.3 | 71.0 | 72.8 | 71.4 | 71.9 |
| TABLE 2B. HHA Retention: Logistic Regression for Phase I | |||
| N=11,499 | |||
| Est. | O.R. | P-val. | |
| Intercept | -3.3192 | --- | <0.0001 |
| Treatment | 0.0156 | 1.016 | 0.729 |
| Female | 0.5899 | 1.804 | <0.0001 |
| Employed 12 months or less | -0.5759 | 0.562 | <0.0001 |
| Natural log of work hrs (during interv.) | 1.0270 | 2.793 | <0.0001 |
| Number of teams served | 0.1645 | 1.179 | <0.0001 |
| R-square | 0.1235 | ||
| TABLE 2C. HHA Retention: Logistic Regression for Phase II | |||
| N=22,550 | |||
| Est. | O.R. | P-val. | |
| Intercept | -3.2454 | --- | <0.0001 |
| Received treatment | 0.0176 | 1.018 | 0.6943 |
| Phase II (vs. Phase I) | -0.0061 | 0.994 | 0.8792 |
| Female | 0.4573 | 1.58 | <0.0001 |
| Employed 12 months or less | -0.5061 | 0.603 | <0.0001 |
| Natural log of work hrs (during interv.) | 1.0394 | 2.828 | <0.0001 |
| Number of teams served | 0.1599 | 1.173 | <0.0001 |
| R-square | 0.1161 | ||
| TABLE 3A. Summary Statistics of HHA Characteristics: Respondents vs. Non-Respondents | ||||||||||
| Baseline | Follow-up Phase I | Follow-up Phase II | ||||||||
| Respondents | Non-Respondents | P-value | Respondents | Non-Respondents | P-value | Respondents | Non-Respondents | P-value | ||
| Hours per Week | N | 1573 | 8363 | <0.0001 | 737 | 12072 | <0.0001 | 925 | 11166 | <0.0001 |
| Mean | 35.52 | 32.42 | 34.00 | 29.57 | 33.60 | 28.50 | ||||
| Std | 19.95 | 18.67 | 17.05 | 17.66 | 16.28 | 16.72 | ||||
| Log of Hours per Week* | N | 737 | 12072 | <0.0001 | 925 | 11166 | <0.0001 | |||
| Mean | 3.37 | 3.16 | 3.38 | 3.13 | ||||||
| Std | 0.61 | 0.78 | 0.58 | 0.75 | ||||||
| Tenure (12 months or less) | N | 335 | 4201 | <0.0001 | 246 | 4290 | 0.234 | 290 | 3765 | 0.1430 |
| % | 21.06 | 37.45 | 33.38 | 35.54 | 31.35 | 33.72 | ||||
| # Months Employed | N | 1591 | 11217 | <0.0001 | 737 | 12071 | 0.8560 | 925 | 11164 | <0.0001 |
| Mean | 49.06 | 39.65 | 41.13 | 40.80 | 52.34 | 42.74 | ||||
| Std | 47.62 | 46.93 | 49.06 | 46.99 | 56.67 | 48.44 | ||||
| Gender (Female) | N | 1535 | 10779 | 0.446 | 714 | 11600 | 0.281 | 897 | 10754 | 0.313 |
| % | 96.48 | 96.09 | 96.88 | 96.09 | 96.97 | 96.33 | ||||
| # of Teams* | N | 737 | 12072 | <0.0001 | 925 | 11166 | <0.0001 | |||
| Mean | 5.17 | 4.27 | 4.82 | 3.96 | ||||||
| Std | 3.65 | 3.56 | 3.87 | 3.17 | ||||||
| * Data not available from baseline. | ||||||||||
| TABLE 3B. Summary Statistics of HHA Survey Respondent Characteristics by Study Group | ||||||||||
| Baseline | Follow-up Phase I | Follow-up Phase II | ||||||||
| Respondents | Non-Respondents | P-value | Respondents | Non-Respondents | P-value | Respondents | Non-Respondents | P-value | ||
| Hours per Week | N | 691 | 882 | 0.117 | 347 | 390 | 0.271 | 405 | 520 | 0.364 |
| Mean | 34.63 | 36.22 | 33.26 | 34.65 | 33.05 | 34.03 | ||||
| Std | 18.86 | 19.11 | 17.71 | 16.44 | 15.96 | 16.53 | ||||
| Log of Hours per Week* | N | 347 | 390 | 0.059 | 405 | 520 | 0.265 | |||
| Mean | 3.34 | 3.41 | 3.36 | 3.40 | ||||||
| Std | 0.66 | 0.56 | 0.60 | 0.56 | ||||||
| Tenure (12 months or less) | N | 144 | 191 | 0.732 | 111 | 135 | 0.450 | 112 | 178 | 0.032 |
| % | 20.66 | 21.36 | 31.99 | 34.62 | 27.65 | 34.23 | ||||
| # Months Employed | N | 697 | 894 | 0.409 | 347 | 390 | 0.471 | 405 | 520 | 0.107 |
| Mean | 50.18 | 48.19 | 42.51 | 39.90 | 55.74 | 49.68 | ||||
| Std | 48.28 | 47.11 | 46.40 | 51.35 | 57.37 | 56.03 | ||||
| Gender (Female) | N | 672 | 863 | 0.898 | 337 | 377 | 0.725 | 397 | 500 | 0.099 |
| % | 96.41 | 96.53 | 97.12 | 96.67 | 98.02 | 96.15 | ||||
| # of Teams* | N | 347 | 390 | 0.086 | 405 | 520 | 0.528 | |||
| Mean | 4.93 | 5.39 | 4.74 | 4.89 | ||||||
| Std | 3.91 | 3.39 | 3.46 | 4.17 | ||||||
| * Data not available from baseline. | ||||||||||
| TABLE 3C. Summary Statistics of HHA Job Perceptions Survey | |||||||
| Baseline | Follow-up Phase I | Follow-up Phase II | |||||
| T1P1 | Control | T1P1 | Control | T1P2 | T2P2 | ||
| Question 1 | N | 623 | 799 | 307 | 347 | 353 | 432 |
| Mean | 3.15 | 3.18 | 3.12 | 3.10 | 3.21 | 3.15 | |
| Std | 0.96 | 0.95 | 0.93 | 1.00 | 0.92 | 0.97 | |
| Question 2 | N | 629 | 806 | 313 | 357 | 375 | 456 |
| Mean | 3.31 | 3.33 | 3.23 | 3.28 | 3.17 | 3.26 | |
| Std | 0.87 | 0.89 | 0.85 | 0.91 | 0.96 | 0.90 | |
| Question 3 | N | 625 | 793 | 306 | 344 | 355 | 426 |
| Mean | 3.19 | 3.23 | 3.20 | 3.25 | 3.27 | 3.24 | |
| Std | 0.89 | 0.89 | 0.85 | 0.92 | 0.85 | 0.87 | |
| Question 4 | N | 605 | 782 | 310 | 348 | 352 | 421 |
| Mean | 3.15 | 3.18 | 3.15 | 3.23 | 3.18 | 3.20 | |
| Std | 0.93 | 0.90 | 0.93 | 0.92 | 0.91 | 0.90 | |
| Question 5 | N | 608 | 782 | 214 | 299 | 347 | 433 |
| Mean | 3.46 | 3.54 | 3.59 | 3.58 | 3.52 | 3.50 | |
| Std | 0.78 | 0.74 | 0.73 | 0.71 | 0.74 | 0.73 | |
| Question 6 | N | 583 | 763 | 283 | 320 | 338 | 400 |
| Mean | 3.90 | 3.89 | 3.92 | 3.84 | 3.76 | 3.84 | |
| Std | 1.01 | 1.08 | 1.04 | 1.18 | 1.02 | 1.07 | |
| QUESTION 1: How often do the nurses and therapists you work with give you the help you need to do a good job? QUESTION 2: How often do the nurses and therapists you work with treat you as an important member of the care team? QUESTION 3: How often are your opinions about patients heard and appreciated by the nurses and therapists you work with? QUESTION 4: How often do you discuss patients progress walking, bathing, and getting out of bed with the nurses and therapists you work with? QUESTION 5: How often do you talk to patients themselves about the progress they are making walking, bathing, and getting out of bed? QUESTION 6: Do you agree or disagree with the following statement? Overall, I am a satisfied employee. | |||||||
| TABLE 3D. Regressions on HHA Job Perceptions Survey at Phase I | ||||||||||||
| Question 1(N=620) | Question 2(N=637) | Question 3(N=619) | Question 4(N=624) | Question 5(N=483) | Question 6(N=571) | |||||||
| Coeff. | P-val. | Coeff. | P-val. | Coeff. | P-val. | Coeff. | P-val. | Coeff. | P-val. | Coeff. | P-val. | |
| Intercept | 3.1509 | <0.0001 | 3.2049 | <0.0001 | 2.8454 | <0.0001 | 3.2617 | <0.0001 | 3.5063 | <0.0001 | 3.5956 | <0.0001 |
| Treatment | 0.0194 | 0.8020 | -0.0585 | 0.4105 | -0.0377 | 0.6012 | -0.0945 | 0.2067 | 0.0080 | 0.9050 | 0.0756 | 0.4235 |
| Log hours per week | 0.1234 | 0.0534 | 0.0216 | 0.7098 | 0.1179 | 0.0443 | 0.0158 | 0.7978 | -0.0104 | 0.8578 | 0.0847 | 0.2831 |
| Female | -0.3088 | 0.1684 | 0.1193 | 0.5379 | 0.1115 | 0.5652 | -0.0101 | 0.9620 | 0.1086 | 0.5137 | 0.0207 | 0.9386 |
| Employed 12 mo. or less | -0.1198 | 0.1466 | -0.0748 | 0.3192 | -0.0541 | 0.4792 | -0.2139 | 0.0071 | 0.1003 | 0.1541 | -0.1108 | 0.2629 |
| Number of teams served | -0.0252 | 0.0221 | -0.0185 | 0.0666 | -0.0189 | 0.0666 | -0.0015 | 0.8875 | 0.0062 | 0.4857 | -0.0060 | 0.6924 |
| R-squared | 0.0208 | 0.0082 | 0.0130 | 0.0147 | 0.0067 | 0.0058 | ||||||
| QUESTION 1: How often do the nurses and therapists you work with give you the help you need to do a good job? QUESTION 2: How often do the nurses and therapists you work with treat you as an important member of the care team? QUESTION 3: How often are your opinions about patients heard and appreciated by the nurses and therapists you work with? QUESTION 4: How often do you discuss patients progress walking, bathing, and getting out of bed with the nurses and therapists you work with? QUESTION 5: How often do you talk to patients themselves about the progress they are making walking, bathing, and getting out of bed? QUESTION 6: Do you agree or disagree with the following statement? Overall, I am a satisfied employee. | ||||||||||||
| TABLE 4A. Unadjusted Patient Outcomes and Service Use Measures: Phase I | ||||||||||||
| Phase I | ||||||||||||
| T1P1 (N=1,644) | Control (N=1,904) | Total (N=3,548) | ||||||||||
| N | Freq. | Mean/% | S.D. | N | Freq. | Mean/% | S.D. | N | Freq. | Mean/% | S.D. | |
| ADL Outcomes, mean* | ||||||||||||
| Ambulation | 1516 | -0.3252 | 0.6878 | 1744 | -0.3185 | 0.7001 | 3290 | -0.322 | 0.6944 | |||
| Bathing | 1516 | -1.3272 | 1.2443 | 1744 | -1.2869 | 1.2343 | 3290 | -1.305 | 1.2389 | |||
| Transferring | 1516 | -0.4149 | 0.7055 | 1744 | -0.4076 | 0.7166 | 3290 | -0.411 | 0.7114 | |||
| Discharged to community % | 1644 | 1706 | 89.6 | 1904 | 1455 | 88.5 | 3548 | 3161 | 89.1 | |||
| Length of stay, mean | 1644 | 55.39 | 39.80 | 1904 | 55.34 | 38.56 | 3548 | 55.37 | 39.13 | |||
| Service Use Measures, mean** | ||||||||||||
| Average nurse visits per week | 1596 | 1.47 | 1.15 | 1848 | 1.43 | 1.17 | 3444 | 1.45 | 1.16 | |||
| Average therapy visits per week | 1309 | 1.73 | 1.14 | 1546 | 1.76 | 1.16 | 2855 | 1.75 | 1.15 | |||
| Average HHA hours per week | 1596 | 12.93 | 14.62 | 1841 | 12.98 | 13.78 | 3437 | 12.95 | 14.17 | |||
| * Sample restricted to cases with a discharge assessment. ** Sample restricted to cases that received each particular service. | ||||||||||||
| TABLE 4B. Unadjusted Patient Outcomes and Service Use Measures: Phase II | ||||||||||||
| Phase II | ||||||||||||
| T1P2 (N=1,781) | T2P2 (N=1,863) | Total (N=3,644) | ||||||||||
| N | Freq. | Mean/% | S.D. | N | Freq. | Mean/% | S.D. | N | Freq. | Mean/% | S.D. | |
| ADL Outcomes, mean* | ||||||||||||
| Ambulation | 1634 | -0.3490 | 0.7048 | 1719 | -0.3840 | 0.6818 | 3353 | -0.367 | 0.6932 | |||
| Bathing | 1634 | -1.2670 | 1.1995 | 1719 | -1.2980 | 1.2057 | 3353 | -1.283 | 1.2026 | |||
| Transferring | 1634 | -0.3950 | 0.6733 | 1719 | -0.4070 | 0.7005 | 3353 | -0.401 | 0.6873 | |||
| Discharged to community % | 1781 | 1587 | 89.1 | 1863 | 1677 | 90.0 | 3644 | 3264 | 89.6 | |||
| Length of stay, mean | 1781 | 53.16 | 38.60 | 1863 | 54.80 | 38.33 | 3644 | 54.00 | 38.47 | |||
| Service Use Measures, mean** | ||||||||||||
| Average nurse visits per week | 1731 | 1.46 | 1.01 | 1797 | 1.40 | 1.07 | 3528 | 1.43 | 1.04 | |||
| Average therapy visits per week | 1425 | 1.69 | 1.14 | 1477 | 1.73 | 1.18 | 2902 | 1.71 | 1.16 | |||
| Average HHA hours per week | 1732 | 13.64 | 15.52 | 1818 | 13.37 | 13.87 | 3550 | 13.50 | 14.69 | |||
| * Sample restricted to cases with a discharge assessment. ** Sample restricted to cases that received each particular service. | ||||||||||||
| TABLE 5A. Patient Outcomes: Change in Transferring, Phase I | ||||||
| Effect | DF | Sum of Squares | Mean Square | F-value | P-value | Effect Size |
| Study group | 1 | 3.2285 | 3.2285 | 4.32 | 0.0436 | 0.0037 |
| Team | 44 | 32.9195 | 0.7482 | 2.23 | <0.0001 | 0.0375 |
| Error | 2510 | 840.65 | 0.3349 | |||
| R-square | 0.041 | |||||
| Means of Residuals After Adjusting for Team Effects | ||||||
| Control | 0.046 | |||||
| T1P1 | -0.0473 | |||||
| TABLE 5B. Patient Outcomes: Change in Ambulation, Phase I | ||||||
| Effect | DF | Sum of Squares | Mean Square | F-value | P-value | Effect Size |
| Study group | 1 | 1.6312 | 1.6312 | 4.07 | 0.0496 | 0.0017 |
| Team | 44 | 17.6134 | 0.4003 | 1.3 | 0.0903 | 0.0184 |
| Error | 3039 | 936.6404 | 0.3082 | |||
| R-square | 0.019 | |||||
| Means of Residuals After Adjusting for Team Effects | ||||||
| Control | 0.0185 | |||||
| T1P1 | -0.0421 | |||||
| TABLE 5C. Patient Outcomes: Change in Bathing, Phase I | ||||||
| Effect | DF | Sum of Squares | Mean Square | F-value | P-value | Effect Size |
| Study group | 1 | 1.6118 | 1.6118 | 0.69 | 0.4098 | 0.0005 |
| Team | 44 | 102.4203 | 2.3277 | 2.3 | <0.0001 | 0.0305 |
| Error | 3211 | 3256.1753 | 1.0141 | |||
| R-square | 0.031 | |||||
| Means of Residuals After Adjusting for Team Effects | ||||||
| Control | 0.0598 | |||||
| T1P1 | 0.0021 | |||||
| TABLE 5D. Patient Outcomes: Length of Stay, Phase I (number of days) | ||||||
| Effect | DF | Sum of Squares | Mean Square | F-value | P-value | Effect Size |
| Study group | 1 | 568.29 | 568.29 | 0.25 | 0.6191 | 0.0001 |
| Team | 44 | 99750.41 | 2267.05 | 1.72 | 0.0023 | 0.214 |
| Error | 3463 | 4567045.66 | 1318.81 | |||
| R-square | 0.021 | |||||
| Means of Residuals After Adjusting for Team Effects | ||||||
| Control | 2.2215 | |||||
| T1P1 | 1.2079 | |||||
| TABLE 5E. Patient Outcomes: Natural Log of Length of Stay, Phase I | ||||||
| Effect | DF | Sum of Squares | Mean Square | F-value | P-value | Effect Size |
| Study group | 1 | 0.2217 | 0.2217 | 0.3400 | 0.5615 | 0.0002 |
| Team | 44 | 28.4926 | 0.6476 | 1.6200 | 0.0064 | 0.0201 |
| Error | 3463 | 1387.6170 | 0.4007 | |||
| R-square | 0.020 | |||||
| Means of Residuals After Adjusting for Team Effects | ||||||
| Control | 0.0376 | |||||
| T1P1 | 0.0175 | |||||
| TABLE 5F. Patient Outcomes: Discharged to Community, Phase I | ||||||
| Effect | DF | Sum of Squares | Mean Square | F-value | P-value | Effect Size |
| Study group | 1 | 0.0007 | 0.0007 | 0.0 | 0.9449 | 0.0 |
| Team | 44 | 6.7800 | 0.1541 | 1.75 | 0.0017 | 0.0218 |
| Error | 3463 | 304.8165 | 0.0880 | |||
| R-square | 0.022 | |||||
| Means of Residuals After Adjusting for Team Effects | ||||||
| Control | -0.0145 | |||||
| T1P1 | -0.0156 | |||||
| TABLE 5G. Patient Service Use: Nurse Visits per Week, Phase I | ||||||
| Effect | DF | Sum of Squares | Mean Square | F-value | P-value | Effect Size |
| Study group | 1 | 6.6000 | 6.6000 | 2.35 | 0.1234 | 0.0016 |
| Team | 44 | 123.5600 | 2.8100 | 2.42 | <0.0001 | 0.0307 |
| Error | 3360 | 3899.9900 | 1.1600 | |||
| R-square | 0.031 | |||||
| Means of Residuals After Adjusting for Team Effects | ||||||
| Control | -0.0157 | |||||
| T1P1 | 0.0182 | |||||
| TABLE 5H. Patient Service Use: Therapy Visits per Week, Phase I | ||||||
| Effect | DF | Sum of Squares | Mean Square | F-value | P-value | Effect Size |
| Study group | 1 | 0.4036 | 0.4036 | 0.17 | 0.6792 | 0.0001 |
| Team | 44 | 102.4417 | 2.3282 | 2.09 | <0.0001 | 0.0319 |
| Error | 2784 | 3103.6900 | 1.1148 | |||
| R-square | 0.032 | |||||
| Means of Residuals After Adjusting for Team Effects | ||||||
| Control | -0.0120 | |||||
| T1P1 | 0.0142 | |||||
| TABLE 5I. Patient Service Use: HHA Hours per Week, Phase I | ||||||
| Effect | DF | Sum of Squares | Mean Square | F-value | P-value | Effect Size |
| Study group | 1 | 0.6907 | 0.6907 | 0.0 | 0.9710 | 0.0 |
| Team | 44 | 22661.9600 | 515.0446 | 3.20 | <0.0001 | 0.0390 |
| Error | 3462 | 557742.1045 | 161.1000 | |||
| R-square | 0.039 | |||||
| Means of Residuals After Adjusting for Team Effects | ||||||
| Control | 0.1135 | |||||
| T1P1 | -0.1316 | |||||
| TABLE 6A. Patient Outcomes: Change in Transferring, T1P1 vs. T1P2 | ||||||
| Effect | DF | Sum of Squares | Mean Square | F-value | P-value | Effect Size |
| Study group | 1 | 1.325 | 1.325 | 3.43 | 0.0707 | 0.0019 |
| Team | 44 | 16.9943 | 0.3862 | 1.31 | 0.0851 | 0.0241 |
| Error | 2327 | 687.0365 | 0.2952 | |||
| R-square | 0.025 | |||||
| Means of Residuals After Adjusting for Team Effects | ||||||
| T1P1 | -0.0277 | |||||
| T1P2 | 0.0399 | |||||
| TABLE 6B. Patient Outcomes: Change in Ambulation, T1P1 vs. T1P2 | ||||||
| Effect | DF | Sum of Squares | Mean Square | F-value | P-value | Effect Size |
| Study group | 1 | 0.0157 | 0.0157 | 0.03 | 0.87 | 0.0 |
| Team | 44 | 25.5654 | 0.581 | 1.95 | 0.0002 | 0.0288 |
| Error | 2895 | 860.5752 | 0.2973 | |||
| R-square | 0.029 | |||||
| Means of Residuals After Adjusting for Team Effects | ||||||
| T1P1 | -0.0219 | |||||
| T1P2 | -0.0152 | |||||
| TABLE 6C. Patient Outcomes: Change in Bathing, T1P1 vs. T1P2 | ||||||
| Effect | DF | Sum of Squares | Mean Square | F-value | P-value | Effect Size |
| Study group | 1 | 0.4864 | 0.4864 | 0.28 | 0.6021 | 0.0002 |
| Team | 44 | 77.5709 | 1.763 | 1.77 | 0.0014 | 0.0248 |
| Error | 3067 | 3055.4018 | 0.9962 | |||
| R-square | 0.025 | |||||
| Means of Residuals After Adjusting for Team Effects | ||||||
| T1P1 | 0.0024 | |||||
| T1P2 | 0.0374 | |||||
| TABLE 6D. Patient Outcomes: Length of Stay, T1P1 vs. T1P2 | ||||||
| Effect | DF | Sum of Squares | Mean Square | F-value | P-value | Effect Size |
| Study group | 1 | 655.97 | 655.97 | 0.22 | 0.6442 | 0.0001 |
| Team | 44 | 133468.56 | 3033.38 | 2.35 | <0.0001 | 0.0300 |
| Error | 3334 | 4310870.57 | 1293.00 | |||
| R-square | 0.030 | |||||
| Means of Residuals After Adjusting for Team Effects | ||||||
| T1P1 | 1.7518 | |||||
| T1P2 | 0.5569 | |||||
| TABLE 6E. Patient Outcomes: Natural Log of Length of Stay, T1P1 vs. T1P2 | ||||||
| Effect | DF | Sum of Squares | Mean Square | F-value | P-value | Effect Size |
| Study group | 1 | 0.5194 | 0.5194 | 0.74 | 0.393 | 0.0004 |
| Team | 44 | 30.7136 | 0.6980 | 1.74 | 0.0018 | 0.0225 |
| Error | 3334 | 1335.8167 | 0.4007 | |||
| R-square | 0.023 | |||||
| Means of Residuals After Adjusting for Team Effects | ||||||
| T1P1 | 0.0316 | |||||
| T1P2 | -0.0020 | |||||
| TABLE 6F. Patient Outcomes: Discharged to Community, T1P1 vs. T1P2 | ||||||
| Effect | DF | Sum of Squares | Mean Square | F-value | P-value | Effect Size |
| Study group | 1 | 0.1081 | 0.1081 | 0.11 | 0.7415 | 0.0001 |
| Team | 44 | 43.1713 | 0.9812 | 1.65 | 0.0048 | 0.0213 |
| Error | 3334 | 1986.9900 | 0.5960 | |||
| R-square | 0.021 | |||||
| Means of Residuals After Adjusting for Team Effects | ||||||
| T1P1 | 0.1418 | |||||
| T1P2 | 0.1571 | |||||
| TABLE 6G. Patient Service Use: Nurse Visits per Week, T1P1 vs. T1P2 | ||||||
| Effect | DF | Sum of Squares | Mean Square | F-value | P-value | Effect Size |
| Study group | 1 | 0.2897 | 0.2897 | 0.1 | 0.7507 | 0.0001 |
| Team | 44 | 124.7397 | 2.835 | 2.71 | <0.0001 | 0.0356 |
| Error | 3237 | 3380.7725 | 1.0444 | |||
| R-square | 0.036 | |||||
| Means of Residuals After Adjusting for Team Effects | ||||||
| T1P1 | 0.0637 | |||||
| T1P2 | 0.0383 | |||||
| TABLE 6H. Patient Service Use: Therapy Visits per Week, T1P1 vs. T1P2 | ||||||
| Effect | DF | Sum of Squares | Mean Square | F-value | P-value | Effect Size |
| Study group | 1 | 0.5207 | 0.5207 | 0.18 | 0.67 | 0.0002 |
| Team | 44 | 124.4875 | 2.8293 | 2.54 | <0.0001 | 0.0404 |
| Error | 2655 | 2959.2426 | 1.1146 | |||
| R-square | 0.040 | |||||
| Means of Residuals After Adjusting for Team Effects | ||||||
| T1P1 | -0.0681 | |||||
| T1P2 | -0.0249 | |||||
| TABLE 6I. Patient Service Use: HHA Hours per Week, T1P1 vs. T1P2 | ||||||
| Effect | DF | Sum of Squares | Mean Square | F-value | P-value | Effect Size |
| Study group | 1 | 574.4344 | 574.4344 | 1.23 | 0.2729 | 0.0009 |
| Team | 44 | 20500.7181 | 465.9254 | 2.55 | <0.0001 | 0.0335 |
| Error | 3329 | 590895.1306 | 182.4313 | |||
| R-square | 0.034 | |||||
| Means of Residuals After Adjusting for Team Effects | ||||||
| T1P1 | -0.5783 | |||||
| T1P2 | 0.5504 | |||||
| TABLE 7A. Patient Outcomes: Change in Transferring, Control vs. T2P2 | ||||||
| Effect | DF | Sum of Squares | Mean Square | F-value | P-value | Effect Size |
| Study group | 1 | 0.0953 | 0.0953 | 0.12 | 0.7358 | 0.0001 |
| Team | 44 | 36.3711 | 0.8266 | 2.46 | <0.0001 | 0.0378 |
| Error | 2755 | 925.5351 | 0.3359 | |||
| R-square | 0.038 | |||||
| Means of Residuals After Adjusting for Team Effects | ||||||
| Control | 0.0244 | |||||
| T2P2 | 0.0061 | |||||
| TABLE 7B. Patient Outcomes: Change in Ambulation, Control vs. T2P2 | ||||||
| Effect | DF | Sum of Squares | Mean Square | F-value | P-value | Effect Size |
| Study group | 1 | 0.43 | 0.43 | 1.5 | 0.2268 | 0.0004 |
| Team | 44 | 12.5935 | 0.2862 | 0.93 | 0.6016 | 0.0124 |
| Error | 3254 | 1000.0 | 0.3073 | |||
| R-square | 0.016 | |||||
| Means of Residuals After Adjusting for Team Effects | ||||||
| Control | 0.0359 | |||||
| T2P2 | -0.0005 | |||||
| TABLE 7C. Patient Outcomes: Change in Bathing, Control vs. T2P2 | ||||||
| Effect | DF | Sum of Squares | Mean Square | F-value | P-value | Effect Size |
| Study group | 1 | 1.1334 | 1.1334 | 0.57 | 0.4557 | 0.0003 |
| Team | 44 | 88.0427 | 2.001 | 1.99 | 0.0001 | 0.0251 |
| Error | 3405 | 3420.283 | 1.0045 | |||
| R-square | 0.025 | |||||
| Means of Residuals After Adjusting for Team Effects | ||||||
| Control | 0.0658 | |||||
| T2P2 | 0.0084 | |||||
| TABLE 7D. Patient Outcomes: Length of Stay, Control vs. T2P2 | ||||||
| Effect | DF | Sum of Squares | Mean Square | F-value | P-value | Effect Size |
| Study group | 1 | 2731.00 | 2731.00 | 1.23 | 0.2727 | 0.0006 |
| Team | 44 | 97377.80 | 2213.13 | 1.72 | 0.0024 | 0.0201 |
| Error | 3673 | 4737481.02 | 1289.81 | |||
| R-square | 0.020 | |||||
| Means of Residuals After Adjusting for Team Effects | ||||||
| Control | 2.4266 | |||||
| T2P2 | -0.1190 | |||||
| TABLE 7E. Patient Outcomes: Natural Log of Length of Stay, Control vs. T2P2 | ||||||
| Effect | DF | Sum of Squares | Mean Square | F-value | P-value | Effect Size |
| Study group | 1 | 0.6632 | 0.6632 | 0.83 | 0.3666 | 0.0004 |
| Team | 44 | 35.0662 | 0.7970 | 1.96 | 0.0002 | 0.0230 |
| Error | 3673 | 1491.2870 | 0.4060 | |||
| R-square | 0.023 | |||||
| Means of Residuals After Adjusting for Team Effects | ||||||
| Control | 0.0394 | |||||
| T2P2 | -0.0003 | |||||
| TABLE 7F. Patient Outcomes: Discharged to Community, Control vs. T2P2 | ||||||
| Effect | DF | Sum of Squares | Mean Square | F-value | P-value | Effect Size |
| Study group | 1 | 0.3116 | 0.3116 | 0.35 | 0.5577 | 0.0001 |
| Team | 44 | 39.2793 | 0.8927 | 1.6 | 0.0074 | 0.0188 |
| Error | 3673 | 2049.7712 | 0.5581 | |||
| R-square | 0.019 | |||||
| Means of Residuals After Adjusting for Team Effects | ||||||
| Control | 0.1386 | |||||
| T2P2 | 0.1658 | |||||
| TABLE 7G. Patient Service Use: Nurse Visits per Week, Control vs. T2P2 | ||||||
| Effect | DF | Sum of Squares | Mean Square | F-value | P-value | Effect Size |
| Study group | 1 | 1.0066 | 1.0066 | 0.4 | 0.5325 | 0.0003 |
| Team | 44 | 111.9092 | 2.5434 | 2.38 | <0.0001 | 0.0286 |
| Error | 3551 | 3800.6166 | 1.0703 | |||
| R-square | 0.029 | |||||
| Means of Residuals After Adjusting for Team Effects | ||||||
| Control | -0.0077 | |||||
| T2P2 | 0.0418 | |||||
| TABLE 7H. Patient Service Use: Therapy Visits per Week, Control vs. T2P2 | ||||||
| Effect | DF | Sum of Squares | Mean Square | F-value | P-value | Effect Size |
| Study group | 1 | 1.6282 | 1.6282 | 0.71 | 0.4042 | 0.0005 |
| Team | 44 | 101.0 | 2.2955 | 2.01 | <0.0001 | 0.0292 |
| Error | 2946 | 3360.3035 | 1.1406 | |||
| R-square | 0.029 | |||||
| Means of Residuals After Adjusting for Team Effects | ||||||
| Control | -0.0739 | |||||
| T2P2 | -0.0032 | |||||
| TABLE 7I. Patient Service Use: HHA Hours per Week, Control vs. T2P2 | ||||||
| Effect | DF | Sum of Squares | Mean Square | F-value | P-value | Effect Size |
| Study group | 1 | 126.9972 | 126.9972 | 0.2 | 0.5729 | 0.0002 |
| Team | 44 | 17320.6105 | 393.6502 | 2.57 | <0.0001 | 0.0307 |
| Error | 3565 | 546201.5848 | 153.2122 | |||
| R-square | 0.031 | |||||
| Means of Residuals After Adjusting for Team Effects | ||||||
| Control | -0.4742 | |||||
| T2P2 | 0.0838 | |||||
| TABLE 8A. Coordinator of Care Survey: Distribution of Focused Communication (composite variable) | ||||||
| Response (Rating) | Phase I | Phase II | ||||
| Frequency | Percent | Cumulative Percent | Frequency | Percent | Cumulative Percent | |
| Never (1) | 0 | 0.0 | 0.0 | 0 | 0.0 | 0.0 |
| Seldom (2) | 0 | 0.0 | 0.0 | 0 | 0.0 | 0.0 |
| Occasionally (3) | 11 | 6.6 | 6.6 | 37 | 10.7 | 10.7 |
| Frequently (4) | 94 | 56.3 | 62.9 | 188 | 54.2 | 64.8 |
| Always (5) | 62 | 37.1 | 100.0 | 122 | 35.2 | 100.0 |
| TABLE 8B. Coordinator of Care Survey: Distribution of Question 4* | ||||||
| Response (Rating) | Phase I | Phase II | ||||
| Frequency | Percent | Cumulative Percent | Frequency | Percent | Cumulative Percent | |
| Not Useful (1) | 27 | 17.0 | 17.0 | 55.0 | 16.9 | 16.9 |
| Somewhat Useful (2) | 86 | 54.1 | 71.1 | 171 | 52.6 | 69.5 |
| Useful (3) | 38 | 23.9 | 95.0 | 84 | 25.9 | 95.4 |
| Very Useful (4) | 8 | 5.0 | 100.0 | 15 | 4.6 | 100.0 |
| * How useful do you find the What I Can Do for Myself tool in facilitating these conversations? | ||||||
| TABLE 8C. Coordinator of Care Survey: Distribution of Question 7* | ||||||
| Response (Rating) | Phase I | Phase II | ||||
| Frequency | Percent | Cumulative Percent | Frequency | Percent | Cumulative Percent | |
| Never (1) | 2 | 1.2 | 1.2 | 5 | 1.5 | 1.5 |
| Seldom (2) | 9 | 5.6 | 6.8 | 26 | 7.7 | 9.1 |
| Occasionally (3) | 49 | 30.4 | 37.3 | 109 | 32.1 | 41.2 |
| Frequently (4) | 73 | 45.3 | 82.6 | 141 | 41.5 | 82.7 |
| Always (5) | 28 | 17.4 | 100.0 | 59 | 17.4 | 100.0 |
| * How often do you taper HHA hours as patients become more independent? | ||||||
V. CONCLUSIONS
The most significant results of the Collaborative were improvements in patients ability to perform the basic function of transferring with no additional visit intensity. This outcome may have important implications for patient well being. The lack of impact on HHAs job perceptions or retention, however, was a shortcoming of the initiative. These findings suggest four key lessons that should be considered in future efforts to adapt the Collaboratives tools and strategies.
First, in order to generate improvement in aides perceptions of the job and quality of work life, future efforts need to involve aides more directly throughout the improvement process. Although aides were involved in the Collaborative during its pilot period, sustaining aides participation in subsequent phases of dissemination proved more challenging. Aides work schedules and geographic dispersion make it difficult for aides to attend in-person meetings, where participants provide feedback on their perceptions of the new strategies and share their experiences with implementing and adapting them. Future efforts at replicating and adapting the Collaborative intervention need to address the challenges of involving aides as full participants in the process.
Second, the fact that work hours were the strongest predictor of aide job retention may highlight the need to address structural issues that currently prevent aides from obtaining a full workload. For example, organizations may choose to focus on the scheduling of aide services to minimize travel issues that may make it difficult for aides to take on multiple cases.
Third, although the intervention had a positive and statistically significant effect on both patient transferring and ambulation, only the transferring outcome was substantially improved, while the increased improvement in ambulation was modest. In order to enhance the impact of an evidence-based strategy (such as the ADL Tool) on patient function, the strategy needs to be streamlined into usual practice. Clinicians perceptions of the ADL Tool as redundant and time-consuming underscore the importance of allowing for adaptation to achieve better results. Perhaps more important, organizations need to move beyond implementing a specific tool to address larger cultural issues and attitudes about self-care management. Both nurses and patients expectations of patients involvement in their care can pose barriers to improvement. Improving patients functional self-management therefore calls for widespread support throughout an organization in promoting a self-management model of care.
Finally, the two-phase evaluation design allowed us to assess the interventions sustainability at a ten-month follow-up point. Although we saw sustained improvement in patient outcomes in the original intervention group, it was difficult to achieve these results in the larger spread throughout the rest of the agency. These findings highlight the challenges of spreading and sustaining improvement throughout a large organization. It is therefore critical that leaders not only identify and implement appropriate improvement strategies, but also address the challenge of how to communicate the change message most effectively within the contexts of their organizations.
REFERENCES
Granger, Carl V. 2005. Quality and Outcome Measures for Rehabilitation Programs. http://www.emedicine.com/pmr/topic155.htm#target9.
Institute for Healthcare Improvement (IHI). 2003. The breakthrough series. IHIs collaborative model fro achieving breatkthrough improvement. Retrieved February 22, 2007, from http://www.ihi.org/ihi.
Langley G.J., Nolan K.M., Nolan T.W., Norman C.L., Provost L.P. 1996. The Improvement Guide. San Francisco, CA: Jossey-Bass Publishers, Inc.
Tinetti, M.E., Baker, D., Gallo, W.T., Nanda, A., Charpentier, P., OLeary, J. 2002. Evaluation of restorative care vs. usual care for older adults receiving an acute episode of home care. JAMA 287(16):2098-2105.
U.S. Department of Labor, Bureau of Labor Statistics. 2006. Occupational employment, training, and earnings data: Occupation search. Retrieved July 10, 2007, from http://data.bls.gov.
NOTES
-
Occupational Employment, Training, and Earnings Data: Occupation Search. U.S. Department of Labor, Bureau of Labor Statistics. October 4, 2006. http://data.bls.gov. Retrieved July 10, 2007.
-
The methods and results of the evaluation are reported in detail in the Final Report.
-
Stabilization is defined here as having no change from admission to discharge.
-
Granger, Carl V., M.D. (2005). "Quality and Outcome Measures for Rehabilitation Programs." http://www.emedicine.com/pmr/topic155.htm#target9.
-
Further documentation of these strategies can be found in The Home Health Aide Partnering Collaborative: Implementation Manual. [http://aspe.hhs.gov/daltcp/reports/2007/HHAPartmnl.htm]
-
HHAs are familiar with telephone response systems, as each is required to call in at the end of each patient visit to record tasks completed for the patient.
-
Listed here are the questions used for the second survey. Some content and numerical order was altered from the baseline to second survey. These discrepancies were considered and accounted for in any analyses conducted.
-
The What I Can Do for Myself tool was created out of use and feedback from the original ADL Tool. A similar question referring to the ADL Tool was asked in the baseline survey.
-
Although unadjusted outcomes are shown in these figures, the adjusted outcomes were very similar.
-
The criteria for using the ADL Tool were defined as follows: (1) patients must have potential for improvement; (2) patients must have an OASIS score of 2 or higher for ambulation, bathing, or transferring; and (3) the Paraprofessional Plan of Care must include assistance in one or more of these ADLs.
-
The monthly Scorecard is a reporting mechanism used by VNSNYs Quality Management Services in tracking the progress of each team toward strategic targets related to team process, cost, clinical outcomes, and patient satisfaction. The frequency of aide supervision is one of the measures reported on the Scorecard.
To obtain a printed copy of this report, send the full report title and your mailing information to:
U.S. Department of Health and Human ServicesOffice of Disability, Aging and Long-Term Care PolicyRoom 424E, H.H. Humphrey Building200 Independence Avenue, S.W.Washington, D.C. 20201FAX: 202-401-7733Email: webmaster.DALTCP@hhs.gov
RETURN TO:
Office of Disability, Aging and Long-Term Care Policy (DALTCP) Home [http://aspe.hhs.gov/_/office_specific/daltcp.cfm]Assistant Secretary for Planning and Evaluation (ASPE) Home [http://aspe.hhs.gov]U.S. Department of Health and Human Services Home [http://www.hhs.gov]