
This paper presents data on the current state of Medicaid, the nation's program providing health and long-term care services to low-income families, elderly, and disabled individuals. The paper reports both historical and projected trends in Medicaid enrollment and spending. Information is presented on trends by major Medicaid eligibility category with some additional information by state.
"I. Introduction
This report has been prepared to provide data on the current state of Medicaid, the nation’s program providing health and long-term care services to low-income families, elderly and disabled individuals. The Centers for Medicare and Medicaid Services (CMS), formerly called the Health Care Financing Administration, within the Department of Health and Human Services, is responsible for overseeing the Medicaid program. The report presents historical and projected future enrollment and spending trends for this vitally important program.1 Medicaid is now the largest health insurance program in the United States, providing services to an estimated 58.6 million people and spending $298 billion in 2004. Given Medicaid’s projected spending growth rate over the next ten years, questions have been raised about Medicaid’s financial sustainability. Both Medicare and Social Security have annual Trustees’ reports that provide both policymakers and the public with at least a partial measure of those programs financial viability. Since Medicaid does not have a group of trustees to periodically report on its status, the purpose of this report is to provide a more complete picture of the future of the Medicaid program than has been previously available.
1 ASPE has attempted to present consistent numbers throughout this report; however, some inconsistencies may appear due to the use of different sources and estimating techniques for some information.
II. Highlights
a) Enrollment
- Medicaid enrollment increased from 41.4 million in 1999 to 58.6 million in 2004, a 14 percent increase. Enrollment is expected to increase another 24 percent to 72.8 million by 2016.
- Among the four major categories of Medicaid enrollment (children, adults, aged, and disabled), children make up the largest number of enrollees covered under Medicaid and accounted for almost half of all enrollees in 2004.
- The number of children enrolled in Medicaid is projected to increase from 28.7 million in 2004 to 35.4 million in 2016, a 23 percent increase. The number of aged enrollees will increase by 1.7 million (5.2 million to 6.9 million), an increase of 33 percent. The share of total enrollees will remain the same for children (48.9 percent to 48.6 percent), while the share of the total for aged enrollees will slightly increase (8.9 percent to 9.5 percent).
- While varying by state, Medicaid on average covers 26 percent of all children in the U.S. and 8 percent of all nonelderly adults.
- States enroll 58 percent, on average, of their low-income children in Medicaid.
b) Expenditures
- Overall Medicaid expenditures increased by 65 percent, from $180.5 billion to $298 billion between 1999 and 2004, a faster rate than private insurance and Medicare (51 percent and 45 percent respectively).
- Recent estimates from the Centers for Medicare and Medicaid Services (CMS) Office of the Actuary (OACT) indicate total expenditures for Medicaid, both federal and state, represented 2.5 percent of the nation’s Gross Domestic Product (GDP) and 15.9 percent of the nation’s total health spending of $1.9 trillion in 2004. The federal share of Medicaid expenditures has averaged about 57 percent of the overall total for the past decade.
- Medicaid expenditures will continue to increase at rates exceeding overall health care spending. Projections by OACT indicate that Medicaid spending is expected to increase at a rate of nearly eight percent per year over the next ten years.
- Estimates indicate that total Medicaid spending will increase by 132 percent to $690.1 billion in 2016 and represent 3.1 percent of GDP, up from 2.5 percent in 2004.
- Children utilize fewer services than the other Medicaid enrollment groups and on average incur $1,200 in expenses annually compared to $8,600 per aged enrollee.
- The largest category of Medicaid expenditures is nursing facility costs, representing 20 percent of total expenditures in 2004. However, OACT projects that home health services will experience the fastest rise in spending between 2004 and 2016, increasing its share of total spending from 11 percent to 18 percent.
- Spending on Medicaid has increased faster than any other major spending category for states. As a percent of total state spending, Medicaid has risen from 19.5 percent in 1999 to an estimated 21.9 percent in 2004, and now surpasses spending on elementary and secondary education as the top-spending category for states.
III. Background
Medicaid is a program that pays for medical assistance for certain individuals and families with low incomes and resources. The program became law in 1965 and is jointly funded by the Federal and state governments (including the District of Columbia and the Territories) to assist states in providing medical acute and long-term care assistance to people who meet certain eligibility criteria.2 Medicaid is the largest source of funding for medical and health-related services for people with limited income.
The following is a brief description of the eligibility, benefits, and financing requirements for Medicaid. A more detailed description of each can be found in Appendix B.
a. Eligibility
To qualify for Medicaid, two tests must be met: an income and assets test and a ‘categorical test.’ Individuals must be low-income and have low assets, but they must also fall into one of the population categories that Medicaid covers. Medicaid categorical eligibility can be classified into four broad coverage groups: children, adults (specifically parents of dependent children and pregnant women), aged and disabled. Within these groups certain requirements must be met, including income, resources, and citizenship status. While operating within federal parameters, the rules for counting income and resources vary from state to state and from group to group.
Therefore, Medicaid does not provide medical assistance for all poor persons. Indeed, it is very unlikely that any non-elderly, non-disabled adult who does not have a dependent child living at home can qualify for Medicaid (unless the adult is a pregnant woman). Medicaid only provides health care services for low-income persons in one of the designated groups and low income is only one test for Medicaid eligibility for those within these groups.
The Medicaid statute requires states to cover certain groups, known as “mandatory populations,” and they have the discretion to cover additional groups, known as “optional populations.” States have substantial flexibility to cover optional populations by submitting State Plan Amendments (SPAs) to CMS and having them approved with whatever conditions are imposed by CMS. Similarly, states have total flexibility to discontinue coverage for optional populations through SPAs.3 Individuals in any eligibility group that a state chooses to cover who meet the eligibility criteria for that group are eligible for Medicaid if they apply for benefits.
b. Benefits
Mirroring eligibility provisions, Medicaid also requires states to cover certain benefits for the categorically needy, known as “mandatory services,” and it permits states to cover additional benefits, known as “optional services.” In addition, both mandatory and optional benefits are governed by the requirement that the “amount, duration, and scope” of all services must be state-wide and comparable, which means that all Medicaid benefits must be equally available to all categorically eligible enrollees within each state.4‚5
Some of the mandatory services include inpatient hospital services; outpatient hospital services; physician services; medical and surgical dental services; and nursing facility services for individuals aged 21 or older.
Several of the more commonly covered optional services include clinic services; nursing facility services for the under age 21; intermediate care facility/mentally retarded services; optometrist services and eyeglasses; and prescription drugs.
c. Financing
Medicaid is financed jointly by the federal and state governments. The portion of the Medicaid program that is paid by the Federal government, known as the Federal Medical Assistance Percentage (FMAP), is determined annually for each state by a formula that compares the state's average per capita income level with the national average.6 By law, the FMAP cannot be lower than 50 percent nor greater than 83 percent. The wealthier states, as measured by per capita income, have a smaller share of their costs reimbursed. The federal government also shares in the state's expenditures for administration of the Medicaid program at generally 50 percent. Due to the entitlement nature of Medicaid, the amount of total federal outlays for Medicaid has no statutory limit.
States must establish reimbursement rates sufficient to enlist enough providers so that medical care and services are available at least to the extent that such care and services are available to the general population in that geographic area. States must also augment payment to qualified hospitals that serve a disproportionate number of Medicaid and low income patients. Each state is limited by an overall State-specific disproportionate share hospital (DSH) allotment and the amount of DSH payment may not exceed a hospital’s uncompensated care regarding the provision of inpatient and outpatient services to Medicaid and uninsured patients. However, the federal government generally has little discretion over the payment rates established by states, as long as they fall within broad federal parameters to insure against excessively large or small payments.7
2 Public Law 89-97
IV. Historical Trends
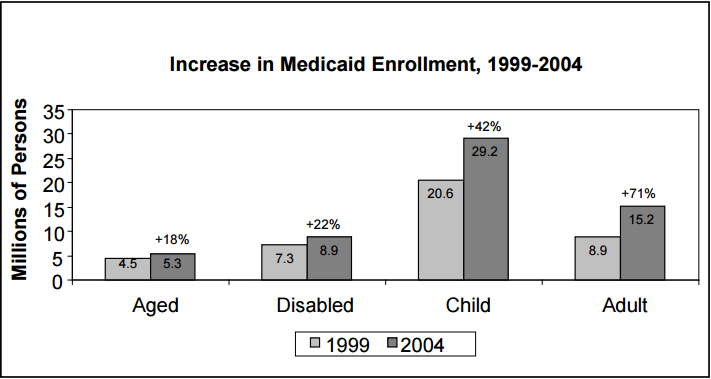
The Medicaid program, as the safety net for much of the nation’s low-income population, bears an increasing responsibility for providing health coverage for this segment of the nation’s population. For the five year period from 1999 to 2004, total enrollment in the program increased by 42 percent. This growth coincides with an erosion of employer-sponsored health benefits. Private insurance has become less available and more costly for employees as employers shift more of the plan costs (coinsurance and copays) to their employees. And though the percent of premiums paid for by the employee has remained unchanged, the cost for their share of the premium continued to rise at a faster rate than income over the past decade. While median family income increased by 46 percent from 1993 to 2003, the average monthly worker contribution for family premiums increased 74 percent.8
Non-aged and non-disabled adults show the largest percentage increase in enrollment of the four major eligibility categories, growing from 8.9 million to 15.2 million between 1999 and 2004, an increase of 71 percent. Children experienced the largest numerical change from 20.6 million to 29.2 million, increasing by 42 percent.9 The disabled increased by 22 percent, while the aged increased 18 percent.10
Figure 1
Source: Office of the Actuary, CMS
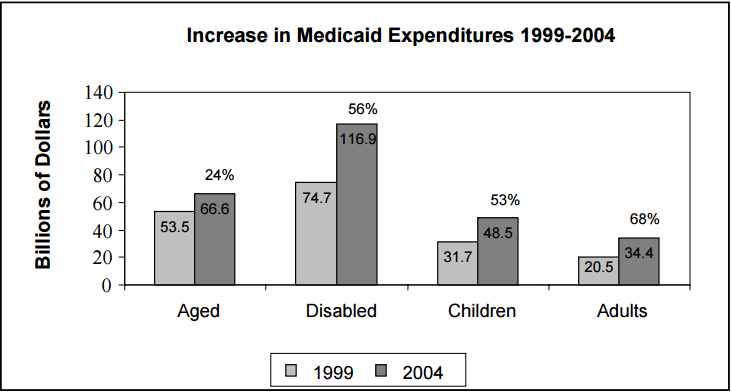
Consistent with the rapid rise in enrollment, Medicaid expenditures increased at a faster rate than other insurance coverage types between 1999 and 2004. Overall Medicaid expenditures increased by 56 percent from $180.5 billion to $281.8 billion, with spending on adults increasing by 68 percent, the greatest increase among all enrollment categories.
These increases compare to increases of 51 percent for private insurance expenditures and 36 percent for Medicare over the same time period.
Figure 2
Source: Office of the Actuary, CMS
Medicaid spending has risen faster than the rate of growth in the nation’s Gross Domestic Product. Consequently, Medicaid’s proportion of GDP had risen from 2.0 percent of GDP in 1999 to 2.5 percent in 2004.
V. Current Medicaid Data
a. Federal/State Spending
Medicaid expenditures continue to rise along with health care spending in general. The total expenditures for Medicaid by both federal and state sources were $298 billion in 2004. This represents 2.5 percent of the nation’s Gross Domestic Product (GDP) and 15.9 percent of the nation’s total health spending of $1.9 trillion. The federal share of Medicaid expenditures has averaged 57 percent of the overall total for the past decade.
Table 1
| Federal | State | Total | |
|---|---|---|---|
| 2004 Medicaid (billions) | $176.40 | $121.60 | $298.00 |
| Medicaid Spending as % of GDP | 1.5% | 1.0% | 2.5% |
Source: President’s FY 2007 Budget Baseline for Medicaid Program, CMS
b. Enrollment
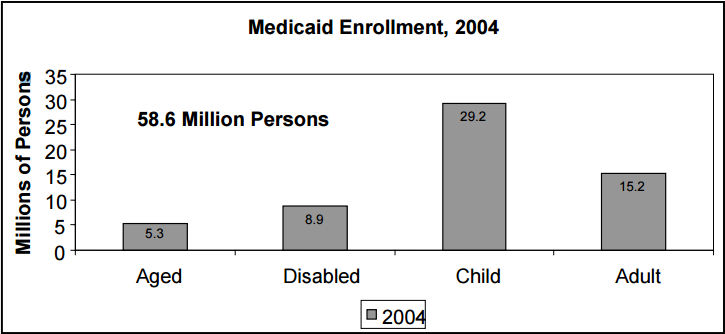
The CMS Office of the Actuary’s (OACT) most recent report estimates the number of Medicaid enrollees at 58.6 million for 2004.
As shown in Figure 3, children are the largest segment of Medicaid enrollees. Of the four major categories of individuals covered under Medicaid, children numbered 29.2 million in 2004. There were 15.2 million adults enrolled in Medicaid, 8.9 million disabled and 5.3 million aged.
Figure 3
Source: President's FY 2007 Budget Baseline for Medicaid, CMS
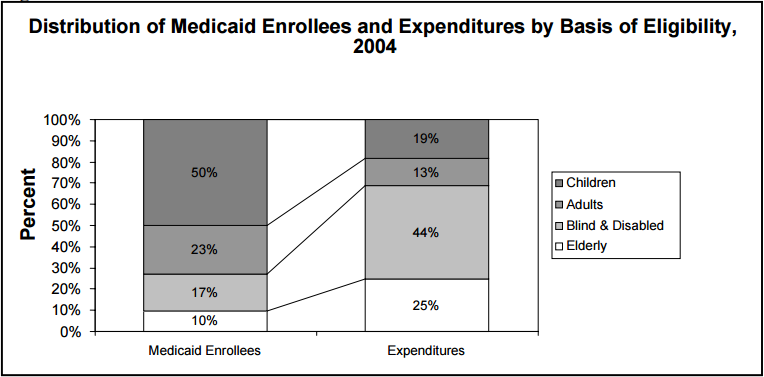
The proportion of total enrollment that each category represents is very different from the proportion of expenditures paid on behalf of each category. This discrepancy can be seen in the distributions presented in Figure 4.
Children make up the largest number of enrollees covered under Medicaid, but utilize a much smaller relative amount of services as measured by dollars expended on their behalf. As shown in Figure 4 below, children represent half of all enrollees, but only 19 percent of total expenditures, whereas the aged represent only ten percent of enrollees but consume 25 percent of total expenditures. Similarly, the blind and disabled represent only 17 percent of Medicaid enrollment but represent 44 percent of Medicaid expenditures. The discrepancy between enrollment and expenditures is dramatically reflected in the different federal per capita costs for the four groups. OACT estimates that per capita expenditures for these categories range from a low of $1,200 per child in 2004 to a high of $8,600 per aged enrollee.
Figure 4
Source: President's FY 2007 Budget Baseline for Medicaid, CMS
Note: Total expenditures on benefits exclude DSH payments.
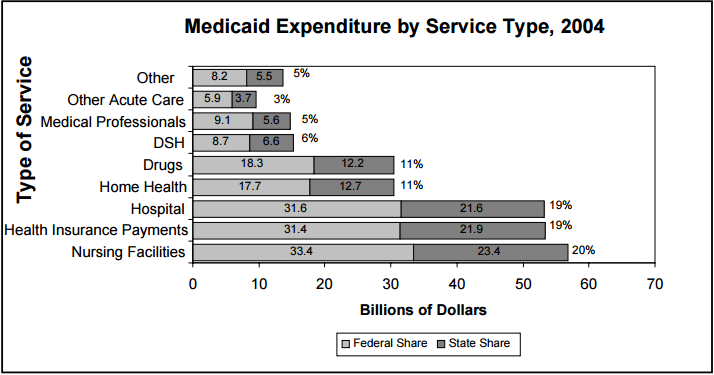
c. Expenditures by Service Type
When looking at Medicaid expenditures by service type (see Figure 5), the largest category of spending is for nursing facility costs. Individuals receiving these services are mainly the aged and disabled, but may also include some children and adults.
Health insurance payments and hospitals represent the next largest categories of expense. Health insurance payments include payments to Medicare for the low-income elderly’s premiums, coinsurance and deductibles; premiums to group and pre-paid health plans (including HMO capitation and Medicaid managed care payments); premium assistance programs on behalf of low-income workers toward their share of employer plan premiums; and other premium payments. Hospital care includes both inpatient and outpatient care, as well as mental health hospital care.
Other major categories of expense include home health services and prescription drugs.
Figure 5
Source: President's FY 2007 Budget Baseline for Medicaid, CMS
d. Distribution of Enrollees by Age
As displayed in Table 2, half of all persons enrolled in Medicaid are under age 18. For the year 2003, the latest year available with detailed age data, one-fifth of all Medicaid eligibles were age 5 and under. Another 22 percent were between ages 6 and 14, and 8 percent between ages 15 and 18. Together, children account for half of all eligibles. Adults ages 19 to 64 and the elderly age 65 and over, represent 39 percent and 10 percent, respectively.