
By: Kelsey Avery, Mathias Gardner, Emily Gee, Elena Marchetti-Bowick,
Audrey McDowell, & Aditi Sen
When the 2016 Open Enrollment Period begins on November 1, 2015, millions of Americans can once again shop for high-quality, affordable health care coverage in the Health Insurance Marketplace established by the Affordable Care Act.[1] Our research indicates that the Affordable Care Act is continuing to promote competition, choice, and affordability in the Marketplace for plan year 2016.
This year, the Marketplace is welcoming new consumers and encouraging those who have previously enrolled to come back, update their information and select the plan that best meets their needs and budget. All plans in the Marketplace cover essential health benefits and recommended preventive care, and no one may be excluded based on preexisting conditions. Consumers can see detailed information about each health insurance plan, in addition to estimated yearly out-of-pocket expenses, offered in their area before they apply. Factors they may consider in choosing a health insurance plan include premiums, deductibles, out-of-pocket costs, provider network, formulary, customer service and more.[2] Consumers may be eligible for financial assistance to help pay for the cost of premiums. In fact, 86 percent of consumers who selected a Marketplace plan in 2015 received financial assistance.[3]
This brief presents analysis of Qualified Health Plan (QHP) data in the individual market Marketplace, focusing on the states that use the HealthCare.gov Marketplace platform, and providing a look at the plan choice that new and returning consumers will see for 2016.[4] It also examines plan affordability in 2016 after taking into account premium tax credits.
| Key Findings
Affordability
Choice
|
Overview
The Affordable Care Act is continuing to create a dynamic, competitive Marketplace, with considerable choice and affordable premiums in 2016. During the third Marketplace Open Enrollment Period, consumers will continue to have an opportunity to comparison shop and select the plan that best meets their needs and budget. Choice also means competition between plans that in turn results in downward pressure on premiums.
The second-lowest cost silver plans are significant because the premium tax credits that are available to help make Marketplace coverage more affordable are calculated based on the premium for those plans.[5] The Centers for Medicare & Medicaid Services (CMS) recently announced the premium of the second-lowest cost silver plan will increase by 7.5 percent on average for the 2016 plan year.[6] The CMS snapshot analyzes percent changes in the second-lowest cost silver plan from 2015 to 2016—determined by full premium price. (In a small percentage of counties, the second-lowest cost plan determined by full premium price may not be the benchmark silver plan for a consumer.)
This brief identifies the second-lowest cost silver benchmark plan based on the portion of the premium that covers essential health benefits (EHB), which may be less than the full premium price charged by issuers.[7], [8] Based on this method, ASPE estimates that the 2015–2016 increase in the second-lowest cost silver benchmark plan is 7.2 percent (see Appendix Table 7). This rate increase is relatively modest compared to those in the individual market before the Affordable Care Act, when consumers in the individual market regularly experienced double-digit rate increases on average.[9]
Recent ASPE analysis also suggests that about one-third (31 percent) of consumers who reenrolled in coverage through the Marketplace in 2015 switched plans. Consumers who switched plans within the same metal level saved $33 per month on average, or nearly $400 annually, relative to what they would have paid had they remained in the same plan in 2014.[10] Similarly, this brief shows that consumers who bought a 2015 plan and decide to shop actively for a comparable 2016 plan will often be able to find a plan with lower premiums.
Section I of this brief describes the choices of issuers and plans that consumers in states using the HealthCare.gov platform will have in the 2016 coverage year, and compares these choices to the choices available in previous Open Enrollment Periods.
Section II provides an overview of premiums in HealthCare.gov states for 2016 and illustrates how consumers may benefit from returning to the Marketplace to shop for a plan that meets their needs and budget.
SECTION I: CONSUMER CHOICE AMONG HEALTH INSURANCE ISSUERS IN 2014, 2015 AND 2016
Issuers
There are nearly 240 issuers participating in the Marketplace in HealthCare.gov states in 2016 (see Appendix Table 8). The number of issuers offering health plans in the Marketplace has remained relatively stable from 2015 to 2016, as shown in Table 1a. Based on analysis at the county level, Marketplace consumers can choose from an average of 5 issuers for 2016 coverage, similar to 2015 and up from 2014.
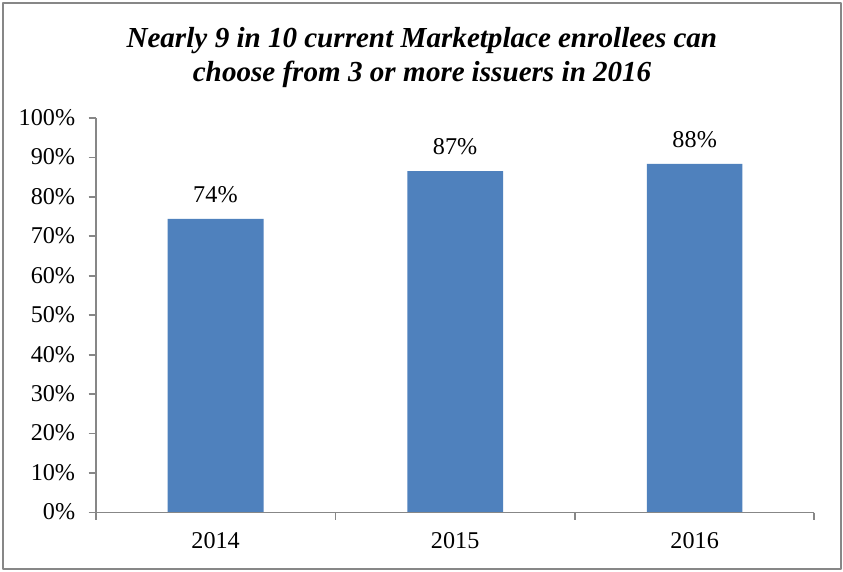
During the 2015 open enrollment period, nearly 9 out of 10 (87 percent) of the people who selected a qualified health plan lived in counties with three or more issuers; for 2016 this proportion has remained stable (nearly 9 out of 10, or 88 percent). Figure 1 shows the proportion of Marketplace enrollees who had a choice of 3 or more issuers each year. [11]
Competition has been shown to intensify when there are three or more firms in a market. [12] In the context of the Marketplaces, issuers are the relevant firms. Each issuer sells multiple plans across the various metal levels. Thus competition shapes issuers’ decisions on the types of plans to offer and the premiums at which they will be sold. ASPE’s earlier research on competition in the Marketplaces shows that, as in other markets, having three or more issuers in results in vigorous premium competition and results in significantly lower premiums for consumers.[13]
The number of issuers active in the average consumers’ state has remained relatively stable. (Not all issuers operate in all counties within a state, however, and thus the number of issuers available to a particular consumer may be less than the number of issuers that operate anywhere in the state.)
Across the HealthCare.gov states, 40 new issuers will begin offering Marketplace plans for the 2016 coverage year, while 35 issuers that offered plans in 2015 will no longer offer plans through the Marketplace in 2016.[14] Table 8 in the Appendix provides the number of issuers by state for the years 2014 to 2016.[15]
FIGURE 1
Percent of Consumers with Choice of Three or More Issuers in 2014, 2015 and 2016
Source: Information on plans and issuers is from the plan landscape files and active plan selections in the CMS Multidimensional Insurance Data Analytics System (MIDAS) for states using the HealthCare.gov platform.
Note: See “Methods and Limitations” section for more details regarding data and methods used. “Enrollees” refers to those people who selected a qualified health plan in the Marketplace. The 2014 estimate uses PY2014 plan selections in 35 states, and the 2015 and 2016 estimates are based on PY2015 plan selections in 37 states. The number of issuers available to those who selected a Marketplace plan is based on the number of issuers offering qualified health plans in each person’s county of residence. The 2014 and 2015 numbers differ from the ASPE issue brief “Health Plan Choice and Premiums in the 2015 Health Insurance Marketplace” because that brief used an older version of the PY2015 landscape file.
Plans
In 2016, consumers can chose from 50 plans in their county on average, including catastrophic plans. This represents a decrease from an average of 58 plans per county last year. Appendix Table 9 shows an average decline of 2 plans per issuer between 2015 and 2016, suggesting that some issuers are refining plans as the Marketplace matures and issuers respond to consumer demand.[16] In many cases, reductions in the number of plans available will have little or no practical effect on the scope of options available to consumers, either because the eliminated plans were unpopular with consumers or because those plans were very similar to other plans that will continue to be offered.
The health plan category or “metal level” determines how consumers and plans can expect to share the costs of care. For example, with a silver level plan the health plan pays about 70 percent of the total costs of care for essential health benefits, on average, and the consumer pays 30 percent of these costs. This takes into account the plan’s deductibles, copayments, coinsurance, and out-of-pocket maximums.
Table 1a shows details on the number of plans an average consumer can choose from. For the average number of issuers per state and plans per county, see Table 1b in the Appendix.
TABLE 1a
Summary of Marketplace Health Plans and Issuers for HealthCare.gov States, 2014 – 2016
|
| 2014 Average Weighted by 2014 Plan Selections | 2015 Average Weighted by 2015 Plan Selections | 2016 Average Weighted by 2015 Plan Selections |
| Number of HealthCare.gov States Included in Calculations | 35 | 37 | 37 |
| Issuers in State | 8 | 9 | 10 |
| Issuers in County | 4 | 5 | 5 |
| Qualified Health Plans in County (excluding catastrophic) | 51 | 55 | 47 |
| Plans in County | 54 | 58 | 50 |
| Catastrophic Plans | 3 | 3 | 3 |
| Bronze Plans | 15 | 16 | 15 |
| Silver Plans | 18 | 22 | 19 |
| Gold Plans | 14 | 13 | 11 |
| Platinum Plans | 4 | 4 | 2 |
Source: Information on plans and issuers is from the plan landscape files and active plan selections in the CMS Multidimensional Insurance Data Analytics System (MIDAS) for states using the HealthCare.gov platform in 2014, 2015 and 2016.
Note: All averages in this table are weighted based on plan selections in the county. The 2014 estimate uses PY2014 plan selections in 35 states, and the 2015 and 2016 estimates are based on PY2015 plan selections in 37 states.The number of issuers per state is calculated by finding the total number of issuers offering QHPs anywhere in each state, then taking an average over all states weighted by plan selections in the state. Numbers may not sum due to rounding. The 2014 and 2015 numbers differ from the previous ASPE issue brief “Health Plan Choice and Premiums in the 2015 Health Insurance Marketplace” as a result of calculating averages weighted by plan selections, rather than unweighted averages. See Appendix Table 1b for an unweighted version of this table.
SECTION II: MARKETPLACE HEALTH PLAN PREMIUMS IN 2015 AND 2016
The Marketplace enables consumers to comparison shop for a plan that meets their needs and budget. Most enrollees will receive financial assistance to help with the cost of their monthly premiums. In 2014, 64 percent of individuals who selected a plan in the Marketplace selected the lowest cost (43 percent) or second-lowest cost plan (21 percent) in their metal tier. Similarly, in 2015, 47 percent of individuals who selected a plan in the Marketplace selected the lowest cost (31 percent) or second-lowest cost plan (17 percent) in their metal tier—indicating that many Marketplace consumers shop based on premium.[17] Survey evidence suggests that the premium is the most important factor in consumers’ decision-making when shopping for insurance.[18] Recent ASPE analysis suggests that Marketplace consumers are highly sensitive to net premium price (i.e., premium after advance premium tax credit) and nearly one-third of consumers who reenrolled in a Marketplace plan in 2015 switched to a new plan.[19]
The Marketplace continues to be competitive and dynamic, and issuers are continuing to compete to offer more affordable options to consumers. Plans that were the second-lowest cost silver plan or lowest-cost silver plan in 2015 may not be the second-lowest cost or lowest-cost plan in 2016, so it will be important for returning consumers to review other options in 2016 to ensure that they select the plan that best fits their circumstances. The benchmark plan is significant because advance premium tax credits that are available to help make Marketplace coverage more affordable are calculated based on the premium of the benchmark (second-lowest cost silver) plan in the consumer’s geographic area. The actual payment made by consumers for their insurance depends on the plan they choose when enrolling in coverage through the Marketplace and the level of tax credit they qualified for.
Consumers who receive premium tax credits are protected by the Affordable Care Act’s cap on the amount they pay for the benchmark, second-lowest cost silver plan in their area. For those eligible for advance premium tax credits, the law sets a maximum amount of family income that can be paid toward Marketplace coverage. This means that no matter how much the benchmark plan’s total premium increases, tax credit eligible consumers’ costs are capped. The examples on the next page, corresponding to Table 10a and 10b, show how premium increases affect tax credits; Marketplace tax credits adjust to match changes in the benchmark silver plan premium in each market.
More than 8 in 10 (86 percent) current Marketplace enrollees can find a lower premium plan in the same metal level by returning to the Marketplace to shop for 2016 coverage, as illustrated in Table 2. For example, the average lowest-cost premium for a silver plan available to current silver-level enrollees is $359 per month for 2016 before applicable tax credits. The average consumer who bought a silver plan last year and decides to shop for a better deal this year can save $52 a month—which results in total premium savings of $624 a year.[20] If all silver plan holders switch to the lowest-cost silver plan available to them for 2016, the total savings for the year would be $3.2 billion. Across all metal levels, the total premium savings would be $4.5 billion. (State-level analyses are in Appendix Table 14.)
Premium Tax Credits: Examples
Example 1: Single 27-year-old in Charlotte, NC with an income of $25,000
Calculate her tax credit for 2015 coverage:
- Income as percentage of FPL: 214%
- Maximum monthly payment for second-lowest silver benchmark plan: $142
- Monthly total premium of second-lowest silver benchmark plan: $268
- Advance premium tax credit per month: $268– $142= $126
Suppose she’s trying to decide among two silver plans and a bronze. She can apply her tax credit to any of them.
- Before tax credit, the monthly premiums are
- Bronze: $200
- Lowest silver: $260
- Second-lowest silver: $268
- After applying her tax credit, the monthly premiums are
- Bronze: $200 – $126 = $74
- Lowest silver after tax credit: $260 – $126 = $134
- Second-lowest silver after tax credit: $268 – $126 = $142
Example 2: Premiums for a 27-year-old making $25,000 in Charlotte, NC for 2016
Calculate her tax credit for 2016 coverage:
- Income as percentage of FPL: 212%
- Maximum monthly payment for second-lowest silver benchmark plan: $143
- Monthly total premium of second-lowest silver benchmark plan: $335
- Advance premium tax credit per month: $335 – $143= $192
Even if premiums rose from 2015 to 2016, the tax credit protects consumers from higher prices.
- Before tax credit, the monthly premiums are
- Bronze: $250
- Lowest silver: $308
- Second-lowest silver: $335
- After applying her tax credit, the monthly premiums are
- Bronze: $250 – $192 = $58
- Lowest silver after tax credit: $308 – $192 = $116
- Second-lowest silver after tax credit: $335 – $192 = $143
TABLE 2
Potential Savings from Shopping Based on Premium if Current Marketplace Enrollees Switch to 2016 Lowest-Cost Premium Plan within Metal Level for 37 States
| Current Marketplace Enrollees | All Plan Types | Bronze | Silver | Gold | Platinum |
| Average Lowest-Cost 2016 Monthly Premium within Metal Level before Applicable Tax Credit | N/A | $294 | $359 | $406 | $550 |
| Average 2016 Monthly Premium Savings if Consumers Switch to Lowest-Cost Plan within Metal Level | $51 | $40 | $52 | $68 | $64 |
| % of Enrollees Who Could Save on Premium Costs by Switching to the Lowest-Cost Plan in Metal Level | 86% | 86% | 86% | 87% | 60% |
| ANNUAL Average Potential Savings in Premium Costs per Enrollee | $610 | $483 | $624 | $814 | $771 |
| MONTHLY Aggregate Amount of Potential Savings in Premium Costs across All Enrollees | $377 M | $63 M | $271 M | $38 M | $6.1 M |
| ANNUAL Aggregate Amount of Potential Savings in Premiums Costs Across All Enrollees | $4.5 B | $759 M | $3.2 B | $451 M | $74 M |
Source: Plan information is from the plan landscape files and active plan selections in the CMS Multidimensional Insurance Data Analytics System (MIDAS) for 37 states using the HealthCare.gov platform in 2015 and 2016.
Note: Amounts presented here do not take into account potential premium tax credits. The lowest-cost premium refers to the plan with the lowest premium within the county within each metal tier and based on all plans available in 2016. The lowest cost plan does not take into account other cost-sharing features, but refers only to the cost of the premium charged for that plan. In some cases, plans were tied for lowest premium. This analysis includes only enrollees linked to complete plan and premium data for both 2015 and 2016, and excludes tobacco users, who may face additional surcharges. Catastrophic plans, which are not available to all consumers, were not considered in these calculations. We assume that all enrollee characteristics are unchanged and calculate premiums based on the same age, family composition, and household income as percentage of the FPL as in 2015. Metal-level analysis is based on the metal consumers would be automatically re-enrolled into for 2016, based on their metal choice in 2015. See the “Methods and Limitations” section at the end of this brief for more details.
Health Insurance Plan Affordability after Advance Premium Tax Credits in the Marketplace in 2016
With an average of 5 issuers offering an average of 50 Marketplace plans to choose from in 2016, both new and reenrolling consumers have many options when shopping for coverage.
The Affordable Care Act established premium tax credits to help consumers with the cost of coverage based on their household incomes. For the 2015 plan year, 86 percent of consumers who selected a Marketplace plan received financial assistance.[21] Eight in 10 had the option of selecting a plan with a monthly premium of $100 or less after applying the premium tax credit, and nearly 6 in 10 individuals selected such a plan.[22] We estimate that nearly 80 percent of the uninsured who are eligible for coverage through the Marketplaces have incomes between 100 percent and 400 percent of the Federal Poverty Level (FPL) and may be eligible to receive tax credits for plan year 2016.[23]
Competition and premium tax credits are related. Increased numbers of issuers in a market means more competition. More competition tends to put downward pressure on premiums. As competition intensifies, the benchmark plan (second-lowest cost silver plan) may change, particularly as new issuers enter the Marketplace to compete for customers. Previous ASPE analysis suggested that in 42 percent of counties with new issuers, issuers that were new to the Marketplace offered at least one silver plan premium below what would have been the second-lowest cost silver among existing issuers, thereby directly reducing the benchmark premium. Of the issuers that exited the Marketplace, just 17 percent offered a 2014 plan at or below the benchmark premium.[24] Competition in the Marketplace means that benchmark premiums (and thus premium tax credits) may grow more slowly than a consumer’s current plan’s premium. For this reason, consumers who want to make their tax credit’s purchasing power go as far as possible should shop for coverage, regardless of what metal level they select. Premium competition also serves to benefit taxpayers by holding down tax credit costs.
Tables 3, 4, and 5 show possible 2016 premiums after applicable tax credits for current Marketplace enrollees. The analysis in Tables 3, 4, and 5 holds all enrollee characteristics unchanged and calculates 2016 premiums and tax credits based on the same age, family composition, and household income relative to poverty level as in 2015.
Table 3 shows the percentage of current Marketplace enrollees in the 37 states who could get coverage for as little as $100 or less per month, taking into account any applicable tax credits in 2016, regardless of the metal level they selected in 2015. For example, nearly 8 in 10 (78 percent) of all customers returning to the Marketplace can get coverage for a premium of $100 or less after advance premium tax credits in 2016, regardless of their 2015 plan metal level choice. More than 7 in 10 (72 percent) can get coverage a premium of $75 or less after advance premium tax credits. (Percentages of those who could obtain coverage for a premium of $100 or less, $75 or less, and $50 or less by state are shown in Table 13 in the Appendix at the end of this brief.)
TABLE 3
It Pays to Shop: Percent of Current Marketplace Enrollees Who Could Obtain Coverage for $100 or Less after Any Applicable Advance Premium Tax Credits in 2016, 37 States
Regardless of Metal Level in 2015
| Monthly Premium After Advance Premium Tax Credits | Any Plan Types | Bronze | Silver | Gold | Platinum |
| $100 or less | 78% | 78% | 63% | 27% | 2% |
| $75 or Less | 72% | 72% | 54% | 14% | 1% |
| $50 or Less | 65% | 65% | 41% | 5% | 0% |
Source: Plan information is from the plan landscape files and active plan selections in the CMS Multidimensional Insurance Data Analytics System (MIDAS) for 37 states using the HealthCare.gov platform in 2015 and 2016.
Note: Columns may not sum due to rounding. This analysis holds all enrollee characteristics unchanged and calculates 2016 premiums and tax credits based on the same age, family composition, and household income as percentage of the FPL as in 2015. This analysis includes only enrollees who could be linked to complete plan and premium data for both 2015 and 2016, and excludes tobacco users. Catastrophic plans, which are not available to all consumers, were not considered in these calculations. See the “Methods and Limitations” section at the end of this brief for more details.
Table 4 shows the percentage of current Marketplace enrollees who could get coverage for $100 or less, taking into account any applicable advance premium tax credits, if they keep their current plan and do not switch to a lower-premium plan for 2016. For example, 52 percent of Marketplace enrollees who selected a silver-level plan in 2015 will have 2016 coverage for a premium of $100 or less if they keep their current plan.
TABLE 4
It Pays to Shop: Percent of Current Marketplace Enrollees Who Would Be Covered for $100 or Less after Any Applicable Advance Premium Tax Credits in 2016, 37 States
If They Did Not Switch Plans
| Monthly Premium After Advance Premium Tax Credits | All Plan Types | Bronze | Silver | Gold | Platinum |
| $100 or less | 47% | 48% | 52% | 4% | 1% |
| $75 or Less | 36% | 39% | 39% | 1% | 0% |
| $50 or Less | 24% | 28% | 25% | 0% | 0% |
Source: Plan information is from the plan landscape files and active plan selections in the CMS Multidimensional Insurance Data Analytics System (MIDAS) for 37 states using the HealthCare.gov platform in 2015 and 2016.
Note: Columns may not sum due to rounding. This analysis holds all enrollee characteristics unchanged and calculates 2016 premiums and tax credits based on the same age, family composition, and household income as percentage of the FPL as in 2015. This analysis includes only enrollees linked to complete plan and premium data for both 2015 and 2016, and excludes tobacco users. Catastrophic plans, which are not available to all consumers, were not considered in these calculations. See the “Methods and Limitations” section at the end of this brief for more details.
However, there may be more affordable plans in 2016 available to current enrollees. Table 5, below, shows the percentage of current Marketplace enrollees in the 37 states that could get coverage for $100 or less, taking into account any applicable tax credits, while staying in their current metal level. For example, 66 percent of all people who selected a plan in 2015 could get coverage for a premium of $100 or less if they selected a lower-premium plan in their same metal level in 2016. Of those who selected a silver plan in 2015, 75 percent could get silver plan coverage for a premium of $100 or less in 2016 if they choose a lower-cost plan.
TABLE 5
It Pays to Shop: Percent of Current Marketplace Enrollees Who Could Obtain Coverage for $100 or Less after Advance Premium Tax Credits in 2016, 37 States
within Their Current Metal Level
| Monthly Premium After Advance Premium Tax Credits | All Plan Types | Bronze | Silver | Gold | Platinum |
| $100 or less | 66% | 61% | 75% | 11% | 1% |
| $75 or Less | 57% | 52% | 66% | 5% | 0% |
| $50 or Less | 46% | 42% | 52% | 1% | 0% |
Source: Plan information is from the plan landscape files and active plan selections in the CMS Multidimensional Insurance Data Analytics System (MIDAS) for 37 states using the HealthCare.gov platform in 2015 and 2016.
Note: Columns may not sum due to rounding. This analysis holds all enrollee characteristics unchanged and calculates 2016 premiums and tax credits based on the same age, family composition, and household income as percentage of the FPL as in 2015. This analysis includes only enrollees linked to complete plan and premium data for both 2015 and 2016, and excludes tobacco users. Catastrophic plans, which are not available to all consumers, were not considered in these calculations. See the “Methods and Limitations” section at the end of this brief for more details.
Advance Premium Tax Credits
The Affordable Care Act specifies that an individual who is eligible for premium tax credits will be required to pay no more than a fixed percentage of their income for the second-lowest cost silver plan available in the Marketplace in their local area. This applicable percentage varies only by household income as a percentage of the Federal Poverty Level (FPL) and does not depend on household members’ ages, the number of people within the household covered through the Marketplace, or Marketplace premiums. (For examples of 2016 incomes and benchmark premiums for those who are eligible for tax credits, see Table 6 on the next page.) The applicable percentage is converted into a maximum dollar amount the household is required to pay annually for the benchmark plan available to them, and the tax credit is applied to make up the difference between the maximum dollar amount and the actual premium, if any.[25] Note that the maximum percent of income paid toward the second-lowest silver plan is adjusted annually by a measure of the difference between premium growth and income growth.
The exact dollar amount of the premium tax credit depends on the premium of the second-lowest cost silver benchmark plan available to the household and the cost of covering the family members who are seeking Marketplace coverage. For more information on benchmark plans, see the “Methodology and Limitations” section of this brief.
TABLE 6
Examples of Maximum Monthly Health Insurance Premiums for the Second-Lowest Cost Silver Plan for Marketplace Coverage for a Single Adult in 2016[26]
| Single Adult Income[27] | Percent of the Federal Poverty Level | Maximum Percent of Income Paid toward Second-Lowest Cost Silver Plan | Maximum Monthly Premium Payment for Second-Lowest Cost Silver Plan |
| $11,770 | 100%[28] | 2.03% | $20 |
| $17,655 | 150% | 4.07% | $60 |
| $23,540 | 200% | 6.41% | $126 |
| $29,425 | 250% | 8.18% | $201 |
| $35,310 | 300% | 9.66% | $284 |
| $41,195 | 350% | 9.66% | $332 |
| $47,080 | 401% | No Limit | No Limit |
Source: Applicable percentages for 2016 coverage are available at: http://www.irs.gov/pub/irs-drop/rp-14-62.pdf. The 2015 Federal Poverty Guidelines, used for premium tax credits for 2016 coverage, are at: http://aspe.hhs.gov/2015-poverty-guidelines.
Conclusion
As the Health Insurance Marketplace matures, new and returning customers to the Marketplace will continue to see a considerable choice of available issuers and health plans, as well as affordable premiums in 2016. Premium tax credits will also continue to play an important role in ensuring that consumers have access to affordable options. Many consumers who purchased plans in 2014 through the Marketplace realized substantial savings by switching plans for the 2015 plan year, and consumers can realize substantial savings again this year if they shop around to find the plan that best meets their needs and their budget. They can do so by going to HealthCare.gov, which provides information for consumers looking to compare plans on premiums and other plan features.
Methodology and Limitations
Data
The plan and premium data reported here are from the Marketplace QHP landscape individual market medical files, which are publicly available at HealthCare.gov.[29] Data were not available for all states. This analysis focuses on the states which were included in Marketplace landscape file, including: Alabama, Alaska, Arizona, Arkansas, Delaware, Florida, Georgia, Hawaii, Illinois, Indiana, Iowa, Kansas, Louisiana, Maine, Michigan, Mississippi, Missouri, Montana, Nebraska, New Hampshire, New Jersey, Nevada, New Mexico, North Carolina, North Dakota, Ohio, Oklahoma, Oregon, Pennsylvania, South Carolina, South Dakota, Tennessee, Texas, Utah, Virginia, West Virginia, Wisconsin, and Wyoming. However, some metrics are limited to 35 states that were included in the 2014 Marketplace landscape files, the 37 (35 plus Nevada and Oregon) included in the 2015 landscape file, or the 38 (35 plus Nevada, Oregon, and Hawaii) in the 2016 landscape file.
For most State-based Marketplaces (SBMs) operating their own enrollment platforms, comprehensive plan and premium data were not available. State-based Marketplaces not included in the analysis in this brief are California, Colorado, Connecticut, District of Columbia, Idaho, Kentucky, Maryland, Massachusetts, Minnesota, New York, Rhode Island, Vermont, and Washington. Some State-based Marketplaces submit plan data to the Center for Consumer Information and Insurance Oversight (CCIIO) for display using the HealthCare.gov eligibility and enrollment platform. Idaho relied on the HealthCare.gov platform only in 2014 and is not included in this brief. New Mexico utilized the HealthCare.gov platform to support its eligibility and enrollment functions in 2014, will continue to do so in 2015, and is included in the analysis in this brief. Oregon and Nevada did not rely on the HealthCare.gov platform in 2014 but do for 2015 and 2016, and Hawaii will use the HealthCare.gov platform for 2016.
Plan information is based on the plan landscape files for the states using the HealthCare.gov platform as of January 2014 for the 2014 coverage year, as of August 2015 for the 2015 coverage year, and as of October 19, 2015 for the 2016 coverage year. The ASPE Issue Brief published last year, titled “Health Plan Choice and Premiums in the 2015 Health Insurance Marketplace,” used an older version of the landscape file for the 2015 coverage year.[30] Numbers relating to the 2015 coverage year have been updated for this brief using the August 2015 landscape file, and therefore the 2015 coverage year numbers in this brief differ from the previously published numbers using the November 2014 version of the file.
The 2016 plan landscape file used in this brief is a snapshot of issuer participation and plans as of October 19, 2015 and does not reflect changes in issuer and plan offerings after that date. For example, the landscape file used in this analysis includes some plans and issuers that, based on decisions after October 19th, will not be offered in 2016, and does not include a very small number of plans and/or issuers that will become available for enrollment in mid-November. Since the production of the October 19, 2015 version of the landscape file, Departments of Insurance have directed some issuers or plans to exit the Marketplaces in Arizona, Michigan, Oregon, South Carolina, and Utah, and those issuers or plans will not be available for 2016. The landscape file also does not include issuers in New Jersey, New Mexico, and Texas that will become available later during Open Enrollment. Due to these changes since the 2016 landscape file was finalized on October 19th, in a small number of states the consumer experience will differ from what is reported in this brief.
Enrollment information is based on active QHP selections in the CMS Multidimensional Insurance Data Analytics System (MIDAS) as of December 2014 (for the 2014 coverage year), and as of February 22, 2015 (for the 2015 and 2016 coverage years). In this brief, we use the term “enrollees” to refer to individuals with active Marketplace individual market health plan selections; it does not refer to “effectuated enrollees”—individuals who selected plans and paid the premium.
Additionally, we exclude tobacco users and enrollees in Virginia plans covering treatment of morbid obesity from our calculations of premiums because their premium rates may be higher than standard, non-tobacco rates. Our calculations of the savings from switching plans (Table 2) and premium tax credits (Table 3, 4, and 5) are based on only on enrollees whom we were able to link to complete premium and plan data for both 2015 and 2016. Excluding tobacco users, non-tobacco users who were missing required data, non-tobacco users who could not be linked to 2016 plans, and non-tobacco users who selected catastrophic plans reduced the number of plan selections in the 37 HealthCare.gov states as of February 22, 2015 from 8.8 million to 7.4 million used for this analysis.
Issuers and Plans
We calculate the total number of issuers by unique five-digit Health Insurance Oversight System (HIOS) issuer IDs. In some cases, issuers with different HIOS IDs belong to the same parent company. An issuing entity’s HIOS issuer ID is specific to the state in which it operates, such that a company offering QHPs through the Marketplace in two states would be counted twice—once for each state.
Some previous ASPE issue briefs on plan choice and availability presented analyses at the rating area level. Because plans available in some part of a rating area are not always available in all parts of a rating area, in this brief we have conducted the analysis at the county level. Conducting the analysis at the county level better captures the set of options consumers will see when they shop and thus more closely matches consumers’ shopping experience.
The analysis in this brief does not include stand-alone dental plans, child-only plans, or small-group Marketplace (SHOP) plans. In our estimates of Marketplace premiums, we also did not consider enrollees in catastrophic plans and plans in Virginia covering treatment of morbid obesity. Catastrophic coverage is not available to all consumers.
Weighted averages have been calculated at the county level for all counties in the HealthCare.gov states unless otherwise specified. Averages for 2014 are weighted by PY2014 plan selections per county in 35 states, 2015 averages are based on PY2015 plan selections in 37 states, and 2016 averages are based on PY2015 plan selections in 37 states.
Premiums
In this issue brief, we examine the plans and premiums available at the county level. Because some plans may not serve all counties within a rating area, county-level analysis provides a better approximation of plan availability. Analyses in some previous ASPE briefs on Marketplace premiums was typically at the rating area level; therefore, numbers in this brief should not be compared against those in previous briefs using rating-area analysis.
Our analysis of premiums in Tables 2-5 considers only current enrollees whose 2015 Marketplace plan is available in 2016, based on each plan’s unique ID code. Consumers can be auto-enrolled into other coverage if their plan is not available for the next year.
Identifying Benchmark Plans
Plans in the Health Insurance Marketplace are required to offer a comprehensive package of items and services, known as essential health benefits (EHB). Marketplace plans can also offer benefits beyond these minimum benefits.
Each Marketplace plan reports what percentage of its premium is related to EHB. Most plans have an EHB percentage of 100 percent. However, plans that cover benefits beyond EHB have EHB percentages smaller than 100 percent, reflecting the fact that a portion of the premium pays for these additional benefits. The amount of premium that covers EHB is used to rank silver plans available to a consumer and determine which plan is the second-lowest cost silver plan—also called the benchmark plan—for the purposes of calculating advance premium tax credits.
In this issue brief, the EHB amount enters into our analysis in two ways. We ranked silver plans by the EHB amount of premium in order to determine what we define for analytic purposes as each county’s “benchmark” plan.[31] We then compared the full premium amount of each year’s respective benchmark to calculate the increase in second-lowest silver. Secondly, EHB amounts affect the calculation of premiums after applicable advance premium tax credits. Premium tax credits can be applied only to the portion of the plan’s premium that covers EHB. For example, suppose a consumer has a $200 premium tax credit. If he selects a plan that costs $200 before tax credit and has an EHB percent of 95%, the tax credit will cover $190 of the plan premium and he will be responsible for covering the remaining $10.
The 2016 QHP landscape file includes a new variable called “EHB percent of total premium,” which represents the proportion the plan’s premium cost that covers EHB. For plan years 2014 and 2015, the EHB percentage of premium variable is not available on the landscape file but is available on the Health Insurance Marketplace public use files.[32]
The 2016 Marketplace rate snapshot recently published by CMS did not take into account EHB percentages when determining second-lowest cost silver plans and found that the 2015–2016 increase in second-lowest cost silver plan premiums was 7.5 percent.[33] This issue brief does take into account EHB, and therefore, the plans we identify as benchmark and the rate increase we calculate (7.2 percent for second-lowest cost silver benchmark plans) differ from the findings in the CMS snapshot. Additionally, calculations for the 2015 plan year have been updated for this brief using this methodology and thus differ from numbers in last year’s premium landscape Issue Brief. [34]
Appendix: Tables by State and County
TABLE 1b
Summary of Marketplace Health Plans and Issuers for HealthCare.gov States, 2014–2016, (Unweighted Averages)
|
| 2014 Average | 2015 Average | 2016 Average |
| Number of HealthCare.gov States Included in Calculations | 35 | 37 | 37 |
| Issuers per State | 5 | 6 | 6 |
| Issuers per County | 3 | 3 | 3 |
| Qualified Health Plans per County (excluding catastrophic) | 28 | 34 | 33 |
| Plans per County | 30 | 36 | 35 |
| Catastrophic Plans | 2 | 2 | 2 |
| Bronze Plans | 9 | 11 | 11 |
| Silver Plans | 10 | 13 | 14 |
| Gold Plans | 8 | 9 | 8 |
| Platinum Plans | 1 | 1 | 1 |
Source: Information on plans and issuers is from the plan landscape files and active plan selections in the CMS Multidimensional Insurance Data Analytics System (MIDAS) for states using the HealthCare.gov platform.
Note: All averages in this table are unweighted; all counties are weighted equally. The number of issuers per state is the total number of issuers offering QHPs anywhere in a state; the average weights all states equally. Numbers may not sum due to rounding. The 2014 and 2015 numbers differ from the ASPE issue brief “Health Plan Choice and Premiums in the 2015 Health Insurance Marketplace” because that brief used an older version of the PY2015 landscape file.
TABLE 7
Average Monthly Premiums for Second-Lowest Cost Silver Plans for a 27-Year-Old (Before Tax Credits), 2014–2016 in HealthCare.gov States
| State | Average Second-Lowest Cost Silver Premium for a 27-Year-Old | |||
| 2014 | 2015 | 2016 | % Change, 2015–2016 | |
| HealthCare.gov States Average | $218 | $224 | $240 | 7.2% |
| AK | $349 | $449 | $590 | 32% |
| AL | $210 | $216 | $244 | 13% |
| AR | $241 | $235 | $244 | 4% |
| AZ | $164 | $161 | $189 | 18% |
| DE | $237 | $247 | $292 | 18% |
| FL | $218 | $235 | $237 | 1% |
| GA | $236 | $228 | $236 | 4% |
| HI | N/A | N/A | $213 | N/A |
| IA | $207 | $217 | $245 | 13% |
| IL | $186 | $192 | $203 | 6% |
| IN | $270 | $268 | $235 | -12% |
| KS | $196 | $187 | $217 | 16% |
| LA | $252 | $267 | $290 | 9% |
| ME | $266 | $263 | $260 | -1% |
| MI | $207 | $209 | $212 | 1% |
| MO | $235 | $233 | $257 | 10% |
| MS | $313 | $255 | $230 | -10% |
| MT | $208 | $196 | $264 | 35% |
| NC | $244 | $259 | $318 | 23% |
| ND | $233 | $248 | $270 | 9% |
| NE | $205 | $243 | $272 | 12% |
| NH | $237 | $205 | $215 | 5% |
| NJ | $265 | $259 | $272 | 5% |
| NM | $183 | $163 | $205 | 26% |
| NV | N/A | $217 | $235 | 8% |
| OH | $216 | $218 | $221 | 1% |
| OK | $175 | $185 | $251 | 36% |
| OR | N/A | $183 | $226 | 23% |
| PA | $198 | $193 | $214 | 11% |
| SC | $222 | $223 | $247 | 11% |
| SD | $234 | $216 | $270 | 25% |
| TN | $161 | $191 | $236 | 23% |
| TX | $204 | $211 | $220 | 4% |
| UT | $206 | $212 | $245 | 16% |
| VA | $223 | $230 | $240 | 4% |
| WI | $246 | $251 | $262 | 5% |
| WV | $230 | $248 | $294 | 18% |
| WY | $344 | $359 | $379 | 6% |
Source: Plan information is from the plan landscape files and active plan selections in the CMS Multidimensional Insurance Data Analytics System (MIDAS) for states using the HealthCare.gov platform.
Note: The numbers in this table represent premiums before the application of advance premium tax credits. State and HealthCare.gov average premiums are weighted by the number of Marketplace plan selections in each county, except for Hawaii, in which all counties were weighted equally. Numbers presented here may differ from those in CMS’s “2016 Marketplace Affordability Snapshot.” The CMS snapshot analyzes percent changes in the second-lowest cost silver plan from 2015 to 2016, ranked by full premium price. This brief identifies the second-lowest cost silver plan in each county based on the portion of the premium that covers essential health benefits (EHB). See the “Methodology and Limitations” section for details.
TABLE 8
Number of Marketplace Issuers by State, 2014–2016 in HealthCare.gov States
| State | Number of Issuers in State | Net Change in Number of Issuers in State, 2015–2016 | Number of New Issuers to the State in 2016 | Number of Issuers Exiting the State in 2016 | ||
| 2014 | 2015 | 2016 | ||||
| HealthCare.gov States Total* | 187 | 231 | 238 | 5 | 40 | 35 |
| AK | 2 | 2 | 2 | 0 | 0 | 0 |
| AL | 2 | 3 | 3 | 0 | 0 | 0 |
| AR | 3 | 4 | 5 | 1 | 1 | 0 |
| AZ | 10 | 12 | 9 | -3 | 2 | 5 |
| DE | 3 | 3 | 3 | 0 | 0 | 0 |
| FL | 11 | 12 | 10 | -2 | 1 | 3 |
| GA | 5 | 8 | 9 | 1 | 3 | 2 |
| HI | N/A | N/A | 2 | N/A | N/A | N/A |
| IA | 4 | 3 | 4 | 1 | 2 | 1 |
| IL | 8 | 9 | 10 | 1 | 3 | 2 |
| IN | 4 | 8 | 8 | 0 | 1 | 1 |
| KS | 4 | 5 | 4 | -1 | 1 | 2 |
| LA | 5 | 5 | 5 | 0 | 0 | 0 |
| ME | 2 | 3 | 3 | 0 | 0 | 0 |
| MI | 12 | 15 | 15 | 0 | 1 | 1 |
| MO | 4 | 7 | 7 | 0 | 0 | 0 |
| MS | 2 | 3 | 3 | 0 | 1 | 1 |
| MT | 3 | 3 | 3 | 0 | 0 | 0 |
| NC | 2 | 3 | 3 | 0 | 1 | 1 |
| ND | 3 | 3 | 3 | 0 | 0 | 0 |
| NE | 4 | 2 | 4 | 2 | 2 | 0 |
| NH | 1 | 4 | 5 | 1 | 1 | 0 |
| NJ | 4 | 6 | 5 | -1 | 0 | 1 |
| NM | 4 | 5 | 4 | -1 | 0 | 1 |
| NV | N/A | 4 | 4 | 0 | 1 | 1 |
| OH | 12 | 15 | 17 | 2 | 2 | 0 |
| OK | 6 | 3 | 2 | -1 | 1 | 2 |
| OR | N/A | 10 | 11 | 1 | 1 | 0 |
| PA | 14 | 14 | 12 | -2 | 1 | 3 |
| SC | 4 | 4 | 5 | 1 | 2 | 1 |
| SD | 3 | 3 | 2 | -1 | 0 | 1 |
| TN | 4 | 3 | 4 | 1 | 1 | 0 |
| TX | 12 | 14 | 17 | 3 | 6 | 3 |
| UT | 6 | 6 | 5 | -1 | 1 | 2 |
| VA | 8 | 9 | 11 | 2 | 2 | 0 |
| WI | 13 | 15 | 16 | 1 | 1 | 0 |
| WV | 1 | 1 | 2 | 1 | 1 | 0 |
| WY | 2 | 2 | 1 | -1 | 0 | 1 |
Source: Plan and premium information is from the plan landscape files for states using the HealthCare.gov platform.
Note: An issuer is counted as “new” in 2016 if it did not offer an individual market health plan in a given state’s Marketplace in 2015 based on its HIOS issuer ID number, and “exiting” if it was active in a given state’s Marketplace in 2015 but not in 2016.
* Hawaii is not included in the net change in the number of issuers from 2015 to 2016, the sum of new issuers in 2016, and the sum issuers exiting in 2016.
TABLE 9
Average Number of Marketplace Qualified Health Plans per County, 2014–2016 in HealthCare.gov States
| State | Average Number of QHPs | Change in Average Number of QHPs, 2015-2016 | Average Number of QHPs per Issuer | Change in Average Number of QHPs per Issuer, 2015-2016 | |||
| 2014 | 2015 | 2016 | 2015 | 2016 | |||
| HealthCare.gov States Average | 51 | 55 | 48 | -8 | 12 | 10 | -2 |
| AK | 34 | 28 | 15 | -13 | 14 | 8 | -7 |
| AL | 7 | 18 | 13 | -5 | 8 | 6 | -2 |
| AR | 29 | 34 | 40 | 6 | 9 | 8 | -1 |
| AZ | 105 | 105 | 65 | -40 | 10 | 9 | -1 |
| DE | 19 | 24 | 28 | 4 | 8 | 9 | 1 |
| FL | 112 | 65 | 52 | -13 | 11 | 10 | -1 |
| GA | 32 | 58 | 48 | -9 | 11 | 8 | -3 |
| HI | N/A | N/A | 20 | N/A | N/A | 10 | N/A |
| IA | 29 | 12 | 26 | 14 | 11 | 9 | -2 |
| IL | 54 | 87 | 55 | -31 | 15 | 9 | -6 |
| IN | 25 | 49 | 61 | 12 | 11 | 11 | 0 |
| KS | 28 | 28 | 26 | -2 | 10 | 10 | 0 |
| LA | 39 | 41 | 34 | -7 | 11 | 8 | -4 |
| ME | 17 | 25 | 30 | 5 | 8 | 10 | 2 |
| MI | 41 | 88 | 88 | 1 | 11 | 10 | 0 |
| MO | 19 | 29 | 37 | 8 | 9 | 10 | 1 |
| MS | 16 | 31 | 23 | -8 | 13 | 9 | -4 |
| MT | 26 | 34 | 30 | -4 | 11 | 10 | -1 |
| NC | 22 | 35 | 24 | -11 | 14 | 10 | -4 |
| ND | 24 | 28 | 21 | -7 | 10 | 7 | -3 |
| NE | 31 | 20 | 31 | 11 | 10 | 8 | -2 |
| NH | 10 | 32 | 39 | 7 | 8 | 8 | 0 |
| NJ | 26 | 46 | 38 | -8 | 8 | 8 | 0 |
| NM | 38 | 50 | 20 | -30 | 10 | 5 | -5 |
| NV | N/A | 42 | 49 | 7 | 13 | 13 | -1 |
| OH | 40 | 70 | 81 | 11 | 9 | 9 | 0 |
| OK | 47 | 38 | 22 | -16 | 16 | 11 | -5 |
| OR | N/A | 75 | 73 | -2 | 10 | 9 | -1 |
| PA | 35 | 43 | 31 | -12 | 8 | 7 | -1 |
| SC | 26 | 54 | 70 | 16 | 15 | 19 | 4 |
| SD | 32 | 36 | 19 | -17 | 12 | 10 | -2 |
| TN | 59 | 57 | 57 | 0 | 28 | 19 | -9 |
| TX | 40 | 60 | 50 | -9 | 11 | 9 | -2 |
| UT | 76 | 89 | 70 | -19 | 17 | 18 | 1 |
| VA | 29 | 28 | 35 | 6 | 8 | 9 | 0 |
| WI | 66 | 84 | 60 | -24 | 16 | 11 | -5 |
| WV | 12 | 14 | 18 | 4 | 14 | 14 | 0 |
| WY | 16 | 40 | 28 | -12 | 20 | 28 | 8 |
Source: Plan information is from the plan landscape files for states using the HealthCare.gov platform.
Note: Numbers may not sum due to rounding. Counts do not include catastrophic plans. Average number of plans in 2014, 2015 and 2016 represent the number of Marketplace QHPs per county, weighted by plan selections in the county. The 2014 estimate uses PY2014 plan selections in 35 states, and the 2015 and 2016 estimates are based on PY2015 plan selections in 37 states.
TABLE 10a
2016 Average Monthly Marketplace Premiums, Issuers, and QHPs Available in HealthCare.gov States
| State | 2016 | |||||||
|---|---|---|---|---|---|---|---|---|
| Total Number of Issuers in State | Average Number of QHPs per County | 27-Year-Old with a Household Income of $25,000 | Family of Four with a Household Income of $60,000 | |||||
| Average | Average | |||||||
| Second-Lowest Silver Before Advance Premium Tax Credit | Second-Lowest Silver After Advance Premium Tax Credit | Advance Premium Tax Credit Amount | Second-Lowest Silver Before Advance Premium Tax Credit | Second-Lowest Silver After Advance Premium Tax Credit | Advance Premium Tax Credit Amount | |||
| HealthCare.gov States Average (38 States) | 10 | 48 | $240 | $143 | $97 | $869 | $405 | $464 |
| AK* | 2 | 15 | $590 | $104 | $486 | $2,136 | $316 | $1,820 |
| AL | 3 | 13 | $244 | $143 | $101 | $882 | $405 | $477 |
| AR | 5 | 40 | $244 | $143 | $101 | $883 | $405 | $478 |
| AZ | 9 | 65 | $189 | $143 | $46 | $683 | $405 | $278 |
| DE | 3 | 28 | $292 | $143 | $149 | $1,056 | $405 | $651 |
| FL | 10 | 52 | $237 | $143 | $94 | $858 | $405 | $453 |
| GA | 9 | 48 | $236 | $143 | $93 | $856 | $405 | $451 |
| HI*** | 2 | 20 | $213 | $118 | $95 | $773 | $348 | $425 |
| IA** | 4 | 26 | $245 | $143 | $102 | $886 | $405 | $481 |
| IL | 10 | 55 | $203 | $143 | $60 | $734 | $405 | $329 |
| IN | 8 | 61 | $235 | $143 | $92 | $852 | $405 | $447 |
| KS | 4 | 26 | $217 | $143 | $74 | $787 | $405 | $382 |
| LA | 5 | 34 | $290 | $143 | $147 | $1,050 | $405 | $645 |
| ME | 3 | 30 | $260 | $143 | $117 | $943 | $405 | $538 |
| MI | 15 | 88 | $212 | $143 | $69 | $767 | $405 | $362 |
| MO** | 7 | 37 | $257 | $143 | $114 | $931 | $405 | $526 |
| MS | 3 | 23 | $230 | $143 | $87 | $832 | $405 | $427 |
| MT** | 3 | 30 | $264 | $143 | $121 | $956 | $405 | $551 |
| NC | 3 | 24 | $318 | $143 | $175 | $1,151 | $405 | $746 |
| ND | 3 | 21 | $270 | $143 | $127 | $979 | $405 | $574 |
| NE | 4 | 31 | $272 | $143 | $129 | $984 | $405 | $579 |
| NH | 5 | 39 | $215 | $143 | $72 | $779 | $405 | $374 |
| NJ** | 5 | 38 | $272 | $143 | $129 | $985 | $405 | $580 |
| NM | 4 | 20 | $205 | $143 | $62 | $743 | $405 | $338 |
| NV | 4 | 49 | $235 | $143 | $92 | $849 | $405 | $444 |
| OH | 17 | 81 | $221 | $143 | $78 | $801 | $405 | $396 |
| OK | 2 | 22 | $251 | $143 | $108 | $909 | $405 | $504 |
| OR | 11 | 73 | $226 | $143 | $83 | $817 | $405 | $412 |
| PA | 12 | 31 | $214 | $143 | $71 | $774 | $405 | $369 |
| SC | 5 | 70 | $247 | $143 | $104 | $893 | $405 | $488 |
| SD | 2 | 19 | $270 | $143 | $127 | $976 | $405 | $571 |
| TN | 4 | 57 | $236 | $143 | $93 | $853 | $405 | $448 |
| TX | 17 | 50 | $220 | $143 | $77 | $797 | $405 | $392 |
| UT | 5 | 70 | $245 | $143 | $102 | $791 | $405 | $386 |
| VA | 11 | 35 | $240 | $143 | $97 | $868 | $405 | $463 |
| WI** | 16 | 60 | $262 | $143 | $119 | $950 | $405 | $545 |
| WV** | 2 | 18 | $294 | $143 | $151 | $1,064 | $405 | $659 |
| WY | 1 | 28 | $379 | $143 | $236 | $1,374 | $405 | $969 |
Source: Plan information is from the plan landscape files and active plan selections in the CMS Multidimensional Insurance Data Analytics System (MIDAS) for 38 states using the HealthCare.gov platform in 2016.
Note: Averages for premiums and number of QHPs per county are weighted by the county’s number of Marketplace 2015 plan selections. In this example, the family of four is one 40-year-old adult, one 38-year-old adult, and two children under the age of 21. For households eligible for premium tax credits, after-tax-credit benchmark premiums are capped at a given percentage of household income. After-tax benchmark premiums will differ slightly between 2015 and 2016 for identical family compositions and income amounts because of changes in the applicable percentages and the Federal Poverty Guidelines. The 2015 guidelines are used to calculate benchmark premiums for coverage in 2016. Because poverty guideline thresholds generally increase each year, a given dollar amount of income may equate to a smaller percentage of the Federal Poverty Level (FPL) this year than it did in the previous year. For example, a four-person family with an income of $60,000 is at 247 percent of the FPL by 2015 guidelines and at 252 percent of the FPL by 2014 guidelines. As a result, the percentage of income the family would pay for the benchmark plan is smaller for 2016 than for 2015.
* Alaska and Hawaii’s federal poverty guidelines are higher than those for the continental United States; consequently, the after tax credit premium is lower for a given amount of income.
** In all 38 states, our calculations of premiums after tax credits assume that all members of the family of four making $60,000 would be eligible for premium tax credits. However, in states with higher Medicaid/CHIP thresholds the children would be eligible for Medicaid/CHIP and not eligible for premium tax credits.
*** For purposes of this analysis, counties in Hawaii were weighted equally because corresponding plan selection information by county was not available.
TABLE 10b
2015 Average Monthly Marketplace Premiums, Issuers, and QHPs Available in HealthCare.gov States
| State | 2015 | |||||||
|---|---|---|---|---|---|---|---|---|
| Total Number of Issuers in State | Average Number of QHPs per County | 27-Year-Old with a Household Income of $25,000 | Family of Four with a Household Income of $60,000 | |||||
| Average | Average | |||||||
| Second-Lowest Silver Before Advance Premium Tax Credit | Second-Lowest Silver After Advance Premium Tax Credit | ADVANCE PREMIUM TAX CREDIT AMOUNT | SECOND-LOWEST SILVER BEFORE ADVANCE PREMIUM TAX CREDIT | SECOND-LOWEST SILVER AFTER ADVANCE PREMIUM TAX CREDIT | ADVANCE PREMIUM TAX CREDIT AMOUNT | |||
| HealthCare.gov States Average (37 States) | 9 | 55 | $224 | $143 | $81 | $810 | $407 | $404 |
| AK* | 2 | 28 | $449 | $105 | $344 | $1,624 | $319 | $1,305 |
| AL | 3 | 18 | $216 | $143 | $73 | $783 | $407 | $376 |
| AR | 4 | 34 | $235 | $143 | $92 | $851 | $407 | $444 |
| AZ | 12 | 105 | $161 | $143 | $18 | $581 | $407 | $174 |
| DE | 3 | 24 | $247 | $143 | $104 | $893 | $407 | $486 |
| FL | 12 | 65 | $235 | $143 | $92 | $850 | $407 | $443 |
| GA | 8 | 58 | $228 | $143 | $85 | $824 | $407 | $417 |
| IA** | 3 | 12 | $217 | $143 | $74 | $785 | $407 | $378 |
| IL | 9 | 87 | $192 | $143 | $49 | $696 | $407 | $289 |
| IN | 8 | 49 | $268 | $143 | $125 | $969 | $407 | $562 |
| KS | 5 | 28 | $187 | $143 | $44 | $677 | $407 | $270 |
| LA | 5 | 41 | $267 | $143 | $124 | $966 | $407 | $559 |
| ME | 3 | 25 | $263 | $143 | $120 | $954 | $407 | $547 |
| MI | 15 | 88 | $209 | $143 | $66 | $758 | $407 | $351 |
| MO** | 7 | 29 | $233 | $143 | $90 | $843 | $407 | $436 |
| MS | 3 | 31 | $255 | $143 | $112 | $923 | $407 | $516 |
| MT** | 3 | 34 | $196 | $143 | $53 | $710 | $407 | $303 |
| NC | 3 | 35 | $259 | $143 | $116 | $937 | $407 | $530 |
| ND | 3 | 28 | $248 | $143 | $105 | $900 | $407 | $493 |
| NE | 2 | 20 | $243 | $143 | $100 | $880 | $407 | $473 |
| NH | 4 | 32 | $205 | $143 | $62 | $741 | $407 | $334 |
| NJ** | 6 | 46 | $259 | $143 | $116 | $938 | $407 | $531 |
| NM | 5 | 50 | $163 | $143 | $20 | $591 | $407 | $184 |
| NV | 4 | 42 | $217 | $143 | $74 | $786 | $407 | $379 |
| OH | 15 | 70 | $218 | $143 | $75 | $789 | $407 | $382 |
| OK | 3 | 38 | $185 | $143 | $42 | $670 | $407 | $263 |
| OR | 10 | 75 | $183 | $143 | $40 | $664 | $407 | $257 |
| PA | 14 | 43 | $193 | $143 | $50 | $699 | $407 | $292 |
| SC | 4 | 54 | $223 | $143 | $80 | $806 | $407 | $399 |
| SD | 3 | 36 | $216 | $143 | $73 | $783 | $407 | $376 |
| TN | 3 | 57 | $191 | $143 | $48 | $692 | $407 | $285 |
| TX | 14 | 60 | $211 | $143 | $68 | $764 | $407 | $357 |
| UT | 6 | 89 | $212 | $143 | $69 | $684 | $407 | $277 |
| VA | 9 | 28 | $230 | $143 | $87 | $834 | $407 | $427 |
| WI** | 15 | 84 | $251 | $143 | $108 | $909 | $407 | $502 |
| WV** | 1 | 14 | $248 | $143 | $105 | $898 | $407 | $491 |
| WY | 2 | 40 | $359 | $143 | $216 | $ 1,300 | $407 | $893 |
Source: Plan information is from the plan landscape files and active plan selections in the CMS Multidimensional Insurance Data Analytics System (MIDAS) for 37 states using the HealthCare.gov platform in 2015.
Note: Averages for premiums and number of QHPs per county are weighted by the county’s number of Marketplace 2015 plan selections. In this example, the family of four is one 40-year-old adult, one 38-year-old adult, and two children under the age of 21. For households eligible for premium tax credits, after-tax-credit benchmark premiums are capped at a given percentage of household income. After-tax benchmark premiums will differ slightly between 2015 and 2016 for identical family compositions and income amounts because of changes in the applicable percentages and the Federal Poverty Guidelines. The 2014 guidelines are used to calculate benchmark premiums for coverage in 2015. Because poverty guideline thresholds generally increase each year, a given dollar amount of income may equate to a smaller percentage of the Federal Poverty Level (FPL) this year than it did in the previous year. For example, a four-person family with an income of $60,000 is at 247 percent of the FPL by 2015 guidelines and at 252 percent of the FPL by 2014 guidelines. As a result, the percentage of income the family would pay for the benchmark plan is smaller for 2016 than for 2015. Hawaii is not included in this analysis.
* Alaska’s federal poverty guidelines are higher than those for the continental United States; consequently, the after tax credit premium is lower for a given amount of income.
** In all 37 states, our calculations of premiums after tax credits assume that all members of the family of four making $60,000 would be eligible for premium tax credits. However, in states with higher Medicaid/CHIP thresholds the children would be eligible for Medicaid/CHIP and not eligible for premium tax credits.
TABLE 11
Second-Lowest Cost Silver Plan Monthly Premiums for a 27-Year-Old (Before Tax Credits), 2015–2016 in Selected Counties in HealthCare.gov States
| State | County | City in County | Second-Lowest Cost Silver Monthly Premium for a 27-year-old | ||
|---|---|---|---|---|---|
| 2015 | 2016 | % Change | |||
| AL | Jefferson | Birmingham | $217 | $236 | 9% |
| AK | Anchorage | Anchorage | $449 | $590 | 32% |
| AK | Juneau | Juneau | $449 | $590 | 32% |
| AZ | Maricopa | Phoenix | $145 | $170 | 17% |
| AZ | Pima | Tucson | $147 | $171 | 16% |
| AR | Pulaski | Little Rock | $245 | $254 | 4% |
| DE | New Castle | Wilmington | $247 | $292 | 18% |
| FL | Broward | Ft. Lauderdale | $198 | $239 | 21% |
| FL | Duval | Jacksonville | $223 | $220 | -1% |
| FL | Hillsborough | Tampa | $240 | $206 | -14% |
| FL | Miami-Dade | Miami | $236 | $216 | -8% |
| FL | Orange | Orlando | $244 | $256 | 5% |
| FL | Palm Beach | West Palm Beach | $237 | $235 | -1% |
| GA | Fulton | Atlanta | $224 | $210 | -6% |
| HI | Honolulu | Honolulu | N/A | $213 | N/A |
| IL | Cook | Chicago | $177 | $160 | -10% |
| IN | Marion | Indianapolis | $277 | $266 | -4% |
| IA | Linn | Cedar Rapids | $202 | $233 | 15% |
| KS | Sedgwick | Wichita | $179 | $203 | 14% |
| KS | Wyandotte | Kansas City | $188 | $240 | 28% |
| LA | Orleans | New Orleans | $243 | $272 | 12% |
| ME | Cumberland | Portland | $231 | $234 | 1% |
| MI | Wayne | Detroit | $188 | $185 | -2% |
| MS | Jackson | Jackson | $253 | $228 | -10% |
| MO | Saint Louis | St. Louis | $226 | $235 | 4% |
| MT | Gallatin | Bozeman | $195 | $267 | 37% |
| NE | Douglas | Omaha | $216 | $256 | 19% |
| NV | Clark | Las Vegas | $195 | $214 | 10% |
| NH | Hillsborough | Manchester | $202 | $214 | 6% |
| NJ | Essex | Newark | $259 | $271 | 5% |
| NM | Bernalillo | Albuquerque | $141 | $198 | 41% |
| NC | Guilford | Greensboro | $247 | $292 | 18% |
| NC | Mecklenburg | Charlotte | $268 | $335 | 25% |
| NC | Wake | Raleigh-Durham | $238 | $294 | 23% |
| ND | Cass | Fargo | $223 | $249 | 11% |
| OH | Cuyahoga | Cleveland | $202 | $189 | -7% |
| OH | Franklin | Columbus | $200 | $240 | 20% |
| OH | Hamilton | Cincinnati | $208 | $197 | -6% |
| OH | Montgomery | Dayton | $226 | $217 | -4% |
| OK | Oklahoma | Oklahoma City | $179 | $242 | 35% |
| OK | Tulsa | Tulsa | $183 | $247 | 35% |
| OR | Multnomah | Portland | $175 | $215 | 23% |
| PA | Allegheny | Pittsburgh | $141 | $156 | 11% |
| PA | Philadelphia | Philadelphia | $219 | $226 | 3% |
| SC | Richland | Columbia | $226 | $258 | 14% |
| SD | Lincoln | Sioux Falls | $210 | $253 | 20% |
| SD | Minnehaha | Sioux Falls | $210 | $253 | 20% |
| TN | Davidson | Nashville | $188 | $230 | 23% |
| TN | Shelby | Memphis | $183 | $229 | 25% |
| TX | Bexar | San Antonio | $207 | $186 | -10% |
| TX | Comal | San Antonio | $195 | $194 | -1% |
| TX | Medina | San Antonio | $217 | $201 | -8% |
| TX | Dallas | Dallas | $229 | $216 | -6% |
| TX | El Paso | El Paso | $190 | $197 | 4% |
| TX | Harris | Houston | $205 | $210 | 2% |
| TX | Hidalgo | McAllen | $165 | $159 | -4% |
| TX | Travis | Austin | $197 | $217 | 10% |
| UT | Salt Lake | Salt Lake City | $202 | $229 | 13% |
| VA | Henrico | Richmond | $213 | $227 | 6% |
| WV | Cabell | Huntington | $237 | $260 | 10% |
| WV | Wayne | Huntington | $237 | $260 | 10% |
| WI | Milwaukee | Milwaukee | $273 | $267 | -2% |
| WY | Laramie | Cheyenne | $334 | $350 | 5% |
Source: Plan and premium information is from the plan landscape files for states using the HealthCare.gov platform in 2016.
Note: The premiums in this table represent premiums before the application of tax credits. The number of QHPs in the county does not include catastrophic plans Numbers presented here may differ from those in CMS’s “2016 Marketplace Affordability Snapshot.” The CMS snapshot analyzes percent changes in the second-lowest cost silver plan from 2015 to 2016, ranked by full premium price. This brief identifies the second-lowest cost silver plan based on the portion of the premium that covers essential health benefits (EHB). See the “Methodology and Limitations” section for details. Additionally, CMS’s analysis for cities was at the Designated Marketing Area (DMA, or media market) level. This table presents premiums for a single county.
TABLE 12
Number of Marketplace Issuers in County, 2015–2016 for Selected Cities in HealthCare.gov States
| State | City | County | Number of Issuers | Net Change in Number of Issuers, 2015-2016 | |
|---|---|---|---|---|---|
| 2015 | 2016 | ||||
| AL | Birmingham | Jefferson | 3 | 3 | 0 |
| AK | Anchorage | Anchorage | 2 | 2 | 0 |
| AK | Juneau | Juneau | 2 | 2 | 0 |
| AZ | Phoenix | Maricopa | 12 | 9 | -3 |
| AZ | Tucson | Pima | 11 | 6 | -5 |
| AR | Little Rock | Pulaski | 4 | 5 | 1 |
| DE | Wilmington | New Castle | 3 | 3 | 0 |
| FL | Ft. Lauderdale | Broward | 8 | 7 | -1 |
| FL | Jacksonville | Duval | 4 | 5 | 1 |
| FL | Tampa | Hillsborough | 5 | 5 | 0 |
| FL | Miami | Miami-Dade | 7 | 7 | 0 |
| FL | Orlando | Orange | 5 | 4 | -1 |
| FL | West Palm Beach | Palm Beach | 8 | 7 | -1 |
| GA | Atlanta | Fulton | 7 | 8 | 1 |
| HI | Honolulu | Honolulu | N/A | 2 | N/A |
| IL | Chicago | Cook | 7 | 8 | 1 |
| IN | Indianapolis | Marion | 5 | 6 | 1 |
| IA | Cedar Rapids | Linn | 1 | 3 | 2 |
| KS | Wichita | Sedgwick | 4 | 3 | -1 |
| KS | Kansas City | Wyandotte | 2 | 2 | 0 |
| LA | New Orleans | Orleans | 4 | 5 | 1 |
| ME | Portland | Cumberland | 3 | 3 | 0 |
| MI | Detroit | Wayne | 13 | 13 | 0 |
| MS | Jackson | Jackson | 1 | 2 | 1 |
| MO | St. Louis | Saint Louis | 4 | 4 | 0 |
| MT | Bozeman | Gallatin | 3 | 3 | 0 |
| NE | Omaha | Douglas | 2 | 4 | 2 |
| NV | Las Vegas | Clark | 3 | 4 | 1 |
| NH | Manchester | Hillsborough | 4 | 5 | 1 |
| NJ | Newark | Essex | 6 | 5 | -1 |
| NM | Albuquerque | Bernalillo | 5 | 4 | -1 |
| NC | Greensboro | Guilford | 3 | 3 | 0 |
| NC | Charlotte | Mecklenburg | 3 | 3 | 0 |
| NC | Raleigh-Durham | Wake | 3 | 3 | 0 |
| ND | Fargo | Cass | 3 | 3 | 0 |
| OH | Cleveland | Cuyahoga | 10 | 12 | 2 |
| OH | Columbus | Franklin | 7 | 9 | 2 |
| OH | Cincinnati | Hamilton | 10 | 11 | 1 |
| OH | Dayton | Montgomery | 9 | 11 | 2 |
| OK | Oklahoma City | Oklahoma | 3 | 2 | -1 |
| OK | Tulsa | Tulsa | 3 | 2 | -1 |
| OR | Portland | Multnomah | 8 | 9 | 1 |
| PA | Pittsburgh | Allegheny | 5 | 5 | 0 |
| PA | Philadelphia | Philadelphia | 5 | 4 | -1 |
| SC | Columbia | Richland | 4 | 5 | 1 |
| SD | Sioux Falls | Lincoln | 3 | 2 | -1 |
| SD | Sioux Falls | Minnehaha | 3 | 2 | -1 |
| TN | Nashville | Davidson | 3 | 4 | 1 |
| TN | Memphis | Shelby | 3 | 4 | 1 |
| TX | San Antonio | Bexar | 8 | 8 | 0 |
| TX | San Antonio | Comal | 5 | 6 | 1 |
| TX | San Antonio | Medina | 2 | 3 | 1 |
| TX | Dallas | Dallas | 6 | 8 | 2 |
| TX | El Paso | El Paso | 5 | 5 | 0 |
| TX | Houston | Harris | 7 | 7 | 0 |
| TX | McAllen | Hidalgo | 6 | 7 | 1 |
| TX | Austin | Travis | 8 | 7 | -1 |
| UT | Salt Lake City | Salt Lake | 6 | 5 | -1 |
| VA | Richmond | Henrico | 3 | 4 | 1 |
| WV | Huntington | Cabell | 1 | 2 | 1 |
| WV | Huntington | Wayne | 1 | 2 | 1 |
| WI | Milwaukee | Milwaukee | 6 | 6 | 0 |
| WY | Cheyenne | Laramie | 2 | 1 | -1 |
Source: Plan and premium information is from the plan landscape files for states using the HealthCare.gov platform in 2015 and 2016.
Note: Qualified health plan issuers are counted based on unique HIOS issuer ID number.
TABLE 13
It Pays to Shop: Percent of Current Marketplace Consumers Who Could Obtain Coverage for $100 or Less after Any Applicable Tax Credits in 2016, Regardless of Metal Level Chosen in 2015 in HealthCare.gov States
| State | Monthly Premium After Advance Premium Tax Credits | ||
| $100 or less | $75 or less | $50 or less | |
| HealthCare.gov States Total (37 States) | 78% | 72% | 65% |
| AK | 75% | 70% | 64% |
| AL | 81% | 76% | 69% |
| AR | 73% | 66% | 56% |
| AZ | 74% | 68% | 56% |
| DE | 71% | 65% | 57% |
| FL | 84% | 80% | 73% |
| GA | 81% | 77% | 70% |
| IA | 74% | 67% | 58% |
| IL | 64% | 54% | 44% |
| IN | 70% | 64% | 55% |
| KS | 71% | 62% | 53% |
| LA | 85% | 82% | 78% |
| ME | 72% | 65% | 56% |
| MI | 77% | 69% | 60% |
| MO | 79% | 74% | 68% |
| MS | 85% | 82% | 76% |
| MT | 79% | 71% | 64% |
| NC | 85% | 81% | 75% |
| ND | 69% | 60% | 49% |
| NE | 76% | 68% | 59% |
| NH | 64% | 53% | 47% |
| NJ | 60% | 53% | 44% |
| NM | 82% | 70% | 62% |
| NV | 77% | 69% | 58% |
| OH | 65% | 57% | 45% |
| OK | 84% | 79% | 72% |
| OR | 68% | 58% | 50% |
| PA | 69% | 63% | 55% |
| SC | 82% | 77% | 71% |
| SD | 78% | 70% | 61% |
| TN | 77% | 71% | 64% |
| TX | 79% | 73% | 66% |
| UT | 85% | 77% | 67% |
| VA | 76% | 70% | 63% |
| WI | 75% | 69% | 62% |
| WV | 66% | 59% | 50% |
| WY | 68% | 60% | 51% |
Source: Plan information is from the plan landscape files and active plan selections in the CMS Multidimensional Insurance Data Analytics System (MIDAS) for 37 states using the HealthCare.gov platform in 2015 and 2016.
Note: Columns may not sum due to rounding. This analysis holds all enrollee characteristics unchanged and calculates 2016 premiums and tax credits based on the same age, family composition, and household income as percentage of the FPL as in 2015. This analysis includes only enrollees who could be linked to complete plan and premium data for both 2015 and 2016, and excludes tobacco users. Catastrophic plans, which are not available to all consumers, were not considered in these calculations. See the “Methods and Limitations” section for more details.
TABLE 14
It Pays to Shop: Potential Savings from Shopping Based on Premium if Current Marketplace Enrollees Switch to 2016 Lowest-Cost Premium Plan within Metal Level in HealthCare.gov States
| State | Average 2016 Monthly Premium Savings if Consumers Switch to Lowest-Cost Plan within Metal Level | Annual Average Potential Savings in Premium Costs per Enrollee | % of Enrollees Who Could Save on Premium Costs by Switching to the Lowest-Cost Plan within Metal Level |
|---|---|---|---|
| HealthCare.gov States Average (37 States) | $51 | $610 | 86% |
| AK | $67 | $804 | 70% |
| AL | $49 | $593 | 87% |
| AR | $20 | $234 | 91% |
| AZ | $52 | $622 | 94% |
| DE | $25 | $302 | 83% |
| FL | $37 | $450 | 78% |
| GA | $57 | $683 | 96% |
| IA | $36 | $427 | 65% |
| IL | $86 | $1,030 | 96% |
| IN | $87 | $1,042 | 96% |
| KS | $42 | $504 | 58% |
| LA | $66 | $788 | 75% |
| ME | $10 | $125 | 44% |
| MI | $75 | $895 | 91% |
| MO | $42 | $502 | 86% |
| MS | $43 | $513 | 91% |
| MT | $20 | $234 | 78% |
| NC | $55 | $663 | 84% |
| ND | $29 | $345 | 91% |
| NE | $41 | $494 | 85% |
| NH | $52 | $622 | 98% |
| NJ | $67 | $804 | 84% |
| NM | $51 | $612 | 60% |
| NV | $31 | $369 | 77% |
| OH | $77 | $923 | 85% |
| OK | $29 | $344 | 66% |
| OR | $47 | $569 | 84% |
| PA | $38 | $450 | 92% |
| SC | $33 | $395 | 99% |
| SD | $18 | $217 | 71% |
| TN | $60 | $726 | 87% |
| TX | $53 | $637 | 93% |
| UT | $60 | $723 | 90% |
| VA | $27 | $326 | 72% |
| WI | $69 | $828 | 79% |
| WV | $19 | $229 | 77% |
| WY | $16 | $191 | 53% |
Source: Plan information is from the plan landscape files and active plan selections in the CMS Multidimensional Insurance Data Analytics System (MIDAS) for 37 states using the HealthCare.gov platform in 2015 and 2016. Hawaii is not included in this analysis.
Note: Amounts presented here do not take into account potential tax credits. The lowest-cost premium refers to the plan with the lowest premium within the county within each metal tier and is based on all the plans available in 2016. The lowest cost plan does not take into account other cost-sharing features, but refers only to the cost of the premium charged for that plan. In some cases, plans were tied for lowest premium. This analysis includes only enrollees linked to complete plan and premium data for both 2015 and 2016, and excludes tobacco users. Catastrophic plans, which are not available to all consumers, were not considered in these calculations. We assume that all enrollee characteristics are unchanged and calculate premiums based on the same age, family composition, and household income as percentage of the FPL as in 2015. See the “Methods and Limitations” section for more details.
[1]The Health Insurance Marketplace includes the Marketplaces established in each of the states (and the District of Columbia) and run by the state or the federal government. This report focuses on individual market Marketplaces using the HealthCare.gov eligibility and enrollment system. This analysis excludes stand-alone dental plans.
[2] This brief does not analyze consumers’ final expenses, after considering other health plan features, such as deductibles and copayments. Consumers may examine all elements of health insurance plans in order to estimate expected total out-of-pocket costs. Moreover, while premium tax credits can be applied to a plan in any metal tier with the exception of catastrophic plans, cost-sharing reductions based on household income are available only for silver plans.
[3] This represents the percentage of individuals who selected a Marketplace plan and qualified for an advance premium tax credit (APTC), with or without a cost-sharing reduction. See: U.S. Department of Health and Human Services, “Health Insurance Marketplaces 2015 Open Enrollment Period: March Enrollment Report,” ASPE Issue Brief, ASPE, March 10, 2015, available at: http://aspe.hhs.gov/pdf-document/health-insurance-marketplace-2015-open-enrollment-period-march-enrollment-report.
[4] The 38 states are included in this analysis are: Alabama, Alaska, Arizona, Arkansas, Delaware, Florida, Georgia, Hawaii, Illinois, Indiana, Iowa, Kansas, Louisiana, Maine, Michigan, Mississippi, Missouri, Montana, Nebraska, New Hampshire, New Jersey, Nevada, New Mexico, North Carolina, North Dakota, Ohio, Oklahoma, Oregon, Pennsylvania, South Carolina, South Dakota, Tennessee, Texas, Utah, Virginia, West Virginia, Wisconsin, and Wyoming. However, some tables are limited to the 35 states that were included in the 2014 Marketplace landscape files (excluding Nevada, Oregon, and Hawaii), and some additional tables exclude data for Hawaii (which is beginning to use the HealthCare.gov platform for the 2016 coverage year and is only included on the 2016 landscape file).
[5] See the “Methods and Limitations” section at the end of this brief for more details on calculation of second-lowest cost silver plan premiums and premium tax credits.
[6] Centers for Medicare and Medicaid Services, “2016 Marketplace Affordability Snapshot,” October 26, 2015, available at: https://www.cms.gov/Newsroom/MediaReleaseDatabase/Fact-sheets/2015-Fact-sheets-items/2015-10-26-2.html.
[7] This brief closely follows the actual methodology used to determine the benchmark for advanced premium tax credits (APTC) and enrollees’ APTC amount. For more details on how benchmark premiums are calculated, see the “Methodology and Limitations” section at the end of this brief.
[8] For the purposes of calculating the advance premium tax credit, a second-lowest cost silver level plan for a specific taxpayer is identified based on what is available to the taxpayer at the time of enrollment, in the taxpayer’s geographical area. In this brief for analytic purposes, at times we use the term “benchmark plan” to refer to the second-lowest cost silver plan in a county, which may not be the benchmark plan for all individual consumers.
[9] Jon Gabel, “Trends in Premiums in the Small Group and Individual Insurance Markets,” NORC at the University of Chicago, November 6, 2012, available at: http://aspe.hhs.gov/report/trends-premiums-small-group-and-individual-insurance-markets-2008-2011.
[10] Thomas DeLeire and Caryn Marks, “Consumer Decision Regarding Health Plan Choices, in the 2014 and 2015 Marketplaces,” ASPE Issue Brief, Assistant Secretary for Planning and Evaluation, October 27, 2015, available at: http://aspe.hhs.gov/sites/default/files/private/pdf/134556/Consumer_decisions_10282015.pdf.
[11] Note that some previous ASPE issue briefs on plan choice and availability presented analyses at the rating area level. Because plans available in some part of a rating area are not always available in all parts of a rating area, conducting the analysis at the county level better captures the set of options consumers will see when they shop and more closely matches consumers’ shopping experience.
[12] For example, see Timothy Bresnahan and Peter Reiss, “Entry and Competition in Concentrated Markets,” The Journal of Political Economy, vol. 99, no.5 (Oct. 1991), p. 997-1009.
[13] Steven Sheingold, Nguyen Nguyen, and Andre Chappel, “Competition and Choice in the Health Insurance Marketplaces, 2014-2015: Impact on Premiums,” Issue Brief, Assistant Secretary for Planning and Evaluation, July 27, 2015, available at: http://aspe.hhs.gov/sites/default/files/private/pdf/108466/rpt_MarketplaceCompetition.pdf.
[14] The total number of issuers in is calculated based on identifying an issuer by its unique five-digit Health Insurance Oversight System (HIOS) ID. In some cases, issuers with different HIOS IDs belong to the same parent company. An issuing entity’s HIOS issuer ID is specific to the state in which it operates, such that a company offering QHPs through the Marketplace in two states would be counted twice—once for each state. Issuer totals for 2015 and 2016 include 37 states and do not include Hawaii, which began using the HealthCare.gov platform for the 2016 coverage year. Issuer totals for 2014 include 35 states and do not include Hawaii, New Mexico, and Oregon.
[15] The 2016 plan landscape file used in this brief is a snapshot of issuer participation and plans as of October 19, 2015 and does not reflect changes in issuer and plan offerings after that date. For example, the landscape file used in this analysis includes some plans and issuers that, based on decisions after October 19th, will not be offered in 2016, and does not include a very small number of plans and/or issuers that will become available for enrollment in mid-November. Since the production of the October 19, 2015 version of the landscape file, Departments of Insurance have directed some issuers or plans to exit the Marketplaces in Arizona, Michigan, Oregon, South Carolina, and Utah, and those issuers or plans will not be available for 2016. The landscape file also does not include issuers in New Jersey, New Mexico, and Texas that will become available later during Open Enrollment. Due to these changes since the 2016 landscape file was finalized on October 19th, in a small number of states the consumer experience will differ from what is reported in this brief.
[16] See footnote 15.
[17] May not sum due to rounding. Percentages do not include tobacco users.
[18] Robert Wood Johnson Foundation, “Understanding the Uninsured Now,” June 2015, available at: http://www.rwjf.org/en/library/research/2015/06/understanding-the-uninsured-now.html.
[19] Thomas DeLeire and Caryn Marks, “Consumer Decision Regarding Health Plan Choices, in the 2014 and 2015 Marketplaces,” ASPE Issue Brief, Assistant Secretary for Planning and Evaluation, October 27, 2015, available at: http://aspe.hhs.gov/sites/default/files/private/pdf/134556/Consumer_decisions_10282015.pdf.
[20] Savings for individual enrollees may differ from this amount based on their choice of plan, eligibility for premium tax credits, and other characteristics.
[21] This represents the percentage of individuals who selected a Marketplace plan and qualified for an advance premium tax credit (APTC), with or without a cost-sharing reduction. See: U.S. Department of Health and Human Services, “Health Insurance Marketplaces 2015 Open Enrollment Period: March Enrollment Report,” ASPE Issue Brief, ASPE, March 10, 2015.
[22] Ibid.
[23] Kenneth Finegold, Kelsey Avery, Bula Ghose, and Caryn Marks, “Health Insurance Marketplace: Uninsured Populations Eligible to Enroll for 2016,” ASPE Issue Brief, Assistant Secretary for Planning and Evaluation, October 15, 2015, available at: http://aspe.hhs.gov/pdf-report/health-insurance-marketplace-uninsured-populations-eligible-enroll-2016.
[24] For more information see: Steven Sheingold, Nguyen Nguyen, and Andre Chappel, “Competition and Choice in the Health Insurance Marketplaces, 2014-2015: Impact on Premiums,” ASPE Issue Brief, Assistant Secretary for Planning and Evaluation, July 27, 2015.
[25] If the premium of the second-lowest cost silver plan falls below the maximum amount the household pays for benchmark coverage, then the household does not receive a tax credit and pays the full premium for the benchmark plan.
[26] For more information on premium tax credits, see the Internal Revenue Service final rule on “Health Insurance Premium Tax Credit,” (Federal Register, May 23, 2012, vol., 77, no. 100, p. 30392; available at: http://www.gpo.gov/fdsys/pkg/FR-2012-05-23/pdf/2012-12421.pdf).
[27] Income examples are based on the 2015 federal poverty guidelines for the continental United States. Alaska and Hawaii have higher federal poverty guidelines, which are not shown in this table.
[28] In states expanding Medicaid, individuals and families at between 100 and 138 percent of the FPL who are eligible for Medicaid coverage are not eligible for premium tax credits.
[29] The Marketplace plan landscape files can be downloaded at: https://www.healthcare.gov/health-and-dental-plan-datasets-for-researchers-and-issuers/
[30] Available at http://aspe.hhs.gov/pdf-report/health-plan-choice-and-premiums-2015-health-insurance-marketplace.
[31] For the purposes of calculating the advance premium tax credit, a second-lowest cost silver level plan for a specific taxpayer is identified based on what is available to the taxpayer at the time of enrollment, in the taxpayer’s geographical area. In this brief for analytic purposes, at times we use the term “benchmark plan” to refer to the second-lowest cost silver plan in a county, which may not be the benchmark plan for all individual consumers.
[32] The Health Insurance Marketplace public use files are available at: https://www.cms.gov/cciio/resources/data-resources/marketplace-puf.html.
[33] Centers for Medicare and Medicaid Services, “2016 Marketplace Affordability Snapshot,” October 26, 2015, available at: https://www.cms.gov/Newsroom/MediaReleaseDatabase/Fact-sheets/2015-Fact-sheets-items/2015-10-26-2.html.