
U.S. Department of Health and Human Services
The Graying of Medicares Disabled Population: Implication for a Medicare Drug Benefit
Dennis SheaPenn State University
Becky Briesacher, Bruce Stuart and Jalpa DoshiUniversity of Maryland, Peter Lamy Center
March 28, 2002
PDF Version: http://aspe.hhs.gov/daltcp/reports/2002/graying.pdf (27 PDF pages)
This report was prepared under contract #HHS-100-01-0023 between the U.S. Department of Health and Human Services (HHS), Office of Disability, Aging and Long-Term Care Policy (DALTCP) and the University of Maryland. For additional information about this subject, you can visit the DALTCP home page at http://aspe.hhs.gov/_/office_specific/daltcp.cfm or contact the office at HHS/ASPE/DALTCP, Room 424E, H.H. Humphrey Building, 200 Independence Avenue, S.W., Washington, D.C. 20201. The e-mail address is: webmaster.DALTCP@hhs.gov. The Project Officer was Andreas Frank
The opinions and views expressed in this report are those of the authors. They do not necessarily reflect the views of the Department of Health and Human Services, the contractor or any other funding organization.
TABLE OF CONTENTS
LIST OF FIGURES
FIGURE 1: Number of Common Chronic Conditions, 1998
FIGURE 2: Self-Reports of Chronic Illnesses
FIGURE 3: Average Prescription Spending
FIGURE 4: Average Number of Prescriptions Filled in a Year
FIGURE 5: Rates of Drug Coverage
FIGURE 6: Beneficiaries with Drug Benefits from Medicare HMOs
FIGURE 7: Beneficiaries with Drug Benefits from Employer-Sponsored Plans
FIGURE 8: Out-of-Pocket Drug Costs
FIGURE 9: Beneficiaries Paying Over 5% of Their Incomes for Drug Costs
FIGURE 10: Portion of Drug Costs Paid by Insurers
LIST OF TABLES
TABLE 1: Characteristics of Community-Dwelling Disabled and Aged Medicare Beneficiaries, 1998
TABLE 2: Status of Prescription Drug Coverage of Community-Dwelling Disabled and Aged Medicare Beneficiaries, 1995-1998
TABLE 3: Sources of Prescription Drug Coverage of Community-Dwelling Disabled and Aged Medicare Beneficiaries with Prescription Coverage, 1995-1998
TABLE 4: Mean Annual Prescription Drug Expenditures for Community-Dwelling Disabled and Aged Medicare Beneficiaries by Status and Source of Coverage, 1995-1998
TABLE 5: Mean Annual Number of Prescriptions Filled for Community-Dwelling Disabled and Aged Medicare Beneficiaries by Status and Source of Coverage, 1995-1998
TABLE 6: Mean Annual Out-of-Pocket Prescription Drug Spending of Community-Dwelling Disabled and Aged Medicare Beneficiaries by Status and Source of Coverage, 1995-1998
TABLE 7: Percent of Annual Prescription Drug Expenditures of Community-Dwelling Disabled and Aged Medicare Beneficiaries Paid by Third Parties by Status and Source of Coverage, 1995-1998
TABLE 8: Ratio of Total Prescription Drug Spending to Income of Community-Dwelling Disabled and Aged Medicare Beneficiaries, 1995-1998
TABLE 9: Ratio of Out-of-Pocket Drug Spending to Income of Community-Dwelling Disabled and Aged Medicare Beneficiaries, 1995-1998
EXECUTIVE SUMMARY
The policy debate over a Medicare drug benefit has focused almost exclusively on the needs of Medicares elderly beneficiaries. While they represent more than 85 percent of the Medicare population, it is important to remember that Medicare also covers almost 5 million recipients of Social Security Disability Insurance (SSDI). If a drug benefit is to meet the needs of the entire Medicare population it must address the particular circumstances and needs of the disabled as well as the aged. There are actually two groups of Medicare disabled that warrant attention. First, there are the SSDI recipients themselves who, by statute, are all under 65 years of age. The second group comprises Medicare beneficiaries who are 65 and older, but who originally qualified for Medicare under SSDI. There are currently over 2 million beneficiaries who have aged out of SSDI, but still retain the characteristics and needs associated with younger disabled beneficiaries. We refer to this group as the disabled aged.
This report is intended to provide policymakers with critical information on prescription coverage, use, and cost for both younger and older disabled Medicare beneficiaries using data from the 1995 through 1998 Medicare Current Beneficiary Surveys. Our key findings are summarized below.
-
Spending: Prescription drug spending among SSDI disabled and disabled aged beneficiaries is substantially higher than for the remainder of the Medicare population. SSDI beneficiaries, on average, spent more than $1,200 annually on prescription drugs, 40 percent more than the overall mean for Medicare beneficiaries in 1998. Disabled aged beneficiaries spent almost $1,300 on drugs that year. During the period 1995 to 1998 prescription spending among all Medicare beneficiaries rose 45 percent. The rate of increase for SSDI beneficiaries was also 45 percent, but for the disabled aged it was 60 percent.
-
Coverage: SSDI and disabled aged Medicare beneficiaries are slightly more likely than the overall Medicare population to have prescription drug benefits, but they rely much more heavily on Medicaid and other public sources. The SSDI and disabled aged are less likely to receive employer coverage than other Medicare beneficiaries. While coverage expanded for both disabled groups from 1995 to 1998, the trends differ between them. SSDI beneficiaries had rising levels of employer and Medicare Health Maintenance Organization (HMO) coverage, with declining coverage from Medicaid. Disabled aged beneficiaries saw reductions in employer coverage and rising levels of coverage from Medigap and Medicare HMOs.
-
Burden: While out-of-pocket spending on prescription drugs among SSDI beneficiaries is just 1 percent higher than for the general Medicare population, the low income of disabled beneficiaries means their drug spending as a percentage of income is much greater. In 1998, nearly two in five SSDI beneficiaries spent over 10 percent of their annual incomes on prescription drugs, up from fewer than one in three in 1995. The situation is even worse for disabled aged Medicare beneficiaries, of whom 43 percent spent more than 10 percent of their income on drugs in 1998.
INTRODUCTION
This report profiles the prescription spending and coverage patterns of disabled Medicare beneficiaries before and after they turn age 65. Older beneficiaries who had disabling conditions in their younger years represent a growing segment of the Medicare population as definitions of disability expand and life expectancy rises. Yet, we know very little about the interplay of disability and older age and how that affects patterns of medication use and drug spending. Wide disparities in drug use and spending have been documented between younger disabled beneficiaries and seniors.1 The question we address here is whether these differences grow with advancing age. Most prescription drug benefit plans available to Medicare beneficiaries have been crafted to help seniors, so it is conceivable that some access problems may resolve for disabled beneficiaries once they reach age 65. On the other hand, as disabled beneficiaries age and grow increasingly frail and deplete their economic resources, the need for drugs may well increase.
In a prior study we showed that the under-65 SSDI population faces a daunting combination of medication access problems related to low income, poor health status, heavy prescription use, and high medication bills.2 Yet, they have few places to turn for relief. Except for Medicaid, which serves as the major source of drug coverage for this population, the avenues by which needy disabled individuals can access prescription coverage are heavily constrained. Few qualify for employer-sponsored health insurance plans, most state pharmaceutical assistance programs cover only seniors, and managed care plans have been accused of discouraging the disabled from enrolling. Most research in this field classifies disabled beneficiaries through Medicare's administrative designation of SSDI, which applies strictly to beneficiaries below age 65. However, the fact that official disability status disappears once these individuals reach their 65th birthday does not remove the physical and mental impediments that led to their original Medicare entitlement.
The present study classifies "disabled" Medicare beneficiaries according to their original entitlement status. This approach increases the size of the disabled Medicare population by nearly half: in 1998 there were 4.8 million under-65 SSDI recipients and another 2.1 million disabled aged persons 65 and older. We examined trends in health status, prescription spending, use, and benefit coverage for both populations over four years using data from the Medicare Current Beneficiary Survey (MCBS) from 1995 to 1998.3 Highlights from that analysis are presented below. Appendix tables present a more detailed set of statistics comparing the SSDI and disabled aged populations over this time period.
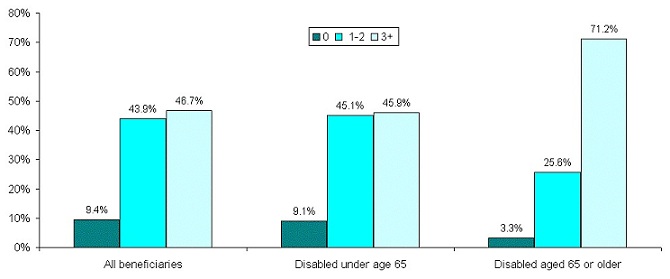
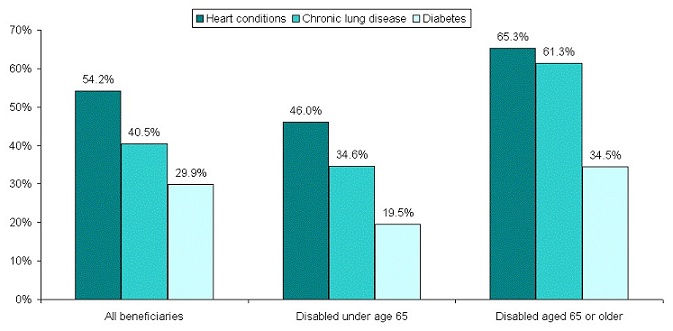
As age increases, disabled beneficiaries develop more chronic conditions than the average senior. Before age 65, disabled beneficiaries generally report about the same number of common chronic illnesses as seniors. This means, at a very basic level, that medical care for most of these individuals centers around the management of one or two conditions. After age 65, three-quarters of all disabled aged individuals exhibit three or more chronic conditions, half again as many suffered by younger disabled beneficiaries. These conditions reflect complex co-morbidities, with particularly high prevalence of heart disease, chronic lung disease, and diabetes.
| FIGURE 1. Number of Common Chronic Conditions, 1998 |
 |
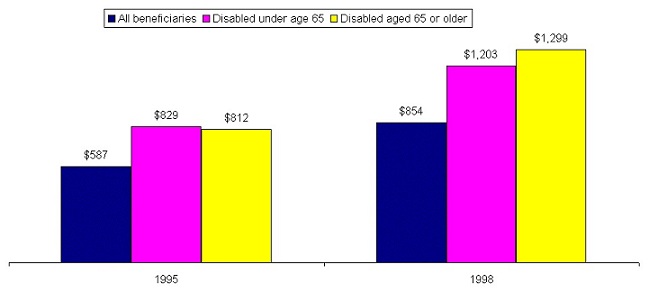
Disabled beneficiaries spend more on prescription drugs than other beneficiaries and the difference is accelerating. Prescription drug spending among SSDI disabled and disabled aged beneficiaries is substantially higher than for the remainder of the Medicare population. SSDI beneficiaries spent $1,203 on prescription drugs in 1998, 40 percent more than the overall mean for Medicare beneficiaries. Disabled aged beneficiaries spent $1,299 on drugs that year. During the period 1995-1998 prescription spending among all Medicare beneficiaries rose 45 percent. The rate of increase for SSDI beneficiaries was also 45 percent, but for the disabled aged it was 60 percent ($812 to $1,299).
| FIGURE 2. Self-Reports of Chronic Illnesses |
 |
| FIGURE 3. Average Prescription Spending |
 |
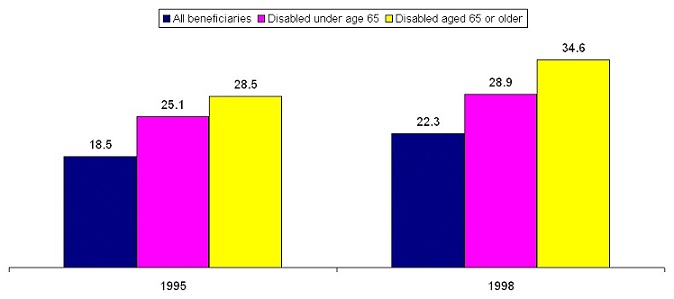
Disabled beneficiaries use many medications and their need increases as they get older. High levels of medication use are common to all Medicare beneficiaries but especially for the disabled who take even more medications as they get older. Younger disabled beneficiaries fill about 30 percent more prescriptions than the overall Medicare population. After age 65, this difference rises to over 50 percent. Between 1995 and 1998 medication use increased almost 20 percent across the entire Medicare population. For the disabled aged, average prescription use rose from 29 per year in 1995 to 35 in 1998.
| FIGURE 4. Average Number of Prescriptions Filled in a Year |
 |
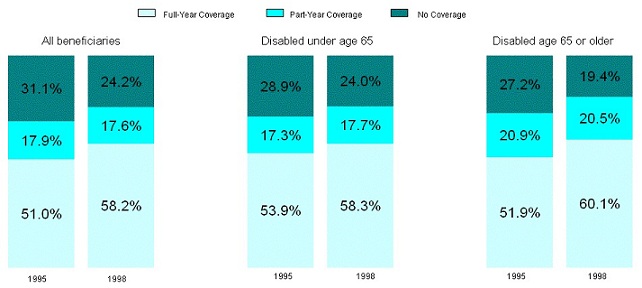
The proportion of Medicare beneficiaries with drug coverage grew in the last half of the 1990s for all entitlement groups. Both younger and older disabled beneficiaries are slightly more likely to have prescription drug coverage than other Medicare beneficiaries. Prescription coverage rates improved for every entitlement group between 1995 and 1998, but the gains were greater for the aged disabled. By 1998, over 80 percent of this group had some form of prescription coverage. However, aged disabled beneficiaries are also more likely to have gaps in their prescription benefits than either SSDI or aged non-disabled beneficiaries.
| FIGURE 5. Rates of Drug Coverage |
 |
Sources of drug coverage differ greatly between older and younger disabled beneficiaries. The similarity in prescription coverage among younger and older disabled beneficiaries masks a major difference in source of drug benefits between the two groups. Before reaching their 65th birthdays, disabled beneficiaries rely heavily upon Medicaid as their main source of drug benefits, although this dependence dropped dramatically between 1995 and 1998. In contrast, Medicaid enrollment among aged disabled persons is a third lower. This is not to say that aged disabled beneficiaries do not still rely upon Medicaid: they are twice as likely to have this form of drug coverage as other seniors. However, aged disabled beneficiaries have other options not as readily available to SSDI recipients, most notably through Medicare HMOs.
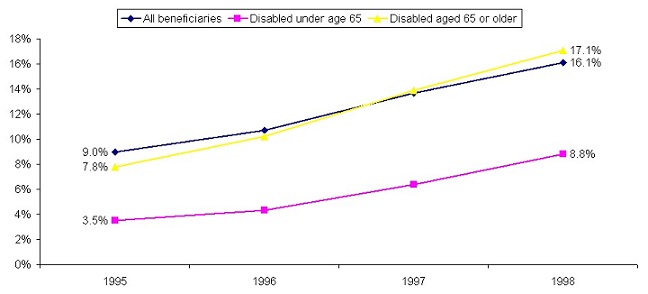
As shown in the next figure, enrollment in Medicare HMOs grew significantly from 1995 to 1998 for both groups of disabled, but the drug coverage (or prescription coverage) rates were twice as high among the aged disabled. By 1998 more than 17 percent of these beneficiaries received prescription benefits from Medicare HMOs, a percentage point above the average for all beneficiaries combined. In that year more aged disabled had drug benefits from managed care plans than from Medicaid.
| FIGURE 6. Beneficiaries with Drug Benefits from Medicare HMOs |
 |
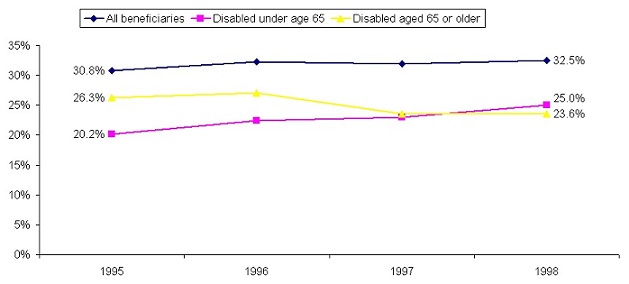
As a whole, the disabled Medicare population has fewer opportunities for prescription coverage from employer-sponsored plans compared to other beneficiaries. What opportunities there are also appear to be shrinking for aged disabled beneficiaries. In 1995, aged disabled beneficiaries were a third more likely to have drug benefits from employers compared to younger SSDI beneficiaries. However, after 1996, disabled seniors experienced a large decline in retiree drug coverage and by 1998 were actually less likely to have this type of coverage than SSDI recipients. The reasons for this unusual trend are unknown.
| FIGURE 7. Beneficiaries with Drug Benefits from Employer-Sponsored Plans |
 |
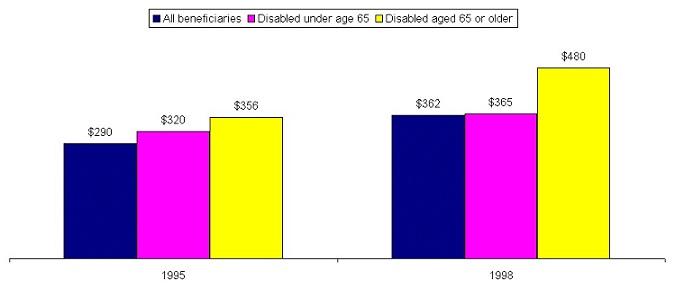
Rising levels of drug coverage have not insulated older disabled beneficiaries from the burden of rising drug costs. How good is the protection from high out-of-pocket costs afforded by different types of prescription coverage? The burden of out-of-pocket spending is especially important to disabled beneficiaries because most have very limited resources to pay for medical costs not covered by insurance. In 1998, over 70 percent of the entire disabled Medicare population lived below 200 percent of the federal poverty level compared to 50 percent of other beneficiaries (see appendix Table 1). As seen in the chart below, drug costs paid out-of-pocket by SSDI disabled beneficiaries are somewhat higher than the average for all Medicare beneficiaries, but there is a large percentage increase for aged disabled beneficiaries. Drug costs paid directly by beneficiaries grew during the late 1990s, impacting those individuals with the highest levels of prescription spending. Aged disabled beneficiaries experienced a 35 percent increase in average annual out-of-pocket spending on drugs between 1995 and 1998, compared to 14 percent for the younger disabled population, and 25 percent for the Medicare population overall.
| FIGURE 8. Out-of-Pocket Drug Costs |
 |
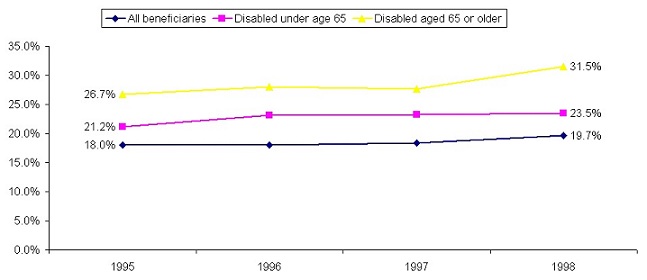
Uncovered prescription costs drain resources of aged disabled beneficiaries. The limited incomes of disabled Medicare beneficiaries means that even modest amounts paid directly for prescription drugs can represent a burden. By 1998, for example, almost one in three aged disabled individuals spent more than 5 percent of their incomes on prescription drugs. This represents a five percentage point increase in the number of disabled aged 65 and older beneficiaries in just four years. By comparison, just under a quarter of younger SSDI disabled beneficiaries spent over 5 percent of their incomes on drugs in 1998. For the Medicare population as a whole the rate was under 20 percent that year.
| FIGURE 9. Beneficiaries Paying Over 5% of Their Incomes for Drug Costs |
 |
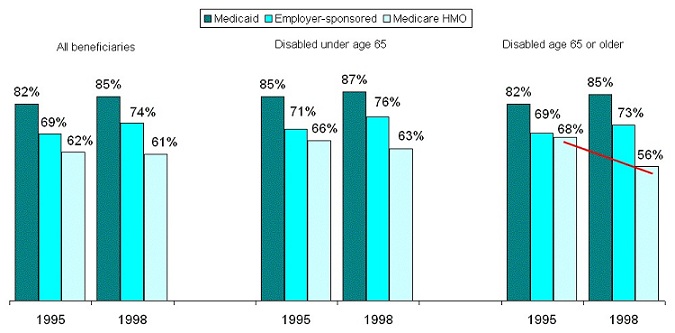
New sources of prescription coverage offer less protection than traditional sources. How can prescription coverage be growing yet the burden of out-of-pocket spending on drugs costs also be rising? The increases we see here reflect, at least in part, changes in drug coverage over the latter half of the decade of the 1990s. We have already shown that disabled beneficiaries tend to lose their Medicaid and employer-sponsored drug coverage after age 65 and gain it from Medicare HMOs. During the study period, Medicaid and employer-sponsored plans paid relatively large portions of drug costs for covered beneficiaries (70-90 percent), while Medicare HMOs paid much less on average (around 60 percent). In fact, between 1995 and 1998, traditional coverage became more generous, while managed care plans cut back. This drop in drug coverage from Medicare HMOs affected older disabled beneficiaries the most (68 percent in 1995 to 56 percent in 1998).
| FIGURE 10. Portion of Drug Costs Paid by Insurers |
 |
CONCLUSION
These data from the MCBS show that reaching age 65 brings added burdens to Medicare's disabled population. As they age, disabled beneficiaries bear an increasing burden of chronic illness, which spurs greater medication use and spending. However older beneficiaries have more limited access to traditionally generous sources of prescription coverage through Medicaid and employer-sponsored plans. Higher enrollment rates in Medicare HMOs help some, but these organizations offer more limited prescription coverage. As a result, the aged disabled bear higher out-of-pocket costs for drugs than other beneficiaries, a situation made worse by their limited economic resources.
NOTES
-
B. Briesacher, B. Stuart, J. Doshi, S. Kamal-Bahl, D. Shea. The Medicare Disabled: A Forgotten Population in the Debate over Drug Benefits. Report by The Kaiser Family Foundation and The Commonwealth Fund, forthcoming.
-
B. Briesacher, B. Stuart, J. Doshi, S. Kamal-Bahl, D. Shea. The Medicare Disabled: A Forgotten Population in the Debate over Drug Benefits. Report by The Kaiser Family Foundation and The Commonwealth Fund, forthcoming.
-
The MCBS is a nationally representative in-home survey of approximately 12,000 Medicare beneficiaries per year. The survey over-samples beneficiaries under the age of 65 making it one of the best data sources for studying the SSDI disabled population. Although Medicare does not provide insurance coverage for prescription drugs, the MCBS surveys Medicare beneficiaries about their prescription drug coverage and drug use and cost. Trained interviewers request detailed information and examine prescription bottles and bills to identify prescriptions filled, names of drugs, total payments, payment sources, and other information. When information is missing, the MCBS uses administrative data and statistical techniques to make an estimate or "imputation" of the information. For example, when information on the total cost of the prescription is missing, an administrative drug pricing source, the National Drug Data File User Manual (known as "The Blue Book") is used to impute prices. Depending on the source of insurance payment, this price might be adjusted downward to reflect the discounts that some insurers negotiate from drug companies. Overall, a recent study by the Centers for Medicare and Medicaid services suggests that the MCBS captures approximately 85 percent of all prescription expenditures. This means that the estimates provided in this report may, in fact, underestimate the spending by disabled persons.
APPENDIX
| TABLE 1. Characteristics of Community-Dwelling Disabled and Aged Medicare Beneficiaries, 1998 | |||
| Characteristics | All Beneficiaries | Disabled Beneficiaries | |
| Age 65 | Age 65 or Older | ||
| All beneficiaries | 38.0 million | 4.8 million | 2.1 million |
| Age 45 45-64 65-69 70-74 75-79 80+ | 4.08.724.122.518.722.1 | 31.568.5-------- | ----38.625.719.016.7 |
| Gender Female Male | 55.644.4 | 42.557.5 | 47.752.3 |
| Race White Black Other | 85.29.05.9 | 74.216.79.1 | 79.215.85.0 |
| Hispanic Ethnicity Hispanic Non-Hispanic | 7.093.0 | 11.388.7 | 7.292.8 |
| Income in Relation to Federal Poverty Level (FPL) 100% FPL 101-200% FPL >200% FPL | 23.232.744.1 | 45.231.723.1 | 34.837.627.7 |
| Urban/Rural Residence Urban Rural | 75.025.0 | 70.929.1 | 72.627.4 |
| Census Region Midwest South Northeast West | 23.435.320.818.8 | 23.039.118.116.8 | 20.340.518.517.8 |
| Self-Reported Health Excellent Very good Good Fair Poor | 14.426.131.518.79.0 | 4.110.725.632.926.3 | 4.513.932.927.621.0 |
| Activities of Daily Living (ADLs) 0 1-2 3-4 5-6 | 71.118.76.14.2 | 55.727.311.85.2 | 49.629.712.58.2 |
| Instrumental ADL 0 1-2 3-5 | 81.513.25.3 | 63.326.610.1 | 65.723.610.8 |
| Self-Reported Chronic Conditions Mental disorder Alzheimer's Arthritis Hypertension Heart condition Chronic lung disease Cancer Diabetes Stroke Osteoporosis | 8.12.658.354.240.515.429.916.310.812.9 | 36.31.352.046.034.623.819.519.012.19.8 | 11.03.073.965.361.327.834.527.721.815.4 |
| Number of Chronic Conditions None of the above Only one Two Three Four Five or more | 9.419.124.821.414.810.5 | 9.122.322.817.514.314.1 | 3.37.717.922.124.824.3 |
| SOURCE: Medicare Current Beneficiary Survey, 1998 | |||
| TABLE 2. Status of Prescription Drug Coverage of Community-Dwelling Disabled and Aged Medicare Beneficiaries, 1995-1998 | |||
| Prescription Coverage Statusa | All Beneficiaries | Disabled Beneficiaries | |
| Age 65 | Age 65 or Older | ||
| 1995 | |||
| No CoveragePart-Year Coverage Full-Year Coverage | 31.1%17.951.0 | 28.9%17.353.9 | 27.2%20.951.9 |
| 1996 | |||
| No CoveragePart-Year CoverageFull-Year Coverage | 28.418.952.7 | 26.817.855.4 | 22.323.454.3 |
| 1997 | |||
| No CoveragePart-Year CoverageFull-Year Coverage | 25.419.455.2 | 22.419.358.3 | 20.923.755.4 |
| 1998 | |||
| No CoveragePart-Year CoverageFull-Year Coverage | 24.017.758.3 | 22.418.858.8 | 19.420.560.1 |
| |||
| TABLE 3. Sources of Prescription Drug Coverage of Community-Dwelling Disabled and Aged Medicare Beneficiaries with Prescription Coverage, 1995-1998 | |||
| Source of Prescription Coverage | All Beneficiaries | Disabled Beneficiaries | |
| Age 65 | Age 65 or Older | ||
| 1995 | |||
| Employer-SponsoredPrivate Self-PurchasedMedicare HMOMedicaidOther PublicSome Coverage but not Reported No Coverage | 30.8%10.99.012.46.75.331.1 | 20.2%3.93.535.18.17.328.9 | 26.3%6.47.819.910.29.227.2 |
| 1996 | |||
| Employer-SponsoredPrivate Self-PurchasedMedicare HMOMedicaidOther PublicSome Coverage but not ReportedNo Coverage | 32.311.710.711.66.26.528.4 | 22.44.04.333.97.27.726.8 | 27.18.610.219.710.311.022.3 |
| 1997 | |||
| Employer-SponsoredPrivate Self-PurchasedMedicare HMOMedicaidOther PublicSome Coverage but not ReportedNo Coverage | 31.911.613.712.06.37.825.4 | 23.03.86.432.78.412.522.4 | 23.610.813.922.19.49.120.9 |
| 1998 | |||
| Employer-SponsoredPrivate Self-PurchasedMedicare HMOMedicaidOther PublicSome Coverage but not ReportedNo Coverage | 32.510.616.111.56.57.224.0 | 25.03.88.830.68.510.422.4 | 23.610.817.120.810.99.319.4 |
| SOURCE: Medicare Current Beneficiary Survey, 1995-1998 | |||
| TABLE 4. Mean Annual Prescription Drug Expenditures for Community-Dwelling Disabled and Aged Medicare Beneficiaries by Status and Source of Coverage, 1995-1998 | |||
| Status and Source ofPrescription Coverage Statusa | All Beneficiaries | Disabled Beneficiaries | |
| Age 65 | Age 65 or Older | ||
| 1995 | |||
| No CoveragePart-Year CoverageFull-Year CoverageEmployer-SponsoredPrivate Self-PurchasedMedicare HMOMedicaidOther PublicSome Coverage but not Reported ALL | $436524755726583491717807603587 | $5248511,1321,494910711760919824829 | $5686101,0819849859118841,013648812 |
| 1996 | |||
| No CoveragePart-Year CoverageFull-Year CoverageEmployer-SponsoredPrivate Self-PurchasedMedicare HMOMedicaidOther PublicSome Coverage but not ReportedALL | 468623827786668544631893744657 | 5169801,3401,5261,1171,0921,0661,5111,097992 | 6219231,1401,1651,0289341,0431,023942930 |
| 1997 | |||
| No CoveragePart-Year CoverageFull-Year CoverageEmployer-SponsoredPrivate Self-PurchasedMedicare HMOMedicaidOther PublicSome Coverage but not ReportedALL | 535672883858751601889962710720 | 4689161,3291,3691,4191,1171,0571,471736964 | 7098021,2111,2989898811,0971,189713978 |
| 1998 | |||
| No CoveragePart-Year CoverageFull-Year CoverageEmployer-SponsoredPrivate Self-PurchasedMedicare HMOMedicaidOther PublicSome Coverage but not ReportedALL | 5207531,0421,0368806881,1581,161936854 | 4861,2781,5901,5661,3541,2471,4031,6291,1771,203 | 7161,0731,6401,9601,3731,0031,4781,4111,3601,299 |
| |||
| TABLE 5. Mean Annual Number of Prescriptions Filled for Community-Dwelling Disabled and Aged Medicare Beneficiaries by Status and Source of Coverage, 1995-1998 | |||
| Status and Source ofPrescription Coveragea | All Beneficiaries | Disabled Beneficiaries | |
| Age 65 | Age 65 or Older | ||
| 1995 | |||
| No CoveragePart-Year CoverageFull-Year CoverageEmployer-SponsoredPrivate Self-PurchasedMedicare HMOMedicaidOther PublicSome Coverage but not Reported ALL | 15.918.521.718.817.416.625.525.422.318.5 | 18.628.531.935.822.724.125.829.728.025.1 | 23.025.434.729.532.529.933.032.629.128.5 |
| 1996 | |||
| No CoveragePart-Year CoverageFull-Year CoverageEmployer-SponsoredPrivate Self-PurchasedMedicare HMOMedicaidOther PublicSome Coverage but not ReportedALL | 16.720.622.318.718.716.828.126.625.519.5 | 17.829.635.031.131.526.131.243.033.427.4 | 24.834.936.431.635.331.340.334.336.931.9 |
| 1997 | |||
| No CoveragePart-Year CoverageFull-Year CoverageEmployer-SponsoredPrivate Self-PurchasedMedicare HMOMedicaidOther PublicSome Coverage but not ReportedALL | 17.321.823.820.220.519.829.327.924.720.9 | 16.127.834.230.928.931.630.236.526.026.7 | 27.129.136.632.230.430.839.835.031.532.0 |
| 1998 | |||
| No CoveragePart-Year CoverageFull-Year CoverageEmployer-SponsoredPrivate Self-PurchasedMedicare HMOMedicaidOther PublicSome Coverage but not ReportedALL | 16.421.525.222.323.021.731.129.425.622.3 | 17.030.935.531.532.035.533.236.028.928.9 | 27.030.240.240.834.334.340.237.334.034.6 |
| |||
| TABLE 6. Mean Annual Out-of-Pocket Prescription Drug Spending of Community-Dwelling Disabled and Aged Medicare Beneficiaries by Status and Source of Coverage, 1995-1998 | |||
| Status and Source ofPrescription Coverage Statusa | All Beneficiaries | Disabled Beneficiaries | |
| Age 65 | Age 65 or Older | ||
| 1995 | |||
| No CoveragePart-Year CoverageFull-Year CoverageEmployer-SponsoredPrivate Self-PurchasedMedicare HMOMedicaidOther PublicSome Coverage but not Reported ALL | $434314222224347189133273330290 | $521390247433389239117290317320 | $568344275301575295162266302356 |
| 1996 | |||
| No CoveragePart-Year CoverageFull-Year CoverageEmployer-SponsoredPrivate Self-PurchasedMedicare HMOMedicaidOther PublicSome Coverage but not ReportedALL | 468357219213388167146297388302 | 516451254385516272169507404341 | 622436279321575320143363337378 |
| 1997 | |||
| No CoveragePart-Year CoverageFull-Year CoverageEmployer-SponsoredPrivate Self-PurchasedMedicare HMOMedicaidOther PublicSome Coverage but not ReportedALL | 535389241243423200151333388332 | 467429275366438376160420330327 | 709444313348538325200427364416 |
| 1998 | |||
| No CoveragePart-Year CoverageFull-Year CoverageEmployer-SponsoredPrivate Self-PurchasedMedicare HMOMedicaidOther PublicSome Coverage but not ReportedALL | 519392281275511270179408398362 | 486492316375601464190484365365 | 715491426533731445216443439480 |
| |||
| TABLE 7. Percent of Annual Prescription Drug Expenditures of Community-Dwelling Disabled and Aged Medicare Beneficiaries Paid by Third Parties by Status and Source of Coverage, 1995-1998 | |||
| Status and Source ofPrescription Coverage Statusa | All Beneficiaries | Disabled Beneficiaries | |
| Age 65 | Age 65 or Older | ||
| 1995 | |||
| No CoveragePart-Year CoverageFull-Year CoverageEmployer-SponsoredPrivate Self-PurchasedMedicare HMOMedicaidOther PublicSome Coverage but not Reported ALL | 0%40.170.669.240.461.681.566.145.250.5 | 0%54.278.271.057.366.484.668.461.661.4 | 0%43.574.569.441.667.681.673.753.456.2 |
| 1996 | |||
| No CoveragePart-Year CoverageFull-Year CoverageEmployer-SponsoredPrivate Self-PurchasedMedicare HMOMedicaidOther PublicSome Coverage but not ReportedALL | 042.673.672.941.969.382.966.747.954.0 | 054.081.074.853.875.184.166.463.265.7 | 052.875.572.444.165.786.364.564.259.4 |
| 1997 | |||
| No CoveragePart-Year CoverageFull-Year CoverageEmployer-SponsoredPrivate Self-PurchasedMedicare HMOMedicaidOther PublicSome Coverage but not ReportedALL | 042.172.771.743.666.783.065.445.453.9 | 053.279.373.269.166.484.871.455.166.1 | 044.674.173.245.663.181.864.148.957.5 |
| 1998 | |||
| No CoveragePart-Year CoverageFull-Year CoverageEmployer-SponsoredPrivate Self-PurchasedMedicare HMOMedicaidOther PublicSome Coverage but not ReportedALL | 048.073.173.541.960.884.564.557.457.6 | 061.480.176.155.662.886.570.369.169.7 | 054.374.072.846.855.785.368.667.863.0 |
| |||
| TABLE 8. Ratio of Total Prescription Drug Spending to Income of Community-Dwelling Disabled and Aged Medicare Beneficiaries, 1995-1998 | |||
| Prescription Drug Expenditures as a Percent of Income | All Beneficiaries | Disabled Beneficiaries | |
| Age 65 | Age 65 or Older | ||
| 1995 | |||
| No Prescription Expenditures0-5% of Income5-10% of IncomeGreater than 10% of Income | 13.651.116.418.9 | 15.739.615.329.3 | 8.237.321.732.8 |
| 1996 | |||
| No Prescription Expenditures0-5% of Income5-10% of IncomeGreater than 10% of Income | 13.449.216.920.5 | 14.434.815.335.5 | 8.234.221.636.1 |
| 1997 | |||
| No Prescription Expenditures0-5% of Income5-10% of IncomeGreater than 10% of Income | 12.248.418.021.4 | 11.835.617.135.6 | 6.832.823.736.8 |
| 1998 | |||
| No Prescription Expenditures0-5% of Income5-10% of IncomeGreater than 10% of Income | 11.246.218.524.2 | 10.232.819.038.0 | 5.032.519.742.8 |
| TABLE 9. Ratio of Out-of-Pocket Drug Spending to Income of Community-Dwelling Disabled and Aged Medicare Beneficiaries, 1995-1998 | |||
| Prescription Drug Expenditures as a Percent of Income | All Beneficiaries | Disabled Beneficiaries | |
| Age 65 | Age 65 or Older | ||
| 1995 | |||
| No Prescription Expenditures0-5% of Income5-10% of IncomeGreater than 10% of Income | 16.565.610.27.8 | 23.155.811.39.9 | 12.261.114.012.7 |
| 1996 | |||
| No Prescription Expenditures0-5% of Income5-10% of IncomeGreater than 10% of Income | 16.165.810.37.7 | 21.056.010.812.3 | 12.160.016.811.2 |
| 1997 | |||
| No Prescription Expenditures0-5% of Income5-10% of IncomeGreater than 10% of Income | 14.966.710.57.9 | 19.257.612.610.7 | 10.961.315.212.5 |
| 1998 | |||
| No Prescription Expenditures0-5% of Income5-10% of IncomeGreater than 10% of Income | 13.666.711.08.7 | 17.658.812.910.6 | 7.860.814.517.0 |
PRESCRIPTION DRUGS AND PEOPLE WITH DISABILITIES: A PRIMER FOR DATA AND RESEARCH REPORTS AVAILABLE
Medication Use by Medicare Beneficiaries Living in Nursing Homes and Assisted Living Facilities
HTML http://aspe.hhs.gov/daltcp/reports/2002/meduse.htm
PDF http://aspe.hhs.gov/daltcp/reports/2002/meduse.pdf
Medication Use in Long-Term Care Facilities and Community Settings for Medicare Beneficiaries with Cardiovascular Disease
Full HTML Version http://aspe.hhs.gov/daltcp/reports/2002/cdmeduse.htm
Full PDF Version http://aspe.hhs.gov/daltcp/reports/2002/cdmeduse.pdf
The Graying of Medicare's Disabled Population: Implication for a Medicare Drug Benefit
Executive Summary http://aspe.hhs.gov/daltcp/reports/2002/grayinges.htm
HTML http://aspe.hhs.gov/daltcp/reports/2002/graying.htm
PDF http://aspe.hhs.gov/daltcp/reports/2002/graying.pdf
To obtain a printed copy of this report, send the full report title and your mailing information to:
U.S. Department of Health and Human ServicesOffice of Disability, Aging and Long-Term Care PolicyRoom 424E, H.H. Humphrey Building200 Independence Avenue, S.W.Washington, D.C. 20201FAX: 202-401-7733Email: webmaster.DALTCP@hhs.gov
RETURN TO:
Office of Disability, Aging and Long-Term Care Policy (DALTCP) Home [http://aspe.hhs.gov/_/office_specific/daltcp.cfm]Assistant Secretary for Planning and Evaluation (ASPE) Home [http://aspe.hhs.gov]U.S. Department of Health and Human Services Home [http://www.hhs.gov]