
Ellen Bouchery, Rebecca Morris, and Jasmine Little
Mathematica Policy Research
ABSTRACT: Although trends in substance use disorder (SUD) prevalence and treatment receipt have been relatively constant for the last decade, the Affordable Care Act (ACA) could result in a substantial increase in the number of individuals seeking or referred to treatment. The impact of parity legislation, changing perspectives about the importance of SUDs as a health condition, the opioid epidemic, and activities associated with care integration could result in additional increases in demand. In contrast the SUD treatment workforce is already challenged to meet the existing demand for treatment. A significant number of facilities reported operating at or above capacity. Low wages make hiring and retaining qualified staff a challenge. A review of the services provided to clients indicated that current practice was often inconsistent with the scientific findings on evidence-based treatment. Credentialing experts and clinical directors expressed concern about training adequacy, and the best available information suggests, at most, a small increase in training program output in recent years. Thus, overall, the SUD treatment workforce appears to lack sufficient capacity to adequately address the possible short-run increases in demand.
DISCLAIMER: The opinions and views expressed in this report are those of the authors. They do not necessarily reflect the views of the Department of Health and Human Services, the contractor or any other funding organization.
"Acronyms
The following acronyms are mentioned in this report and/or appendices.
| ACA | Affordable Care Act |
|---|---|
| ADSS | Alcohol and Drug Services Study |
| AIDS | Acquired Immune Deficiency Syndrome |
| ASPE | HHS Office of the Assistant Secretary for Planning and Evaluation |
| ATTC | Addiction Technology and Transfer Center |
| BLS | Bureau of Labor Statistics |
| CASA | National Center on Addiction and Substance Abuse, Columbia University |
| CBO | Congressional Budget Office |
| CDC | HHS Centers for Disease Control and Prevention |
| CHIP | Children's Health Insurance Program |
| CINAHL | Cumulative Index to Nursing and Allied Health Literature |
| CMS | HHS Centers for Medicare and Medicaid Services |
| DSM-IV | Diagnostic and Statistical Manual of Mental Disorders, 4th Edition |
| ER | Emergency Room |
| FEHB | Federal Employees Health Benefit |
| FPL | Federal Poverty Level |
| FY | Fiscal Year |
| GED | General Equivalency Diploma |
| HCUP-NIS | Healthcare Cost and Utilization Project--National Inpatient Sample |
| HHS | U.S. Department of Health and Human Services |
| HIV | Human Immunodeficiency Virus |
| IC&RC | International Certification and Reciprocity Consortium |
| IOM | Institute of Medicine |
| ISS | Information Services Survey |
| JCT | Joint Committee on Taxation |
| LSD | Lysergic Acid Diethylamide |
| MAT | Medication-Assisted Treatment |
| MEPS | Medical Expenditure Panel Survey |
| MHPAEA | Mental Health Parity and Addiction Equity Act |
| N-SSATS | National Survey of Substance Abuse Treatment Services |
| NAADAC | National Association for Alcoholism and Drug Abuse Counselors |
| NAMCS | National Ambulatory Medical Care Survey |
| NASADAD | National Association of State Alcohol and Drug Abuse Directors |
| NHAMCS | National Hospital Ambulatory Medical Care Survey |
| NHSDA | National Household Survey on Drug Abuse |
| NPI | National Provider Identifier |
| NSDUH | National Survey of Drug Use and Health |
| OES | Occupational Employment Statistics |
| ONDCP | U.S. Office of National Drug Control Policy |
| OTP | Opioid Treatment Program |
| PCP | Phencyclidine |
| SAMHSA | HHS Substance Abuse and Mental Health Services Administration |
| SATBG | Substance Abuse Treatment Block Grant |
| SBIRT | Screening, Brief Intervention, and Referral to Treatment |
| SOC | Standard Occupational Classification |
| SSA | Single State Agency |
| SUD | Substance Use Disorder |
| TEDS | Treatment Episodes Dataset |
| UFDS | Uniform Facility Dataset |
Executive Summary
Expansion of insurance coverage for substance use disorders (SUDs) under the Affordable Care Act (ACA) and Mental Health Parity and Addiction Equity Act (MHPAEA) may offer opportunity to improve access to care and reduce the societal costs related to SUDs. However, policymakers and providers are concerned that the current SUD treatment system does not have the capacity to adequately meet the potential increase in demand.
In September 2014, the Office of the Assistant Secretary for Planning and Evaluation, U.S. Department of Health and Human Services (HHS), contracted with Mathematica Policy Research to conduct this project to assess: (1) current demand for SUD treatment; (2) how demand will change as more people obtain SUD treatment coverage; (3) the current state of provider capacity in the SUD treatment field; and (4) the degree to which SUD treatment providers are prepared to be more integrated with the broader health care system. This report summarizes the findings from the first phase of this study, which encompassed interviews with experts from two provider credentialing organizations and a national provider organization representative as well as a review of the available literature and data on SUD prevalence, treatment, and workforce capacity.
Current Demand for Substance Use Disorders Treatment
Demand for SUD treatment is defined by the rate of SUDs in the population and the extent to which those with an SUD seek treatment. The prevalence rate for SUDs is slightly lower in recent years relative to earlier in the last decade. This decline occurred for both illicit drug and alcohol disorders. Based on HHS Substance Abuse and Mental Health Services Administration (SAMHSA) analysis (SAMHSA 2015a) of the National Survey of Drug Use and Health (NSDUH), the proportion of individuals 12 years and older who met diagnostic criteria for an SUD1 in the past year (Figure ES.1) remained relatively constant from 2002-2010 (ranging from 8.8 percent to 9.4 percent), and then decreased in 2011 through 2013 (ranging from 8.0 percent to 8.5 percent). Although there was a slight decline in the current prevalence of SUDs between 2002-2010 and 2011-2013, accounting for population growth, the actual number of individuals meeting criteria for an SUD in the past 12 months was unchanged (Figure ES.2).
| FIGURE ES.1. Proportion of Individuals Age 12 and Older with Abuse of or Dependence on Alcohol or Illicit Drugs in the Past Year, NSDUH 2002-2013 |
|---|
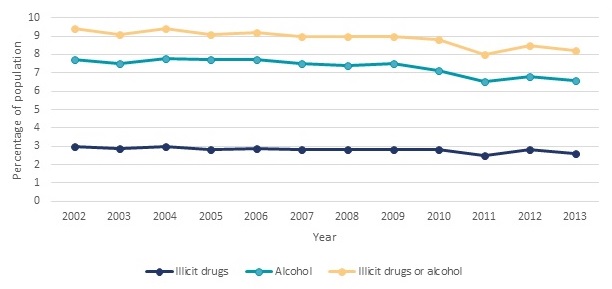 |
| SOURCE: Estimates obtained from SAMHSA 2015a, Table 7.40B. |
Trends for some specific substances differed from the overall trends for SUDs over the last decade. The number of individuals with cocaine-related disorders decreased from 1.5 million to 1.7 million from 2002-2007 to 0.9 million in 2014. In contrast, the number of individuals with heroin-related disorders increased from a level of 189,000-324,000 from 2002-2008 to 586,000 individuals in 2014. The number of individuals with disorders related to pain relievers ranged from 1.4 million to 1.5 million between 2002-2005. This increased to 1.9 million by 2014 (SAMHSA 2015e).
| FIGURE ES.2. Number of Individuals Age 12 and Older with Abuse of or Dependence on Alcohol or Illicit Drugs in the Past Year, NSDUH 2002-2013 |
|---|
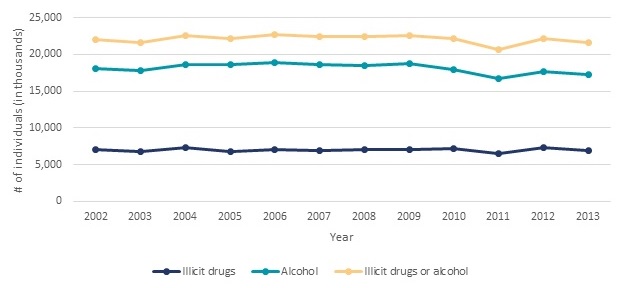 |
| SOURCE: Estimates obtained from SAMHSA 2015a, Table 7.40A. |
In parallel with trends in the overall number of individuals with SUDs, according to the NSDUH survey the number of individuals receiving any SUD treatment in the past year remained constant between 2004 and 2014 at about 4 million individuals, or 18 percent (Figure ES.3).2 About 60 percent of these individuals (2.3-2.6 million individuals per year) or 11 percent received treatment in a specialty setting defined as any of the following types of facilities: hospitals (inpatient only), drug or alcohol rehabilitation facilities (inpatient or outpatient), or mental health centers.3 Similar to the NSDUH, the National Survey of Substance Abuse Treatment Services (N-SSATS) collects information on the number of individuals in care at specialty SUD treatment facilities. However, the NSDUH measures the number of individuals with any receipt of treatment in the past year, while the N-SSATS measures the number of clients in treatment on a single day in each year (the last working day in March of each survey year). From 2004-2007, there were about 1.1 million clients in treatment at the time of the N-SSATS survey (Figure ES.3). This rose to 1.2 million from 2008-2013.
| FIGURE ES.3. Number of Individuals Receiving Treatment, 2004-2014 |
|---|
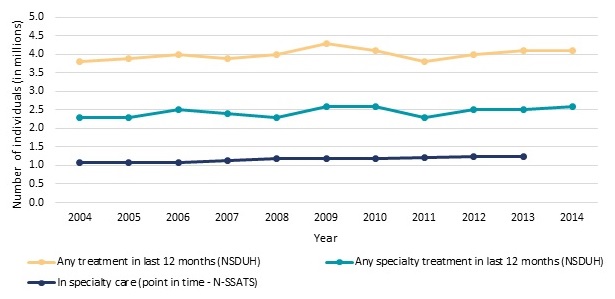 |
| SOURCE: Estimates for N-SSATS 2005, 2007, 2009, 2011, and 2013 were obtained from SAMHSA 2014a, Table 3.2; Estimates for N-SSATS 2008, 2010, and 2012 were obtained from SAMHSA 2013a, Table 3.2; Estimates for N-SSATS 2002, 2004, and 2006 were obtained from SAMHSA 2007, Table 3.2a. NSDUH estimates for 2004-2014 were obtained from SAMHSA 2005, SAMHSA 2006b, SAMHSA 2007b, SAMHSA 2008, SAMHSA 2009, SAMHSA 2010, SAMHSA 2011a, SAMHSA 2012a, SAMHSA 2013b, SAMHSA 2014b, SAMHSA 2015e, respectively. NOTE: In the NSDUH survey specialty treatment is defined as treatment received at hospitals (inpatient only), drug or alcohol rehabilitation facilities (inpatient or outpatient), or mental health centers. In this report we refer to all clients receiving treatment at facilities responding to N-SSATS as receiving specialty treatment. N-SSATS is a census of all known, public and private, facilities with substance abuse treatment programs. It excludes those programs located in jails or prisons, serving only incarcerated clients, and solo practitioners (unless a state substance abuse agency specifically requests to include them). N-SSATS 2014 did not collect data on clients in treatment. |
There is a substantial gap between the number of people with an SUD and the number of individuals who receive any treatment in a given year (SAMHSA 2014b). In 2013, an estimated 22.7 million United States residents had an SUD in the past year (21.6 million) or received specialty treatment for an SUD in the past year although did not meet criteria for a current disorder (1.1 million). Only 18 percent (4.1 million) of these individuals received any treatment including self-help or emergency care and only 11 percent (2.5 million) received treatment at a specialty facility (Figure ES.3). According to a review by Foster (2014), this rate of treatment receipt is substantially lower than that for common health conditions such as hypertension (77 percent), diabetes (73 percent) and major depression (71 percent). However, some researchers have noted that standard diagnostic criteria for SUDs may inflate estimates of treatment need and thereby estimates of unmet need. They have proposed alternative concepts which narrow the definition of need. For example, Wakefield and Schmitz (2015) have proposed narrowing the diagnostic criteria for SUDs to require dysfunction and harm (Wakefield and Schmitz 2015). Others have suggested treatment need may be defined in relationship to the individual's own perception of need or based on a disability associated with the SUD (Mechanic 2003).
In fact, according to SAMHSA analysis of response to the NSDUH for 2013 (SAMHSA 2014b), 95.5 percent of individuals who met the criteria for an SUD, but who did not receive specialty treatment, did not believe they needed treatment. The remaining 4.5 percent who felt they needed treatment may provide a better estimate of unmet demand and of the set of individuals who might be responsive to increased coverage for SUDs available under the ACA. To obtain specialty SUD treatment for all the individuals in this population who felt they needed, but who did not receive treatment (Figure ES.4), the number of individuals receiving specialty treatment per year would need to rise from 2.5 million to 3.4 million (a 36 percent increase). SAMHSA analysis (2014b) further divided this set of individuals who felt they needed treatment, but did not receive treatment into two groups: (1) those who reported making an effort to receive treatment (34.8 percent or 316,000 persons in 2013); and (2) those who reported making no effort to obtain treatment (65.2 percent or 592,000 persons in 2013).
Those who reported seeking treatment but who failed to receive it reported many obstacles to obtaining care (multiple obstacles could be reported by the same respondent):
- 37.3 percent reported having no health coverage and could not afford cost of treatment.
- 24.5 percent reported not being ready to stop using drugs or alcohol.
- 9.0 percent did not know where to go for treatment.
- 8.2 percent had health coverage but it did not cover treatment or did not cover cost.
- 8.0 percent reported it was inconvenient or they lacked transportation.
| FIGURE ES.4. Number of Individuals Who Received Specialty Treatment or Who Felt They Needed It but did not Receive Treatment, NSDUH 2004-2013 |
|---|
 |
| SOURCE: NSDUH estimates for 2004-2013 were obtained from SAMHSA 2005, SAMHSA 2006, SAMHSA 2007b, SAMHSA 2008, SAMHSA 2009, SAMHSA 2010, SAMHSA 2011a, SAMHSA 2012a, SAMHSA 2013b, SAMHSA 2014b, respectively. NOTE: Treatment receipt is reported within the last 12 months. |
Individuals who did not seek treatment reported many of the same barriers (SAMHSA 2014b). Health insurance coverage expansion may address some of these reported obstacles, but other obstacles will remain.
Trends and Policies Affecting Future Demand for Care
Although trends in SUD prevalence and treatment receipt have been relatively constant for the last decade, we assessed the extent to which we expect a substantial shift in these trends between 2014 and 2020. Overall, the implementation of the ACA is likely to be the largest force increasing demand, but other factors may also contribute to demand increases. The factors that may influence demand include the following:
Affordable Care Act. The ACA is expected to affect demand for SUD treatment through a number of mechanisms: (1) reducing in the number of uninsured; (2) enhancing SUD treatment coverage for insured individuals; (3) promoting integration of primary care and behavioral health care; (4) changing Medicaid coverage of SUD treatment services; and (5) changing perceptions about SUD treatment.
Projections from the Congressional Budget Office (CBO 2014) indicate 26 million individuals will gain insurance coverage as a result of the ACA by 2020. This includes an increase of 13 million individuals on Medicaid. Based on analysis of NSDUH 2008-2011 Mark et al. (2015a) estimate about 14 percent of the newly insured (3.6 million individuals) will have SUD treatment needs. Although many uninsured individuals (2 percent annually) received specialty treatment prior to ACA implementation, the rate of treatment receipt was higher (3 percent) among individuals who were Medicaid insured despite lower disorder prevalence (12 percent for Medicaid insured versus 14 percent uninsured). Thus, the rate of SUD treatment use might increase for individuals who transition from being uninsured to having Medicaid coverage. In contrast, evidence that transitioning from being uninsured to privately insured will increase SUD treatment use is limited. While the recent literature provides some evidence that inability to afford treatment is a barrier to treatment use, the available research indicates that people with treatment needs who lack insurance access SUD treatment at greater or the same rates as individuals who have private insurance (Wu and Ringwalt 2005; Schmidt and Weisner 2005; Mojtabai 2005; Bouchery et al. 2012). However, it should be noted that SUD treatment benefits provided through Medicaid expansion and marketplace plans may be more generous than traditional Medicaid or private insurance coverage represented in the literature reviewed for this study due to provisions of the ACA identifying SUD treatment as an essential benefit.
Mental Health Parity and Addictions Equity Act. Under the 2008 MHPAEA, large group employers who offer SUD treatment benefits could no longer offer more limited coverage for SUD treatment than for medical/surgical care. The MHPAEA identifies limitations on frequency of treatment, copayments, coinsurance, and deductibles as possible plan limitations that must be in parity (Frank et al. 2014). We reviewed the findings in the literature on implementation of state and federal parity provisions generally. The provisions of the initiatives reviewed varied. Providers may respond to parity requirements by implementing a care management program such as a capitated behavioral health program with a narrow network or a hospital diversion program. Such efforts may reduce expenditures for SUD treatment. Thus, the findings from identified studies were mixed. For example, one study found a decrease in SUD treatment use when care management approaches and parity were implemented simultaneously (Rosenbach et al. 2003). Another study found a 15 percent increase in treatment use when impacts focused on only facilities accepting private insurance (Wen et al. 2013).
Changing Care Norms. Thought leaders in the SUD treatment field identified increased recognition of SUDs as a valid health condition as a key trend likely to affect the field over the next five years (Ryan et al. 2012). Potential changes in perceptions of the acceptability of SUD treatment and integration of SUD treatment into mental health and primary care settings have the potential to influence trends in demand. However, historically, only 6 percent of referrals to SUD treatment come from the general medical sector (CASA 2012) and implementing care integration and new models of care, including Screening, Brief Intervention, and Referral to Treatment requires substantial upfront investments. Thus, the influence of changing attitudes and new approaches to care could be slow to impact the actual number of people seeking or referred to services.
Opioid Use Epidemic. Over the last decade there have been significant increases in disorders associated with pain relievers and heroin. The number of individuals using treatment for these disorders increased in parallel. Health professionals and federal, state, and local officials are developing and implementing initiatives targeted at reducing opioid use, abuse, overdose and related-deaths, including a Department of Health and Human Services (HHS) Opioid Initiative (HHS 2015e). There is some evidence that these efforts are working, as there have been increases in the supply of physicians waivered to prescribe buprenorphine for opioid dependence, particularly in states that expanded Medicaid (Knudsen, Lofwall, Havens and Walsh 2015), as well as numbers of individuals receiving buprenorphine treatment (SAMHSA 2014a). This early evidence suggests that the upward trend in demand for opioid disorder treatment is likely to continue through 2020.
Trends in Government Spending. The Federal Government will increase spending on SUD treatment in association with ACA coverage expansions. In other areas of of SUD treatment and activities to reduce use, the Federal Government through the HHS Opioid Initiative is working to increase funding to expand access to medication-assisted treatment (MAT) for opioid use disorders. . Substance Abuse Treatment Block Grant spending will remain constant and the additional targeted investments in SUD treatment programs identified in this study are small relative to overall SUD treatment spending nationally. Data on state and local SUD treatment expenditures are not systematically collected. Estimates from the SAMHSA Spending Estimates Initiative, the most recent observed estimates of state and local spending, indicate that state and local spending as a share of all SUD treatment spending nationally declined from 34 percent in 2004 to 31 percent in 2009 (SAMHSA 2013c). State Medicaid programs have the potential to play an important role in transforming the SUD treatment system and the HHS Centers for Medicare and Medicaid Services (CMS) is taking an active role encouraging states to make reforms. However, this transformation will not be immediate.
Current Supply of Substance Use Disorders Providers
There are no current data available on the size of the SUD workforce. Data on specialty SUD treatment facility staffing will be collected as part of the 2016 N-SSATS survey and analyzed in the second phase of the current study in late 2017. The most recent reliable data on the size of the SUD workforce are almost 20 years old. These data were collected as part of the Alcohol and Drug Services Study in 1996. These data indicate about 88,000 counselors, almost 50,000 medical professionals, and 65,000 other staff, for a total of about 200,000 staff members, comprised the workforce at the time of the study (SAMHSA 2003).
Our review of the available evidence on the capacity of the SUD workforce prior to ACA implementation suggests that the SUD treatment workforce was strained to effectively meet the existing level of treatment demand. A significant number of facilities reported operating at or above capacity (SAMHSA 2014a). Low wages made hiring and retaining qualified staff a challenge, and clinical directors and representatives of certification organizations expressed concerns about adequacy of training (Ryan et al. 2012). Also, a review of the services provided to clients indicated that current practice was often inconsistent with the scientific findings on evidence-based treatment (National Center on Addiction and Substance Abuse at Columbia University [CASA] 2012). Finally, many facilities may not accept or be included in the insurance networks associated with coverage obtained under the ACA.
Trends and Policies Affecting the Future Supply of Substance Use Disorders Providers
The Bureau of Labor Statistics (BLS), which develops employment statistics that include projections for employment by occupation, provides no specific category just for SUD treatment professionals. However, two categories encompass a substantial proportion of the SUD treatment workforce: (1) substance abuse and behavioral disorder counselors; and (2) mental health and substance abuse social workers. The share of these categories represented by SUD treatment versus mental health professionals is unknown. BLS projects employment in these categories to grow at a faster rate than the average for all occupations (BLS 2015a, 2015b) because addiction and mental health counseling services will be increasingly covered by insurance policies, and health insurance coverage expansion will increase demand for health care services in general (BLS 2015a). BLS also notes that drug offenders are increasingly being sent to treatment rather than jail, thereby increasing treatment program use (BLS 2015a, 2015b).
These BLS projected growth rates diverge from past employment trends in these occupations. Nationally, employment of substance abuse and behavioral disorder counselors declined 3 percent between 2008 and 2011. However, in the most recent two years observed, 2011-2013, employment growth ranged from 4 percent to 5 percent per year. Likewise, employment of mental health and substance abuse social workers declined 16 percent between 2008 and 2012. Then, between 2012 and 2013, employment of these professionals grew by 1 percent (BLS 2015c).
Overall the evidence for assessing change in the size of the SUD workforce is limited, but it suggests, at most, a small increase in the workforce in the last few years. If substantial additional funding becomes available through ACA insurance coverage or other federal or state sources, facilities may seek to expand hiring; however the existing level of training program output is unlikely to meet demand, and clinical directors already report having difficulty hiring candidates with appropriate training and experience (Ryan et al. 2012).
Comparison of Trends in Demand and Supply
Although trends in SUD prevalence and treatment receipt have been relatively constant for the last decade, the ACA could result in a substantial increase in the number of SUD treatment users. Additional increases related to the impact of MHPAEA, changing perspectives about the importance of SUDs as a health condition, the opioid epidemic, and activities associated with care integration could further increase demand.
In contrast, on the supply side, we find a workforce that is challenged to meet the existing demand prior to ACA implementation. Although there is no available data on trends in training program output, our interviews with experts suggest, at most, a small increase in training programs in recent years. Meanwhile, credentialing experts and clinical directors (Ryan et al. 2012) expressed concern about training adequacy, specifically noting that more highly educated workers, most of whom graduate from programs that are not specifically focused on addiction, may not have necessary addiction-specific training and experience. Overall, the best available evidence suggests that the supply side does not have sufficient capacity to address a potential short-run increase in demand.
Gaps in Current Knowledge
Overall, the literature available to assess whether the treatment system has the capacity to meet changes in demand associated with increased insurance coverage is quite limited:
-
Current Demand for SUD Treatment Services. The methods used in the literature on barriers to treatment and the relationship between insurance coverage and treatment do not provide sufficient information to assess how treatment use will change when insurance coverage is provided or other barriers to treatment are removed.
-
Trends and Policies Impacting Demand Over the Next Decade. The literature on how recent changes may impact demand is limited by lack of information on how individuals will respond to the policy changes and trends.
-
Previous Efforts to Estimate the Size and Composition of the Workforce. The most recent data on the size and professional composition of the workforce is from the late 1990s. Thus, these data do not address recent trends in staffing. These data are also at the national level and do not allow for detailed analysis of factors that may influence staffing patterns.
-
Recruiting and Developing the Workforce. There is limited information about the pipeline for SUD treatment professionals. Although there is much concern from experts in the field about inadequate training, there is limited information on training program content and typical career paths. Although the literature includes many suggested approaches for increasing the supply of SUD professionals, there was no information documenting the potential impact of implementing the suggested strategies.
I. Introduction
A. Purpose of This Report
Expansion of insurance coverage for substance use disorders (SUDs) under the Affordable Care Act (ACA) and Mental Health Parity and Addiction Equity Act (MHPAEA) may offer opportunity to improve access to care and reduce the societal costs related to SUDs. Projections from the Congressional Budget Office (CBO 2014) indicate the ACA will result in substantial increases in the number of individuals with insurance coverage obtained through the marketplaces or Medicaid through 2020. In addition, the U.S. Department of Health and Human Services (HHS) Substance Abuse and Mental Health Services Administration (SAMHSA 2013d) projects many of these individuals will have SUD treatment needs. CBO forecasts that 13 million people will obtain coverage though marketplaces in 2015, 24 million in 2016 when more substantial tax penalties are implemented, and 25 million in 2017-2024. SAMHSA estimates that approximately 15 percent of uninsured adults who would likely be eligible for subsidized coverage through the marketplaces meet the criteria for a SUD. Additionally, as a result of the ACA, CBO projects 11 million people will obtain Medicaid or Children's Health Insurance Program (CHIP) in 2015, 12 million in 2016 and 2017, and 13 million in 2018-2024. SAMHSA forecasts that roughly 14 percent of uninsured adults who meet eligibility for expanded Medicaid coverage meet the criteria an SUD. Federal officials are concerned that the existing SUD treatment system will not be able to meet the increased demand for treatment, because the existing workforce is insufficient.
To address this concern, in September 2014, the HHS Office of the Assistant Secretary for Planning and Evaluation (ASPE) contracted with Mathematica Policy Research to conduct this project to assess: (1) current demand for SUD treatment; (2) how demand will change as more people obtain SUD treatment coverage; (3) the current state of provider capacity in the SUD treatment field; and (4) the degree to which SUD treatment providers are prepared to be more integrated with the broader health care system. This report summarizes the findings from the first phase of this study which encompassed interviews with experts from two provider credentialing organizations and a national provider organization representative, as well as a review of the available literature and data on SUD prevalence, treatment, and workforce capacity. The second phase of this study entails collection and analysis of survey data on the size and characteristics of the workforce. We expect to complete the second phase of this study in February 2018.
B. Methods
This report summarizes the findings from interviews conducted with experts and a review of the available literature and data analysis on SUD treatment demand and workforce capacity. We discuss the specific methods for these tasks here.
1. Review of Available Literature and Data Analysis
The first step in the literature review was to identify search criteria to address the four topic areas identified for this study:
-
Current demand for SUD treatment services.
-
Trends and policies impacting demand over the next decade.
-
Previous efforts to estimate the size and composition of the SUD workforce.
-
Recruiting and developing the workforce.
We defined a set of key words addressing these topic areas. Then, we conducted a search of articles indexed in CINAHL, PsycINFO, Scopus, and PubMed from 2005 through November 2014. This search generated a list of potential sources. We also conducted a Google search to identify important studies in the gray literature. We reviewed the publication information and abstracts for potential sources for relevance and strength of analysis. Then, we obtained and reviewed the studies most likely to provide evidence related to the four topic areas of interest. We drew out relevant information from each study and discussed the findings under the appropriate topic areas in this report.
2. Review of Available Data Sources
In addition to reviewing the existing literature, we reviewed the data sources available to support analysis of supply and demand. We discuss the sources identified and their strengths and limitations here.
a. Data Sources for Demand
There is no single data source available to comprehensively estimate SUD treatment demand (Table I.1). The National Survey of Drug Use and Health (NSDUH) isan annual survey of the United States, civilian, non-institutionalized population age 12 and above.4 As a population survey it provides the most comprehensive information about the number of individuals who accessed any service in the past year and the characteristics of those individuals. However the NSDUH provides limited information on the type of services used and no information on the intensity of services used. The National Survey of Substance Abuse Treatment Services (N-SSATS) is a specialty treatment facility survey.5 N-SSATS provides point-in-time estimates of clients in care at specialty facilities by type of service received. Similar to the NSDUH the N-SSATS provides no information on the intensity of services provided to individual users of a given service type. N-SSATS also provides limited information on client characteristics. A strength of the N-SSATS is that it surveys the universe of SUD treatment facilities in the United States and thus provides sufficient data for state-level analysis. Overall we estimate N-SSATS represents more than 72 percent of SUD treatment spending nationally (Table I.1).
Information on services provided in a primary care setting or by independent practitioners is available through National Ambulatory Medical Care Survey (NAMCS) and Medical Expenditure Panel Survey (MEPS). However, in contrast to the NSDUH and N-SSATS these surveys were not specifically designed to capture SUD treatment trends. Therefore, SUD treatment services may be underreported and the sample of SUD treatment services available in the annual samples is limited. The NAMCS data is limited to physician and clinic services. The MEPS addresses physician and clinic services as well as services provided by counselors, nurse practitioners and physician assistants.
b. Data Sources for Supply
We were not able to identify a comprehensive source for estimating the supply of SUD treatment providers (Table I.2). SUD treatment is provided in a variety of treatment settings using the skills of professionals in multiple fields. No single available data source provides a comprehensive enumeration of all SUD treatment providers. The Standard Occupational Classification (SOC) system that is used by the Bureau of Labor Statistics (BLS) to categorize workers for the purpose of collecting and disseminating data on employment and wages does not capture SUD treatment providers as a category separate from other types of providers. For example, physicians and social workers working in the SUD treatment field might be categorized as psychiatrist and mental health and substance abuse social workers, respectively.
Data on the workforce collected through the N-SSATS 2016 survey will be the primary source of estimates of supply for this study. The workforce represented in the N-SSATS survey will include all workers in specialty SUD treatment facilities nationally which represent about three quarters of SUD treatment expenditures. Data from the N-SSATS workforce questions can provide estimates of the workforce by geographic area.
| TABLE I.1. Summary of Available Sources of Demand Data ('x' indicates the service type is represented in the indicated data source) |
||||||||
|---|---|---|---|---|---|---|---|---|
| Provider Type | % of SUD Treatment Spending 20091 | NAMCS | NHAMCS | HCUP-NIS | N-SSATS | MEPS | TEDS | NSDUH |
| Outpatient and residential treatment facilities | 46 | X | Limited2 | Limited3 | X | |||
| Hospital inpatient--specialty4 | 14 | X | X | X | Limited3 | X | ||
| Hospital outpatient-- specialty4 | 9 | X | X | X | Limited3 | X | ||
| Hospital residential-- specialty4 | 3 | X | Limited2 | Limited3 | X | |||
| Hospital inpatient-- non- specialty4 | 3 | X | X | X | ||||
| Hospital outpatient-- non- specialty4 | 5 | X | X | X | ||||
| Hospital residential-- non- specialty4 | <1 | Limited2 | X | |||||
| Independent counselor/ mid-level provider | 12 | Limited5 | Limited6 | X | X | |||
| Physician | 5 | X7 | Limited6 | X | X | |||
| Nursing home/home health | 3 | Limited8 | X | |||||
| Institutional criminal justice | NA | Limited3 | X9 | |||||
| Self-help group | NA | X | ||||||
| Measure of demand that can be derived from the indicated source | Number of office visits | Number of outpatient hospital or ER visits | Hospital stays | Point-in-time client count | Number of services and expenditures | Admissions to SUD treatment facilities | Persons accessing any treatment | |
NOTES:
NA = Not available. Expenditures for these services are not included in the SAMHSA spending estimates. |
||||||||
| TABLE I.2. Summary of Supply-Side Data Sources | ||
|---|---|---|
| Data Source | Ability to Identify SUD Treatment Providers | Key Consideration for Data Collection and Analysis |
| American Community Survey/OES | Categories not specific to SUD treatment providers | Data on employment is reported annually. |
| Certifying organizations (IC&RC and NAADAC) | Providers not certified by IC&RC and NAADAC would be excluded. Certification requirements vary by state. Medical staff and many support workers not included. | May require data collection from certification/licensing boards in 50 states. Data collection varies across boards. |
| Claims data | Providers serving non-Medicare/non-Medicaid populations are excluded from CMS administrative claims. Providers serving managed care enrollees are also often excluded from CMS administrative data. These populations excluded from CMS administrative data represent more than two-thirds of SUD treatment. Data from SDI Health representing privately insured patients is likely to exclude non-prescribers, such as counselors, and services provided under grant funding. | Substantial effort to evaluate completeness and process data. SDI Health data must be purchased. |
| NAMCS | Non-physician providers excluded. Physician weight can be used to identify count of physicians with specific characteristics. | Multiple years of data will need to be pooled to identify a sufficient sample of SUD treatment services. |
| National Plan and Provider Enumeration System | Only professionals with NPIs are included. Professionals are not required to obtain NPIs if they do not prescribe or bill electronically. Preliminary estimates suggest few SUD treatment professionals are identifiable based on the provider taxonomy classifications for addiction medicine. | A list of providers who self-identify in addiction specialties can be identified. However providers are likely to select more general specialty categories such as psychiatrist, internal medicine, or social worker rather than categories specific to addiction. |
| N-SSATS | Workforce questions not included on survey. Supplemental questions were added to 2016 survey for this project. Providers in non-specialty settings, facilities located in jails or prisons, facilities serving only incarcerated clients, and solo practitioners (unless specifically requested by the state) are excluded. | Represents majority of SUD treatment spending nationally. All providers in universe are surveyed. State-level analysis is feasible. Survey is at facility-level. |
| State licensure and certification data | Only state certified or licensed professionals included. Types of professionals that require certification and licensure will vary by state. Medical professionals and professionals working under supervision may be excluded. Sixteen percent of clinical directors are licensed in a field other than substance abuse counseling. Forty-six percent of direct care staff are not licensed. | Significant effort to negotiate data sharing agreement with 50 states. Data will not be in consistent format nor include a consistent set of professionals. |
3. Expert Interviews
To supplement the literature review, we conducted three expert interviews in May and June of 2015. The first interview was with the executive director of the International Certification and Reciprocity Consortium (IC&RC), an organization that develops standards and exams that local boards across the country use for credentialing and licensing. The director responded to our interview questions orally and also provided written responses to the questions on our interview guide from local board staff in Louisiana, Minnesota, North Carolina, and Ohio. The second interview was with the executive director of the National Association for Alcoholism and Drug Abuse Counselors (NAADAC), an association for professionals in the SUD treatment workforce, which also creates exams for certifications. The third interview was with the senior vice president of Public Policy and Practice Improvement with the National Council for Behavioral Health, an association that represents behavioral health provider organizations.
The interviews with the IC&RC and NAADAC representatives addressed addiction provider certification trends, training program trends, state requirements for licensing and certification, and recent changes in the workforce associated with the ACA, MHPAEA and any other observed changes. The interview with the National Council for Behavioral Health representative addressed:
-
Providers' experiences related to implementation of the ACA and MHPAEA.
-
How providers have adapted to the availability of expanded Medicaid and private insurance coverage for SUD treatment.
-
Barriers providers have identified to using this insurance coverage to support patient treatment.
-
The most pressing concerns for providers related to training programs for SUD treatment professionals, ability to hire qualified staff for open positions, and ability to retain current staff.
-
State-level differences in licensing/credentialing policies or professional certification requirements that have an important impact on the availability of SUD treatment programs or on program staffing patterns.
The experts were not able to address all topics identified, and had no data available to support response to most questions and therefore could provide only anecdotal information. IC&RC and NAADAC representatives indicated that state board representatives might have information to address particular questions, but this information was not passed on to the national organization.
C. Definition of Substance Use Disorder Treatment Demand
We assess SUD treatment demand under this study with two alternative metrics. First, we used a market-based definition defining demand as observed service use. This definition is useful for identifying the status quo and as a baseline for assessing how demand may change in the future. However, policymakers are keenly interested in the level of unmet need for services. Addressing this question requires an understanding of the prevalence of the illness requiring treatment.
Ideally, market demand would be measured by counting individual units of service used by type of care. However, the available data for this study are limited to information on the number of individuals accessing particular service types within a particular care setting (for example, the number of individuals receiving short-term residential treatment or intensive outpatient services) and the total expenditures for SUD treatment services by settings of care.6
We measure need for treatment based on the prevalence of SUDs. The NSDUH survey provides an excellent resource for identifying individuals who meet diagnostic criteria for abuse or dependence on alcohol or illicit drugs. However, the treatment needs of individuals who meet diagnostic criteria for an SUD vary. Some researchers have noted that standard diagnostic criteria for SUDs may inflate estimates of treatment need. They have proposed alternative concepts which narrow the definition of need. For example, Wakefield and Schmitz (2015) have proposed narrowing the diagnostic criteria for SUDs to require dysfunction and harm (Wakefield and Schmitz 2015). Others have suggested treatment need may be defined in relationship to the individual's own perception of need or based on a disability associated with the SUD (Mechanic 2003). Identifying the populations meeting alternative definitions of treatment need is beyond the scope of the current study. Thus, we present estimates of trends in prevalence of SUDs based on NSDUH, as these trends are likely to parallel trends in the number of individuals who might benefit from treatment.
D. Definition of Substance Use Disorder Treatment Supply
The definition of an SUD professional used in this study is based on three dimensions, as described below.
-
Engagement in SUD Treatment. The goal of the current study is to assess the adequacy of the workforce to meet demand for SUD treatment services. Only professionals who are actively engaged in the workforce and available to meet this demand will be counted as part of the current workforce. There is considerable turnover in the SUD treatment workforce. Many individuals who have the appropriate education, training, or credentials to provide these services are not currently employed in the SUD treatment field--they are engaged in other professional activities and will not be counted in estimates of the current workforce.
-
Settings and Nature of Treatment Provided. SUD treatment is provided in specialty and non-specialty settings. This study discusses care in specialty and non-specialty settings. For the NSDUH survey (SAMHSA 2014b) specialty treatment is defined as treatment received at hospitals (inpatient only), drug or alcohol rehabilitation facilities (inpatient or outpatient), or mental health centers. Treatment at an emergency room, private doctor's office, self-help group, prison or jail, or hospital as an outpatient are considered non-specialty treatment. In this report we consider all services reported in N-SSATS specialty treatment.
-
Education and Experience. Health workforce studies often require that individuals have a specific set of credentials to be counted as part of the workforce. However, because there is limited knowledge about current staffing patterns at SUD treatment organizations, this study takes a broad view of the field requiring only that an individual be actively providing or supporting SUD treatment.
II. Demand for Substance Use Disorder Treatment
This section assesses demand for SUD treatment. We begin by reviewing estimates of the prevalence of substance use and disorders at the national and state levels in 2013. We then assess recent trends in substance use and disorders.
A. Prevalence-Based Estimates of Demand
In this section we look at the prevalence of SUDs. The findings reported here are based on previously published analyses of the NSDUH. Overall, estimates of the prevalence of SUDs based on the NSDUH are probably conservative because institutionalized populations and homeless not living in shelters are excluded and survey respondents tend to underreport drug and alcohol use (Hoyt et al. 1994; Harrell 1997). The first section below addresses current prevalence of SUDs. The section that follows addresses trends in SUDs over the last decade.
1. Current Prevalence
This section initially reports national-level estimates and then addresses state-level estimates.
a. National-Level Estimates
Use of illicit drugs is generally limited to a small share of the population (Figure II.1). Both cocaine and hallucinogens had a 2 percent prevalence, inhalants had a 1 percent prevalence, and heroin less than a 1 percent prevalence. Use of marijuana and psychotherapeutics7 was much more common with a 13 percent and 6 percent prevalence rate, respectively.
Similar to usage, marijuana also had the highest percentage of abuse and dependence in 2013, with 0.5 percent abuse and 1.1 percent dependence (Figure II.2). Psychotherapeutics had the second highest abuse and dependence rates, with percentages of 0.2 percent and 0.7 percent, respectively. Heroin and cocaine both had dependence rates of 0.2 percent, while cocaine, hallucinogens, and inhalants all had abuse percentages of 0.1 percent.
| FIGURE II.1. Illicit Drug Use in Past Year among Persons Age 12 and Over, NSDUH 2013 |
|---|
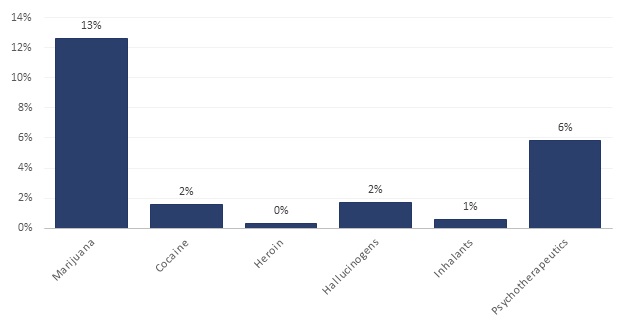 |
| SOURCE: Estimates obtained from SAMHSA 2015a, Table 7.2B. |
A little over half of people age 12 and over reported using alcohol in the previous month, but only 7 percent of the population met criteria for an alcohol use disorder in the past year (Figure II.3). Four percent of people met diagnostic criteria for alcohol abuse in 2013 but were not alcohol dependent (SAMHSA 2015a). Abuse of alcohol is defined as drinking hazardously, not fulfilling key responsibilities at work, school, or home due to drinking, legal problems associated with drinking, and drinking causing social problems (HHS Centers for Disease Control and Prevention [CDC] 2015a). Only 3 percent of the population met diagnostic criteria for alcohol dependence (SAMHSA 2015a), which is defined as an intense desire for alcohol, inability to set bounds for alcohol consumption, and repeated physical and personal issues as a result of alcohol use (CDC 2015a).
Beyond these diagnostic conditions, public health officials are concerned about other harmful patterns of drinking. Twenty-three percent of the population reported binge drinking in the past 30 days (SAMHSA 2015a), defined as consuming five or more drinks on the same occasion. Binge drinking is dangerous because it impairs brain function; results in a feeling of warmth but a loss of body heat; elevates risk for certain cancers, stroke, and liver diseases (for example, cirrhosis); can harm a developing fetus; increases the likelihood of motor-vehicle traffic crashes, violence, and other accidents; and in extreme cases, when large amounts are consumed in a brief time frame, may result in coma and death (CDC 2015a). Six percent of people reported heavy drinking (SAMHSA 2015a), that is, consuming five or more drinks on the same occasion on five or more days in the past 30 days. All heavy drinkers are binge drinkers. In addition to the health problems related to binge drinking, heavy drinking is linked to Sudden Infant Death Syndrome and risk for alcohol abuse and dependence (CDC 2015a).
| FIGURE II.2. Prevalence of Illicit Drug Abuse and Dependence in Past Year among Persons Age 12 and Over, NSDUH 2013 |
|---|
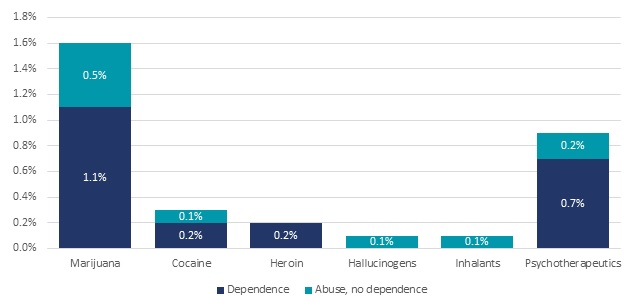 |
| SOURCE: Estimates obtained from SAMHSA 2015a, Table 7.40B. |
| FIGURE II.3. Past Month Use and Past Year Abuse and Dependence on Alcohol among Persons Age 12 and Over, NSDUH 2013 |
|---|
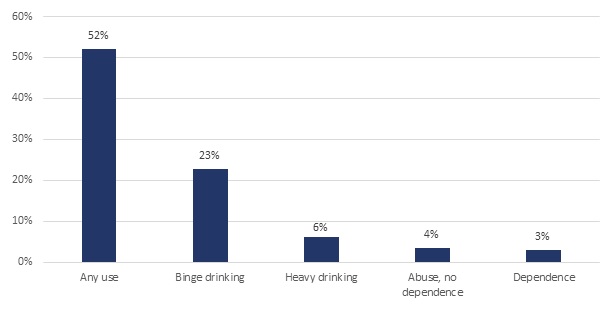 |
| SOURCE: Estimates obtained from SAMHSA 2015a, Table 7.29A, 7.29B, and Table 7.41B. NOTE: Use is based on past month, and dependence and abuse are based on past year. Binge alcohol use is defined as drinking 5 or more drinks on the same occasion (that is, at the same time or within a couple of hours of each other) on at least 1 day in the past 30 days. Heavy drinking is defined as drinking 5 or more drinks on the same occasion on each of 5 or more days in the past 30 days; all heavy alcohol users are also binge alcohol users. |
b. State-Level Estimates
State-level estimates of substance use reveal variance in patterns of usage across states. These differences are associated with several factors, such as differences in social norms, population demographics, and urbanicity.
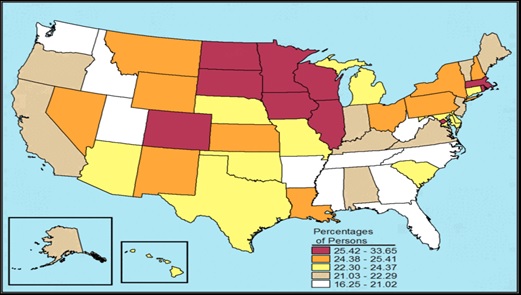
In general, illicit drug use other than marijuana is highest in the Western and Southern states and lowest in the Midwest (Figure II.4). The 2013 NSDUH found that illicit drug usage was most common in urban areas and least common in less urbanized or rural areas (SAMHSA 2014a).
| FIGURE II.4. Illicit Drug Use Other Than Marijuana in the Past Month among Individuals Age 12 and Over, by State: Annual Average Percentages based on NSDUH 2012 and 2013 |
|---|
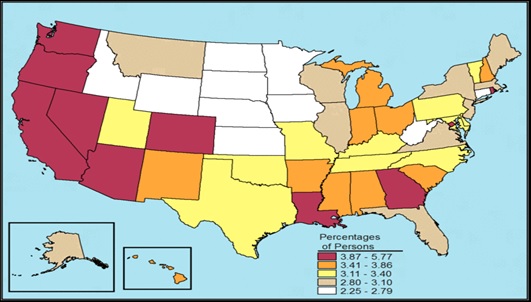 |
| SOURCE: Graphic reprinted from SAMHSA 2015b. |
ALT TEXT for FIGURE II.4, State Chart:
|
Marijuana use appears more prevalent in the West and Northeast, and less prevalent in the Midwest and the South (Figure II.5). Such trends may reflect, in part, local laws regarding medical marijuana use.
| FIGURE II.5. Marijuana Use in the Past Year among Individuals Age 12 or Older, by State: Percentages, Annual Averages based on NSDUH 2012 and 2013 |
|---|
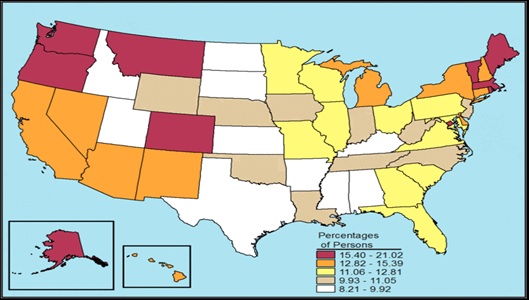 |
| SOURCE: Graphic reprinted from SAMHSA 2015b. |
ALT TEXT for FIGURE II.5, State Chart:
|
In contrast to illicit drugs and marijuana, binge alcohol use appears to be more prevalent in the Midwest and less prevalent out West and in the South (Figure II.6).
| FIGURE II.6. Binge Alcohol Use in the Past Month among Individuals Age 12 or Older, by State: Percentages, Annual Averages based on NSDUH 2012 and 2013 |
|---|
 |
| SOURCE: Graphic reprinted from SAMHSA 2015b. |
ALT TEXT for FIGURE II.6, State Chart:
|
Alcohol dependence patterns appear to be similar to that of binge drinking, with higher prevalence in the Midwest and lower prevalence in the South; however the West falls into higher categories for dependence than binge drinking (Figure II.7).
| FIGURE II.7. Alcohol Dependence in the Past Year among Individuals Age 12 or Older, by State: Percentages, Annual Averages based on NSDUH 2012 and 2013 |
|---|
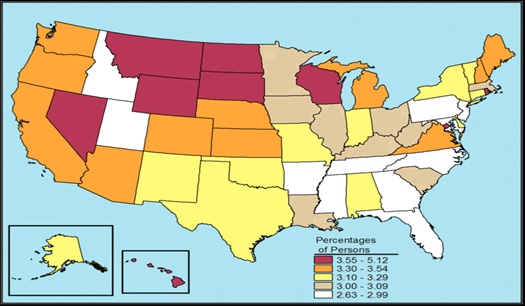 |
| SOURCE: Graphic reprinted from SAMHSA 2015b. |
ALT TEXT for FIGURE II.7, State Chart:
|
2. Trends in SUD Prevalence
An important component in projecting demand for SUD treatment is examining recent trends in condition prevalence and considering whether these trends are likely to persist. In this section, we describe national and state-level trends in alcohol use, illicit drug use, and SUDs between 2002 and 2013, based on previously published estimates from NSDUH. Detailed tables on these trends from 2002-2013 are provided in Appendix A. We compared 2013 estimates with estimates for each year between 2002 and 2012 and report on statistically significant differences. This section initially reports national-level estimates and then addresses state-level estimates.
a. National Estimates
Based on data from the NSDUH, the proportion of individuals age 12 and older who met diagnostic criteria for an SUD8 in the past year (Figure II.8 and Appendix Table A.5) remained relatively constant from 2002-2010 (ranging from 8.8 percent to 9.4 percent) and then decreased in 2011 through 2013 (ranging from 8.0 percent to 8.5 percent). The estimate for 2013 is significantly lower than the estimates for each year between 2002 and 2010. The 2013 estimate is significantly lower than the estimates for 2002 through 2004 for both alcohol, and separately for illicit drug disorders.
| FIGURE II.8. Proportion of Individuals Age 12 and Older with Past Year Abuse or Dependence on Alcohol or Illicit Drugs, NSDUH 2002-2013 |
|---|
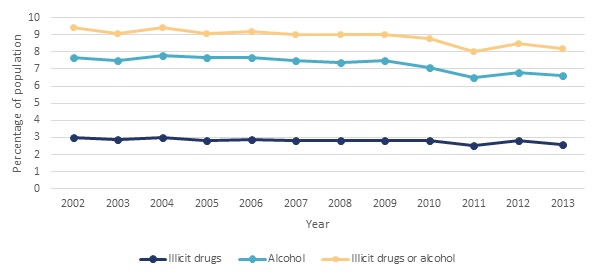 |
| SOURCE: Estimates obtained from SAMHSA 2015a, Table 7.40B. |
Although there was a slight decline in current prevalence of SUDs between 2002-2010 and 2011-2013, accounting for population growth, the actual number of individuals meeting criteria for an SUD in the past 12 months in 2013 did not differ significantly from any year between 2002 and 2012 (Figure II.9 and Appendix Table A.4).
| FIGURE II.9. Number of Individuals Age 12 and Older with Past Year Abuse or Dependence on Alcohol or Illicit Drugs, NSDUH 2002-2013 |
|---|
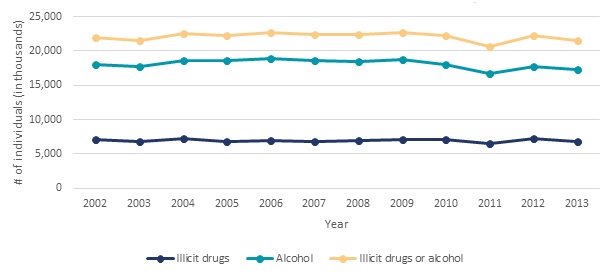 |
| SOURCE: Estimates obtained from SAMHSA 2015a, Table 7.40A. |
Underlying these overall trends in abuse and dependence are some shifts in substance use and opposing trends for some substances.
Use of Illicit Drugs (Appendix Tables A.1). Relative to 2011, the number of people over 12 years of age who had used illicit drugs in the past year was significantly higher in 2013 by 8.6 percent (3.3 million people). This increase was largely due to a 10.8 percent increase (3.2 million people) in use of marijuana. The number of people using heroin in 2013 was significantly higher than in each year from 2002-2008 with the exception of 2006. In contrast, use of cocaine was significantly lower in 2013 relative to each year from 2002-2009, and use of inhalants was significantly lower in 2013 relative to each year from 2002-2011.
Dependence or Abuse of Illicit Drugs (Appendix Table A.4). Although there is no significant difference between the overall number of people with illicit drug abuse or dependence in the past year between 2013 and any year from 2002-2012, there were some significant changes in the number of individuals with disorders associated with specific substances in this time period. Relative to 2010, there was a significant 31 percent decline (125,000 people) in the number of people with abuse or dependence on hallucinogens by 2013. Similarly, relative to 2009, there was also a significant 22.8 percent decline (about 250,000 people) in abuse or dependence on cocaine by 2013. The number of individuals with cocaine-related disorders ranged from 1.5 million to 1.7 million from 2002-2007, but in 2013-2014 estimates indicate only 0.9 million persons with cocaine-related disorders. In contrast, the number of individuals with heroin-related disorders ranged from 189,000 to 324,000 from 2002-2008, but in 2014 estimates indicate 586,000 individuals with heroin disorders. The number of individuals with disorders related to pain relievers ranged from 1.4 million to 1.5 million from 2002-2005. This increased to 1.9 million by 2013-2014.9
Use of Alcohol (Appendix Table A.3). Relative to 2002, by 2013 the number of people using alcohol and binge drinking in the past month increased significantly by 14.2 percent (17 million people) and 11.7 percent (6.3 million people), respectively. The number of heavy drinkers did not change significantly.
Dependence or Abuse of Alcohol (Appendix Table A.4). Relative to 2009, by 2013 the number of people with abuse of or dependence on alcohol in the past year declined by 7.8 percent (1.5 million people).
Overall, illicit drug use in the past year has increased recently; however this increase is largely due to increased use of marijuana and has not translated into a change in the number of people with illicit drug abuse or dependence. Similarly, the number of people using alcohol recently increased, but the increased use did not result in observed increases in abuse or dependence. Thus, we would not expect substantial shifts in treatment demand associated with these observed trends in use and disorders.
b. State-Level Estimates
As noted above, nationally, marijuana use had increased in recent years. This increase in use was not consistent across states. Only one region, the South, and a minority of states showed a significant increase in marijuana use based on the NSDUH's 2011-2012 and 2012-2013 regional and state-level estimates (Appendix Table A.6). The states with a significant increase in use were: Colorado, the District of Columbia, Georgia, Hawaii, Maine, Maryland, Michigan, Missouri, New Hampshire, Utah, Virginia, and Washington. States with significant decreases in use were Mississippi, New Jersey and South Dakota.
The South was also the only region to have a significant increases in illicit drug use other than marijuana between 2011-2012 and 2012-2013. At the state level, illicit drug use other than marijuana increased significantly in the District of Columbia, Georgia, Louisiana, Maryland, and North Carolina, while it decreased significantly in Idaho, Indiana, Minnesota, Montana, and West Virginia. Lastly, the South was also the only region to have a significant increase in alcohol dependence or abuse. Alcohol dependence or abuse increased in Alabama, Kansas, North Carolina, and Virginia and decreased in Alaska, Illinois, Iowa, Minnesota, Nevada, and Oklahoma.
B. Market-Based Estimate of Demand
In this section, we review the level of SUD treatment services currently provided. We address the number of individuals receiving any care, specialty care in the community, and care in an institutional criminal justice setting. Then, we describe how expenditures for SUD treatment are allocated across settings of care.
1. Number of Persons in Care
SUD treatment services are provided in a variety of settings including inpatient hospital, residential, and outpatient. SUD care can be provided in general health care settings such as primary care physician offices or community health centers; however SUD treatment is typically provided in specialty facilities or specialty care units with SUD treatment programs. This section first reports estimates from NSDUH on the number of persons receiving any care in the last year in specialty and non-specialty settings. Then it reports findings from the N-SSATS on care received in specialty settings. Finally, because incarcerated individuals are not included in the NSDUH and N-SSATS surveys, in the last section we look at care received in a criminal justice setting.
a. National Survey of Drug Use and Health
NSDUH collects data on all types of SUD treatment services ranging from self-help group services to services in an inpatient setting. According to NSDUH estimates, in 2013, 4.1 million people age 12 or older (1.5 percent of the population) received any treatment for a problem related to the use of alcohol or illicit drugs (SAMHSA 2014b). Services were provided in the following settings. (Individuals may receive services from more than one setting.)
- 2.3 million received treatment at a self-help group.
- 1.8 million received treatment at a rehabilitation facility as an outpatient.
- 1.2 million received treatment at a mental health center as an outpatient.
- 1.0 million received treatment at a rehabilitation facility as an inpatient.
- 879,000 received treatment at a hospital as an inpatient.
- 770,000 received treatment at a private doctor's office (including primary care).
- 603,000 received treatment at an emergency room.
- 263,000 received treatment at a prison or jail. (This is an undercount of the total number of people receiving treatment in these settings, as NSDUH is a community-based survey of non-incarcerated individuals.)
SUD treatment occurs predominantly in specialized facilities. Of the 4.1 million individuals who received any treatment, 2.5 million received treatment provided by a specialty SUD treatment provider. More than half of respondents who reported receiving inpatient treatment identified a rehabilitation facility as their source of inpatient care rather than a hospital. Among those receiving outpatient SUD treatment, treatment in a rehabilitation facility was over two times more frequent than treatment in a private doctor's office.
b. National Survey of Substance Abuse Treatment Services
The N-SSATS surveys all public and private specialty SUD treatment facilities in the United States including specialty SUD treatment units or programs in hospitals or mental health facilities. Solo practitioners10 and facilities serving only criminal justice clients are excluded from the N-SSATS. In contrast to the NSDUH, which contains information on individuals receiving treatment in general health care settings, the N-SSATS includes information only on clients receiving care in facilities or treatment units with treatment programs for SUDs.
In the 2013 N-SSATS, respondents were asked to report the number of inpatient and residential clients receiving care for SUDs in their facility on March 29, 2013. They were also asked to report on outpatient clients who received any SUD care at their facility in March 2013 and who were still in care at the end of March. Based on these reports, specialty facility clients were distributed as follows:
- 1,127,235 outpatient clients.
- 107,727 residential clients.
- 14,667 inpatient hospital clients.
The share of clients served in each of these settings remained similar between 2005 and 2013. Detoxification services, rehabilitative care, and medication-assisted treatment (MAT) may be provided in the inpatient, residential and outpatient setting.
According to SAMHSA (2006a) detoxification "denotes a clearing of toxins from the body of the patient who is acutely intoxicated and/or dependent on substances of abuse. Detoxification seeks to minimize the physical harm caused by the abuse of substances." Overall in March 2013, 2 percent of specialty facility clients (about 30,000 clients) were receiving detoxification services. Detoxification clients represented a larger share of clients within the inpatient and residential settings, 39 percent and 10 percent, respectively relative to the outpatient setting (1 percent) (Table II.1). However, the number of clients receiving detoxification services in the outpatient setting (13,839) was substantially larger than the numbers receiving detoxification services in the inpatient (5,768) and residential settings (10,244).
| TABLE II.1. Services Provided by Setting of Care, N-SSATS 2005, 2009 and 2013 | ||||||
|---|---|---|---|---|---|---|
| Type of Care Within Setting | Number of Clients | Percent of Clients in Care Type | ||||
| 2005 | 2009 | 2013 | 2005 | 2009 | 2013 | |
| Total | 1,081,049 | 1,182,077 | 1,249,629 | 100 | 100 | 100 |
| Outpatient | 961,805 | 1,064,562 | 1,127,235 | 100 | 100 | 100 |
| Regular | 569,272 | 598,282 | 603,315 | 59 | 56 | 54 |
| Intensive | 125,573 | 147,132 | 147,162 | 13 | 14 | 13 |
| Detoxification | 13,474 | 10,786 | 13,839 | 1 | 1 | 1 |
| Day treatment/partial hospitalization | 24,928 | 23,822 | 22,828 | 3 | 2 | 2 |
| Methadone/buprenorphine maintenance or Vivitrol® | 228,558 | 284,540 | 340,091 | 24 | 27 | 30 |
| Residential (non-hospital) | 104,015 | 103,174 | 107,727 | 100 | 100 | 100 |
| Detoxification | 7,306 | 6,067 | 10,244 | 7 | 6 | 10 |
| Short-term | 23,360 | 25,807 | 27,184 | 22 | 25 | 25 |
| Long-term | 73,349 | 71,300 | 70,299 | 71 | 69 | 65 |
| Hospital inpatient | 15,229 | 14,341 | 14,667 | 100 | 100 | 100 |
| Detoxification | 6,381 | 6,427 | 5,768 | 42 | 45 | 39 |
| Treatment | 8,848 | 7,914 | 8,899 | 58 | 55 | 61 |
| Clients receiving methadone, buprenorphine, or Vivitrol® treatment | 240,935 | 308,781 | 382,237 | 100 | 100 | 100 |
| Clients receiving methadone in OTP facilities | 235,836 | 284,608 | 330,308 | 98 | 92 | 86 |
| Clients receiving buprenorphine | 5,099 | 24,173 | 48,148 | 2 | 8 | 13 |
| Clients receiving Vivitrol® | N/A | N/A | 3,781 | N/A | N/A | 1 |
| SOURCE: Findings obtained from SAMHSA 2014a, Table 3.2. | ||||||
Clients not receiving detoxification services were receiving rehabilitative care. Rehabilitation services generally consist of abstinence-oriented counseling and education (Buck 2011). Many outpatient clients were receiving extended services in the outpatient setting (15 percent) including intensive treatment or day treatment/partial hospitalization. Similarly, many residential clients were receiving long-term services (65 percent). Rehabilitative care may be supplemented by MAT in any care setting. MAT is a form a pharmacotherapy that has been proven effective in alcohol and opioid dependence. In 2013, 31 percent (382,237 persons) of SUD treatment clients were receiving MAT with methadone, buprenorphine or Vivitrol® (Table II.1). This is a substantial increase from 22 percent (240,935) receiving these medications in 2005. These medications address heroin and pain reliever addiction. Vivitrol® may also be used to treat alcohol dependence.
c. Services Provided in the Criminal Justice System
The NSDUH and N-SSATS include only individuals currently living in the community. Incarcerated individuals are excluded from these surveys. Because many incarcerated individuals have SUD treatment needs, we discuss treatment for this population here.
Several studies have found a substantial percentage of prisoners are in need of SUD treatment. The National Center on Addiction and Substance Use at Columbia University (CASA 2010) reported that in 2006, 1.5 million (65 percent) of the 2.3 million inmates in United States prisons met the Diagnostic and Statistical Manual of Mental Disorders, 4th Edition (DSM-IV) medical criteria for alcohol or other drug abuse or dependence in the year before their arrest. Similarly, Rounds-Bryant and Baker (2007) assessed both prevalence rates of substance dependence and level of treatment need among recently incarcerated prisoners in a Southeastern state in 2002 and found 72 percent were substance dependent and 46 percent needed prison-based residential treatment. Using data from the 1997 Survey of Inmates in State Correctional Facilities, a nationally representative sample of inmates, Belenko and Peugh (2007) found that one-third of male and half of female prisoners needed residential treatment. Overall, rates of co-occurring mental disorders and SUDs are over 6-10 times higher among people in the criminal justice population than people not in the system (Cropsey et al. 2011).
| TABLE II.2. Number and Percent of Incarcerated Individuals with SUDs Who Received Treatment, 2006 | ||||||||
|---|---|---|---|---|---|---|---|---|
| Type of Service | Federal Prison | State Prison | Local Jail | Total | ||||
| Number (thousand) | % | Number (thousand) | % | Number (thousand) | % | Number (thousand) | % | |
| Detoxification | 0.9 | 0.9 | 7.6 | 0.9 | 5.0 | 1.0 | 13.6 | 0.9 |
| Any professional treatment since admission | 16.4 | 15.7 | 120.5 | 14.2 | 26.2 | 5.2 | 163.1 | 11.2 |
| Residential facility or unit | 9.2 | 8.8 | 78.1 | 9.2 | 15.6 | 3.1 | 102.9 | 7.1 |
| Counseling by a professional | 8.2 | 7.8 | 55.1 | 6.5 | 11.6 | 2.3 | 74.9 | 5.2 |
| Maintenance drug | 0.3 | 0.3 | 1.7 | 0.2 | 0.5 | 0.1 | 2.5 | 0.2 |
| Other addiction-related services since admission | 41.5 | 39.7 | 305.4 | 36.0 | 66.0 | 13.1 | 412.9 | 28.4 |
| Mutual support/peer counseling | 23.3 | 22.3 | 253.7 | 29.9 | 53.9 | 10.7 | 330.9 | 22.7 |
| Education | 30.5 | 29.2 | 150.2 | 17.7 | 25.2 | 5.0 | 205.9 | 14.2 |
| SOURCE: CASA'sanalysis (2010) of the Survey of Inmates in Federal Correctional Facilities (2004), Survey of Inmates in State Correctional Facilities (2004), Survey of Inmates in Local Jails (2002) (data files), and Bureau of Justice Statistics Reports, Prisoners in 2006. NOTE: Participation in specific types of professional treatment or addiction-related services is not mutually exclusive. |
||||||||
According to research by CASA (2010), of the 1.5 million prison and jail inmates who met clinical diagnostic criteria for an SUD in 2006, only 11.2 percent had received professional treatment since admission (Table II.2). According to this research, care in specialized settings is associated with reduced drug use and arrests post-release, but very few criminal justice facilities (16.6 percent) offer treatment in such settings (data not shown). Moreover, few inmates actually receive evidence-based services, including access to pharmacological treatments and counseling from certified staff.
2. Total Expenditures for Care
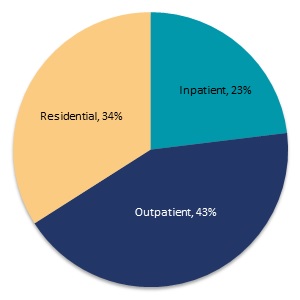
Another way to look at demand for care is measuring the amount spent on care (since quantity of services and intensity of services are difficult to measure). The SAMHSA spending estimates initiative draws from multiple data sources to develop a comprehensive view of the allocation of SUD treatment spending nationally, by setting and type of care. The largest share of spending (Figure II.10) is for outpatient care (43 percent). Residential and inpatient care represent 34 percent and 23 percent of spending, respectively.
| FIGURE II.10. Percentage of SUD Treatment Spending by Type of Care, 2009 |
|---|
 |
| SOURCE: Mathematica analysis of SAMHSA 2013c, Table A.6. |
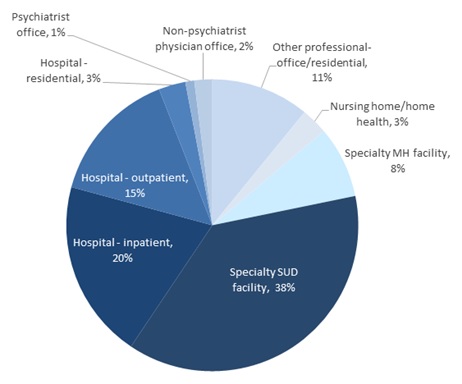
SUD treatment is provided in many settings (Figure II.11). The largest share of spending is allocated to specialty SUD treatment facilities (38 percent).11 Hospital-based inpatient, residential and outpatient care (each of which includes physician services provided in these settings) also represent a large share of spending (38 percent). Hospital-based care is typically provided in specialized SUD treatment units. Specialty mental health facilities also account for a substantial share of SUD treatment spending (8 percent). While these facilities are primarily focused on mental health treatment, this spending is associated with care provided through programs for individuals with co-occurring disorders or in SUD treatment units that are part of facilities primarily focused on mental health services. Psychiatrist, non-psychiatrist physician office, and other professional offices represent 14 percent of spending; services provided through primary care physicians would be represented under non-psychiatrist physician office, which represent only 2 percent of treatment spending. The final 3 percent of spending is allocated to nursing home and home health providers.
| FIGURE II.11. Percentage of SUD Treatment Spending by Setting of Care, 2009 |
|---|
 |
| SOURCE: Mathematica analysis of SAMHSA 2013c, Table A.6. |
C. The Difference Between Rates of Treatment and Prevalence--The Treatment Gap
1. What is the Size of the Treatment Gap?
There is a substantial gap between the number of people estimated to need SUD treatment and the number of people who receive any specialty treatment in a given year. According to SAMHSA (2014b) in 2013, an estimated 22.7 million United States residents needed treatment for an SUD defined as having an SUD in the past year (21.6 million) or receiving specialty treatment for an SUD in the past year although not meeting criteria for a current disorder (1.1 million). Only 18 percent (4.1 million) of these individuals received any treatment including self-help or emergency care and only 11 percent (2.5 million) received treatment at a specialty facility. According to a review by Foster (2014), this rate of treatment receipt is substantially lower than that for common health conditions such as hypertension (77 percent), diabetes (73 percent) and major depression (71 percent). However, as noted above, SUD diagnostic criteria may give rise to inflated estimates of need as compared to other estimates of need that may include further elaboration of criteria for dysfunction or harm, or self or family-perceptions of need (Wakefield and Schmitz 2015; Mechanic 2003). Nonetheless, this treatment gap is of concern to public health officials because continuation of these disorders negatively affects the health and lives of these individuals and also produces adverse consequences borne by many others in society (Bouchery et al. 2011; Bouchery and Harwood 2001). For example, these conditions are costly to the health care system, reduce economic productivity, and increase criminal justice expenditures.
2. Why is there a Treatment Gap?
| FIGURE II.12. Number of Individuals Who Received Specialty Treatment or Felt They Needed It, but did not Receive Treatment, 2004-2013 |
|---|
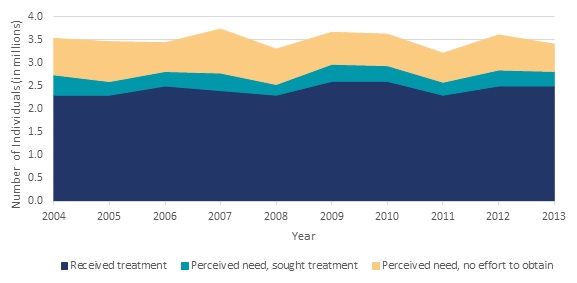 |
| SOURCE: NSDUH estimates for 2004-2013 were obtained from SAMHSA 2005, SAMHSA 2006, SAMHSA 2007b, SAMHSA 2008, SAMHSA 2009, SAMHSA 2010, SAMHSA 2011a, SAMHSA 2012a, SAMHSA 2013b, SAMHSA 2014b, respectively. NOTE: Treatment receipt is reported within the last 12 months. |
According to SAMHSA (2014b) the individuals who meet criteria for an SUD but who do not receive treatment fall into three groups: (1) those who do not feel they need treatment; (2) those who feel they need treatment but do not seek treatment; and (3) those who feel they need treatment and seek it. Based on responses to the 2013 NSDUH, 95.5 percent of individuals who met criteria for an SUD but did not receive specialty treatment (20.2 million people) did not feel they needed treatment. Among the remaining small percentage (4.5 percent, or 908,000 people) who felt they needed treatment but did not get it, 65.2 percent (about 592,000 people) reported making no effort to get treatment, while 34.8 percent (about 316,000 people) reported that they did make such efforts. Figure II.12 displays trends in the number of individuals who received specialty treatment; felt they needed specialty treatment but did not seek it; and felt they needed specialty treatment and sought it but did not receive it. These numbers were relatively constant from 2004 through 2013.
According to SAMHSA (2014b), those who felt they needed treatment but did not seek care (2.7 percent of the population with an SUD) identified the following reasons for not seeking it. (Respondents could note more than one reason.)
- 40.3 percent reported they were not ready to stop using alcohol or drugs.
- 31.4 percent reported having no health coverage and could not afford cost of treatment.
- 10.7 percent reported possible negative effect on their job.
- 10.1 percent reported concern that receiving treatment might cause neighbors/community to have a negative opinion of them.
- 9.2 percent reported not knowing where to go for treatment.
- 8.0 percent reported no program available having the type of treatment needed.
Those who felt they needed SUD treatment and sought but did not receive it (1.5 percent of the population with an SUD) reported the following reasons for not receiving treatment (SAMHSA 2014b). (Respondents could identify more than one reason.)
- 37.3 percent reported having no health coverage and could not afford cost of treatment.
- 24.5 percent reported not being ready to stop using drugs or alcohol.
- 9.0 percent did not know where to go for treatment.
- 8.2 percent had health coverage but it did not cover treatment or did not cover cost.
- 8.0 percent reported it was inconvenient or they lacked transportation.
- 6.6 percent reported it might have negative effect on job.
- 6.6 percent could handle problem without treatment.
- 5.0 percent did not feel they needed treatment at the time.
Several relatively small studies have been conducted in recent years to identify barriers to receiving SUD treatment. Many of the barriers identified were consistent with reasons for not receiving treatment identified in NSDUH, including lack of health coverage or inability to afford costs (Brubaker 2013; Appel and Oldak 2007; MacMaster 2013); not being ready to stop using drugs or alcohol (Appel and Oldak 2007); social stigma (Jackson and Shannon 2012; Masson 2012); lack of transportation (Sigmon 2014; Appel and Oldak 2007); and lack of a program suited to the individual's treatment needs (MacMaster 2013; Rapp 2006).
Other studies have also identified barriers not included among the NSDUH responses. In a survey of 145 homeless men, respondents identified having no place to stay to begin treatment as a barrier (Brubaker 2013). Appel and Oldak (2007) studied barriers for injection drug users who were targets for outreach. Outreach and agency staff identified administrative application burdens, whereas common barriers clients reported were fear of treatment and anticipated negative consequences like potential loss of child custody. Rapp and others (2006) and Xu and others (2008) found fear of treatment and privacy concerns to be barriers. Jackson and Shannon (2012), in a study of pregnant women, found the most common barriers to treatment reported were family responsibilities and administrative issues (such as waiting periods, paperwork, and treatment referrals). Peterson and others (2010) found that waiting lists and requirements for photo identification, as well as concern about taking methadone, acted as barriers for methadone treatment. While NSDUH is the most nationally representative source of information about why people do not receive care, the population in need of SUD treatment varies substantially and these smaller studies may provide insight into the reasons particular subpopulations do not access care.
D. Key Factors Influencing Demand for Care
The existing literature has assessed the influence of several key factors on demand for care.
1. Increased Recognition of SUDs as Health Conditions
As part of the Vital Signs survey (Ryan et al. 2012), thought leaders were asked to identify trends that would affect the workforce over the next five years. Seventy percent identified a trend toward increasing recognition of SUDs as valid health conditions. The ACA recognizes SUDs as health conditions and expands health insurance coverage of them through several mechanisms, including identifying SUD treatment as an essential health benefit; requiring coverage of SUD screening, brief intervention, and referral to treatment (SBIRT); and promoting integration of SUD treatment into primary care and mental health treatment settings. The MHPAEA may improve recognition of SUDs by promoting parity in coverage.
The thought leaders interviewed noted that these provisions may also change perceptions on the need for professional treatment for SUDs among both affected individuals and treatment providers. Researchers from the CASA (2012) report that despite the documented benefits of screening and referral to treatment, few primary care health professionals screen for or treat SUDs, educate patients about SUDs, or refer patients with SUDs to specialty SUD treatment providers. Only 6 percent of referrals to SUD treatment come from general health care providers. Changes in the current perceptions of SUD treatment among individuals with SUDs and primary care providers may have a substantial influence on trends in demand for services.
2. Funding for SUD Treatment
The primary driver of increased SUD treatment projected from the ACA is insurance coverage expansion. However, traditionally, most SUD treatment services have been financed by state, local, and federal sources rather than by Medicaid or private health insurance. In 2009, 31 percent and 11 percent of SUD treatment spending was financed by state/local and federal sources, respectively, excluding Medicare and Medicaid spending (Figure II.13). Five percent and 21 percent of SUD treatment spending was financed by Medicare and Medicaid, respectively. Private health insurance comprised only 16 percent of SUD treatment spending in 2009 (SAMHSA 2013c). The substantial share of funding represented by other state, local, and federal sources allows many individuals who would otherwise not be able to afford treatment to receive treatment at no or a reduced cost.
| FIGURE II.13. Percentage of Spending by Type of Care, 2009 |
|---|
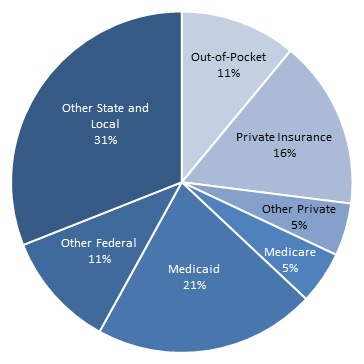 |
| SOURCE: Mathematica analysis of SAMHSA 2013c, page 37. |
Although there has been extensive analysis of the relationship between insurance coverage and use of health care services in the general health field, only a small number of studies have explicitly examined the influence of insurance coverage on the receipt of SUD treatment. The studies related to general health are not applicable to SUD treatment because SUD treatment is typically provided outside the general health sector, insurance coverage may be less comprehensive, and there is social stigma attached to SUDs and receipt of treatment for SUDs. In addition, states and the Federal Government (through the use of block grants) fund SUD treatment directly. While in other areas, the receipt of health insurance may make care more affordable, in the case of SUD treatment, because of this public financing, a privately insured person may actually face higher costs due to copayments or coinsurance, or disincentives to use of SUD treatment than individuals without insurance. The findings from studies on the impact of insurance coverage on SUD treatment use are therefore mixed, with several finding that people without insurance access SUD treatment services at greater or the same rates as those who are insured. Other studies find that financial obstacles, including lack of insurance coverage are a significant barrier to treatment receipt. While public and charitable financing of SUD treatment may allow many uninsured individuals to access treatment, free or low cost services may not be available in all communities or to all individuals for whom financial barriers are an obstacle. Several studies have found that individuals with Medicaid coverage are more likely to use SUD treatment than those with private insurance. This may be due to lower coinsurance requirements under Medicaid or differences in the care management and benefit packages provided through Medicaid and private insurance plans. Additionally, on average individuals with Medicaid differ substantially from individuals with private insurance. These differences include severity of the disorders, comorbidities, prior treatment histories, and pressure from employers or legal or court pressure to get treatment (Schmidt and Weisner 2004).
Several studies have found that people without insurance access SUD treatment at greater or the same rates as individuals with insurance, however, many of these studies do not control for the differences in populations noted above. Through the 1999 National Household Survey on Drug Abuse (NHSDA--the precursor to NSDUH), Wu and Ringwalt (2005) found that uninsured young adults were more likely to use self-help or non-medical social services sector SUD services than their privately insured counterparts. Similarly, Mojtabai (2005) found through the 2002 NSDUH that the uninsured accessed SUD treatment at similar rates as the insured. Lastly, based on survey data from a sample of problem drinkers drawn from the general population and chemical dependency treatment programs, Schmidt and Weisner (2005) found that among those with alcohol disorders in the general population, individuals with Medicaid and those without insurance were as likely to enter into treatment as people with private insurance. Bouchery and colleagues (2012), using 2002-2007 NSDUH data, similarly found that uninsured individuals had similar rates of SUD treatment receipt relative to those with private insurance.
In contrast, other studies have found lack of insurance coverage or inability to pay to be significant barriers to SUD treatment receipt. Based on data from the longitudinal study, Reducing Barriers to Drug Abuse Treatment Services, Xu and colleagues (2008) found that lack of insurance coverage and inability to afford treatment were barriers to treatment entry. Likewise, Saum and colleagues (2007) concluded that having health insurance (along with other enabling factors) was influential in predicting treatment entry for cocaine-dependent women who were involved with the criminal justice system. Other researchers reporting findings from surveys of nationally representative populations or more narrow subpopulations found inability to pay or lack of insurance to be barriers to SUD treatment (Brubaker et al. 2013; MacMaster 2013; Peterson et al. 2010; SAMHSA 2014a).
Several studies have suggested that individuals with Medicaid coverage are more likely to use SUD treatment than those with private insurance. Epstein and colleagues (2004), using pooled data from the 2000 and 2001 NHSDA, found that having Medicaid, as opposed to private or no insurance, significantly increased the likelihood of specialty treatment for drug use. Larson and colleagues (2005) found that among 267 people in Massachusetts who received substance abuse counseling, access to Medicaid insurance was associated with greater access to care and higher consumer ratings of care. Bouchery and colleagues (2012), using 2002-2007 NSDUH data, similarly found that those on Medicaid had significantly higher rates of SUD treatment receipt relative to those with private insurance. Using 2008-2012 NSDUH data, Ali and colleagues (2014) found that individuals with Medicaid had a significantly higher and individuals with private insurance a significantly lower likelihood of using any SUD treatment relative to individuals with other insurance types (including Veteran's insurance or Civilian Health and Medical Program of the Uniformed Services). There was no significant difference in the likelihood of SUD treatment use between the uninsured and those with other insurance.
The mixed findings in this literature may result from the different benefit structures and treatment type coverage of the insurance and different population characteristics by insurance coverage type as noted above. For a wealthier population, insurance may make treatment at a private provider more affordable. For a lower income population, copays or coinsurance requirements might be barriers to treatment receipt even if insurance provides some coverage for services. In addition, the studies may have imprecise measures, methodological limitations and particular contexts. Many of the studies analyzed the relationship between treatment use and insurance coverage in cross-sectional data. There may be unobserved differences between populations with different insurance types, such as severity of condition and employment, which could confound the findings. We did not identify any studies using an experimental design to examine the relationship between insurance coverage and the receipt of SUD treatment. Given the mixed findings in the literature on insurance coverage, there is little basis upon which to project the change in demand for services associated with recent increases in insurance coverage for SUDs.
4. Racial and Ethnic Disparities
A number of studies highlighted racial and ethnic differences in entry into and unmet need for SUD treatment; however, the findings differ somewhat by type of SUD. For example, one study found that non-Hispanic White Americans were more likely to address substance abuse by accessing care through specialty addiction treatment facilities and less likely to access it through non-specialty facilities than were members of racial/ethnic minority groups (Lo and Cheng 2011). Asian Americans and Pacific Islanders underutilized substance abuse treatment services (Masson et al. 2013), and Asians with past-year SUDs had a higher likelihood of having an unmet need for treatment than did people who were White (Mulvaney et al. 2012); however, Asians with heavy drinking/illicit drug use had lower likelihood of unmet need (Mulvaney et al. 2012). An analysis of administrative data from the Oklahoma Department of Mental Health and Substance Abuse Services linked to other state data, such as criminal justice and employment system data, found that Black clients were significantly less likely to initiate treatment than White clients (Acevedo et al. 2012). Among people with SUDs, mental health problems, and HIV/AIDS, Blacks were less likely than Whites to utilize mental health or substance abuse treatment (Weaver et al. 2008). Another study found that Black adolescents received less specialty and informal care compared with adolescent Whites, and adolescent Latinos also received fewer informal services than adolescent Whites (Alegria et al. 2011). In contrast, in another study, Blacks with past-year disorder and with heavy drinking/illicit drug use had significantly lower likelihood of unmet need (Mulvaney et al. 2012).
While several studies suggest lower levels of access for racial/ethnic minorities, the findings are not consistent. Differences in findings are likely to be attributed to the definition of the population served and the measures of access used, which varied across the studies reviewed. Differences in how individuals from specific subgroups accessed services and the types of services they used may also contribute to differences in findings across studies.
E. Trends and Policies Affecting Future Demand for Care
In this section, we highlight trends and policies likely to have a substantial impact on demand for SUD treatment over the next five years. These include population growth, the ACA, MHPAEA, marijuana legalization, opioid use epidemic, and trends in government spending on SUD treatment.
1. Population Growth
Between 2015 and 2020 the United States youth and adult population aged 14 and older is projected to grow 4.8 percent (Table II.3). The younger age groups including individuals less than 25 are expected to shrink while the population over age 65 is expected to grow rapidly. Because prevalence rates of SUDs vary by age (SAMHSA 2014b) and are highest within age groups expected to shrink, demand for SUD treatment may not keep pace with overall population growth. In 2013 the SUD prevalence rate was highest for individuals aged 18-25 (17.3 percent), followed by individuals 26 or older (7.0 percent). Youth aged 12-17 had the lowest prevalence rate at 5.2 percent. There is concern that need for treatment among older age groups may increase over time as the baby boomers age given their higher rates of substance use relative to previous generations (SAMHSA 2013a).
| TABLE II.3. Projected Population Growth Trends, 2015-2020 | |||
|---|---|---|---|
| Age Group | 2015 | 2020 | Percent Change |
| Total | 264,529 | 277,112 | 4.8 |
| 14 to 17 | 16,796 | 16,737 | -0.4 |
| 18 to 24 | 31,214 | 30,555 | -2.1 |
| 25 to 44 | 84,657 | 89,518 | 5.7 |
| 45 to 64 | 84,032 | 83,861 | -0.2 |
| 65 and over | 47,830 | 56,441 | 18.0 |
| SOURCE: U.S. Census Bureau, Population Division, Table 3: Projections of the Population by Sex and Selected Age Groups for the United States: 2015 to 2060 (NP2014-T3), December 2014 release. | |||
2. ACA
This section lists the provisions of the ACA most likely to affect SUD treatment use. Then, it summarizes existing estimates of the ACA's effects on SUD treatment use.
a. Provisions Affecting SUD Treatment
The ACA expands coverage for SUD services through the following mechanisms:
Reduction in the Number of Uninsured. The ACA reduces the number of uninsured in several ways. First, in those states that have opted for Medicaid expansion, Medicaid eligibility is expanded to include citizens in households below 138 percent of the federal poverty level (FPL) and legal residents who meet a five-year waiting period and live in households below 138 percent of the FPL. Second, the ACA has created marketplaces for the purchase of private insurance coverage. Individuals in households with an income from 100 percent to 400 percent of FPL can qualify for subsidies to make purchasing insurance through the marketplaces more affordable. Additionally, marketplace plans can no longer deny coverage on the basis of pre-existing conditions, and treatment for pre-existing conditions begins as soon as coverage begins (HealthCare.gov 2014). Finally, the ACA has extended the age limit for dependents to remain on a parent's insurance policy to age 26 (Humphreys and Frank 2014).
Inclusion of SUD Treatment as an Essential Health Benefit. As of January 1, 2014, SUD treatment is an essential health benefit for all Americans in non-grandfathered plans in the individual and small group markets (Beronio et al. 2013). Medicaid benchmark and marketplace plans must also treat SUD treatment as an essential benefit (Barry and Huskamp 2011), with no lifetime or yearly dollar limit on services (HealthCare.gov 2014). SUD screening, brief intervention, and treatment are all included as essential benefits (Humphreys and Frank 2014). This provision will result in enhanced SUD treatment benefits for many individuals.
Service Delivery System Changes. Provisions of the ACA promote care integration, including integration of SUD treatment into primary care and mental health treatment settings. We discuss trends in integration as a supply-side trend in Section III.B.3.
Changes in Medicaid Coverage of SUD Treatment Services. States that expanded their Medicaid programs under the ACA have accepted large numbers of childless adults into their Medicaid populations, and these individuals are expected to have greater need for SUD treatment services relative to the traditional Medicaid population. We discuss Medicaid coverage changes in Section II.E.6 below.
b. Existing Estimates of Projected Impact on Demand
This section discusses existing estimates for how the ACA has affected or may in the future affect demand for SUD treatment. We begin by discussing changes associated with implementation of the ACA in the number of people who are uninsured. Then, we discuss the number of insured individuals who obtained enhanced benefits for SUD treatment through the ACA. Next, we look at available research on how obtaining insurance coverage may affect access to and use of SUD treatment. Finally, we summarize existing research on how the ACA may influence demand for SUD treatment.
c. How Many People are Newly Insured?
Many people who signed up for insurance through a marketplace or enrolled in Medicaid in 2014 might have obtained private or Medicaid insurance coverage in the absence of the ACA. Therefore, this section discusses the change in the number of uninsured Americans rather than counts of people signing up for insurance through marketplaces, as this is a better measure of the number of individuals who gained insurance as a result of the ACA. Recent surveys conducted by five entities--Rand Corporation, Commonwealth Fund, Gallup, the Urban Institute, and the CDC--indicate that between 2013 and 2014, the number of Americans without health insurance decreased by about 25 percent (8-11 million people).12 More than half of these newly insured individuals signed up for Medicaid. In addition to the changes observed between 2013 and 2014, 3-4 million people gained coverage through ACA provisions that took effect before 2014 (Sanger-Katz 2014).
Projections of the number of newly insured from the CBO and the Joint Committee on Taxation (JCT) are consistent with these observed changes. For 2014, CBO projected 12 million fewer uninsured non-elderly individuals. CBO and JCT projections through 2024 are as follows (Figure II.14):
-
Reductions in Uninsured. Relative to 2013 levels, the number of uninsured individuals will be reduced by 19 million non-elderly individuals by 2015, by 25 million by 2016, and by 26 million by each year from 2017 through 2024 (CBO 2014).
-
Marketplaces Coverage Use. Thirteen million people are projected to obtain coverage though marketplaces in 2015, 24 million in 2016 when more substantial tax penalties are implemented, and 25 million in 2017-2024 (CBO 2014).
-
Medicaid and CHIP Enrollment. An additional 11 million people are projected to obtain Medicaid or CHIP in 2015, 12 million in 2016 and 2017, and 13 million in 2018-2024 (CBO 2014).
The estimated reduction in the uninsured is lower than the total number of individuals estimated to obtain health insurance through the marketplaces, Medicaid, and CHIP in this period because some people will shift from employer, non-group or other coverage to marketplace, Medicaid, or CHIP coverage.
Some states are considering ways in which Medicaid eligibility expansions could help individuals exiting jails and prisons because these individuals have a higher prevalence of SUDs than the general population (Boozang et al. 2014; CASA 2010). These states are connecting Medicaid and corrections through cooperation among managed care organizations, social service organizations, and correctional facilities; building relationships among local substance abuse agencies, police, and jails; and creating protocols for crisis services, jail diversion, and safety. Boozang and colleagues (2014) reported that 20-30 percent of new Medicaid enrollees in 2014 were likely to be individuals recently released from jail or prison. Bainbridge (2012) found that 33.6 percent of inmates released annually are eligible for Medicaid coverage, with another 23.5 percent eligible for marketplace subsidies. Bainbridge also notes that several studies focused on local populations predict large numbers of recently incarcerated people being eligible for Medicaid.
| FIGURE II.14. Reduction in Uninsured and Enrollment in Marketplace and Medicaid as a Result of the ACA, 2015-2020 |
|---|
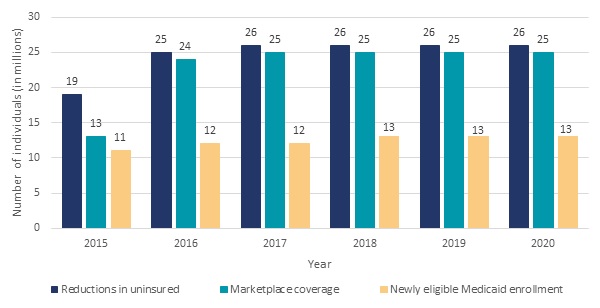 |
| SOURCE: Estimates obtained from CBO 2014. |
Thus, the ACA has increased and is expected to continue to increase the number of individuals with insurance coverage, greatly increasing the number of individuals with SUD treatment benefits.
d. How Many Previously Insured Individuals Gained SUD Treatment Coverage?
The ACA provides enhanced SUD coverage for individuals already insured. Overall, 35.5 million insured people are expected to gain enhanced coverage for SUD treatment because of the following:
-
SUD Benefit Added to Plan. Those without SUD coverage but with insurance prior to the ACA (approximately 1.2 million individuals in small group plans and 3.9 million people in the individual market) will gain SUD coverage as a result of the ACA (Beronio et al. 2013).13
-
Existing SUD Benefits Enhanced. Due to federal parity protections, approximately 7.1 million people in individual plans and 23.3 million people in small group plans who had some coverage for SUD treatment prior to the ACA will gain enhanced SUD treatment coverage (Beronio et al. 2013).
e. How Many People Who Gain Coverage will use SUD Treatment?
A few studies have examined how the use of SUD treatment may change in response to obtaining insurance coverage. The findings from these studies range from no effect to a substantial increase. The literature we identified includes the following findings:
Coverage Mandate for Adult Children. We identified one study that examined the effects of the coverage mandate for adult children, which applied to health insurance plans whose year began on or after September 23, 2010. This study used the 2008-2012 NSDUH to study SUD treatment use among adults ages 18-25 and found no increase in use of SUD treatment after the implementation of the coverage mandate (Saloner and Cook 2014).
SAMHSA SUD Spending Projections. SAMHSA periodically develops national projections for SUD treatment spending.14 The most recent available estimates are for 2014 through 2020 (SAMHSA 2014c). SAMHSA projects SUD treatment spending will increase 35 percent from 2014 through 2020. These projections assume an additional 25 million people will gain health insurance coverage through the ACA by 2020.15 The projections also assume a 25 percent increase in SUD treatment use for the individuals who newly gain insurance coverage. The size of this increase in use associated with obtaining insurance coverage is based on findings from the Oregon Health Insurance Experiment which provided low income uninsured individuals with Medicaid coverage.16 The findings on increased treatment use from the Oregon Experiment are not specific to SUD treatment and are based on individuals transitioning to Medicaid coverage. Increases in health expenditures associated with obtaining insurance coverage may be lower for SUD treatment than for other types of health care because of substantial existing public investment in SUD treatment for low income and uninsured individuals. This projection may also overstate the ACA impact on SUD treatment use because many of the newly insured are expected to gain coverage in private insurance plans. Although studies have found individuals with Medicaid coverage use SUD treatment at greater rates than the uninsured there is little evidence suggesting that obtaining private insurance coverage is associated with a substantial increase in service use (See Section II.D.3).
Experience from State Insurance Expansions. We identified two studies of state experiences with health insurance expansions that provide evidence on the potential effects of these policy changes.
-
Massachusetts Coverage Expansion. This mixed-method exploratory study analyzed the experience of Massachusetts in implementing a universal health insurance law similar to the ACA in 2007. The study found stable SUD treatment use two years before and two years after program implementation. A high percentage of individuals with SUD treatment needs remained uninsured because they did not enroll in insurance despite provisions of the law; for those who became insured, copayments were a deterrent to treatment (Capoccia et al. 2012).
-
Experience from Three State Insurance Expansions. This study conducted case studies of three states (Maine, Massachusetts, and Vermont) that implemented insurance coverage expansions intended to achieve universal coverage with similar provisions to the ACA.17 The case study focused on publicly funded facilities only. The study found that in Massachusetts, admissions to publicly funded SUD treatment increased 20 percent between 2006 and 2008. Relative to the study discussed in the prior bullet, this study did not look as broadly at multiple data sources and policy changes implement in the same time period as the coverage expansion to provide more perspective on the sources of observed shifts.
In Maine, the number of people admitted to publicly funded SUD treatment increased 45 percent between 1999 and 2008. In Vermont, the number of people admitted to publicly funded SUD treatment doubled between 1998 and 2007. Moreover, the experience in all three states indicates that despite insurance expansion, there was still a high percentage of uninsured individuals among those in need of SUD treatment. Thus, supplemental funding sources were needed to treat this population (Morrison et al. 2010).
Overall, the evidence for how the expansion of insurance coverage will influence treatment demand is very limited. The findings from these studies range from no effect to a substantial increase in referral to treatment. SAMHSA projects SUD treatment spending will increase 35 percent from 2014 through 2020, however this estimate may be overstated because there was limited evidence specific to SUD treatment upon which to base this projection.
3. MHPAEA
The MHPAEA contains several provisions that have the potential to influence the demand for SUD treatment.
a. Provisions Affecting SUD Treatment
The 2008 MHPAEA introduced parity for behavioral health treatment with medical/surgical care. Previously, employers could offer more limited coverage for SUD treatment than for other specialty treatment areas. Under the MHPAEA, large group employers with more than 50 full-time workers could no longer use such a restriction; however, this change did not impact individuals covered through the individual or small group market. This change also did not impact individuals covered through Medicaid and Medicare except those in Medicaid managed care arrangements. Another limitation is that the act does not require employers to offer SUD benefits, so parity is only required if the employer's plan covers SUD treatment (Humphreys and Frank 2014; Beronio et al. 2014). The MHPAEA identifies limitations on frequency of treatment, copayments, coinsurance, and deductibles as possible plan limitations that must be in parity (Frank et al. 2014).
b. Existing Estimates of Projected Impact on Demand
Several studies have estimated the impact of the MHPAEA or state parity legislation on demand for SUD treatment. Overall, the findings of these studies are mixed, with some studies finding no effects and others finding substantial differences in demand before and after legislation was enacted.
-
Oregon's 2007 Parity Law. Using enrollment and claims data, people in five Oregon commercial plans required to implement parity were compared to individuals in plans exempt from parity in Oregon and Washington. McConnell and others (2012) estimated that spending for alcohol treatment services was significantly higher among individuals in plans subject to parity provisions, relative to those exempt from parity. But there was no significant difference in drug abuse treatment service expenditures between the two groups.
-
Vermont's Parity Law. Rosenbach and colleagues (2003) examined claims/encounter data for Kaiser/Community Health Plan and Blue Cross/Blue Shield of Vermont, two health plans that covered almost 80 percent of the privately insured population at the time parity was implemented. Both plans made changes to their behavioral health service offering. One plan shifted from primarily using indemnity contracts to using a managed care approach. The other plan, which used managed care prior to parity, implemented an inpatient diversion program to increase use of partial hospitalization and group therapy and reduce use of inpatient care. Following implementation of Vermont's parity law, this study found a 16-29 percent decrease in the number of SUD treatment users per 1,000 members after parity was implemented.
-
Multistate Analyses of Parity Laws. We identified two studies that analyzed the impact of parity laws across multiple states. The first study used data from TEDS and found that parity reduced the probability that a person with an SUD treatment admission was uninsured by 2.4 percentage points. The study also found that states that mandated parity had increases in SUD treatment admissions (Dave and Muckerjee 2008). The second study used a quasi-experimental design and data from the N-SSATS surveys for 2000-2008 to compare outcomes in states that had implemented parity legislation to those with no change in parity requirements. This study found the state parity laws resulted in treatment increases of 9 percent in all specialty SUD treatment facilities and 15 percent in specialty SUD treatment facilities accepting private insurance (Wen et al. 2013).
-
Federal Employees Health Benefit (FEHB) Program. We identified one study that analyzed the effects of parity regulations on use of services under the FEHB program. Busch and colleagues (2013) used administrative data from FEHB and MarketScan for individuals with bipolar disorder, major depression, or adjustment disorders to compare spending for mental health and SUD treatment before and after the implementation of the 2001 FEHB parity directive. They found no difference in likelihood of service use after implementation of parity provisions for individuals enrolled in the FEHB program relative to a national sample of individuals in private insurance plans unaffected by parity.
-
MHPAEA Impact on Aetna-Insured Individuals. Busch and colleagues (2014) focused on the impact of the 2008 MHPAEA on Aetna-insured individuals. Aetna enrollees in ten states that had already implemented parity legislation for individuals in fully insured employer-sponsored plans were compared to individuals in self-insured plans that were newly required to implement parity under the MHPAEA. There was a modest increase in spending on SUD treatment per enrollee after implementation of parity, but no difference in treatment initiation or engagement.
Overall, the findings of these studies are mixed. Some studies found no change or a decrease is SUD treatment use. This result is not unexpected since insurers may implement care management approaches simultaneously with parity requirements. Other studies did find increased demand with estimates as high as a 15 percent increase when the analysis focused on only facilities accepting private insurance.
4. Legalization of Marijuana
Little is known about how the recent legalization of marijuana in Colorado and Washington will impact demand for SUD treatment. Lack of historical data from local marijuana markets impedes estimating the effects of this change. Legalization is likely to substantially increase consumption of marijuana; however it is unclear how legalization may affect demand for SUD treatment.
Increased Marijuana Consumption. Initially, legalization is expected to increase consumption substantially, primarily as a result of lower price (Caulkins and Lee 2012). Researchers used data from the National Epidemiologic Survey on Alcohol and Related Conditions, as well as data from NSDUH, and found that states with legal medical marijuana experienced significantly higher rates of marijuana use (Cerdá et al. 2012).
Change in Demand for Treatment. Increased consumption and potential changes in addiction rates may not directly translate into increased demand for treatment services. Historically, many referrals for treatment have come from the criminal justice system. A 2006 TEDS report found that 58 percent of admissions for marijuana treatment came from the criminal justice system (Marijuana Policy Project 2008). Thus, legalization may reduce referral to treatment. In contrast, Evans (2013) used 2010 NSDUH data to estimate how increased consumption and associated increases in addiction rates would affect treatment use. This study estimated that admissions would increase by 1.3-4.8 million. (These estimates assume between 13 million and 48 million individuals would begin using marijuana as a result of legalization and 10 percent would become dependent.)
Preliminary Findings from Recent Legalization Efforts. The availability of marijuana in Colorado has gradually changed over time. In 2009, changes in the acceptance of the state's medical marijuana law by federal and state officials led to a substantial expansion in medical marijuana use such that the number of medical marijuana cardholders went from 4,800 in 2008 to 41,000 in 2009. Next, in 2010, the Colorado Legislature passed HB-1284, which legalized medical marijuana dispensaries, marijuana cultivation operations, and manufacturers of marijuana edible products. By 2012, there were 532 licensed dispensaries in Colorado and over 108,000 registered patients. In November 2012, Colorado voters passed Amendment 64, which legalized marijuana for recreational use. This amendment allows individuals 21 years or older to grow up to six plants and possess/use/share one ounce or less. This amendment also permits marijuana retail stores, cultivation sites, edible factories and testing sites. The first recreational marijuana retail shop in Colorado opened January 1, 2014.
A study released in August 2014 (Rocky Mountain High Intensity Drug Trafficking Area 2014) looked at the impact of these policy changes in Colorado. Between 2006-2008 and 2009-2011, there was a 36 percent increase in adults' (26+ years) monthly marijuana use. However, this increase in use did not translate into an increase in demand for treatment. From 2005 through 2013, marijuana SUD treatment use from Colorado does not demonstrate a definitive trend.
Relatively few studies have examined the impact of marijuana legalization on treatment use, and the data used in the existing studies have significant limitations. Overall, the findings of these preliminary studies show a substantial increase in marijuana use associated with legalization, but the effect on treatment use is likely to be much more limited with even the possibility of a decrease in treatment use as criminal justice referrals decline.
5. Opioid Use Epidemic
Over the last decade there have been significant increases in disorders associated with pain relievers and heroin. Increases in these disorders may result in substantial increases in demand for treatment, especially MAT, in the next five years.
Reported heroin deaths have almost tripled since 2010 (HHS 2015a). As noted above, the number of individuals with heroin-related disorders ranged from 189,000 to 324,000 from 2002-2008, but in 2014 estimates indicate an increase to 586,000 individuals with heroin disorders (SAMHSA 2015e). From 2004-2014 the number of individuals receiving any treatment for a heroin-related disorder increased in parallel to the number of individuals with disorders (Figure II.15). Note that the number of individuals receiving treatment for heroin may be higher than the number of individuals meeting criteria for a disorder in the past year. This is due to receipt of treatment by individuals who no longer meet symptomatic criteria for a current disorder, but who continue to receive treatment such as methadone maintenance.
| FIGURE II.15. Number of Individuals with a Heroin Disorder and Number Receiving Any Heroin Treatment in Past Year, NSDUH 2004-2014 |
|---|
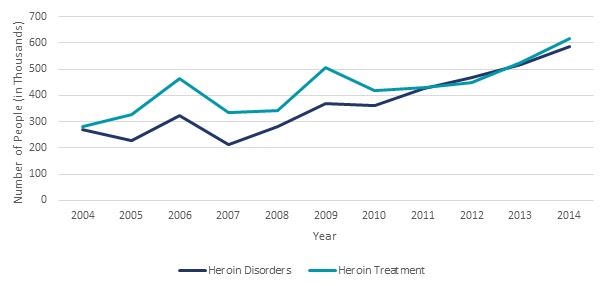 |
| SOURCE: Number of individuals with disorders obtained from SAMHSA 2015a, Table 7.40A; Number of individuals in treatment in 2004-2014 obtained from SAMHSA 2005, SAMHSA 2006, SAMHSA 2007b, SAMHSA 2008, SAMHSA 2009, SAMHSA 2010, SAMHSA 2011a, SAMHSA 2012a, SAMHSA 2013b, SAMHSA 2014b, SAMHSA 2015a, SAMHSA 2015e, respectively. |
Since 1999, although the amount of pain reported has remained unchanged, prescribing of painkillers and deaths from prescription painkillers have nearly quadrupled (CDC 2015b; CDC 2015c). The number of individuals with disorders related to pain relievers ranged from 1.4 million to 1.5 million from 2002-2005. This increased to 1.9 million by 2014. Like heroin, the number of individuals receiving any treatment for pain reliever related disorders has increased in parallel to the number of individuals with disorders from 2004-2014 (Figure II.16).
Federal, state, and local officials and health care professionals are researching, developing and implementing initiatives targeted at reducing opioid use, abuse, overdose and related-deaths (HHS 2015e). These efforts include developing guidelines for opioid prescribing, expanding use of Prescription Drug Monitoring Programs, expanding access to and use of naloxone and increasing access to and use of MAT for opioid dependence (HHS 2015e). There is some evidence that these efforts are working, as there have been increases in the supply of physicians waivered to prescribe buprenorphine for opioid dependence, particularly in states that expanded Medicaid (Knudsen, Lofwall, Havens and Walsh 2015), as well as numbers of individuals receiving buprenorphine treatment (SAMHSA 2014a). These initiatives are intended to reverse the current trends in opioid use; however the impact of these initiatives may not be observable for several years. Thus, increases in the number of individuals with opioid-related disorders may continue in the short-run resulting in increased demand for treatment. Also, since some components of the initiative to address the opioid epidemic encourage treatment use, further increases in demand are likely to be observed when these programs are fully implemented.
| FIGURE II.16. Number of Individuals with a Pain Reliever Related Disorder and Number Receiving Any Pain Reliever Treatment in Past Year, NSDUH 2004-2014 |
|---|
 |
| SOURCE: Number of individuals with disorders obtained from SAMHSA 2015a, Table 7.40A; Number of individuals in treatment in 2004-2010 obtained from SAMHSA 2011a, Figure 7.9; Number of individuals in treatment 2011-2013 obtained from SAMHSA 2014b, Figure 7.9. Number of individuals in treatment in 2014 obtained from SAMHSA 2015e. |
6. Trends in Government Spending and Coverage for SUD Treatment
Federal, state, and local government funding (not including Medicaid or Medicare spending) paid for 42 percent of all substance abuse treatment services in 2009. Medicaid and Medicare spending accounted for an additional 21 percent and 5 percent of treatment spending, respectively. Thus, shifts in government funding allocated to substance abuse treatment and decisions about SUD treatment coverage in Medicaid and Medicare can have a significant impact on total demand for SUD treatment. Thus, this section discusses key recent government funding allocations for SUD treatment, as well as government funding for prevention and workforce development that could influence the delivery of care. We first discuss federal funding, and then we address state and local funding.
a. Federal Funding
Annually, the Office of National Drug Control Policy (ONDCP) publishes estimates of federal spending intended to reduce the supply of or demand for illegal drugs, including illegal provision of alcohol. The most recent available estimates as of November 2014 are displayed in Table II.4.
| TABLE II.4. Federal Spending to Reduce Consumption of Illegal Substances | ||||||
|---|---|---|---|---|---|---|
| Spending Type | FY2010 | FY2011 | FY2012 | FY2013 | FY2014 (enacted) |
FY2015 (requested) |
| Spending in millions of dollars1 | ||||||
| Treatment | 7,544.5 | 7,659.7 | 7,848.3 | 7,888.6 | 8,825.1 | 9,596.8 |
| Prevention | 1,566.4 | 1,478.1 | 1,339.2 | 1,274.9 | 1,279.3 | 1,337.4 |
| Total demand reduction | 9,110.9 | 9,137.7 | 9,187.4 | 9,157.0 | 10,097.4 | 10,927.2 |
| Total supply reduction | 15,509.9 | 15,227.7 | 15,316.7 | 14,643.4 | 15,114.8 | 14,436.1 |
| Percentage change from previous year | ||||||
| Treatment | NA | 1.5 | 2.5 | 0.5 | 11.9 | 8.7 |
| Prevention | NA | -5.6 | -9.4 | -4.8 | 0.3 | 4.5 |
| Total demand reduction | NA | 0.3 | 0.5 | -0.3 | 10.3 | 8.2 |
| Total supply reduction | NA | -1.8 | 0.6 | -4.4 | 3.2 | -4.5 |
| SOURCE: ONDCP National Drug Control Strategy Budget 2015 Highlights, March 2014. NOTE:
|
||||||
After relatively little growth in spending or negative changes in spending levels for demand reduction between FY2010 and FY2013, there were substantial increases in spending to reduce demand enacted for FY2014; further increases were requested for FY2015. Below, we highlight some key spending categories.
-
Medicare and Medicaid Spending on SUD Treatment. The drug control budget treatment spending estimates include Medicaid and Medicare spending for SUD treatment, which increased 20 percent between FY2013 and FY2014 (from $3.62 billion to $4.30 billion) and for which an additional 16 percent increase is requested for FY2015 (to $5.07 billion). These increases are primarily associated with coverage expansions due to the ACA provisions discussed above (ONDCP 2014).
-
Substance Abuse Treatment Block Grant (SATBG). Funding was $1.71 billion in 2013 and rose 6.4 percent to $1.82 billion in 2014. Funding is expected to remain constant at $1.82 billion in 2015 (HHS 2015b).
-
Addiction Treatment within Community Health Centers. In November 2014, the HHS Health Resources and Services Administration announced that $51.3 million in ACA funding had been allocated to support establishing or expanding behavioral health services at 210 health centers in 47 states, the District of Columbia, and Puerto Rico. Earlier in 2014, HHS awarded $54.5 million in ACA funding for 223 other health centers to expand behavioral health services (HHS 2015c).
-
Increase Peer Professionals. SAMHSA planned to spend $10 million in FY2015 to fund a new workforce program to increase the number of trained peers, recovery coaches, mental health/addiction specialists, prevention specialists, and pre-master's-level addiction counselors (HHS 2015b). Funding was not allocated for this program in FY2015. Funding has again been requested for FY2016 (HHS 2015d).
-
Screening, Brief Intervention, and Referral to Treatment (SBIRT). Public Health Service evaluation funds were planned to give grants to providers to integrate SBIRT into medical treatment settings in 2015. Thirty million dollars in spending was planned for FY2015 (ONDCP 2014). Funding was not allocated for this program in FY2015. Funding has again been requested for FY2016 (HHS 2015d).
-
Department of Education. The U.S. Department of Education planned to increase funding for prevention activities from $39.5 million enacted in FY2014 to $102.1 million requested for FY2015. These funds would be used to improve school climates by reducing drug use and violence and improving school safety (ONDCP 2014).
b. State and Local Funding
Data on state and local SUD treatment expenditures are not systematically collected. The SAMHSA spending estimates initiative estimates state and local spending based on provider source of payment data from survey and claims datasets. State and local SUD treatment spending increased at a substantial annual rate from 1986 through 2004 (Table II.5), and the share of all SUD treatment spending represented by state and local funding increased from 27 percent to 34 percent. However, between 2004 and 2009, the rate of increase in state and local SUD treatment spending slowed and the share of SUD treatment spending represented by state and local sources declined to 31 percent (SAMHSA 2013a).
| TABLE II.5. State and Local Spending on Substance Abuse Treatment, 1986-2009 | |||||
|---|---|---|---|---|---|
| Spending Type | 1986 | 1992 | 1998 | 2004 | 2009 |
| Total expenditures (in millions) | 2,487 | 3,647 | 5,019 | 7,145 | 7,639 |
| Annualized percent change since prior estimated year | NA | 6.6 | 5.5 | 6.1 | 1.3 |
| Proportion of all SUD treatment spending | 27 | 27 | 34 | 34 | 31 |
| SOURCE: Mathematica analysis of SAMHSA 2013c, Table A8 and page 38. NOTE: Federal block grant funding administered by the states is not included in these estimates as this funding is considered federal spending. NA = Not applicable. |
|||||
State Medicaid agencies may play a substantial role in encouraging increased use of SUD treatment services. States that expanded their Medicaid programs under the ACA have accepted large numbers of childless adults into their Medicaid populations and these individuals are expected to have greater need for SUD treatment services relative to the traditional Medicaid population. States are required to provide SUD treatment benefits to Medicaid expansion populations in parity with physical health benefits. We found only one report that addressed this issue. Boozang et al. (2014) reviewed current and planned approaches to substance abuse benefit delivery in six states using managed care delivery systems: Arizona, Maryland, Massachusetts, New Mexico, New York, and Washington. This review found that states are substantially modifying, or replacing current approaches to SUD treatment benefit management. Some states are moving SUD treatment into integrated managed care models with physical health benefits, mental health benefits, or both. States see these arrangements as supporting better care integration. States are investing in substance abuse provider capacity particularly programs that provide less costly alternatives to inpatient care. They are also reaching out to providers with little experience with Medicaid. States are beginning to develop strategies to integrate Medicaid and Medicaid managed care organization services for individuals with SUDs with social services. They are also beginning to consider how to provide care to individuals coming out of jail or prison, who are more likely to have SUD treatment needs than the general population and may be eligible for Medicaid for the first time.
While the current available literature on state Medicaid agency response to ACA provisions is limited, Andrews et al. (2015b) noted that state Medicaid programs played an important role in transforming the mental health treatment system over the last 50 years as Medicaid took a larger role in financing mental health treatment. This study suggests that the transformations Medicaid programs encouraged in the mental health system might offer lessons for how Medicaid's increased role in addiction treatment could offer an opportunity improve the treatment system. Specifically, flexibility in Medicaid service coverage could be used to tailor services to the specific needs of the population in need of addiction treatment. Also, alternatives to inpatient care might be developed and licensure standards could be improved. The HHS Centers for Medicare and Medicaid Services (CMS) is encouraging states to make reforms and has sent a letter to State Medicaid Directors in July 2015 to "inform states of opportunities to design service delivery systems for individuals with substance use disorder (SUD), including a new opportunity for demonstration projects approved under Section 1115 of the Social Security Act (Act) to ensure that a continuum of care is available to individuals with SUD." CMS also chose SUD treatment as the first area of focus for its Innovation Accelerator Program which provides technical assistance and expert resources to states engaged in system redesign. Overall there are efforts to encourage reform, but the degree to which these efforts will transform the treatment system and encourage treatment entry is unclear. Also limited provider acceptance of Medicaid insurance may be an impediment to expanding Medicaid coverage for SUD treatment. Provider acceptance of Medicaid is addressed in Section III.B.2.
7. Summary
Although trends in SUD prevalence and treatment receipt have been relatively constant for the last decade, a substantial shift in these trends is likely to be observed between 2014 and 2018. While federal, state, and local funding for SUD treatment (other than through Medicaid and Medicare) are likely to remain relatively stable, the ACA could result in a substantial increase in demand for SUD treatment. Additional increases in demand may result from MHPAEA and efforts to reduce opioid use and its adverse effects. Thought leaders in the SUD treatment field identified the recent increased recognition of SUDs as a valid health condition as a key trend affecting the field. Changes in the current perceptions of SUD treatment among individuals with SUDs, integration of SUD treatment into mental health and primary care settings, and changing views on SUD screening and referral to treatment among primary care providers have the potential to influence trends in demand for services. However, the effects of these changes are likely to occur gradually because perceptions are likely to change slowly and developing integrated care models requires substantial upfront training and investments.
III. Supply of Substance Use Disorder Treatment Providers
This section discusses current and future trends in workforce supply. Appendix B provides a more detailed overview of past research assessing the size and composition of the SUD treatment workforce.
A. Current Supply of Substance Use Disorder Treatment
Provision of SUD treatment requires a mix of counselors, medical professionals and support staff. The level and type of staff needed varies across care types and settings. Intensive and standard outpatient treatment requires a variety of workers, such as nurses, counselors, physicians, psychologists, therapists, and social workers. A partial hospitalization program provides outpatient individual and group counseling in an environment with medical services and requires nurses and physicians for medical care. Inpatient treatment requires a physician, or possibly a physician assistant or nurse practitioner, to see patients on a daily basis; other workers, such as social workers and occupational therapists, are also typically present. Residential treatment has constant supervision, but does not require as high a level of staffing as inpatient treatment; counseling is provided and physicians see patients on an intermittent basis. This section attempts to characterize this multifaceted workforce based on limited available information. First we address the overall size and composition of the workforce. Then, we discuss training and certification requirements and the pipeline for entering the workforce. Finally, we discuss observed disparities in care access.
1. What is the Size of the SUD Treatment Workforce?
Describing the size and composition of the SUD workforce is complicated. The SOC system that is used by the BLS to categorize workers for the purpose of collecting data on employment does not capture SUD treatment providers as a category separate from other types of providers. A variety of professionals provide SUD treatment, including certified addiction specialists, medical and primary care providers, and support staff such as case managers and peer specialists. These professionals are identified in numerous occupational categories and these categories are not specific to SUD treatment professionals. Although the size of the SUD workforce is not systematically tracked, some studies have examined specific segments of the SUD workforce.
-
Workforce in Specialty Treatment Facilities. The most recent data available on the size of the SUD workforce is from the Information Services Survey (ISS), which collected data on the workforce at specialty SUD treatment facilities in 1999 (Lewin and NORC 2000). The data collected in this survey identified 67,400 workers directly involved in psychosocial treatment services, an additional 80,000-90,000 medical and administrative staff, and 17,000 other behavioral health professionals within specialty SUD treatment facilities, for a total of about 170,000 staff members (Dilonardo 2011). The sample of facilities upon which these estimates are based was small. The Alcohol and Drug Services Study (ADSS) collected data on the SUD treatment workforce about three years before the ISS, in 1996. These data indicated about 88,000 counselors, almost 50,000 medical professionals, and 65,000 other staff, for a total of about 200,000 staff members, constituted the workforce at the time of the study (SAMHSA 2003). Although these two studies arrived at somewhat similar conclusions, it is difficult to directly compare them, given differences in how staff were defined. Both studies are also quite dated, but we could not identify a more recent source.
-
Size of the Broader SUD Workforce. The Institute of Medicine (IOM) took a broader view to measure the SUD workforce in 1997. The IOM estimated over 3 million professionals who may provide SUD treatment across a range of medical and social service settings. These professionals included primary care physicians, nurses, physician assistants, and marriage/family counselors, but the IOM noted that only about 40,000 of them (1 percent) were certified in addiction treatment.
2. What are the Characteristics of the Workforce?
The Vital Signs survey is the most recent nationally representative survey collecting information on the composition of the direct care SUD workforce. The survey was conducted for SAMHSA by the Addiction Technology and Transfer Center (ATTC) Network (Ryan et al. 2012). It was fielded between November 2011 and May 2012. It surveyed a nationally representative sample of clinical directors at specialty SUD treatment facilities and identified characteristics of clinical directors and direct care staff:
-
Gender. The majority of clinical directors and direct care staff were female (59 percent and 64 percent, respectively).
-
Age. The majority of clinical directors were age 50 or older (60 percent). In contrast, the majority of direct care workers were younger than age 45 (56 percent).
-
Race. Most clinical directors and direct care staff were White (86 percent and 64 percent, respectively).
-
Educational Attainment. Eighty-one percent of clinical directors had a bachelor's degree or higher and a majority of direct care staff had a bachelor's degree or higher (63 percent).
-
Licensure. Fifty-five percent of clinical directors were licensed clinical supervisors. A majority of direct care staff are currently licensed (54 percent).
Results for the Vital Signs survey were not available at the state level. Given the variation in workforce requirements by state, there may be considerable variation in these characteristics at that level.
3. What Training and Certification is Required of the SUD Workforce, and How Does it Vary by State?
The three experts interviewed for this report all cited variation across states in SUD workforce policies as an obstacle to characterizing the workforce and associated trends and concerns at the national level. Experts have recommended that career paths for the treatment and recovery workforce and core competency standards for professions be adopted at a national level (Whittier et al. 2006). Following this recommendation in 2011, SAMHSA issued a report defining a national standard for the scope of practice and career ladder for SUD counselors. The establishment of a standard career ladder is intended to increase employee retention, create performance incentives, and give workers a career development plan (SAMHSA 2011b). Under this standardized classification scheme, there are five levels of counseling staff:
-
Substance Abuse Technician. Typically requires a high school diploma or a general equivalency diploma (GED), and practices under the supervision of a Category 3 or 4 counselor.
-
Category 1 Counselor: Associate SUD Counselor. Typically requires an associate's degree and practices under the supervision of a Category 3 or 4 counselor.
-
Category 2 Counselor: SUD Counselor. Typically requires a bachelor's degree and practices under the supervision of a Category 3 or 4 counselor.
-
Category 3 Counselor: Clinical SUD Counselor. Typically has a master's or other post-graduate degree but works under the supervision of a Category 4 counselor.
-
Category 4 Counselor: Independent SUD Counselor. Typically has a master's or other post-graduate degree and is licensed to practice independently.
The National Association of State Alcohol and Drug Abuse Directors (NASADAD 2013) used this scheme to compare licensing and credentialing requirements for the SUD workforce across the states in 2011.18 They found all states and the District of Columbia regulated the licensing or certification of individuals who provided SUD treatment. A majority of states (25) had an agency or bureau responsible for licensing or credentialing multiple types of health care providers including SUD treatment professionals. Other states (20) aligned with a national credentialing body, either the IC&RC or the National Certification Commission for Addiction Professionals. The remaining states gave this responsibility to the agency responsible for administering SAMHSA's substance abuse prevention and treatment block grant funding, commonly referred to as the single state agency (SSA).
When the licensing or credentialing requirements of these state entities were reviewed, only four (Alabama, Alaska, Louisiana, and Pennsylvania) had counselors certified at all five levels included in the SAMHSA career ladder. All states and the District of Columbia had an equivalent certification for Category 3; 28 states had a Category 4 certification; 31 states had a Category 2 certification; and 23 states had a Category 1 certification. Twelve states had an equivalent certification to SAMHSA's substance abuse technician.
Certain credentialing requirements were consistently found across all states. All state credentials require a minimum level of education, supervised work experience, and a standardized test (NASADAD 2013).19 Although all states require supervised hours prior to independent practice, the number of hours varies (IOM 2006).
The recent literature regarding state licensing and credentialing we identified included limited detail on the state specific requirements. We did not find any literature analyzing the relationship between state licensing and credentialing policies and the size and composition of the SUD workforce. The discussion in this section focuses on counselors who represent only part of the SUD treatment workforce. Medical professional and other support staff are also an important part of the workforce. Literature on career paths, training, and certification requirements for these professionals specific to SUD treatment provision was not identified during the literature review for this study.
4. What is the Pipeline for a Qualified Workforce? How do People Become Qualified?
Traditionally, experience rather than formal education has been a large part of the training process for SUD treatment providers. SUD counselor training has primarily followed an apprentice model. Those states that offer counselor certification generally required more hours of supervised work experience and less formal education for SUD counselors relative to mental health counselors (Dilonardo 2011; Kerwin et al. 2006). Recently, there is a trend toward more formal education for the workforce (Whitter et al. 2006).
These higher rates of educational attainment may not correspond to greater knowledge in the SUD treatment field, as many graduate programs in social work and psychology do not provide specialized training in SUDs. Community colleges provide much of the specialized academic training in SUDs, with many counselors with master's and doctoral degrees indicating their SUD-specific training came from associate's degrees or two-year certification programs (McCarty 2002; IOM 2006). A lack of specialized graduate training continues to limit the professional development of the field (McCarty 2002).
The experts who were interviewed for this study from NAADAC and IC&RC noted the trend toward a more highly educated workforce and professional licensure; however the experts indicated that these trends may not be associated with improvements in the quality of SUD care. The increases in education and licensure are associated with insurer reimbursement and state licensure requirements. SUD treatment professionals may pursue graduate-level training because it helps them obtain mental health credentialing and provides better opportunities for employment and insurance reimbursement. Such advances in education and the opportunity it affords may result in exit from the SUD treatment field. The experts also expressed concern that more highly educated workers, most of whom graduate from programs that are not specifically focused on addiction, may not have adequate addiction-specific training.
Many SUD clinical directors and direct care staff are recruited from the recovery community with about one-third of both clinical directors and direct care staffing reporting being persons in recovery (Ryan et al. 2012). There has been a large effort to develop training for peer specialists (Hyde 2013). According to a 2010 national survey by the National Association of State Mental Health Program Directors, out of 22 responses from states that had Medicaid reimbursement for peer services, seven states required a certification or licensing process, nine required passing an exam or other certification, 11 required completing a training curriculum, ten required a high school diploma or GED, and seven required that the peer specialist use mental health services (Daniels et al. 2011).
Overall, the path to becoming an SUD treatment professional is multifaceted. Individuals may enter the field with varying levels of educational attainment in fields such as social work and psychology. Much of the specialized addiction training occurs through apprenticeship or in associate's or two-year certification programs.
5. Observed Variation in Provider Capacity
National estimates of capacity can mask substantial variation by urbanicity of residence or facility financing.
Level of Urbanicity. Jackson and Shannon (2011) reviewed the literature on barriers to treatment access for rural residents and found: (1) rural residents are less likely to have access to health insurance; (2) there is a shortage of providers in rural areas; and (3) people in need of treatment in rural areas must travel longer distances to facilities. Cummings and colleagues (2014) used the 2009 N-SSATS and the Area Resource File to look at access to outpatient SUD treatment for Medicaid enrollees. This study found that rural counties are less likely than urban counties to have at least one outpatient SUD facility that accepts Medicaid. Lenardson and Gale (2007) compared SUD treatment offered in rural and urban counties using variables in the 2004 N-SSATS. Comparing the number of facilities and treatment beds to population size revealed that rural areas actually had a larger number of treatment facilities, but the facilities had fewer inpatients beds available per population. In addition, few facilities in rural counties not adjacent to a metropolitan area provided detoxification, transitional housing services, or intensive outpatient care. Nearly all opioid treatment programs (OTPs) were located in urban areas.
Facility Financing. Two recent studies identified differences in the care delivered by both publicly and privately-funded treatment facilities. Abraham and colleagues (2013) found that publicly funded centers were less likely to have a physician on staff and prescribed fewer medications. Another study found that staffing levels significantly differed between private for-profit, private non-profit, and public treatment programs, with public programs offering fewer hours per client and having larger caseloads (Lemak and Alexander 2005).
Overall, the available research has identified substantial variation in treatment supply by urbanicity of residence and facility financing.
B. Trends and Policies Affecting Future Supply of Care
This section first looks at the available evidence for assessing future supply trends and funding sources. Then it looks at the potential to increase supply through care integration, innovative care models or other approaches. Lastly, the section addresses efforts to expand MAT.
1. Trends in the Size of the Workforce
The BLS, which develops employment statistics that include projections for employment by occupation, provides no specific category just for SUD treatment professionals. However, two categories encompass a substantial proportion of the SUD treatment workforce: (1) substance abuse and behavioral disorder counselors; and (2) mental health and substance abuse social workers. The share of these categories represented by SUD treatment versus mental health professionals is unknown. BLS project employment in these categories to grow at a faster rate than the average for all occupations (BLS 2015a, 2015b) because addiction and mental health counseling services will be increasingly covered by insurance policies, and health insurance coverage expansion will increase demand for health care services in general (BLS 2015a). BLS also notes that drug offenders are increasingly being sent to treatment rather than jail, thereby increasing treatment program use (BLS 2015a, 2015b).
These BLS projected growth rates diverge from past employment trends in these occupations. Nationally, employment of substance abuse and behavioral disorder counselors declined 3 percent between 2008 and 2011. However, in the most recent two years observed, 2011 to 2013, employment growth ranged from 4 percent to 5 percent per year. Likewise, employment of mental health and substance abuse social workers declined 16 percent between 2008 and 2012. Then, between 2012 and 2013, employment of these professionals grew by 1 percent (BLS 2015c).
Expert interview respondents from NAADAC and IC&RC had no available data on trends in training program output. The NAADAC representative reported anecdotally that availability of training programs has increased over the past ten years, with a small increase in addiction-specific programs. One IC&RC state board representative reported that their state started a counselor training program in 2006 as a result of a desperate need for training programs in the state. Since inception, the program has had over 200 graduates; however the number of individuals completing training annually has decreased recently from approximately 50 to around 36. Another state board representative noted that there has been an increase in training programs over the past few years, particularly programs at the graduate level. Finally, another state board representative indicated a recent increase in individuals with online degrees. Overall, the available evidence for assessing change in the size of the workforce is limited, but suggests, at most, a modest increase in training.
Many SUD treatment providers have traditionally relied on grant funding. There is concern that providers are not prepared to accept the Medicaid and private insurance coverage that potential clients may obtain as a result of ACA insurance expansions. The N-SSATS (SAMHSA 2014a) annually asks specialty SUD treatment facilities what forms of payment they accept for services. The facilities represented in the N-SSATS are a census of public and private facilities with SUD treatment programs including hospital, residential, and outpatient treatment providers. These facilities account for the majority of SUD treatment spending in the United States. Table III.1 identifies the percentage of these facilities that reported accepting private health insurance and Medicaid coverage in 2013. Over one-third of facilities did not accept private insurance, and a larger percentage (41 percent) did not accept Medicaid. For-profit and federal facilities were the least likely to accept Medicaid.
General health care settings and solo practitioners are generally not represented in the N-SSATS. A recent study by Decker (2013) looked at acceptance of new Medicaid patients by community health centers and office-based providers in 2011-2012. Community health centers were the most likely to have accepted new Medicaid patients (94 percent). Most primary care physicians (67 percent) accepted new Medicaid patients. In contrast acceptance of new Medicaid patients among psychiatrists was low (44 percent).
| TABLE III.1. Percentage of Facilities Accepting Indicated Insurance Type, N-SSATS 2013 | |||
|---|---|---|---|
| Number of Facilities (%) |
Proportion Accepting Private Health Insurance |
Proportion Accepting Medicaid |
|
| Total | 14,148 (100) | 65.4 | 58.9 |
| Private non-profit | 7,820 (55) | 66.2 | 68.8 |
| Private for-profit | 4,575 (32) | 64.3 | 40.7 |
| Local, county, or community government | 739 (5) | 67.0 | 76.9 |
| Ownership | |||
| State government ownership | 351 (2) | 66.7 | 71.8 |
| Federal Government ownership | 370 (3) | 63.8 | 23.5 |
| Tribal government ownership | 293 (2) | 57.0 | 63.8 |
| SOURCE: Estimates obtained from SAMHSA 2014a. | |||
Research on acceptance of Medicaid by physicians has identified several reasons physicians chose not to accept Medicaid (Ubel 2015). Most significantly Medicaid payment rates tend to be substantially lower than payment rates offered by private insurance and Medicare for the same services. Second, providers complain of slow reimbursement by some state Medicaid programs and substantial administrative burdens. Finally, providers note that Medicaid patients tend to require more time and attention than the average patient. Some SUD treatment providers may choose not to accept Medicaid based on these issues.
However, other providers who might be interested in accepting Medicaid may face barriers to accepting Medicaid and private insurance. First, they must meet the credentialing requirements established by these insurer and the requirements will vary across insuring organizations. This may not be straightforward as many SUD treatment providers do not hold the professional degrees or medical licenses needed for insurer-approved reimbursement (Andrews et al. 2015a). In 2012, only 54 percent of direct care staff were currently licensed and 63 percent held a bachelor's degree or higher (Ryan et al. 2012). A second potential barrier for providers is the need to contract with, meet contractual obligations (for example, utilization review and quality monitoring requirements) and accept risk from multiple insurers. This may place a significant burden on smaller organizations. Finally, lack of sophisticated information technology systems may act as a barrier to accepting payment from Medicaid and private insurers. Information systems are needed to bill multiple payment sources and comply with standards for electronic health records. A 2012 survey found that the majority of addiction treatment providers did not have sufficient information technology systems needed to contract with insurers under post-ACA implementation (Andrews et al. 2015a).
3. Potential for Expanding Supply Through Care Integration
Historically, SUD treatment services have been provided in specialty treatment facilities, and the level of integration with physical and mental health treatment services has been limited (Pringle et al. 2006; Ducharme et al. 2007; IOM 2006). The ACA promotes integrating SUD treatment with other types of care (Croft and Parish 2013). The ability of consumers to receive SUD treatment in non-specialty settings has the potential to increase the number of people receiving care by improving accessibility and reducing stigma (Buck 2011). Although the ACA offers incentives to integrate SUD treatment into other health care settings, a number of barriers to integration remain (Padwa et al. 2012; Brunette et al. 2008; Sterling et al. 2010; Croft and Parish 2013) with lack of professionals with adequate training to provide SUD treatment being one of the most significant obstacles.
A number of ACA provisions address the service delivery system and payment structure in an attempt to integrate SUD treatment into mainstream medical care:
-
Creating Care Coordination Entities. The ACA facilitates the creation of Medicaid health homes, coordinated care entities for dual Medicare-Medicaid beneficiaries, accountable care organizations, and patient-centered medical homes (Humphreys and Frank 2014). Under the ACA, care management, health promotion, transition care, referrals to support services, and technology used to link together services will be reimbursed by Medicaid at a 90 percent federal matching rate for the first two years after a health home is created (Barry and Huskamp 2011).
-
Provision of Funding for Integration. The ACA added $50 million in grants to an existing SAMHSA program for coordinated and integrated services through the co-location of primary and specialty care in community-based behavioral health sites (Druss and Mauer 2010). The program targets people with serious mental illnesses who have or are at risk of co-occurring physical health care challenges, but funds may also be used for screening and treatment of co-occurring SUDs (SAMHSA 2012).
-
Increased SUD Treatment at Health Centers. States that cover health centers in their Medicaid plans must reimburse centers at cost for SUD treatment, removing restrictions that states may have considered previously in determining health centers' involvement with SUD treatment (Buck 2011).
Although there are incentives to increase integration, significant obstacles are likely to slow progress toward integrated care:
Developing Integrated Care Models. Care integration for SUDs is not as advanced as care integration for depression and other common mental disorders. Because there is limited experience with care integration for SUDs, providers and policymakers are in the process of developing and evaluating potential approaches. SUD treatment integration approaches might build on recent experience integrating screening and treatment for mid-level anxiety and depression into the primary care setting (Padwa et al. 2012). U.S. Department of Veterans Affairs, known for leading in integrating SUD services with other care, may also have experience to share (Humphreys and McLellan 2010).
Financial Barriers. Much of the funding for the SUD treatment system comes from state, local, and federal sources that are distinct from the funding sources for general health care treatment. Integration of services will require coordination of SUD and general health funding. It will also require SUD treatment organizations to develop relationships with entities representing new funding sources. Many specialty SUD treatment facilities do not accept Medicaid, Medicare, or private insurance. In addition, despite parity legislation and the ACA, these insurance programs provide limited coverage of some community-based services, and the MHPAEA does not require that insurers cover all types of SUD treatment services (Dilonardo 2011). State policies that provide separate agencies focused on behavioral health or that contract with distinct entities to provide physical and behavioral health services may also be a barrier to integration. Some states have made efforts to address these potential barriers (Commonwealth Fund 2015).
Lack of Trained Professionals. The majority of primary care, mental health, and SUD treatment professionals are not trained in care integration (Dilonardo 2011). Effective techniques for training workers are still in development (Marshall et al. 2012; Madras et al. 2009; Bonham 2009). Only a small number of physicians, psychologists, and other health care workers have received extensive training in dealing with SUDs (Humphreys and McLellan 2010). Likewise, integrated health care providers will need to hire or contract with SUD treatment professionals to provide specialized care that cannot be incorporated into general practice. This is expected to increase demand for SUD professionals outside the specialty SUD treatment sector.
Although the ACA offers incentives to integrate SUD treatment into other health care settings, a number of barriers to integration remain. Lack of professionals with adequate training related to integration and provision of SUD treatment generally is likely the most significant obstacle.
4. Potential for Increasing Supply Through Innovative Care Models
Treatment professionals provide a range of SUD treatment modes (for example, regular outpatient, intensive day treatment, MAT) in various care settings (outpatient, residential, and inpatient). Client needs and the range of services offered vary substantially across facilities. This variation has important implications for the number and type of professionals each facility will demand in the labor market to fulfill its staffing needs. Although states have limited requirements for facility staffing, the type of staff available at a facility has important implications for the services a facility can provide. Thus, facilities may restrict the services they provide based on the availability of professional staff. The number and type of staff used to provide services at a given facility also has implications for the efficiency of service provision. There may be potential to employ the current workforce more effectively to increase supply of services.
SUD Staffing Requirements. There are limited standards for SUD treatment facility staffing. A study of 37 states (NASADAD 2013) found that only 19 states have standards for program directors. More often, in 80 percent of states, there are requirements for a medical director. The medical director typically does not need to be a medical doctor unless the facility is an OTP or a hospital. Only six states require that a prescribing professional be on site at least weekly in facilities other than OTPs, detoxification facilities, or hospital-based programs. Twenty-nine of the 37 states responding to the survey required a counseling staff supervisor. In addition, about half of the 37 states had standards for the ratio of counselors to clients. Thus, SUD treatment facilities have substantial flexibility to select the number and types of professionals they employ.
Broad Variety of Professionals Employed. Staffing for SUD treatment depends on the types of services a center offers, but, typically, core staff include a program director or clinical supervisor, SUD counselors, and therapists. These individuals are responsible for intake, screening, assessment, case management, SUD treatment, providing specialized education, planning continuing care, keeping records, and writing reports. Additional staff may include psychiatrists, psychologists, pediatricians, adolescent medicine specialists, internal medicine specialists, family practitioners, and nurses. Staffing may also include recreational therapists, occupational therapists, disability specialists, outreach workers, home intervention workers, continuing care workers, cultural advisors/spiritual leaders, students/interns/fellows, vocational specialists, and case managers (Center for Substance Abuse Treatment 1999). There is some overlap in the scope of practice for different levels of counseling staff, indicating some flexibility in terms of who does which task (SAMHSA 2011b). There may be opportunity to expand the capacity of the workforce by more efficiently using different levels of staff within facilities (Whitter et al. 2006).
Staffing Norms by Facility Characteristics. The type of professional present at a facility depends on the type of care offered (Johns Hopkins Medicine 2014). Lemak and Alexander (2005) identified factors that influence staffing levels. They found that managed care activity influenced the number of active cases managed by each full-time treatment staff member but not number of treatment hours per client. Programs accredited by the Joint Commission, which accredits and certifies more than 20,500 health care organizations and programs in the United States, offered more treatment hours per client.
Use of Peer Staff. Peer recovery support services have become more common and accepted in SUD treatment in recent years. A review of studies done on the effectiveness of peer staff indicated that peers worked with patients in both individual and group settings (Reif et al. 2014). The use of peer staff is now so widespread that it is often a requirement in state and federal grant applications (Ashcraft and Anthony 2012). One study found that 41 percent of clinical directors in addiction agencies had attempted to recruit and employ peer workers in the past year (Ryan et al. 2012). As of July 2014, 32 states and the District of Columbia, allow peer support to be a Medicaid-billable service (Miller 2014), and there is a push to get more peer staff trained to provide support services in behavioral health.
State and federal regulations allow facilities substantial flexibility in staffing. SUD treatment facilities use a range of professionals to deliver services to patients. Each type of professional has a limited scope of practice. If SUD treatment facilities have difficulty hiring certain types of professionals, they can continue operating, but may be forced to correspondingly limit the types of services they can offer clients. Overall, the available information is too limited to assess how alternative staffing models could be used to expand capacity.
5. Other Approaches to Increase Supply
We identified three recent studies that reported on methods to increase the supply of SUD treatment workers. These reports addressed recruiting new workers into the field and retaining current workers.
The Annapolis Coalition with funding from SAMHSA undertook a multiyear effort consulting numerous experts and stakeholders to develop approaches to strengthen the behavioral health workforce (Hoge et al. 2013). They identified best practices in recruiting and retention. These include early exposure to career opportunities in this field and the special populations served, mentoring by behavioral health specialists, training stipends, minority fellowships, loan repayment programs, and developing career ladders. Paying wages commensurate with the education, experience, and the level of responsibility of the position was identified as a key factor for recruiting and retention.
An earlier report (Whitter et al. 2006) aimed at strengthening the addiction treatment and recovery support workforce recommended similar strategies, including training and loan repayment programs; developing a national credentialing standard and career ladder; recruiting students at educational institutions; streamlining administrative burdens through information technology; improving the marketing strategies used for recruiting; and reducing stigma associated with working in the field.
The Vital Signs survey, a nationally representative survey, had SUD treatment program clinical directors identify retention strategies they thought were most successful (Ryan et al 2012). These included provision of health care benefits, implementation of a supportive culture, and access to ongoing training. They also reported strategies to improve recruiting, such as recruiting students at educational institutions and from the recovery community.
Although the literature includes many suggested approaches for increasing the supply of SUD professionals, there was no information documenting the potential impact of implementing the suggested strategies.
6. Efforts to Expand the Use of Medication-Assisted Treatment
MAT combines the use of evidenced-based behavioral therapies with the prescription of HHS Food and Drug Administration approved medications. MAT has been demonstrated to be clinically effective and cost effective (Mann et al. 2015; Baser et al. 2011). While there is strong evidence that use of MAT in managing SUDs provides substantial cost savings there has not been widespread adoption of this approach. Knudsen et al. (2011) analyzed data for privately-funded facilities in 2007-2008 and found that less than a third had adopted MAT. Even when the sample was limited to facilities that had access to a physician less than 42 percent had adopted any given form of MAT. Within the set of facilities that had adopted MAT only a limited percentage of patient used this treatment approach.
There are a number of barriers that limit the use of MAT according to SAMHSA-HRSA Center for Integrated Health Solutions (2014). These barriers include lack of available prescribers, agency regulatory policy that restricts or forbids MAT use, workforce attitudes, insurer limits on dosages prescribed (i.e., annual or lifetime medication limits), insurer authorization requirement, requirements that behavioral therapies be tried first, lack of support staff for providers administering MAT, and inconsistent credentialing or licensure requirements for counseling staff to be reimbursed for MAT related services. Cunningham et al. (2009) identified somewhat different obstacles to widespread adoption of MAT. These barriers include regulatory restrictions, lack of access to medical personnel trained in delivering such treatment, and physician reluctance. In a study focused on the criminal justice system Friedman et al. (2012) identified lack of qualified medical staff was a reason for lack of MAT in the criminal justice system (Friedman et al. 2012). Roman et al. (2011) asserts that limited knowledge about SUD treatment medications among the public hinders use. Mass media advertising of prescription medications for other health conditions has accelerated use of those medications. Broader public knowledge of the benefits of MAT for SUDs could encourage more widespread use.
Mark et al. (2015b) demonstrated how insurance coverage restrictions can be a substantial barrier to provision of MAT to Medicaid insured individuals. They analyzed data from 2013 Medicaid pharmacy documents, 2011 and 2012 Medicaid state drug utilization records, and a 2013 American Society of Addiction Medicine survey. Only 13 state Medicaid programs included all medications approved for alcohol and opioid dependence on their preferred drug lists. The most commonly excluded were extended-release naltrexone (19 programs), acamprosate (19 programs), and methadone (20 programs). Almost all Medicaid programs required prior authorization for combined buprenorphine-naloxone and had lifetime limits.
Many of the barriers to expansion of MAT are related to the workforce. The number of medical staff qualified to provide MAT services and the staff supporting them needs to increase for provision of MAT to expand. In addition, workforce attitudes toward MAT need to change to attain widespread adoption. Lastly, consistent credentialing and licensure requirements across states and insurers for professionals providing MAT services are needed. The HHS Opioid Initiative aims to improve access and address some of these issues, and despite all of these obstacles, the ACA has resulted in expansions in the number of physicians waivered to prescribe Buprenorphine (Knudsen, Lofwall, Havens and Walsh 2015).
IV. Comparison of Demand for and Supply of Substance Use Disorder Treatment
In this section, we first review indicators of supply adequacy to assess the current supply of SUD treatment providers. Then, we compare trends in supply and demand noted above and assess the implications of these trends for supply adequacy within the next five years.
A. Indicators of a Current Shortage
Below, we review multiple indicators of supply adequacy and assess their implications for a current shortage of SUD treatment professionals.
1. Facility Operating Capacity
According to SAMHSA (2014a) analysis of N-SSATS data, 8.8 percent and 18.2 percent of residential and inpatient facilities, respectively, were operating above capacity in 2013 (Table IV.1).20 Similarly, 6.2 percent of outpatient facilities were operating at 6 percent or more above capacity. An additional one-third of outpatient facilities were operating at 95-105 percent of capacity. Likewise, 21 percent of facility directors reported in 2012 that the caseloads for direct care staff at their facilities were too large (Ryan et al. 2012). These data indicate there was a substantial subset of facilities operating at or above capacity prior to implementation of the ACA.
2. Wages
In an efficient market, a shortage of qualified workers in a given profession is commonly associated with increasing wages. BLS data on trends in mean hourly wages for behavioral health professionals in the categories including SUD treatment providers have been stable (Table IV.2), suggesting an equilibrium between supply and demand given the current level of funding provided for SUD treatment services. However, there is the possibility that SUD provider wages are determined in a monopsony market. State and local governments control approximate 63 percent of resources supporting SUD treatment allowing them market power that may not allow wages to increase. Increases in insurance-related funding associated with the ACA and MHPAEA may induce increases in wages in 2014 and beyond if reimbursement rates rise or there is an insufficient number of professionals to meet the increases in demand. In contrast, efforts to increase the supply of individuals seeking employment in the SUD treatment field with no commensurate increase in funding may further reduce wages. In turn, this may result in increased turnover as individuals in the SUD treatment field leave the profession to seek professional opportunities with greater compensation.
Currently, the field's high turnover rate is commonly attributed to inadequate compensation. Compensation for behavioral health professionals is significantly lower than for other health and non-health professions requiring similar levels of training (Hyde 2013). The clinical directors interviewed as part of the Vital Signs survey noted that low compensation makes hiring and retaining qualified staff a challenge (Ryan et al. 2012). Efforts to increase the supply of individuals seeking work in the SUD treatment field without an associated increase in reimbursement for services or increases in funding sources are likely to result in reduced wage levels and lower retention as individuals in the SUD treatment field recognize the potential to increase their earnings by shifting to other professions.
3. Recruiting and Retaining Qualified Staff
The Vital Signs survey of clinical directors of SUD facilities conducted by ATTCs in 2011-2012 included several questions on recruiting and retaining staff (Ryan et al. 2012).
With regard to recruiting, 49 percent of clinical directors reported difficulty filling open positions. The most common reasons cited for these difficulties (respondents could mark more than one) were insufficient number of applicants who met minimum qualifications (63 percent), insufficient funding for open positions (43 percent), lack of interest in positions due to salary (41 percent), and small applicant pool due to geographic area surrounding work setting (36 percent). The most common reasons cited for applicants not having the minimum requirements for the job were little or no experience in substance abuse treatment (50 percent), insufficient or inadequate training and education (49 percent), and lack of appropriate certification (43 percent).
In terms of staff retention, the surveyed facilities reported an 18.5 percent turnover rate each year. This rate is substantially higher than the median turnover rate for primary care physicians in managed care organizations (7.1 percent) and nurse practitioners and physician assistants (12 percent) (Hyde 2013). Clinical directors responding to the Vital Signs survey indicated their ability to retain employees may be hindered by lack of paid educational assistance for employees (44 percent) and lack of available retirement plans (24 percent).
| TABLE IV.1. Percentage Capacity at Which Facilities are Operating, by Care Setting, N-SSATS 2013 | |||||||||||||
|---|---|---|---|---|---|---|---|---|---|---|---|---|---|
| Outpatient (percentage) |
Residential (percentage) |
Inpatient (percentage) |
|||||||||||
| Over 120 |
106 to 120 |
95 to 105 |
80 to 94 |
Less Than 80 |
More Than 100 |
91 to 100 |
50 to 90 |
50 or Less |
More Than 100 |
91 to 100 |
50 to 90 |
50 or Less |
|
| Total | 1.3 | 4.9 | 34.2 | 35.9 | 23.8 | 8.8 | 47.9 | 34.4 | 8.9 | 18.2 | 27.3 | 34.6 | 19.9 |
| Private non-profit | 1.7 | 6.1 | 39.0 | 34.6 | 18.6 | 8.0 | 49.6 | 34.1 | 8.4 | 12.2 | 27.8 | 36.5 | 23.5 |
| Private for-profit | 0.4 | 2.1 | 25.3 | 38.8 | 33.4 | 11.9 | 41.1 | 35.5 | 11.5 | 27.3 | 23.4 | 33.1 | 16.2 |
| Local, county, or community government | 1.3 | 7.7 | 40.0 | 34.5 | 16.4 | 3.8 | 41.8 | 41.8 | 12.7 | 25.0 | 25.0 | 29.2 | 20.8 |
| State government | 3.2 | 8.3 | 38.1 | 33.5 | 17.0 | 11.3 | 48.5 | 35.1 | 5.2 | 12.1 | 45.5 | 36.4 | 6.1 |
| Federal Government | 4.3 | 8.6 | 48.5 | 27.3 | 11.3 | 15.4 | 50.0 | 28.2 | 6.4 | 21.4 | 21.4 | 28.6 | 28.6 |
| Department of Veterans Affairs | 5.6 | 9.7 | 53.6 | 26.0 | 5.1 | 14.9 | 49.3 | 31.3 | 4.5 | 25.0 | 16.7 | 25.0 | 33.3 |
| Department of Defense | 3.6 | 6.0 | 40.5 | 34.5 | 15.5 | - - | 66.7 | 33.3 | - - | - - | 100.0 | - - | - - |
| Indian Health Service | - - | 8.8 | 41.2 | 17.6 | 32.4 | 25.0 | 50.0 | - - | 25.0 | - - | - - | - - | - - |
| Other | - - | 8.3 | 41.7 | 25.0 | 25.0 | - - | - - | - - | - - | - - | - - | 100.0 | - - |
| Tribal government | 2.8 | 7.6 | 33.1 | 33.5 | 23.1 | 12.8 | 35.9 | 38.5 | 12.8 | 66.7 | 33.3 | - - | - - |
| SOURCE: Estimates obtained from SAMHSA 2014a, Tables 4.5-4.7. | |||||||||||||
| TABLE IV.2. Trends in Mean Hourly Wages for Behavioral Health Professionals, in Dollars | |||||||
|---|---|---|---|---|---|---|---|
| Type of Professional | 2007 | 2008 | 2009 | 2010 | 2011 | 2012 | 2013 |
| Mental health and substance abuse social workers | 19 (0.6) |
19 (0.8) |
20 (0.5) |
20 (0.5) |
21 (0.5) |
21 (0.5) |
21 (0.6) |
| Substance abuse and behavioral disorder counselor | 18 (0.6) |
19 (1.3) |
19 (1.2) |
20 (1.2) |
20 (0.5) |
20 (0.5) |
20 (0.5) |
| SOURCE: BLS Occupational and Employment Wage Estimates, 2007-2014. | |||||||
4. Concern About Training Adequacy
In 2004, SAMHSA convened a panel of stakeholders who developed a number of recommendations for strengthening the SUD treatment workforce. A number of these recommendations focused on training, including recommendations to create career paths for the treatment and recovery workforce and adopt national core competency standards, support the development and adoption of national accreditation standards for addictions education programs, and increase training of primary care health professionals in addiction treatment.
Concerns about training adequacy were also raised during our interviews with experts from IC&RC and NAADAC. For example, a one state board representative indicated that providers are skeptical of hiring individuals with online training. Similarly, the NAADAC respondent revealed that there is concern that more highly educated workers, most of whom graduate from programs that are not specifically focused on addiction, may not have necessary addiction-specific training. A state board representative indicated that treatment degree programs at the graduate level are commonly classes built into a social work, counseling, or psychology degree and that the bulk of addiction-specific treatment degree programs are at the associate level. Another state board representative estimated they test about as many people a year as the number of people who drop out of the workforce, and they believe that a lack of minimum competencies and standards results in an unprepared and transient workforce. The IC&RC expert interviewee noted that boards handle the recertification process, so they are not certain of the reasons some individuals do not recertify, but they believe that some people have had problems finding adequate continuing education to meet recertification requirements.
Similar concerns about training adequacy were expressed by clinical directors responding to the Vital Signs survey. Clinical directors reported that their facilities face significant challenges in filling open positions due to a lack of qualified applicants (Ryan et al. 2012).
5. Inability to Accept Insurance Coverage
Because providers have traditionally relied on grant funding, there is concern that providers are not prepared to accept the Medicaid and private insurance coverage that potential clients may obtain as a result of ACA insurance expansions. In 2013, over one-third of facilities did not accept private insurance, and a larger percentage (41 percent) did not accept Medicaid. Many facilities may find it challenging to take advantage of new payment sources without support.
Analysis by Andrews and colleagues (2015a) on a survey of SSA activities related to supporting treatment facility ability to meet requirements of the ACA, suggests that SSAs are providing limited support to treatment facilities. The survey included representatives from the 50 states and the District of Columbia and was conducted between November 2013 and July 2014, achieving a 98 percent response rate. The findings indicate only about one in four SSAs was providing technical assistance to help treatment programs with insurance enrollment and outreach to individuals newly eligible for insurance coverage under the ACA. Likewise, one in four SSAs reported providing technical assistance to help treatment facilities join private insurance provider networks and only 6 percent of SSAs reported providing funding to help treatment programs prepare for ACA implementation.
6. Lack of Evidenced-Based Treatment
According to research by the CASA (2012), the services currently provided to SUD treatment clients are inconsistent with the scientific findings on evidence-based treatment. Specific discrepancies between current treatment practice and science include the following:
-
Patient Education, Screening, Brief Interventions, and Treatment Referrals. Despite the documented benefits and endorsements of these activities, few primary care health professionals educate, screen, treat, or refer patients who have SUDs. Only 6 percent of referrals to SUD treatment come from general health care providers.
-
Treatment Often Ends with Detoxification. In 2008, only 12.6 percent of discharges from a detoxification program were transferred to a treatment facility, despite evidence that additional treatment following detoxification is a medical necessity.
-
Pharmaceutical Treatments are Underutilized. Only half of both privately and publicly funded treatment programs use one or more pharmaceutical treatments. There are many reasons for the limited adoption of these treatments, including lack of qualified medical staff in treatment programs, negative attitudes toward pharmaceutical treatments in abstinence-based treatment approaches, and insufficient knowledge about pharmaceutical treatments among prescribers.
-
Treatment Plans are not Tailored to Disease Severity, Co-occurring Conditions, or Chronic Nature of Disease. The standard treatment for addiction is non-intensive outpatient treatment or a brief acute intervention. Relapse is common with these approaches because there is little evidence that addiction remits in a brief period of time. Although addiction is understood to be a chronic disease, treatment approaches do not address this aspect of the illness.
Addressing the disparity between treatment practice and scientific evidence will require more integration of SUD treatment with general health treatment, re-shaping the SUD treatment workforce to incorporate more medical professionals, and improved training for SUD treatment professionals.
7. Summary
Overall, the available evidence suggests that prior to ACA implementation, the SUD treatment workforce was strained to effectively meet the existing level of treatment demand. A substantial number of facilities were operating at or above capacity. Insufficient funding resulted in low wages, which made hiring and retaining qualified staff a challenge. Clinical directors and representatives of certification organizations expressed concerns about training adequacy, and a review of the services provided to clients indicated that current practice was often inconsistent with the scientific findings on evidence-based treatment. Finally, many facilities may not accept or be included in the insurance networks associated with coverage obtained under the ACA.
B. Comparison of Trends in Demand and Supply
Although trends in SUD prevalence and treatment receipt have been relatively constant for the last decade, a substantial shift in demand may be observed between 2014 and 2018. While federal, state, and local funding for SUD treatment are likely to remain relatively stable, the ACA may result in a substantial increase in demand for SUD treatment. Additional increases related to the impact of MHPAEA, the opioid epidemic and changing perspectives about the validity of SUDs as a health condition could further increase demand.
In contrast, on the supply side, we find a workforce that is challenged to meet the existing demand prior to ACA implementation. Although no data are available regarding trends in training program output, interviews with experts suggest, at most, a small increase in training programs in recent years. Meanwhile, credentialing experts and clinical directors express concern about training adequacy specifically noting that more highly educated workers, most of whom graduate from programs not specifically focused on addiction, may not have necessary addiction-specific training and experience. Overall, the best available evidence suggests that the supply side does not have sufficient capacity to address the expected short-run increase in demand that is projected.
V. Gaps in Current Knowledge and Next Steps
The literature review and analysis of existing data sources identified many gaps in current knowledge. These gaps are summarized in the first section below. In the final section, we identify the work we will complete in the second phase of this project.
A. Gaps in Current Knowledge
Many gaps in current knowledge were identified under this study, including the following:
Current Demand for SUD Treatment Services. Overall, the literature on factors influencing demand for treatment is quite limited. Much of the available literature is based on survey responses or observational assessments of perceived barriers. Several of the studies base their analyses of the relationship between treatment use and insurance coverage on cross-sectional data. The findings of these studies may be confounded by unobserved differences between populations with different insurance types, such as differences in severity of condition or employment. We did not identify any studies using an experimental design to examine this relationship. Improving the methodological approach to such studies would provide policymakers with more definitive information on how individuals may respond to improved access to insurance coverage for SUD treatment services under various circumstances.
Trends and Policies Impacting Demand. Efforts to project the impact of policy changes are inherently limited by lack of information on how individuals will respond to a new situation; therefore, assessing the impacts of recent policy changes on treatment use will require monitoring over time. At the time of this review, no studies were yet available quantifying the impact of the ACA on treatment use. Information on how the recent legalization of marijuana use in some states will affect treatment use is also limited. In addition, despite much interest in care integration, the degree to which such models will be implemented is unknown. Monitoring trends in dissemination of care integration and developing estimates of their impact on SUD treatment receipt would provide a foundation for understanding how these approaches may impact demand.
Previous Efforts to Estimate the Size and Composition of the SUD Workforce. The most recent data on the size and professional composition of the workforce is from the late 1990s. Updated estimates are needed, as changes in treatment approaches, such as expanded use of MAT (which requires increased medical staffing), may have resulted in significant changes in the composition of the workforce since that time. Also, studies of the size and composition of the workforce have focused on the national level. More detailed information on variations in the workforce by state, urban/rural location, facility type, size, and ownership would provide data for understanding disparities in facility staffing. Similarly, data on facility organization and staffing patterns are limited. Information on alternative staffing models and the associated quality and efficiency of care provided would help guide initiatives to create national staffing norms.
Recruiting and Developing the Workforce. Although some literature on state-level credentialing and licensing requirements exists, we did not find any studies analyzing the relationship between these requirements and the size and composition of the SUD workforce in each state. There is limited information on the pipeline for SUD treatment professions. The limited literature available suggests that professionals with a bachelor's degree or higher come from a variety of fields and obtain training specific to SUD treatment outside the requirements for their degree. Additional research on typical career paths is needed and might inform development of more streamlined training. Although the literature includes many suggested approaches for increasing the supply of SUD professionals, no information documents the potential impact of implementing the suggested strategies. Although clinical directors and credentialing experts expressed concern about training adequacy, few analyses have documented how variation in the training and experience of SUD treatment professionals impacts care quality or assessed how training might be improved.
B. Next Steps
The current report includes interim findings from Phase I of this project. Phase II of the current study will be conducted from September 2015 through February 2018 and will include the following tasks:
-
Workforce Survey 2016. Analysis of supplemental workforce questions included in the N-SSATS 2016 survey. These data will identify the number of paid and unpaid staff in the specialty SUD treatment facility workforce, by profession.
-
Supplemental Literature Review. We will analyze additional literature that becomes available between June 2015 and September 2017 and provides key evidence on the impact of the ACA and trends in SUD treatment supply and demand in post-ACA implementation.
-
Final Report. The current initial findings report will be updated to incorporate the findings from the 2016 workforce survey and the supplemental literature review.
References
Abraham, A., H. Knudsen, T. Rieckmann, and P. Roman. "Disparities in Access to Physicians and Medications for the Treatment of Substance Use Disorders Between Publicly and Privately Funded Treatment Programs in the United States." Journal of Studies on Alcohol and Drugs, vol. 74, no. 2, 2013, p. 258.
Acevedo, A., D. Garnick, M. Lee, C. Horgan, G. Ritter, K. Panas, S. Davis, T. Leeper, R. Moore, and M. Reynolds. "Racial and Ethnic Differences in Substance Abuse Treatment Initiation and Engagement." Journal of Ethnicity in Substance Abuse, vol. 11, no. 1, 2012, pp. 1-21.
Advocates for Human Potential. "The Adequacy of the Behavioral Health Workforce to Meet the Need for Services: Overview of Key Findings." 2014. Available at http://www.ahpnet.com/Files/AHP-BH-Workforce-Paper-July-2014.aspx. Accessed July 29, 2015.
Alegria, M., N. Carson, M. Goncalves, and K. Keefe. "Disparities in Treatment for Substance Use Disorders and Co-Occurring Disorders for Ethnic/Racial Minority Youth." Journal of the American Academy of Child and Adolescent Psychiatry, vol. 50, no. 1, 2011, pp. 22-31.
Ali, M.M., J. Teich, A. Woodward, and B. Han. "The Implications of the Affordable Care Act for Behavioral Health Services Utilization." Adm Policy Mental Health, 2014.
Andrews, C., A. Abraham, C. Grogan, H. Pollack, C. Bersamira, K. Humphreys, and P. Friedmann. "Despite Resources from the ACA, Most States Do Little to Help Addiction Treatment Programs Implement." Health Care Reform. Health Affairs, vol. 34, no. 5, 2015a, pp. 828-835.
Andrews, C., C. Grogan, M. Brennan and H. Pollack Lessons. "From Medicaid's Divergent Paths on Mental Health and Addiction Services." Health Affairs, vol. 34, no.7, 2015b, pp. 1131-1138.
Appel, P.W., and R. Oldak. "A Preliminary Comparison of Major Kinds of Obstacles to Enrolling in Substance Abuse Treatment (AOD) Reported by Injecting Street Outreach Clients and Other Stakeholders." American Journal of Drug and Alcohol Abuse, vol. 33, no. 5, 2007, pp. 699-705.
Ashcraft, L., and W. Anthony. "Lessons Learned in Peer Workforce Development." Behavioral HealthCare, 2012.
Bainbridge, A.A. "The Affordable Care Act and Criminal Justice: Intersections and Implications." Washington, DC: Bureau of Justice Statistics, 2012.
Barry, C.L., and H.A. Huskamp. "Moving Beyond Parity--Mental Health and Addiction Care Under the ACA." New England Journal of Medicine, vol. 365, 2011, pp. 973-975.
Baser, O., M. Chalk, D.A. Fiellin, and D.R. Gastfriend. "Cost and Utilization Outcomes of Opioid-Dependence Treatments." American Journal of Managed Care, vol. 17 Suppl 8, 2011, pp. S235-48.
Belenko, S., and J. Peugh. "Estimating Drug Treatment Needs Among State Prison Inmates." Drug and Alcohol Dependence, vol. 77, no. 3, 2005, pp. 269-281.
Bernard, D., C. Cowan, T. Selden, L. Cai, A. Catlin, S. Heffler. "Reconciling Medical Expenditure Estimates from the MEPS and NHEA, 2007." Medicare and Medicaid Research Review, vol. 2, no. 4, 2012, pp. E1-E19.
Beronio, K., S. Glied, and R. Frank. "How the Affordable Care Act and Mental Health Parity and Addiction Equity Act Greatly Expand Coverage of Behavioral Health Care." Journal of Behavioral Health Services and Research, vol. 41, no. 4, 2014, pp. 410-428.
Beronio, K., R. Po, L. Skopec, and S. Glied. "Affordable Care Act Expands Mental Health and Substance Use Disorder Benefits and Federal Parity Protections for 62 Million Americans." Washington, DC: ASPE, 2013. Available at https://aspe.hhs.gov/report/affordable-care-act-expands-mental-health-and-substance-use-disorder-benefits-and-federal-parity-protections-62-million-americans.
Bonham, T. "SBIRT: Screening, Brief Intervention and Referral to Treatment." Austin, TX: University of Texas at Austin School of Social Work, 2009.
Boozang, P., D. Bachrach, and A. Detty. "Coverage and Delivery of Adult Substance Abuse Services in Medicaid Managed Care." Medicaid Managed Care Information Resource Center Technical Assistance Brief, no. 2, 2014.
Bouchery, E.E., H.J. Harwood, J. Dilonardo, and R. Vandivort-Warren. "Type of Health Insurance and the Substance Abuse Treatment Gap." Journal of Substance Abuse Treatment, vol. 42, no. 3, 2012, pp. 289-300.
Bouchery, E.E., H.J. Harwood, J.J. Sacks, C.J. Simon, and R.D. Brewer. "Economic Costs of Excessive Alcohol Consumption in the United States, 2006." American Journal of Preventive Medicine, vol. 41, no. 5, 2011, pp. 516-524.
Bouchery, E., and H. Harwood. "The Economic Costs of Drug Abuse in the United States." Falls Church, VA: Lewin Group, 2001.
Brubaker, M.D., E.A. Amatea, E. Torres-Rivera, M.D. Miller, and L. Nabors. "Barriers and Supports to Substance Abuse Service Use Among Homeless Adults." Journal of Addictions and Offender Counseling, vol. 34, no. 2, 2013, pp. 81-98.
Brunette, M.F., D. Asher, R. Whitley, W.J. Lutz, B.L. Wieder, A.M. Jones, G.J. McHugo. "Implementation of Integrated Dual Disorders Treatment: A Qualitative Analysis of Facilitators and Barriers." Psychiatric Services, vol. 59, no. 9, 2008, pp. 989-995.
Buck, J.A. "The Looming Expansion and Transformation of Public Substance Abuse Treatment Under the Affordable Care Act." Health Affairs, vol. 30, no. 8, 2011, pp. 1402-1410.
Bureau of Labor Statistics. "Occupational Outlook Handbook, 2014-15 Edition, Substance Abuse and Behavioral Disorder Counselors." Washington, DC: U.S. Department of Labor. Available at http://www.bls.gov/ooh/community-and-social-service/substance-abuse-and-behavioral-disorder-counselors.htm. Accessed March 1, 2015a.
Bureau of Labor Statistics. "Occupational Outlook Handbook, 2014-15 Edition, Social Workers." Washington, DC: U.S. Department of Labor. Available at http://www.bls.gov/ooh/community-and-social-service/social-workers.htm. Accessed March 1, 2015b.
Bureau of Labor Statistics. "Occupational and Employment Statistics, 2007-2014." Washington, DC: U.S. Department of Labor. Available at http://www.bls.gov/oes/tables.htm. Accessed March 1, 2015c.
Busch, S.H., A.J. Epstein, M.O. Harhay, D.A. Fiellin, H. Un, D. Leader Jr., and C.L. Barry. "The Effects of Federal Parity on Substance Use Disorder Treatment." American Journal of Managed Care, vol. 20, no. 1, 2014, p. 76.
Busch, A.B., F. Yoon, C.L. Barry, V. Azzone, S.L.T. Normand, H.H. Goldman, and H.A. Huskamp. "The Effects of Parity on Mental Health and Substance Use Disorder Spending and Utilization: Does Diagnosis Matter?" American Journal of Psychiatry, vol. 170, no. 2, 2013, p. 180.
Capoccia, V.A., K.L. Grazier, C. Toal, J.H. Ford, and D.H. Gustafson. "Massachusetts' Experience Suggests Coverage Alone is Insufficient to Increase Addiction Disorders Treatment." Health Affairs, vol. 31, no. 5, 2012, pp. 1000-1008.
Caulkins, J.P., and A.C. Lee. "The Drug-Policy Roulette." National Affairs, vol. 12, 2012, pp. 35-51.
Centers for Disease Control and Prevention. "Alcohol and Public Health: Frequently Asked Questions." Atlanta, GA: CDC. Available at http://www.cdc.gov/alcohol/faqs.htm#bingeDrinking. Accessed July 29, 2015a.
Centers for Disease Control and Prevention. "Injury Prevention and Control: Prescription Drug Overdose." Atlanta, GA: CDC. Available at http://www.cdc.gov/drugoverdose/. Accessed May 13, 2015b.
Centers for Disease Control and Prevention. "Injury Prevention and Control: Prescription Drug Overdose: Data Overview." Atlanta, GA: CDC. Available at http://www.cdc.gov/drugoverdose/data/index.html. Accessed May 13, 2015c.
Center for Substance Abuse Treatment. "Chapter 3--General Program Characteristics in Treatment of Adolescents with Substance Use Disorders." Rockville, MD: SAMHSA, 1999.
Cerdá, M., M. Wall, K.M. Keyes, S. Galea, and D. Hasin. "Medical Marijuana Laws in 50 States: Investigating the Relationship Between State Legalization of Medical Marijuana and Marijuana Use, Abuse and Dependence." Drug and Alcohol Dependence, vol. 120, no. 1, 2012, pp. 22-27.
CMS Letter to State Medical Directors. "New Service Delivery Opportunities for Individuals with a Substance Use Disorder." SMD 15-003, 2015.
Commonwealth Fund. "State Strategies for Integrating Physical and Behavioral Health Services in a Changing Medicaid Environment." Commonwealth Fund, 2014.
Congressional Budget Office. "Updated Estimates of the Effects of Insurance Coverage Provisions of the Affordable Care Act." Washington, DC: CBO, 2014.
Croft, B., and S.L. Parish. "Care Integration in the Patient Protection and Affordable Care Act: Implications for Behavioral Health." Administration and Policy in Mental Health and Mental Health Services Research, vol. 40, no. 4, 2013, pp. 258-263.
Cropsey, K.L., I.A. Binswanger, C.B. Clark, and F.S. Taxman. "The Unmet Medical Needs of Correctional Populations in the United States." Journal of the National Medical Association, vol. 104, no. 11-12, 2011, pp. 487-492.
Cummings, J.R., H. Wen, M. Ko, and B.G. Druss. "Race/Ethnicity and Geographic Access to Medicaid Substance Use Disorder Treatment Facilities in the United States." JAMA Psychiatry, vol. 71, no. 2, 2014, pp. 190–196.
Cunningham, C.O., A. Giovanniello, G. Sacajui, X. Li, M. Brisbane, and N.L. Sohler. "Inquiries About and Initiation of Buprenorphine Treatment in an Inner-City Clinic." Substance Abuse, vol. 30, no. 3, 2009, pp. 261-262.
Daniels, A.S., L. Fricks, and T.P. Tunner. "Pillars of Peer Support--2: Expanding the Role of Peer Support Services in Mental Health Systems of Care and Recovery." Atlanta, GA: Carter Center, 2011.
Dave, D., and S. Mukerjee. "Mental Health Parity Legislation, Cost Sharing, and Substance-Abuse Treatment Admissions." Health Economics, vol. 20, no. 2, 2008, pp. 161-183.
Decker, S.L. "Two-Thirds of Primary Care Physicians Accepted New Medicaid Patients in 2011-12: A Baseline to Measure Future Acceptance Rates." Health Affairs, vol. 32, no. 7, 2013, pp. 1183-1187.
Department of Health and Human Services. "Opioid Abuse in the U.S. and HHS Actions to Address Opioid-Drug Related Overdoses and Deaths." Washington, DC: ASPE, 2015. Available at https://aspe.hhs.gov/pdf-report/opioid-abuse-us-and-hhs-actions-address-opioid-drug-related-overdoses-and-deaths. Accessed May 13, 2015a.
Department of Health and Human Services. "Fiscal Year 2015 Budget in Brief: Strengthening Health and Opportunity for All Americans." Washington, DC: HHS, 2015b.
Department of Health and Human Services. "HRSA Awards $51.3 Million in Affordable Care Act Funding to Support Mental Health and Substance Abuse Treatment." Washington, DC: HRSA, 2014. Available at http://www.hrsa.gov/about/news/pressreleases/141106behavioralhealth.html. Accessed March 1, 2015c.
Department of Health and Human Services. "Fiscal Year 2016, SAMHSA, Justifications of Estimates for Appropriation Committees." Available at http://www.samhsa.gov/sites/default/files/private/samhsa-fy2016-congressional-justification_2.pdf. Accessed on September 22, 2015d.
Department of Health and Human Services. "HHS Takes Strong Steps to Address Opioid-Drug Related Overdose, Death and Dependence." Available at http://www.hhs.gov/about/news/2015/03/26/hhs-takes-strong-steps-to-address-opioid-drug-related-overdose-death-and-dependence.html. Accessed on March 26, 2015e.
Dilonardo, J. "Workforce Issues in Integrated Behavioral Healthcare: A Background Paper." National Council for Community Behavioral Healthcare, 2011 unpublished paper.
Druss, B.G., and B.J. Mauer. "Health Care Reform and Care at the Behavioral Health--Primary Care Interface." Psychiatric Services, vol. 61, no. 11, 2010, pp. 1087-1092.
Ducharme, L.J., H.L. Mello, P.M. Roman, H.K. Knudsen, and J.A. Johnson. "Service Delivery in Substance Abuse Treatment: Reexamining 'Comprehensive' Care." Journal of Behavioral Health Services and Research, vol. 34, no. 2, 2007, pp. 121-136.
Epstein J.F., L.L. Hourani, and D.C. Heller. "Predictors of Treatment Receipt Among Adults with a Drug Use Disorder." American Journal of Drug and Alcohol Abuse, vol. 30, no. 4, 2004, pp. 841-869.
Evans, D.G. "The Economic Impacts of Marijuana Legalization."Journal of Global Drug Policy and Practice, vol. 7, no. 4, 2013.
Finkelstein, A., S. Taubman, B. Wright, M. Bernstein, J. Gruber, J. Newhouse, H. Allen, K Baicker and the Oregon Health Study Group. "The Oregon Health Insurance Experiment: Evidence from the First Year." National Bureau of Economic Research Working Paper, no. 17190, 2011.
Foster, S.E. "Institute of Medicine-National Resource Council Workshop on Improving the Health, Safety and Well-Being of Young Adults." 2014. Available at https://iom.nationalacademies.org/~/media/Files/Activity%20Files/Children/ImprovingYoungAdultsHealth/Foster%20Presentation.pdf. Accessed August 16, 2015.
Frank, R.G., K. Beronio, and S.A. Glied. "Behavioral Health Parity and the Affordable Care Act." Journal of Social Work in Disability and Rehabilitation, vol. 13, no. 1-2, 2014, pp. 31-43.
Friedman, P.D., R. Hoskinson Jr., M. Gordon, R. Schwartz, T. Kinlock, K. Knight, P.M. Flynn, W.N. Welsh, L.A.R. Stein, S. Sacks, D.J. O'Connell, H.K. Knudsen, M.S. Shafer, E. Hall, and L.K. Frisman. "Medication-Assisted Treatment in Criminal Justice Agencies Affiliated with the Criminal Justice-Drug Abuse Treatment Studies (CJ-DATS): Availability, Barriers, and Intentions." Substance Abuse, vol. 33, no. 1, 2012, pp. 9-18.
Harrell, AV. "The Validity of Self-Reported Drug Use Data: The Accuracy of Responses on Confidential Self-Administered Answer Sheets." In L. Harrison and A. Hughes (Eds.). The Validity of Self-Reported Drug Use: Improving the Accuracy of Survey Estimates. NIH Publication No. 97-4147, NIDA Research Monograph 167, pp. 37-58. Rockville, MD: National Institute on Drug Abuse, 1997.
HealthCare.gov. "Mental Health and Substance Abuse Coverage." Available at https://www.healthcare.gov/coverage/mental-health-substance-abuse-coverage/. Accessed December 21, 2014.
Hoge, M.A., G.W. Stuart, J. Morris, M.T. Flaherty, M. Paris, and E. Goplerud. "Mental Health and Addiction Workforce Development: Federal Leadership Is Needed to Address the Growing Crisis." Health Affairs, vol. 32, no. 11, 2013, pp. 2005-2012.
Hoge, M.A., J.A. Morris, A.S. Daniels, G.W. Stuart, L.Y. Huey, and N. Adams. "An Action Plan for Behavioral Health Workforce Development." Cincinnati, OH: Annapolis Coalition on the Behavioral Health Workforce, 2007.
Hoyt, G.M., and F. Chaloupka. "Effects of Survey Conditions on Self-Reported Substance Use." Contemporary Economic Policy, vol. 12, 1994, pp. 109-121.
Humphreys, K., and R.G. Frank. "The Affordable Care Act Will Revolutionize Care for Substance Use Disorders in the United States." Addiction, vol. 109, no. 12, 2014, pp. 1957-1958.
Humphreys, K., and A.T. McLellan. "Brief Intervention, Treatment and Recovery Support Services for Americans Who Have Substance Use Disorders: An Overview of Policy in the Obama Administration." Psychological Services, vol. 7, no. 4, 2010, pp. 275-284.
Hyde, P.S. "Report to Congress on the Nation's Substance Abuse and Mental Health Workforce Issues." Rockville, MD: SAMHSA, 2013.
Institute of Medicine. "Improving the Quality of Health Care for Mental and Substance-Use Conditions." Washington, DC: National Academies Press, 2006.
Jackson, A., and L. Shannon. "Examining Barriers to and Motivations for Substance Abuse Treatment Among Pregnant Women: Does Urban-Rural Residence Matter?" Women and Health, vol. 52, no. 6, 2012, pp. 570-586.
Johns Hopkins Medicine. "Treatment Settings." Available at http://www.hopkinsmedicine.org/substance_abuse_center/treatment/settings.html. Accessed December 21, 2014.
Kerwin, M.E., K. Walker-Smith, and K.C. Kirby. "Comparative Analysis of State Requirements for the Training of Substance Abuse and Mental Health Counselors." Journal of Substance Abuse Treatment, vol. 30, no. 3, 2006, pp. 173-181.
Knudsen, H.K., A.J. Abraham, and C.B. Oser. "Barriers to the Implementation of Medication-Assisted Treatment for Substance Use Disorders: The Importance of Funding Policies and Medical Infrastructure." Evaluation and Program Planning, vol. 34, no. 4, 2011, pp. 375-381.
Knudsen, H.K., A.J. Abraham, and P.M. Roman. "Adoption and Implementation of Medications in Addiction Treatment Programs." Journal of Addiction Medicine, vol. 5, no. 1, 2011, pp. 21-27.
Knudsen, H.K., M.R. Lofwall, J.R. Havens, and S.L. Walsh. "States' Implementation of the Affordable Care Act and the Supply of Physicians Waivered to Prescribe Buprenorphine for Opioid Dependence." Drug and Alcohol Dependence, vol. 157, 2015, pp. 36-43.
Larson, M.J., A. Zhang, K. Smith, and L. Kasten. "Access to Services: Multiple Perspectives from Adults with Substance Abuse Disorders in Massachusetts." Administration and Policy in Mental Health, vol. 32, no. 4, 2005, pp. 357-371.
Lemak, C.H., and J.A. Alexander. "Factors That Influence Staffing of Outpatient Substance Abuse Treatment Programs." Psychiatric Services, vol. 56, no. 8, 2005, pp. 934-939.
Lenardson, J.D., and J.A. Gale. "Distribution of Substance Abuse Treatment Facilities Across the Rural-Urban Continuum." Maine Rural Health Research Center, Working paper #35, Institute for Health Policy, Muskie School of Public Service, University of Southern Maine, 2007.
Lewin Group and National Opinion Research Center. "Survey of Substance Abuse Treatment Providers as Information Consumers." Prepared for SAMHSA, CSAT under contract number HHS-100-97-0016, Task Order No. 8, 2000.
Lo, C.C., and T.C. Cheng. "Racial/Ethnic Differences in Access to Substance Abuse Treatment." Journal of Health Care for the Poor and Underserved, vol. 22, no. 2, 2011, pp. 621-637.
MacMaster, S.A. "Perceptions of Need, Service Use, and Barriers to Service Access among Female Methamphetamine Users in Rural Appalachia." Social Work in Public Health, vol. 28, no. 2, 2013, pp. 109-118.
Madras, B.K., W.M. Compton, D. Avula, T. Stegbauer, J.B. Stein, and H.W. Clark. "Screening, Brief Interventions, Referral to Treatment (SBIRT) for Illicit Drug and Alcohol Use at Multiple Healthcare Sites: Comparison at Intake and Six Months." Drug and Alcohol Dependence, vol. 99, no. 1-3, 2009, pp. 280-295.
Mann, C., T. Frieden, P.S. Hyde, N.D. Volkow, and G.F. Koob. "Subject: Medication Assisted Treatment for Substance Use Disorders." 2014. Available at http://www.medicaid.gov/Federal-Policy-Guidance/Downloads/CIB-07-11-2014.pdf. Accessed August 16, 2015.
Marijuana Policy Project. "Treatment Episode Data Set (TEDS) Highlights--2006," 2008. Available at http://www.mpp.org/reports/treatment-episode-data-set.html. Accessed December 21, 2014.
Mark, T.L., L.M. Wier, K. Malone, M. Penne, and A.J. Cowell. "National Estimates of Behavioral Health Conditions and Their Treatment Among Adults Newly Insured Under the ACA." Psychiatric Services, vol. 66, 2015a, pp. 426-429.
Mark, T.L., R. Lubran, E.F. McCance-Katz, M. Chalk, and J. Richardson. "Medicaid Coverage of Medications to Treat Alcohol and Opioid Dependence." Journal of Substance Abuse Treatment, vol. 55, 2015b, pp. 1-5.
Marshall, V.J., T.L. McLaurin-Jones, N. Kalu, J. Kwagyan, D.M. Scott, C. Cain, W. Greene, V. Adenuga, and R.E. Taylor. "Screening, Brief Intervention, and Referral to Treatment: Public Health Training for Primary Care." American Journal of Public Health, vol. 102, no. 8, 2012, pp. 30-36.
Masson, C.L., M.S. Shopshire, S. Sen, K.A. Hoffman, N.S. Hengl, J. Bartolome, D. McCarty, J.L. Sorensen, and M.Y. Iguchi. "Possible Barriers to Enrollment in Substance Abuse Treatment Among a Diverse Sample of Asian Americans and Pacific Islanders: Opinions of Treatment Clients." Journal of Substance Abuse Treatment, vol. 44, no. 3, 2013, pp. 309-315.
McCarty, D. "The Alcohol and Drug Abuse Treatment Workforce." Frontlines: Linking Alcohol Services Research and Practice, vol. 5, no. 8, 2002, p. 2.
McConnell, K.J., M.S. Ridgely, and D. McCarty. "What Oregon's Parity Law Can Tell Us About the Federal Mental Health Parity and Addiction Equity Act and Spending on Substance Abuse Treatment Services." Drug and Alcohol Dependence, vol. 124, no. 3, 2012, pp. 340-346.
Mechanic, D. "Is The Prevalence of Mental Disorders a Good Measure of the Need for Services?" Health Affairs, vol. 22, no.5, 2003, pp. 8-20.
Miller, D. "Enhancing the Peer Provider Workforce: Recruitment, Supervision and Retention." (No. HHSS28342001T). Alexandria, VA: National Association of State Mental Health Program Directors, 2014.
Mojtabai, R. "Use of Specialty Substance Abuse and Mental Health Services in Adults with Substance Use Disorders in the Community." Drug and Alcohol Dependence, vol. 78, no. 3, 2005, pp. 345-354.
Morrison, R., K. Mandell, and R. Harwood. "Substance Abuse Treatment--Can Reform Close the Gap?" Healthcare Reform, 2010, pp. 24-25.
Mulvaney-Day, N., D. DeAngelo, C.N. Chen, B.L. Cook, and M. Alegría. "Unmet Need for Treatment for Substance Use Disorders Across Race and Ethnicity." Drug and Alcohol Dependence, vol. 125, 2012, pp. S44-S50.
National Association of State Alcohol and Drug Abuse Directors. "State Regulations on Substance Use Disorder Programs and Counselors: An Overview." Washington, DC: NASADAD, 2013.
National Center on Addiction and Substance Use at Columbia University. "Behind Bars II: Substance Abuse and America's Prison Population." New York, NY: Columbia University, 2010. Available at http://www.casacolumbia.org/download/file/fid/487. Accessed August 16, 2015.
National Center on Addiction and Substance Use at Columbia University. "Addiction Medicine: Closing the Gap Between Science and Practice." New York, NY: Columbia University, 2012. Available at http://www.casacolumbia.org/addiction-research/reports/addiction-medicine. Accessed August 16, 2015.
Office of National Drug Control Policy. "National Drug Control Budget: FY 2015 Budget Highlights." Washington, DC: ONDCP, 2014. Available at http://www.whitehouse.gov/sites/default/files/private/ondcp/about-content/fy_2015_budget_highlights_-_final.pdf. Accessed February 15, 2015.
Padwa, H., D. Urada, V.P. Antonini, A. Ober, D.A. Crevecoeur-MacPhail, and R.A. Rawsom. "Integrating Substance Use Disorder Services with Primary Care: The Experience in California." Journal of Psychoactive Drugs, vol. 44, no. 4, 2012, pp. 299-306.
Peterson, J.A., R.P. Schwartz, S.G. Mitchell, H.S. Reisinger, S.M. Kelly, K.E. O'Grady, B.S. Brown, and M.H. Agar. "Why Don't Out-of-Treatment Individuals Enter Methadone Treatment Programmes?" International Journal of Drug Policy, vol. 21, no. 1, 2010, pp. 36-42.
Pringle, J.L., N.P. Emptage, and R.L. Hubbard. "Unmet Needs for Comprehensive Services in Outpatient Addiction Treatment" Journal of Substance Abuse Treatment, vol. 30, no. 3, 2006, pp. 183-189.
Rapp, R.C., J. Xu, C.A. Carr, D.T. Lane, J. Wang, and R. Carlson. "Treatment Barriers Identified by Substance Abusers Assessed at a Centralized Intake Unit." Journal of Substance Abuse Treatment, vol. 30, no. 3, 2006, pp. 227-235.
Reif, S., L. Braude, D.R. Lyman, R.H. Dougherty, A.D. Daniels, S.S. Ghose, O. Salim, and M.E. Delphi-Rittmon. "Peer Recovery Support Individuals with Substance Use Disorders: Assessing the Evidence." Psychiatry Online, vol. 65, no. 7, 2014, pp. 853-861.
Rocky Mountain High Intensity Drug Trafficking Area. "The Legalization of Marijuana in Colorado: The Impact." Colorado: Rocky Mountain High Intensity Drug Trafficking Area, 2014.
Roman, P.M., A.J. Abraham and H.K. Knudsen. "Using Medication-Assisted Treatment for Substance Use Disorders: Evidence of Barriers and Facilitators of Implementation." Addiction Behavior, vol. 36, no. 6, 2011, pp. 584-589.
Rosenbach, M., T. Lake, C. Young, W. Conroy, B. Quinn, J. Ingels, B. Cox, A. Peterson, and L. Crozier. "Effects of the Vermont Mental Health and Substance Abuse Parity Law." HHS Pub. No. (SMA) 03-3822. Rockville, MD: SAMHSA, Center for Mental Health Services, 2003.
Rounds-Bryant, J.L., and L. Baker. "Substance Dependence and Level of Treatment Need Among Recently Incarcerated Prisoners." American Journal of Drug and Alcohol Abuse, vol. 33, 2007, pp. 557-561.
Ryan, O., D. Murphy, and L. Krom. "Vital Signs: Taking the Pulse of the Addiction Treatment Workforce, A National Report." Version 1. Kansas City, MO: Addiction Technology Transfer Center, National Office in residence at the University of Missouri-Kansas City, 2012.
Saloner, B., and B. Cook. "An ACA Provision Increased Treatment for Young Adults with Possible Mental Illnesses Relative to Comparison Group." Health Affairs, vol. 33, no. 8, 2014, pp. 1425-1434.
Sanger-Katz, M. "Is the Affordable Care Act Working?" New York Times, 2014.
Saum, C.A., M.L. Hiller, M.E. Leigey, J.A. Inciardi, and H.L. Surratt. "Predictors of Substance Abuse Treatment Entry for Crime-Involved, Cocaine-Dependent Women." Drug and Alcohol Dependence, vol. 91, no. 2, 2007, pp. 253-259.
Schmidt, L.A., and C.M. Weisner. "Private Insurance and the Utilization of Chemical Dependency Treatment." Journal of Substance Abuse Treatment, vol. 28, no. 1, 2005, pp. 67-76.
Sigmon, S.C. "Access to Treatment for Opioid Dependence in Rural America: Challenges and Future Directions." JAMA Psychiatry, vol. 71, no. 4, 2014, pp. 359-360.
Sterling, S., C. Weisner, A. Hinman, and S. Parthasarathy. "Access to Treatment for Adolescents with Substance Use and Co-Occurring Disorders: Challenges and Opportunities." Journal of the American Academy of Child and Adolescent Psychiatry, vol. 49, no. 7, 2010, pp. 637-726. doi:10.1016/j.jaac.2010.03.019.
Substance Abuse and Mental Health Services Administration. "Alcohol and Drug Services Study (ADSS): The National Substance Abuse Treatment System: Facilities, Clients, Services, and Staffing." Rockville, MD: SAMHSA, Office of Applied Studies, 2003.
Substance Abuse and Mental Health Services Administration. "Results from the 2004 National Survey on Drug Use and Health: National Findings." NSDUH Series H-28, HHS Publication No. SMA 05-4062. Rockville, MD: SAMHSA, 2005.
Substance Abuse and Mental Health Services Administration. "Detoxification and Substance Abuse Treatment." Treatment Improvement Protocol (TIP) Series, No. 45. HHS Publication No. (SMA) 134131. Rockville, MD: SAMHSA, 2006a.
Substance Abuse and Mental Health Services Administration. "Results from the 2005 National Survey on Drug Use and Health: National Findings." NSDUH Series H-30, HHS Publication No. SMA 06-4194. Rockville, MD: SAMHSA, 2006b.
Substance Abuse and Mental Health Services Administration. "National Survey of Substance Abuse Treatment Services (N-SSATS): 2006. Data on Substance Abuse Treatment Facilities." DASIS Series: S-39, HHS Publication No. (SMA) 07-4296. Rockville, MD: SAMHSA, Office of Applied Studies, 2007a.
Substance Abuse and Mental Health Services Administration. "Results from the 2006 National Survey on Drug Use and Health: National Findings." NSDUH Series H-32, HHS Publication No. SMA 07-4293. Rockville, MD: SAMHSA, 2007b.
Substance Abuse and Mental Health Services Administration. "Results from the 2007 National Survey on Drug Use and Health: National Findings." NSDUH Series H-34, HHS Publication No. SMA 08-4343). Rockville, MD: SAMHSA, 2008.
Substance Abuse and Mental Health Services Administration. "Results from the 2008 National Survey on Drug Use and Health: National Findings." NSDUH Series H-36, HHS Publication No. SMA 09-4434. Rockville, MD: SAMHSA, 2009.
Substance Abuse and Mental Health Services Administration. (2010). "Results from the 2009 National Survey on Drug Use and Health: Volume I. Summary of National Findings." NSDUH Series H-38A, HHS Publication No. SMA 10-4856. Rockville, MD: SAMHSA, 2010.
Substance Abuse and Mental Health Services Administration, "Results from the 2010 National Survey on Drug Use and Health: Summary of National Findings." NSDUH Series H-41, HHS Publication No. (SMA) 11-4658. Rockville, MD: SAMHSA, 2011a.
Substance Abuse and Mental Health Services Administration. "Scopes of Practice and Career Ladder for Substance Use Disorder Counseling." Rockville, MD: SAMHSA, 2011b.
Substance Abuse and Mental Health Services Administration. "Results from the 2011 National Survey on Drug Use and Health: Summary of National Findings." NSDUH Series H-44, HHS Publication No. (SMA) 12-4713. Rockville, MD: SAMHSA, 2012a.
Substance Abuse and Mental Health Services Administration. "Primary and Behavioral Health Care Integration Request for Applications (RFA) No. SM-12-008." Rockville, MD: SAMHSA, 2012b.
Substance Abuse and Mental Health Services Administration. "National Survey of Substance Abuse Treatment Services (N-SSATS): 2012. Data on Substance Abuse Treatment Facilities." BHSIS Series S-66, HHS Publication No. (SMA) 14-4809. Rockville, MD: SAMHSA, 2013a.
Substance Abuse and Mental Health Services Administration. "Results from the 2012 National Survey on Drug Use and Health: Summary of National Findings." NSDUH Series H-46, HHS Publication No. (SMA) 13-4795. Rockville, MD: SAMHSA, 2013b.
Substance Abuse and Mental Health Services Administration. National Expenditures for Mental Health Services and Substance Abuse Treatment, 1986-2009. HHS Publication No. SMA-13-4740. Rockville, MD: SAMHSA, 2013c.
Substance Abuse and Mental Health Services Administration. "National and State Estimates of the Prevalence of Behavioral Health Conditions Among the Uninsured." Rockville, MD: SAMHSA, 2013d. Available at http://store.samhsa.gov/product/PEP13-BHPREV-ACA. Accessed May 6, 2014.
Substance Abuse and Mental Health Services Administration. "National Survey of Substance Abuse Treatment Services (N-SSATS): 2013. Data on Substance Abuse Treatment Facilities." BHSIS Series S-73, HHS Publication No. (SMA) 14-489. Rockville, MD: SAMHSA, 2014a.
Substance Abuse and Mental Health Services Administration. "Results from the 2013 National Survey on Drug Use and Health: Summary of National Findings." NSDUH Series H-48, HHS Publication No. (SMA) 14-4863. Rockville, MD: SAMHSA, 2014b.
Substance Abuse and Mental Health Services Administration. "Projections of National Expenditures for Treatment of Mental and Substance Use Disorders 2010-2020." Rockville, MD: SAMHSA, 2014c.
Substance Abuse and Mental Health Services Administration. "Results from the 2013 National Survey on Drug Use and Health: Detailed Tables." Available at http://www.samhsa.gov/data/sites/default/files/private/NSDUH-DetTabs2013/NSDUH-DetTabs2013.htm. Accessed August 16, 2015a.
Substance Abuse and Mental Health Services Administration. "2012-2013 National Survey on Drug Use and Health National Maps of Prevalence Estimates, by State." Available at http://www.samhsa.gov/data/sites/default/files/private/NSDUHStateEst2012-2013-p1/Maps/NSDUHsaeMaps2013.htm. Accessed July 29, 2015b.
Substance Abuse and Mental Health Services Administration. "2011 State Profile--United States: National Survey of Substance Abuse Treatment Services (N-SSATS)." Available at http://wwwdasis.samhsa.gov/webt/state_data/US11.pdf. Accessed May 4, 2015c.
Substance Abuse and Mental Health Services Administration, Center for Behavioral Health Statistics and Quality. "National Survey on Drug Use and Health: Comparison of 2011-2012 and 2012-2013 Model-Based Prevalence Estimates (50 States and the District of Columbia)." Available at http://www.samhsa.gov/data/sites/default/files/private/NSDUHStateEst2012-2013-p1/ChangeTabs/NSDUHsaeShortTermCHG2013.htm. Accessed July 29, 2015d.
Substance Abuse and Mental Health Services Administration. "Results from the 2014 National Survey on Drug Use and Health: Detailed Tables." Available at http://www.samhsa.gov/data/sites/default/files/private/NSDUH-DetTabs2014/NSDUH-DetTabs2014.pdf. Accessed September 13, 2015e.
SAMHSA-HRSA Center for Integrated Health Solutions. "Expanding the Use of Medications to Treat Individuals with Substance Use Disorders in Safety-Net Settings Creating Change on the Ground: Opportunities and Lessons Learned from the Field." 2014.
Ubel, P. "Why Many Physicians Are Reluctant to See Medicaid Patients?" Forbes, 2013. Available at http://www.forbes.com/sites/peterubel/2013/11/07/why-many-physicians-are-reluctant-to-see-medicaid-patients/. Accessed on September 20, 2015.
Wakefield, J., and Schmitz, M. The harmful dysfunction model of alcohol use disorder: revised criteria to improve the validity of diagnosis and prevalence estimates. Addiction, vol.110, no. 6, 2015, pp. 931-942.
Weaver, M.R., C.J. Conover, R.J. Proescholdbell, P.S. Arno, A. Ang, A. and S.L. Ettner. Utilization of Mental Health and Substance Abuse Care for People Living with HIV/AIDS, Chronic Mental Illness, and Substance Abuse Disorders. Journal of Acquired Immune Deficiency Syndromes, vol. 47, no. 4, 2008, pp. 449-458.
Wen, H., J.R. Cummings, J.M. Hockenberry, L.M. Gaydos, and B.G. Druss. "State Parity Laws and Access to Treatment for Substance Use Disorder in the United States: Implications for Federal Parity Legislation." JAMA Psychiatry, vol. 70, no. 12, 2013, pp. 1355-1362.
Whitter, M., E.L. Bell, P. Gaumond, M. Gwaltney, C.A. Magana, and M. Moreaux. "Strengthening Professional Identity: Challenges of the Addictions Treatment Workforce: A Framework for Discussion." Rockville, MD: SAMHSA, 2006.
Wu, L.T., and C. Ringwalt. "Use of Substance Abuse Services by Young Uninsured American Adults." Psychiatry Online, vol. 56, no. 8, 2005, pp. 946-953.
Xu, J., R.C. Rapp, J. Wand, and R.G. Carlson, R.G. "The Multidimensional Structure of External Barriers to Substance Abuse Treatment and Its Invariance Across Gender, Ethnicity and Age." Substance Abuse. vol. 29, 2008, pp. 43-54.
Appendix A. NSDUH Substance Use Disorder Prevalence Trends, 2002-2013
| TABLE A.1. Trends in Illicit Drug Use in Past Year among Persons Age 12 and Over, 2002-2013 (numbers in thousands) |
||||||||||||
|---|---|---|---|---|---|---|---|---|---|---|---|---|
| Past Year Illicit Drug Use | 2002 | 2003 | 2004 | 2005 | 2006 | 2007 | 2008 | 2009 | 2010 | 2011 | 2012 | 2013 |
| Illicit drugs1 | 35,132b | 34,993b | 34,807b | 35,041b | 35,810b | 35,789b | 35,643b | 38,123b | 38,908b | 38,287b | 41,479 | 41,591 |
| Marijuana and Hashish | 25,755b | 25,231b | 25,451b | 25,375b | 25,432b | 25,136b | 25,891b | 28,688b | 29,301b | 29,739b | 31,513 | 32,952 |
| Cocaine | 5,902b | 5,908b | 5,658b | 5,523b | 6,075b | 5,748b | 5,283b | 4,806a | 4,533 | 3,857 | 4,671 | 4,182 |
| Crack | 1,554b | 1,406b | 1,304b | 1,381b | 1,478b | 1,452b | 1,113b | 1,008b | 885a | 625 | 921a | 632 |
| Heroin | 404b | 314b | 398b | 379b | 560 | 373b | 455a | 582 | 621 | 620 | 669 | 681 |
| Hallucinogens | 4,749 | 3,936a | 3,878a | 3,809a | 3,970 | 3,759b | 3,670b | 4,536 | 4,543 | 4,069 | 4,306 | 4,430 |
| LSD | 999 | 558b | 592b | 563b | 667b | 621b | 808b | 790b | 881a | 880a | 1,057 | 1,111 |
| PCP | 235b | 219b | 210b | 164a | 187a | 139 | 99 | 125 | 96 | 119 | 172a | 90 |
| Ecstasy | 3,167b | 2,119a | 1,915b | 1,960b | 2,138a | 2,122a | 2,116b | 2,804 | 2,653 | 2,422 | 2,610 | 2,588 |
| Inhalants | 2,084b | 2,075b | 2,255b | 2,187b | 2,219b | 2,085b | 2,065b | 2,109b | 2,048b | 1,861a | 1,693 | 1,533 |
| Non-medical Use of Psychotherapeutics2,3 | 14,795 | 15,163 | 14,849 | 15,346 | 16,482a | 16,334 | 15,190 | 16,064 | 16,051 | 14,657 | 16,666a | 15,348 |
| Pain Relievers | 10,992 | 11,671 | 11,256 | 11,815 | 12,650b | 12,517b | 11,916 | 12,450b | 12,242a | 11,143 | 12,489b | 11,082 |
| OxyContin® | -- | -- | 1,213 | 1,226 | 1,324 | 1,427 | 1,462 | 1,685 | 1,879b | 1,623 | 1,477 | 1,442 |
| Tranquilizers | 4,849 | 5,051 | 5,068 | 5,249 | 5,066 | 5,293 | 5,099 | 5,493 | 5,583 | 5,109 | 6,073a | 5,269 |
| Stimulants3 | 3,380 | 3,031a | 3,254 | 3,088 | 3,789 | 2,994a | 2,648b | 3,093 | 2,902a | 2,700b | 3,317 | 3,492 |
| Methamphetamine3 | 1,755b | 1,602b | 1,808b | 1,603b | 1,885b | 1,345 | 854a | 1,167 | 959 | 1,033 | 1,155 | 1,186 |
| Sedatives | 981a | 831 | 737 | 750 | 927a | 864 | 626 | 816 | 906a | 526 | 590 | 639 |
| Illicit drugs other than marijuana1 | 20,423 | 20,305 | 19,658 | 20,109 | 21,262a | 21,205a | 20,018 | 21,077 | 20,625 | 18,959 | 21,267a | 19,868 |
| SOURCE: Estimates and text obtained from SAMHSA 2015a, Table 7.2A. NOTES:
|
||||||||||||
| TABLE A.2. Trends in Illicit Drug Use in Past Year among Persons Age 12 and Over, 2002-2013 (percentage) |
||||||||||||
|---|---|---|---|---|---|---|---|---|---|---|---|---|
| 2002 | 2003 | 2004 | 2005 | 2006 | 2007 | 2008 | 2009 | 2010 | 2011 | 2012 | 2013 | |
| Illicit drugs1 | 14.9a | 14.7b | 14.5b | 14.4b | 14.6b | 14.4b | 14.3b | 15.1a | 15.3 | 14.9b | 16 | 15.9 |
| Marijuana and Hashish | 11.0b | 10.6b | 10.6b | 10.4b | 10.3b | 10.1b | 10.4b | 11.4b | 11.6b | 11.5b | 12.1 | 12.6 |
| Cocaine | 2.5b | 2.5b | 2.4b | 2.3b | 2.5b | 2.3b | 2.1b | 1.9b | 1.8 | 1.5 | 1.8 | 1.6 |
| Crack | 0.7b | 0.6b | 0.5b | 0.6b | 0.6b | 0.6b | 0.4b | 0.4b | 0.3a | 0.2 | 0.4a | 0.2 |
| Heroin | 0.2a | 0.1b | 0.2b | 0.2b | 0.2 | 0.2b | 0.2a | 0.2 | 0.2 | 0.2 | 0.3 | 0.3 |
| Hallucinogens | 2.0b | 1.7 | 1.6 | 1.6 | 1.6 | 1.5 | 1.5a | 1.8 | 1.8 | 1.6 | 1.7 | 1.7 |
| LSD | 0.4 | 0.2b | 0.2b | 0.2b | 0.3b | 0.3b | 0.3b | 0.3b | 0.3 | 0.3a | 0.4 | 0.4 |
| PCP | 0.1b | 0.1b | 0.1b | 0.1b | 0.1a | 0.1 | 0.0 | 0.0 | 0.0 | 0.0 | 0.1a | 0.0 |
| Ecstasy | 1.3b | 0.9 | 0.8a | 0.8a | 0.9 | 0.9 | 0.8a | 1.1 | 1.0 | 0.9 | 1.0 | 1.0 |
| Inhalants | 0.9b | 0.9b | 0.9b | 0.9b | 0.9b | 0.8b | 0.8b | 0.8b | 0.8b | 0.7a | 0.7 | 0.6 |
| Non-medical Use of Psychotherapeutics2,3 | 6.3 | 6.4a | 6.2 | 6.3a | 6.7b | 6.6b | 6.1 | 6.4a | 6.3a | 5.7 | 6.4a | 5.8 |
| Pain Relievers | 4.7a | 4.9b | 4.7a | 4.9b | 5.1b | 5.1b | 4.8b | 4.9b | 4.8b | 4.3 | 4.8b | 4.2 |
| OxyContin® | -- | -- | 0.5 | 0.5 | 0.5 | 0.6 | 0.6 | 0.7 | 0.7b | 0.6 | 0.6 | 0.5 |
| Tranquilizers | 2.1 | 2.1 | 2.1 | 2.2 | 2.1 | 2.1 | 2.0 | 2.2 | 2.2 | 2.0 | 2.3a | 2.0 |
| Stimulants3 | 1.4 | 1.3 | 1.4 | 1.3 | 1.5a | 1.2 | 1.1b | 1.2 | 1.1a | 1.0b | 1.3 | 1.3 |
| Methamphetamine3 | 0.7b | 0.7b | 0.8b | 0.7b | 0.8b | 0.5 | 0.3a | 0.5 | 0.4 | 0.4 | 0.4 | 0.5 |
| Sedatives | 0.4b | 0.3a | 0.3 | 0.3 | 0.4a | 0.3a | 0.3 | 0.3 | 0.4a | 0.2 | 0.2 | 0.2 |
| Illicit drugs other than marijuana1 | 8.7b | 8.5b | 8.2a | 8.3b | 8.6b | 8.6b | 8.0 | 8.4b | 8.1a | 7.4 | 8.2a | 7.6 |
| SOURCE: Estimates and text obtained from SAMHSA 2015a, Table 7.2B. NOTES:
|
||||||||||||
| TABLE A.3. Trends in Past Month Alcohol Use among Persons Age 12 and Over, 2002-2013 | ||||||||||||
|---|---|---|---|---|---|---|---|---|---|---|---|---|
| 2002 | 2003 | 2004 | 2005 | 2006 | 2007 | 2008 | 2009 | 2010 | 2011 | 2012 | 2013 | |
| Number in thousands | ||||||||||||
| All | 119,820b | 118,965b | 120,934b | 126,028b | 125,360b | 126,865b | 128,884b | 130,642b | 131,374b | 133,385a | 135,502 | 136,868 |
| Binge Alcohol Use1 | 53,787b | 53,770b | 54,725b | 55,090b | 56,680b | 57,858 | 58,368 | 59,690 | 58,535 | 58,341 | 59,685 | 60,064 |
| Heavy Alcohol Use1 | 15,860 | 16,144 | 16,689 | 16,035 | 16,958 | 17,023 | 17,373 | 17,175 | 16,899 | 15,865 | 17,021 | 16,541 |
| Percentage | ||||||||||||
| All | 51.0a | 50.1b | 50.3b | 51.8 | 51.0a | 51.2 | 51.6 | 51.9 | 51.8 | 51.8 | 52.1 | 52.2 |
| Binge Alcohol Use1 | 22.9 | 22.6 | 22.8 | 22.7 | 23.0 | 23.3 | 23.4 | 23.7 | 23.1 | 22.6 | 23.0 | 22.9 |
| Heavy Alcohol Use1 | 6.7 | 6.8a | 6.9b | 6.6 | 6.9a | 6.9a | 7.0b | 6.8a | 6.7 | 6.2 | 6.5 | 6.3 |
| SOURCE: Estimates and text obtained from SAMHSA 2015a, Table 7.29A and 7.29B. NOTES:
|
||||||||||||
| TABLE A.4. Substance Dependence or Abuse for Specific Substances in the Past Year among Persons Age 12 or Older, 2002-2013 (numbers in thousands) |
||||||||||||
|---|---|---|---|---|---|---|---|---|---|---|---|---|
| 2002 | 2003 | 2004 | 2005 | 2006 | 2007 | 2008 | 2009 | 2010 | 2011 | 2012 | 2013 | |
| Illicit drugs1 | 7,116 | 6,835 | 7,298 | 6,833 | 7,024 | 6,866 | 7,012 | 7,114 | 7,144 | 6,531 | 7,312 | 6,852 |
| Marijuana and Hashish | 4,294 | 4,198 | 4,469 | 4,090 | 4,184 | 3,941 | 4,228 | 4,322 | 4,505 | 4,165 | 4,304 | 4,206 |
| Cocaine | 1,488b | 1,515b | 1,571b | 1,549b | 1,665b | 1,604b | 1,412b | 1,108a | 1,012 | 821 | 1,119 | 855 |
| Heroin | 214b | 189b | 270b | 227b | 324a | 214b | 283b | 369 | 361 | 426 | 467 | 517 |
| Hallucinogens | 426b | 321 | 449b | 371 | 380 | 369 | 362 | 373 | 402a | 342 | 331 | 277 |
| Inhalants | 180 | 169 | 233b | 221 | 176 | 164 | 175 | 164 | 169 | 141 | 164 | 132 |
| Non-medical Use of Psychotherapeutics2,3 | 2,018 | 1,923 | 2,048 | 1,959 | 2,036 | 2,167 | 2,177 | 2,297 | 2,378 | 2,139 | 2,597 | 2,281 |
| Pain Relievers | 1,509a | 1,424b | 1,388b | 1,546a | 1,636 | 1,715 | 1,715 | 1,878 | 1,923 | 1,768 | 2,056 | 1,879 |
| Tranquilizers | 509 | 435 | 573 | 419 | 403 | 443 | 453 | 476 | 522 | 400 | 629a | 423 |
| Stimulants2 | 436 | 378 | 470 | 409 | 388 | 405 | 351 | 380 | 358 | 329 | 535 | 469 |
| Sedatives | 154 | 158 | 128 | 97 | 121 | 154 | 127 | 147 | 162 | 78 | 135 | 99 |
| Alcohol | 18,100 | 17,805 | 18,654a | 18,658a | 18,852b | 18,687a | 18,478a | 18,763a | 17,967 | 16,672 | 17,714 | 17,298 |
| Both illicit drugs and alcohol1 | 3,210b | 3,054a | 3,445b | 3,273b | 3,215b | 3,184b | 3,102b | 3,243b | 2,889 | 2,598 | 2,840 | 2,589 |
| Illicit drugs or alcohol1 | 22,006 | 21,586 | 22,506 | 22,218 | 22,661 | 22,369 | 22,388 | 22,634 | 22,221 | 20,605 | 22,187 | 21,561 |
| SOURCE: Results from the 2013 National Survey on Drug Use and Health: Detailed Tables, Table 7.40A. NOTES: Dependence or abuse is based on definitions found in the DSM-IV.
|
||||||||||||
| TABLE A.5. Substance Dependence or Abuse for Specific Substances in the Past Year among Persons Age 12 or Older, 2002-2013 (percentages) |
||||||||||||
|---|---|---|---|---|---|---|---|---|---|---|---|---|
| 2002 | 2003 | 2004 | 2005 | 2006 | 2007 | 2008 | 2009 | 2010 | 2011 | 2012 | 2013 | |
| Illicit drugs1 | 3.0b | 2.9a | 3.0b | 2.8 | 2.9 | 2.8 | 2.8 | 2.8 | 2.8 | 2.5 | 2.8 | 2.6 |
| Marijuana and Hashish | 1.8a | 1.8 | 1.9b | 1.7 | 1.7 | 1.6 | 1.7 | 1.7 | 1.8 | 1.6 | 1.7 | 1.6 |
| Cocaine | 0.6b | 0.6b | 0.7b | 0.6b | 0.7b | 0.6b | 0.6b | 0.4a | 0.4 | 0.3 | 0.4 | 0.3 |
| Heroin | 0.1b | 0.1b | 0.1b | 0.1b | 0.1 | 0.1b | 0.1b | 0.1 | 0.1 | 0.2 | 0.2 | 0.2 |
| Hallucinogens | 0.2b | 0.1 | 0.2b | 0.2a | 0.2a | 0.1 | 0.1 | 0.1 | 0.2a | 0.1 | 0.1 | 0.1 |
| Inhalants | 0.1 | 0.1 | 0.1b | 0.1a | 0.1 | 0.1 | 0.1 | 0.1 | 0.1 | 0.1 | 0.1 | 0.1 |
| Non-medical Use of Psychotherapeutics2,3 | 0.9 | 0.8 | 0.9 | 0.8 | 0.8 | 0.9 | 0.9 | 0.9 | 0.9 | 0.8 | 1.0 | 0.9 |
| Pain Relievers | 0.6 | 0.6 | 0.6a | 0.6 | 0.7 | 0.7 | 0.7 | 0.7 | 0.8 | 0.7 | 0.8 | 0.7 |
| Tranquilizers | 0.2 | 0.2 | 0.2a | 0.2 | 0.2 | 0.2 | 0.2 | 0.2 | 0.2 | 0.2 | 0.2a | 0.2 |
| Stimulants2 | 0.2 | 0.2 | 0.2 | 0.2 | 0.2 | 0.2 | 0.1 | 0.2 | 0.1 | 0.1 | 0.2 | 0.2 |
| Sedatives | 0.1 | 0.1 | 0.1 | 0.0 | 0.0 | 0.1 | 0.1 | 0.1 | 0.1 | 0.0 | 0.1 | 0.0 |
| Alcohol | 7.7b | 7.5b | 7.8b | 7.7b | 7.7b | 7.5b | 7.4b | 7.5b | 7.1a | 6.5 | 6.8 | 6.6 |
| Both illicit drugs and alcohol1 | 1.4b | 1.3b | 1.4b | 1.3b | 1.3b | 1.3b | 1.2b | 1.3b | 1.1a | 1.0 | 1.1 | 1.0 |
| Illicit drugs or alcohol1 | 9.4b | 9.1b | 9.4b | 9.1b | 9.2b | 9.0b | 9.0b | 9.0b | 8.8a | 8.0 | 8.5 | 8.2 |
| SOURCE: Estimates and text obtained from SAMHSA 2015a, Table 7.40B. NOTES: Dependence or abuse is based on definitions found in the DSM-IV.
|
||||||||||||
| TABLE A.6. Comparison of 2011-2012 and 2012-2013 Model-Based Regional and State Prevalence Estimates | |||||||||||||||
|---|---|---|---|---|---|---|---|---|---|---|---|---|---|---|---|
| State | Marijuana Use Past Month | Illicit Drug Use Other Than Marijuana Past Month | Binge Alcohol Use Past Month | Alcohol Dependence or Abuse Past Year | Alcohol Dependence Past Year | ||||||||||
| 12+ (2011-2012) | 12+ (2012-2013) | 12+ (P Value) | 12+ (2011-2012) | 12+ (2012-2013) | 12+ (P Value) | 12+ (2011-2012) | 12+ (2012-2013) | 12+ (P Value) | 12+ (2011-2012) | 12+ (2012-2013) | 12+ (P Value) | 12+ (2011-2012) | 12+ (2012-2013) | 12+ (P Value) | |
| Total US | 7.13a | 7.40 | 0.025 | 3.27 | 3.36 | 0.226 | 22.80 | 22.92 | 0.574 | 6.64 | 6.70 | 0.589 | 3.16 | 3.18 | 0.816 |
| Northeast | 7.72 | 7.85 | 0.514 | 3.17 | 3.07 | 0.432 | 24.64 | 24.31 | 0.380 | 6.87 | 6.71 | 0.449 | 3.11 | 3.09 | 0.846 |
| Midwest | 6.86 | 7.09 | 0.132 | 3.20 | 3.12 | 0.420 | 25.20 | 25.54 | 0.282 | 6.99 | 6.78 | 0.200 | 3.22 | 3.18 | 0.684 |
| South | 5.83a | 6.13 | 0.034 | 3.16a | 3.35 | 0.047 | 21.48 | 21.45 | 0.916 | 5.95a | 6.28 | 0.028 | 2.90 | 3.05 | 0.138 |
| West | 9.01 | 9.36 | 0.167 | 3.57 | 3.81 | 0.125 | 21.24 | 21.77 | 0.143 | 7.24 | 7.28 | 0.870 | 3.57 | 3.47 | 0.508 |
| Alabama | 5.07 | 4.95 | 0.719 | 3.75 | 3.86 | 0.731 | 20.03 | 21.43 | 0.122 | 4.97a | 6.18 | 0.003 | 2.67a | 3.28 | 0.043 |
| Alaska | 12.97 | 11.89 | 0.189 | 3.30 | 2.96 | 0.238 | 23.63 | 22.10 | 0.102 | 8.46a | 7.12 | 0.017 | 3.61 | 3.27 | 0.265 |
| Arizona | 7.22 | 7.88 | 0.224 | 3.70 | 3.89 | 0.580 | 21.79 | 22.99 | 0.222 | 6.95 | 7.18 | 0.691 | 3.63 | 3.44 | 0.588 |
| Arkansas | 5.30 | 5.69 | 0.321 | 3.83 | 3.75 | 0.815 | 20.42 | 21.02 | 0.486 | 5.28 | 5.57 | 0.452 | 2.77 | 2.95 | 0.523 |
| California | 9.08 | 8.94 | 0.695 | 3.50 | 3.88 | 0.106 | 20.76 | 21.16 | 0.451 | 7.10 | 7.30 | 0.530 | 3.53 | 3.54 | 0.946 |
| Colorado | 10.41a | 12.70 | 0.001 | 3.64 | 3.94 | 0.385 | 23.00a | 25.51 | 0.011 | 8.05 | 7.54 | 0.332 | 4.12b | 3.50 | 0.065 |
| Connecticut | 8.44 | 8.95 | 0.316 | 2.92 | 2.7 | 0.408 | 25.70b | 23.95 | 0.084 | 7.67 | 7.05 | 0.248 | 3.18 | 3.21 | 0.919 |
| Delaware | 7.49 | 7.97 | 0.259 | 3.77 | 3.39 | 0.211 | 22.91 | 22.38 | 0.585 | 6.94 | 7.05 | 0.812 | 3.16 | 3.28 | 0.695 |
| District of Columbia | 10.45a | 12.01 | 0.025 | 4.52a | 5.77 | 0.011 | 32.57 | 33.65 | 0.356 | 11.71 | 11.96 | 0.757 | 5.62 | 5.12 | 0.335 |
| Florida | 6.65 | 7.00 | 0.255 | 2.94 | 3.06 | 0.476 | 21.16 | 20.76 | 0.482 | 5.88 | 6.12 | 0.450 | 2.84 | 2.91 | 0.735 |
| Georgia | 5.96a | 7.71 | 0.000 | 3.01a | 4.08 | 0.001 | 19.42 | 19.76 | 0.714 | 5.27 | 5.51 | 0.555 | 2.75 | 2.74 | 0.967 |
| Hawaii | 7.57b | 8.61 | 0.071 | 3.60 | 3.51 | 0.817 | 21.85 | 23.02 | 0.249 | 7.27 | 7.57 | 0.643 | 3.46 | 3.92 | 0.304 |
| Idaho | 5.29 | 5.53 | 0.548 | 3.45a | 2.67 | 0.005 | 19.90 | 19.59 | 0.732 | 6.70 | 6.65 | 0.928 | 3.17 | 2.95 | 0.447 |
| Illinois | 7.03 | 6.95 | 0.789 | 2.97 | 2.83 | 0.390 | 25.78 | 26.59 | 0.197 | 7.18a | 6.44 | 0.018 | 3.39b | 3.04 | 0.094 |
| Indiana | 6.20 | 6.28 | 0.857 | 3.96b | 3.43 | 0.068 | 24.01b | 22.29 | 0.058 | 6.84 | 6.98 | 0.779 | 3.04 | 3.12 | 0.787 |
| Iowa | 6.10 | 5.98 | 0.761 | 2.64 | 2.72 | 0.743 | 27.54 | 26.27 | 0.213 | 7.36a | 6.21 | 0.017 | 3.36 | 3.01 | 0.238 |
| Kansas | 4.06 | 4.41 | 0.316 | 2.84 | 2.75 | 0.750 | 23.37 | 24.88 | 0.108 | 6.18b | 7.06 | 0.087 | 2.96 | 3.41 | 0.183 |
| Kentucky | 5.63 | 5.35 | 0.401 | 3.10 | 3.17 | 0.797 | 22.27 | 22.04 | 0.797 | 5.34 | 5.92 | 0.158 | 2.98 | 3.09 | 0.684 |
| Louisiana | 4.62 | 5.07 | 0.211 | 3.48b | 4.05 | 0.070 | 25.06 | 25.41 | 0.739 | 6.61 | 6.05 | 0.210 | 3.21 | 3.08 | 0.617 |
| Maine | 8.38a | 9.95 | 0.010 | 3.18 | 2.81 | 0.206 | 21.48 | 21.58 | 0.919 | 6.39 | 6.36 | 0.952 | 3.16 | 3.35 | 0.576 |
| Maryland | 5.81a | 6.94 | 0.004 | 2.68b | 3.12 | 0.079 | 23.05 | 23.09 | 0.966 | 6.09 | 6.49 | 0.357 | 2.78 | 2.99 | 0.441 |
| Massachusetts | 9.37 | 9.90 | 0.373 | 3.26 | 3.04 | 0.402 | 26.62 | 25.85 | 0.450 | 7.90 | 7.10 | 0.123 | 3.51b | 3.03 | 0.068 |
| Michigan | 8.89a | 9.71 | 0.020 | 3.62 | 3.53 | 0.679 | 24.76 | 24.33 | 0.480 | 7.01 | 6.85 | 0.613 | 3.45 | 3.30 | 0.471 |
| Minnesota | 6.30 | 6.21 | 0.838 | 2.91b | 2.47 | 0.071 | 26.90 | 27.09 | 0.855 | 7.37b | 6.59 | 0.099 | 3.25 | 3.06 | 0.488 |
| Mississippi | 5.80b | 5.10 | 0.063 | 3.46 | 3.63 | 0.562 | 20.06 | 19.86 | 0.826 | 5.21 | 5.82 | 0.143 | 2.86 | 2.99 | 0.633 |
| Missouri | 5.94a | 7.10 | 0.011 | 2.89 | 3.13 | 0.339 | 23.20 | 24.37 | 0.260 | 6.18 | 6.67 | 0.268 | 2.97 | 3.13 | 0.565 |
| Montana | 10.45 | 10.33 | 0.843 | 3.26b | 2.80 | 0.083 | 25.50 | 25.28 | 0.823 | 8.20 | 8.26 | 0.925 | 3.43 | 3.84 | 0.256 |
| Nebraska | 5.51 | 5.47 | 0.913 | 2.67 | 2.34 | 0.185 | 24.07 | 23.74 | 0.736 | 7.15 | 7.82 | 0.197 | 3.08 | 3.54 | 0.149 |
| Nevada | 8.36 | 7.98 | 0.550 | 3.49 | 4.00 | 0.127 | 24.15 | 25.00 | 0.386 | 8.70b | 7.68 | 0.084 | 3.96 | 3.67 | 0.442 |
| New Hampshire | 8.37a | 9.79 | 0.005 | 3.47 | 3.54 | 0.819 | 24.02 | 24.92 | 0.350 | 6.79 | 7.63 | 0.118 | 3.11 | 3.51 | 0.228 |
| New Jersey | 6.05a | 5.21 | 0.033 | 3.25 | 2.88 | 0.160 | 23.45a | 21.55 | 0.046 | 6.72 | 6.62 | 0.839 | 2.81 | 2.84 | 0.903 |
| New Mexico | 9.14 | 9.04 | 0.873 | 3.85 | 3.74 | 0.793 | 21.38a | 24.44 | 0.006 | 7.28 | 7.37 | 0.870 | 3.26 | 3.24 | 0.932 |
| New York | 8.24 | 8.28 | 0.899 | 3.02 | 3.10 | 0.705 | 24.22 | 24.76 | 0.417 | 6.56 | 6.58 | 0.953 | 3.11 | 3.23 | 0.567 |
| North Carolina | 6.49 | 6.17 | 0.453 | 2.88b | 3.34 | 0.074 | 18.26b | 20.02 | 0.056 | 4.87a | 5.85 | 0.024 | 2.36 | 2.76 | 0.117 |
| North Dakota | 5.15 | 5.19 | 0.914 | 2.39 | 2.79 | 0.124 | 30.37 | 30.43 | 0.956 | 8.69 | 8.42 | 0.649 | 3.47 | 3.69 | 0.516 |
| Ohio | 7.37 | 7.60 | 0.448 | 3.51 | 3.61 | 0.623 | 24.20 | 24.81 | 0.304 | 6.85 | 6.43 | 0.171 | 3.14 | 3.01 | 0.505 |
| Oklahoma | 6.04 | 5.56 | 0.306 | 3.70 | 3.40 | 0.301 | 21.78 | 23.29 | 0.147 | 8.16b | 7.24 | 0.099 | 3.27 | 3.29 | 0.956 |
| Oregon | 12.16 | 11.92 | 0.763 | 3.81 | 4.07 | 0.464 | 22.39 | 21.66 | 0.441 | 7.53 | 7.09 | 0.399 | 3.87 | 3.49 | 0.289 |
| Pennsylvania | 6.18 | 6.46 | 0.296 | 3.16 | 3.14 | 0.924 | 24.81 | 24.96 | 0.811 | 6.57 | 6.48 | 0.802 | 3.03 | 2.87 | 0.418 |
| Rhode Island | 13.00 | 14.08 | 0.155 | 4.70 | 4.27 | 0.304 | 30.11a | 27.49 | 0.022 | 8.92 | 8.48 | 0.464 | 3.87 | 3.97 | 0.775 |
| South Carolina | 7.20 | 6.87 | 0.461 | 3.45 | 3.69 | 0.421 | 23.94 | 22.97 | 0.315 | 6.07 | 5.99 | 0.863 | 3.18 | 3.09 | 0.770 |
| South Dakota | 5.79b | 5.03 | 0.062 | 2.81 | 2.44 | 0.138 | 28.94a | 26.56 | 0.017 | 8.68 | 7.96 | 0.180 | 3.67 | 3.58 | 0.782 |
| Tennessee | 5.41 | 5.42 | 0.963 | 3.42 | 3.16 | 0.322 | 18.04 | 16.91 | 0.176 | 5.79 | 5.57 | 0.578 | 2.88 | 2.87 | 0.982 |
| Texas | 5.11 | 5.31 | 0.389 | 3.15 | 3.23 | 0.650 | 23.55a | 22.39 | 0.046 | 6.51 | 6.67 | 0.574 | 3.02 | 3.17 | 0.419 |
| Utah | 4.41b | 5.07 | 0.056 | 3.13 | 3.16 | 0.900 | 15.83 | 16.25 | 0.614 | 4.76 | 5.36 | 0.123 | 2.61 | 2.63 | 0.942 |
| Vermont | 12.86 | 11.76 | 0.148 | 3.74 | 3.37 | 0.263 | 22.86b | 21.16 | 0.063 | 6.72 | 6.83 | 0.841 | 2.93 | 3.20 | 0.398 |
| Virginia | 5.54b | 6.29 | 0.053 | 3.01 | 2.90 | 0.657 | 20.85 | 22.19 | 0.135 | 6.02a | 7.39 | 0.008 | 3.07 | 3.46 | 0.145 |
| Washington | 10.21a | 12.28 | 0.001 | 3.89 | 4.02 | 0.705 | 21.42 | 20.80 | 0.479 | 7.72 | 7.60 | 0.805 | 3.61 | 3.37 | 0.414 |
| West Virginia | 5.27 | 5.07 | 0.613 | 3.11a | 2.45 | 0.007 | 19.78 | 19.44 | 0.699 | 5.77 | 6.06 | 0.537 | 2.93 | 3.06 | 0.647 |
| Wisconsin | 6.69 | 6.49 | 0.626 | 2.85 | 3.08 | 0.436 | 27.42a | 29.99 | 0.032 | 7.13 | 7.71 | 0.294 | 3.07b | 3.62 | 0.089 |
| Wyoming | 5.68 | 5.82 | 0.773 | 2.53 | 2.25 | 0.312 | 23.29 | 24.41 | 0.238 | 7.72 | 8.13 | 0.483 | 3.64 | 3.90 | 0.462 |
| SOURCE: Estimates and text obtained from SAMHSA 2015d. NOTES:
|
|||||||||||||||
Appendix B. Recent Efforts to Assess Substance Use Disorder Workforce Capacity
There have been numerous efforts over the last ten years to identify the limitations of the SUD treatment workforce and develop action steps to address those limitations. Although some efforts have been made to begin addressing the workforce limitations, the fundamental issues identified in these recent studies persist. The data required to monitor progress toward strengthening the workforce is limited. In particular, the most recent data available on the number of SUD treatment professionals were collected over 15 years ago. Although no recent data exist on the size of the workforce, more recent studies have analyzed other aspects of the workforce. In this section, we provide an overview of recent efforts to assess workforce capacity. The findings from these efforts are reported in earlier sections of this report.
1. Estimates of the Size of the Workforce
The most recent data available on the size of the SUD workforce is from the ISS, which collected data on the workforce at specialty SUD treatment facilities in 1999 (Lewin and NORC 2000). The facilities eligible for the ISS were those responding to the 1997 Uniform Facility Data Set (UFDS) survey that served more than ten clients. A stratified random sample of 276 facilities was selected to respond to the study questionnaire. Each of the responding facilities was asked to develop a list of the facility's practitioners in three strata: licensed counselors, master's-level behavioral health professionals who were not licensed in substance abuse treatment, and unlicensed substance abuse counselors with less than master's-level training in behavioral health. Sampling weights were used to estimate the number of practitioners at specialty SUD treatment nationally based on responses from the sampled facilities. Note that the sample of facilities included in this study was small relative to the overall 16,695 facilities included in the 1997 UFDS. Standard errors and confidence intervals were not reported with these estimates, but given the small sample size, the errors could be large, depending on the variation across the sample.
Three years before the ISS, the ADSS collected data on the SUD treatment workforce. The ADSS was designed to produce nationally representative estimates of specialty SUD treatment facilities. Data on staffing was collected in Phase I of the survey from December 1996 through June 1997. Facility directors at 2,395 facilities representing 12,387 SUD treatment facilities nationwide were asked to report the number of full-time, part-time, and contract staff in various professional categories. The following types of facilities were excluded from the ADSS: halfway houses without paid counselors, solo practitioners, correctional facilities, U.S. Department of Defense facilities, HHS Indian Health Service facilities, and facilities that were intake and referral only. Although the ADSS survey was conducted three years before the ISS, the estimates from the ADSS on the size of the workforce may be more reliable because the sample size was ten times larger than the ISS sample.
Given the lack of recent data on the size of the SUD treatment workforce, Advocates for Human Potential (2015) created a provider availability index for SUD treatment using data on behavioral health professionals more generally. The numerator of this index is the number of adults aged 17 and older with an SUD in a given geographic area estimated based on the National Survey on Drug Use and Health (NSDUH). The denominator is the number of behavioral health practitioners in the geographic area estimated based on the Occupational Employment Statistics (OES) from the BLS. The practitioners included in the denominator include the following OES occupational categories: clinical counseling and school psychologists, psychiatrists, mental health and SUD social workers, SUD and behavioral disorder counselors, mental health counselors, and rehabilitation counselors. The authors acknowledge that this denominator substantially overstates the number of professionals focused on SUD treatment, however the available data do not allow for identification of SUD professionals specifically. The inclusion of individuals focused on mental health severely limits the utility of these estimates for assessing capacity for SUD treatment.
2. Other Estimates of Workforce Capacity
Although, we did not identify any more recent studies estimating the size of the SUD treatment workforce, several recent studies have assessed other aspects of the SUD workforce.
SAMHSA has funded two projects to identify the limitations of the SUD treatment workforce and to develop recommendations and actions steps to address these limitations. In 2006, SAMHSA published the findings from a project that sought to gain stakeholder recommendations for approaches to strengthen the SUD treatment workforce (Whitter et al. 2006). The project began with an environmental scan of the recent research related to the workforce. Then, in January-May 2004, SAMHSA held nine separate meetings with 128 individuals representing diverse stakeholder groups. During these meetings, SAMHSA solicited information and recommendations from the participants. In total, the final report presented 21 stakeholder recommendations. In 2007, SAMHSA published an action plan for addressing the needs of the SUD treatment workforce prepared by the Annapolis Coalition (Hoge et al. 2007). The recommendations in this action plan were based on the work of 12 expert panels and work groups focused in different areas of the SUD treatment field such as rural, educators, cultural competencies and disparities, and SUD treatment. The work groups were responsible for gathering and reviewing available information and formulating a set of proposed goals, objectives, and actions in their area. The action plan identified seven goals for the workforce.
The CASA has conducted two recent studies focused on important areas for the workforce. The first study (2010) addressed SUD treatment need and receipt among the prison and jail population. The second study (2012) reviewed the evidence on effective screening, intervention, diagnosis, treatment, and disease management, and identified the gaps between the scientific evidence on best treatment practices and existing treatment practices. These studies provide evidence related to key aspects of the workforce not addressed in other studies.
Although no recent estimates exist on the size of the workforce, there is recent data on the characteristics of the workforce available from the Vital Signs survey (Ryan et al. 2012). The ATTC Network collected these data between November 2011 and May 2012. In addition to the information collected through responses to the standard survey, ATTC conducted key informant interviews to obtain qualitative information about the workforce. ATTC interviewed 27 clinical directors and 25 thought leaders. Clinical directors were interviewed about successful strategies employed to prepare and recruit individuals to enter the workforce and thought leaders were interviewed on the trends most pertinent to the workforce. ATTC selected clinical directors for these interviews based on responses to the standard survey instrument indicating that the clinical director was highly satisfied with their agency's recruitment and retention strategies. ATTC's thought leader interviews included academics, direct care providers, state and federal policymakers, leaders of national organizations, advocates, and other stakeholders
Finally, SAMHSA prepared a report on mental health and substance abuse workforce issues for Congress in 2013 (Hyde 2013). This report summarized the most current knowledge on workforce demographics and conditions, enumerated workforce needs, and provided information on SAMHSA initiatives to address workforce needs.
Thus, although there is limited information on the number of SUD treatment professionals, the available research addresses many aspects of SUD treatment capacity.
Notes
-
Here an SUD is defined as meeting diagnostic criteria for substance abuse or dependence based on survey response.
-
According to NSDUH between 2013 and 2014 the point estimate for number of individuals who received any specialty treatment in the past year rose from 2,466,000 to 2,606,000, an increase of 140,000 individuals. However, this increase is not statistically significant (SAMHSA 2015e).
-
Treatment at an emergency room, private doctor's office, self-help group, prison or jail, or hospital as an outpatient is not considered specialty treatment.
-
NSDUH uses face-to-face audio, computer-assisted self-interviews to collect data on the currency and frequency of illicit drug and alcohol use, problems/symptoms associated with alcohol and/or drug use, and receipt of alcohol and/or drug treatment. The sample frame excludes active military personnel, United States citizens living abroad, residents of institutional settings (for example, prisons, hospitals, and nursing homes), and homeless individuals not living in a shelter at the time of the survey.
-
The N-SSATS is primarily a web-based survey. N-SSATS is a census of all known, public and private, facilities that provide substance abuse treatment. It excludes those programs located in jails or prisons, serving only incarcerated clients, and solo practitioners (unless a state substance abuse agencies specifically requests to include them).
-
This report intends to provide a comprehensive view of SUD treatment services provided nationally. Although the Treatment Episodes Dataset (TEDS) data include extensive information on SUD treatment admissions, these data were not used in the current report because the set of admissions represented in TEDS varies by state (for example some states report admissions regardless of source of payment while others report only publicly funded admissions).
-
Illicit use of psychotherapeutics includes the non-medical use of pain relievers, tranquilizers, stimulants, or sedatives and does not include over-the-counter drugs.
-
Here an SUD is defined as meeting diagnostic criteria for substance abuse or dependence based on survey response.
-
Estimates for 2014 from SAMHSA (2015e).
-
In a given state, solo practitioners may be included in the N-SSATS if a state substance abuse agency specifically requests their inclusion.
-
Care in this setting may be residential (52 percent), outpatient (40 percent) or inpatient (8 percent).
-
Pre-ACA estimates--looking at either all of 2013, September 2013, or the third quarter of 2013--indicate that between 18 percent and 21 percent of Americans were uninsured, After its implementation--using estimates for either the first quarter of 2014, March 2014, or the first half of 2014--the numbers decreased to between 13 percent and 18 percent.
-
Beronio et al. (2013) used data from the 2011 Medical Loss Ratio filings and a 2011 study comparing benefits in small group products to state and federal employee plans to estimate the number of insured individuals who would gain SUD coverage through ACA provisions.
-
SAMHSA developed projections in two stages (SAMHSA 2014c). First, baseline projections in absence of important laws affecting spending such as the ACA were developed. Then the projections were adjusted to reflect the effects of this legislation. The baseline projection methods included disaggregating historical spending into growth factors (for example, population growth, change in users per population, and change in intensity of use per user or technology change), projecting growth factors responsible for increases in spending through 2020 and developing forecasts of provider spending from projected factors through 2020. Adjustments associated with ACA legislation were developed through two approaches: (1) Simulating the health care costs of users moving from one insurer to another, due to the expansion of Medicaid and the introduction of insurance marketplaces; and (2) calculating the differences in growth in the National Health Expenditure Accounts for all-health spending with and without the effects of the ACA and applying these differences to the growth rates for spending in the baseline.
-
This is slightly lower than the 26 million projected in the latest CBO projections (CBO 2014).
-
See Finkelstein et al. (2011), page 22.
-
In 2003, Maine enacted mental health parity coverage law and the Dirigo Health Reform Act. DirigoChoice was launched in 2004. Massachusetts enacted a major health care reform law in 2006. Vermont passed its parity law in 1997 and the Vermont Blueprint for Health, a strategic planning tool to specifically address the increasing costs of chronic diseases, was enacted in 2004.
-
Licensing or certification requirements for SUD professionals vary across states. States that require SUD treatment professionals to be licensed have a legal authority that reviews each applicant's qualifications and grants licenses to applicants meeting the state's requirements for licensure in a given professional category. Licensed individuals are permitted to provide services within the scope of practice of the license for the given state. Professional certification is similar to licensure in that an authoritative body reviews an applicant's qualifications and certifies that an applicant meets all requirements; however certification is distinct from licensure in that the certifying body may not have legal authority associated with medical practice in a particular state.
-
Detailed information on the state requirements for each type of professional can be found in NASADAD (2013) Table 8.
-
It is possible for facilities to operate above capacity by serving individuals with SUD treatment needs in beds that are not specifically designated for SUD treatment.
Project and Report Information
This report was prepared under contract #HHSP23320100019WI between the U.S. Department of Health and Human Services (HHS), Office of Disability, Aging and Long-Term Care Policy (DALTCP) and Mathematica Policy Research. For additional information about this subject, you can visit the DALTCP home page at http://aspe.hhs.gov/office-disability-aging-and-long-term-care-policy-daltcp or contact the ASPE Project Officer, Judith Dey, at HHS/ASPE/DALTCP, Room 424E, H.H. Humphrey Building, 200 Independence Avenue, S.W., Washington, D.C. 20201. Her e-mail addresses is: Judith.Dey@hhs.gov.