
Examining Relationships in an Integrated Hospital System
Final Report
Prepared by: RTI International 1440 Main Street, Suite 310 Waltham, MA 02451 March 2008
Prepared for:Office of the Assistant Secretary for Planning and Evaluation (ASPE)U.S. Department of Health and Human Services (HHS)
This report is available on the Internet at:http://aspe.hhs.gov/health/reports/08/examine/report.html
Printer Friendly Version in PDF format (102 pages)
Table of Contents
EXECUTIVE SUMMARY 1. BACKGROUND2. DATA AND METHODS 2.1 Data Sources 2.2 Episode Construction 2.3 Defining Organizational Relationships 2.4 Descriptive and Multivariate Analyses 2.4.1 Geographic Analyses 2.4.2 Post-Acute Care Episode Analyses 2.4.3 Multivariate Analyses3. GEOGRAPHIC ANALYSIS RESULTS 3.1 Geographic Distribution of Providers: Free-standing versus Hospital-based 3.1.1 Overall 3.1.2 Free-standing versus Hospital within Hospital (HwH) LTCHs 3.1.3 Free-standing versus Hospital-based IRFs 3.1.4 Free-standing versus Hospital-based SNFs 3.2 Geographic Distribution of Providers: Co-located 3.3 Beds per Beneficiary in 2006 3.3.1 Acute Beds per 1000 Beneficiaries 3.3.2 SNF Beds per 1000 Beneficiaries 3.3.3 IRF Beds per 100,000 Beneficiaries 3.3.4 LTCH Beds per 100,000 Beneficiaries 3.3.5 Home Health Agencies per 100,000 Beneficiaries 3.4 Changes in Beds per Beneficiary between 2000 and 2006 4. POST-ACUTE CARE EPISODE ANALYSIS RESULTS 4.1 Post-Acute Care Episodes: First PAC Site of Care, Index Admission Length of Stay and Payment, and Demographics 4.1.1 DRGs by Post-Acute Care Setting 4.2 Post-Acute Care Transition Patterns 4.3 Discharges to Post-Acute Care by Organizational Relationship 4.4 Post-Acute Care Episode Length of Stay and Payment, By Claim Type, DRG, and APR-DRG 5. MULTIVARIATE ANALYSIS RESULTS 5.1 Regression Results and Effect of Organizational Relationships 5.2 Effects of Organizational Relationships on Readmission Rates 5.3 Probability Estimates for First Post-Acute Discharge Destination 5.3.1 DRG 089: Simple Pneumonia 5.3.2 DRG 209: Joint and Limb Reattachment Procedure 6. DISCUSSION 6.1 Implications of the Findings 6.2 Next Steps 7. REFERENCES8. FOOTNOTESAPPENDIX A Number and Type of Providers, By State, 2006APPENDIX B Percentage change in beds per beneficiaries, 2000 2006
Figures
Figure 3-1. Distribution of Freestanding versus Hospital-based SNFs, IRFs, and Freestanding and HwH LTCHs in 2006Figure 3-2. Distribution of Freestanding versus HwH LTCHs, 2006 Figure 3-3. Distribution of Freestanding versus Hospital-based IRFs, 2006 Figure 3-4. Distribution of Freestanding versus Hospital-based SNFs, 2006 Figure 3-5. Geographic Distribution of Co-located Providers, 2006 Figure 3-6. Acute Beds per 1,000 Beneficiaries, 2006 Figure 3-7. SNF Beds per 1,000 Beneficiaries, 2006 Figure 3-8. IRF Beds per 100,000 Beneficiaries, 2006 Figure 3-9. LTCH Beds per 100,000 Beneficiaries, 2006 Figure 3-10. Number of HHAs per 100,000 Beneficiaries, 2006 Figure 4-1. Post-Acute Care Transitions for Acute Hospital Discharges, 2005 Figure 4-1a. Number and Percent of Admissions Figure 4-1b. Utilization and Medicare PaymentsFigure 4-2. Transitions for Acute Hospital Discharges from DRG 89: Simple Pneumonia and Pleurisy Age >17 with CC 4-4 Figure 4-2a. Number and Percent of Admissions Figure 4-2b. Utilization and Medicare Payments Figure 4-3. Transitions for Acute Hospital Discharges from DRG 209: Major Joint and Limb Reattachments for Lower Extremity Figure 4-3a. Number and Percent of Admissions Figure 4-3b. Utilization and Length of Stay
Tables
Table 3-1. Largest Increases and Decreases in Beds per Beneficiaries from 2000 2006 Table 4-1. Acute Index Admissions, Length of Stay and Payment, By Discharge Destination, 2005 Table 4-2. 2005 PAC Episodes, Live Discharges Demographics and Severity Table 4-3. First Site of Post-Acute Care, by Acute Index Admission DRG Table 4-4. Acute Index Admission DRGs, Ranking by First Site of Post-Acute Care Table 4-5a. Post-Acute Care Transition Pattern Analysis Number of Beneficiaries, Episode Payments, and Episode Length of Stay Post-Acute Care Users, 2005 Table 4-5b. Post-Acute Care Transition Pattern Analysis Number of Beneficiaries, Episode Payments, and Episode Length of Stay DRG 209 Post-Acute Care Users, 2005 Table 4-5c. Post-Acute Care Transition Pattern Analysis Number of Beneficiaries, Episode Payments, and Episode Length of Stay DRG 089 Post-Acute Care Users, 2005 Table 4-6. Proportion of Discharges to each First PAC Setting by Organizational Relationship, 2005 (Overall) Table 4-7. Proportion of Discharges to each First PAC Setting by Organizational Relationship, 2005 (New England) Table 4-8. Proportion of Discharges to each First PAC Setting by Organizational Relationship, 2005 (South Atlantic) Table 4-9. Proportion of Discharges to each First PAC Setting by Organizational Relationship, 2005 (Pacific) Table 4-10.Proportion of Discharges to each First PAC Setting by Organizational Relationship, 2005 (Middle Atlantic) Table 4-11. Proportion of Discharges to each First PAC Setting by Organizational Relationship, 2005 (East North Central) Table 4-12. Proportion of Discharges to each First PAC Setting by Organizational Relationship, 2005 (West North Central) Table 4-13. Proportion of Discharges to each First PAC Setting by Organizational Relationship, 2005 (East South Central) Table 4-14. Proportion of Discharges to each First PAC Setting by Organizational Relationship, 2005 (West South Central) Table 4-15. Proportion of Discharges to each First PAC Setting by Organizational Relationship, 2005 (Mountain) Table 4-16.Utilization1 and Payment, by Claim Type, by DRG and APR-DRG Severity Index, for Live Discharges, 2005 Table 5-1. Regression Results Predicting Index Admission Length of Stay, Any PAC Use, and First Discharge Destination, 2005 Table 5-2a. Logistic Regression Results Predicting Readmission During PAC Episode, 2005 Table 5-2b. Regression Results Predicting Readmission During PAC Episode, 2005 Table 5-3. Probabilities of first post-acute discharge destinations, represented as percentages, based on whether the discharging hospital has sub-providers or co-located providers Table 5-3a. DRG = 089 Simple Pneumonia Table 5-3b. DRG = 209 Joint and Limb Reattachment Procedure
EXECUTIVE SUMMARY
The Medicare program provides an extensive benefit package for beneficiaries. Past research and policy analysis has focused largely on the costs and use of individual types of Medicare-certified providers. However, program costs are associated with beneficiary service use, and the majority of program costs are related to inpatient and post-acute services since these services are typically more expensive than individual physician visits. This study constructs episodes of care for beneficiaries with at least one hospital stay during 2005 and examines their total episode cost and utilization. Post-acute care episodes include index acute admissions, skilled nursing facility (SNF), inpatient rehabilitation facility (IRF), long term care hospitals (LTCH), home health agency services (HHA), hospital outpatient therapy (HOPD), and acute hospital readmissions. Information about the beneficiarys individual characteristics, the market characteristics, and the inter-organizational provider relationships is used to identify factors associated with PAC utilization patterns.
This study focuses on the effects of organizational relationships on post-acute utilization patterns. Specifically, this work addresses the issue of whether a formal or informal relationship between a hospital and a PAC provider influences the acute hospital discharges likelihood of PAC use, and specifically the type of PAC service used. While past research has examined the effects of organizational factors on predicting PAC service use, most of that research has been specific to one type of PAC service. Many have studied the differences in populations and costs for patients treated in hospital-based SNFs compared to those in free-standing SNFs. Similar studies of home health, and to a lesser extent acute rehabilitation services have also been conducted by the Medicare Payment Advisory Commission and others. One study by RAND examined the effects of proximity on likelihood of use but few have looked at the effects of these relationships on beneficiary site of care choices.
The PAC markets have changed dramatically over the last couple decades. Many hospitals have subproviders or hospital-based PAC units. For example, about one-fifth of all acute hospitals have a hospital-based SNF unit or an IRF unit or both. Hospitals also frequently own home health agencies, accounting for almost 25 percent of all HHAs. LTCHs have also expanded over the last decade opening hospitals-within-hospitals, which in effect, are units in acute hospitals specializing in longer-stay patients.[1] Hospitals with formal relationships, such as ownership of PAC providers, have a financial incentive to discharge their patients earlier to a PAC site, and depending on the type of case and the relative Medicare payments, to one type of setting over another. The subproviders may or may not be profitable given that they may act as loss-leaders for parent organizations, allowing acute hospitals to limit their losses on longer staying patients while not profiting on the patients they admit. These incentives may affect discharge decisions as much as individual medical factors, depending on the type of case and level of severity. Yet, few studies have been done to examine these differences.
In addition to the formal organizational relationships, many PAC providers may have informal organizational relationships by opening satellite facilities of one PAC provider in a complementary acute care setting across town. Satellite facilities are authorized in the regulations, yet little information exists on where they are actually located. Their bed counts, billing addresses, and other program regulatory materials are tied to the parent organization masking the effects of these satellites while they operate as sub-provider units without the financial impacts. Unlike PAC providers that are subproviders, satellite facilities have a choice to enter a market suggesting they operate in areas with win-wins for both the hospital and the PAC provider.
The goal of this study is to evaluate the impact of organizational relationships, both formal and informal, on the use of post-acute care services. This study examines how provider relationships may affect transfer patterns across post-acute settings. Our analyses focus on the types of patients likely to use PAC, and after controlling for case-mix differences, examines the effects of organizational relationships on the PAC decisions, the type of PAC used, the likelihood of hospital readmissions, and the associated lengths of stay and costs of care in each setting. The primary focus is on the relationship between the hospital with the index admission and the first post-acute care provider. This study examines the extent to which these relationships are associated with differences in transfer patterns, lengths of stay in each type of post-acute setting, costs of care, and patient outcomes as measured through readmission rates.
Section 1 provides a literature review and discusses the policy issues remaining to be examined. Much of this past work has been setting-specific with only a few researchers examining episodes of care. The work that has been done suggests that formal relationships have an effect and raise the question of how much more influence may be due to informal relationships not yet considered.
Section 2 gives an overview of the data sources, the methods, and the limitations of each dataset in answering these questions. This study uses multiple administrative files to construct episodes of care and identify organizational relationships. Information on the geographic distribution of providers is taken from the Online Survey Certification And Reporting (OSCAR) files which provide counts of providers in each state. Information on ownership relationships is derived from the Healthcare Cost Report Information System (HCRIS) data which identify each subprovider owned by a participating hospital. Episodes of care are constructed from Medicare administrative claims files which provide person-level service utilization to understand episodes of care, services used across a related period of service use, and costs and utilization levels within each episode, particularly as they vary for beneficiaries with different medical conditions. This section also discusses the dearth of data on organizational relationships. The analyses in this study are limited by the inavailability of data on actual locations of satellite facilities and chain or corporate membership. These factors can affect the costs of producing healthcare and could be identified through data sources such as the Provider Enrollment Chain Ownership System (PECOS) dataset, but the lack of completeness makes this dataset unusable in these analyses.
Section 3 provides a context for understanding PAC services in the U.S. State-level counts of hospital and PAC providers show the states that are rich in post-acute resources, such as Texas, Florida, California, Pennsylvania, Ohio, and Illinois. Other states tend to have fewer PAC providers, including the Midwest and Western regions of the country. Most PAC providers, particularly the LTCHs, SNFs, and HHAs tend to be free-standing providers although the majority of IRFs are hospital-based units.
LTCHs and IRFs are not as widely available as SNFs and HHAs. LTCHs tend to be located in the Northeast and Southern parts of the U.S. while IRFs tend to be in Texas, California, Pennsylvania, and New York. SNFs and HHAs are widely available in most states. These two types of providers represent the backbone of PAC in the U.S. The 15,000 SNFs and nearly 9,000 HHAs dwarf the 1,200 IRFs and nearly 400 LTCHs.
Understanding actual capacity, though, requires comparing the number of providers in each state to the relative number of beneficiaries. Section 3 further examines the number of PAC beds and HHAs relative to the number of beneficiaries in each state. While certain states have high numbers of providers, they also have large numbers of beneficiaries. Certain states, such as those in the Midwest and South, have high numbers of acute care beds relative to beneficiaries. SNF capacity reflects the availability of acute care services but expands even further across the northern and central states. States with high numbers of SNF beds relative to beneficiaries include many of the rural states of the north, such as Montana across to Minnesota, down through Nebraska, Kansas, Oklahoma, and over through Ohio.
IRF capacity shows that certain southern states, such as Louisiana and Arkansas, have high numbers of IRF beds relative to beneficiaries. The southern states, such as Texas, Oklahoma, and Tennessee, remain high, even relative to the number of potential users. LTCH beds dominate states like Louisiana and Massachusetts while many states in New England and the western part of the country lack LTCH beds.
Home health agencies are available in every state. Counts of HHAs are a relatively weak measure of capacity since agency size can vary. However, certain states have high numbers of agencies. Only 6 states had few HHAs per 100,000 beneficiaries, including those in the South and the Northeast regions. States in the West and Midwest have the highest number of agencies.
Growth in PAC beds is also indicative of changing trends in the availability of services. In general, growth rates tend to vary with volume. States with the lowest number of providers have the highest growth rates. This suggests that PAC services are growing, in general, with all four types of providers becoming more available across the U.S.
Section 4 provides information on the PAC episodes who uses PAC services and, how their utilization patterns vary by diagnoses and severity of illness or by the availability of PAC services. The bivariate analyses show that PAC users tend to be female and older beneficiaries. PAC utilization also varied significantly by severity of illness. Beneficiaries with higher severity levels tended to be discharged from the hospital to LTCHs and SNFs. Those with lower medical severity levels tended to be discharged to IRFs, HHAs, and hospital outpatient therapy sites.
PAC use also varied by patient condition. Patients with index hospital DRGs for orthopedic procedures, such as major joint procedures, back problems, and other orthopedic services tended to be admitted to IRFs or SNFs while those with medical DRGs, such as pneumonia tend to be discharged to LTCHs, and SNFs. HHAs tended to admit both medical and rehabilitation populations. It was interesting to note that DRGs, alone do not explain site of care choices. Many DRGs have high proportions of cases admitted to multiple sites of care.
Organizational relationships were important for predicting post-acute site of care choices. Three types of relationships were examined: subproviders which are owned by the parent hospital, co-located facilities which are free-standing but located within 250 yards of another provider, and other free-standing facilities. As shown in the provider distribution maps, the majority of PAC providers are free-standing with the exception of IRFs which tend to be hospital-based. Co-location provides additional information regarding the availability of nearby providers not otherwise identified in the certification data. These patterns vary across the U.S. with certain regions having higher proportions of discharges to co-located providers although these appear to vary by type of PAC service rather than geographic markets. For example, the highest proportion of hospital-within-hospitals or co-located LTCHs are in the South Atlantic region and the East Central regions, both North and South. Co-located IRFs tend to be in the West South Central region. For SNFs, co-located providers tended to be in the Pacific, Middle Atlantic, and West South Central regions. Co-located HHAs tended to be in the New England area, although, this measure is less significant for HHAs which tend to deliver services in decentralized locations, thereby minimizing the importance of being co-located to the discharging hospital or other providers.
Section 5 presents the multivariate results. This section is important for understanding the relative effects of these factors on predicting PAC use, index hospital length of stay, hospital readmissions, and the first site of care for those who used PAC. The multivariate results support the descriptive results presented in Section 4. The probability of PAC use rose with age, particularly for SNFs although age had little effect on the likelihood of LTCH use. Severity of illness was one of the most important factors predicting index hospital length of stay, any PAC use, and the first site of care. Beneficiaries with higher severity levels had longer index lengths of stay and higher probability of using LTCHs although the odds of discharge to PAC rose as the beneficiaries severity increased.
Supply factors were also important in certain models. These factors were not significant in predicting acute length of stay or the probability of PAC use but they were significant in predicting the likelihood of being discharged to certain settings, particularly for the less common services of LTCHs and IRFs.
The organizational factors were also important in explaining index hospital length of stay and in predicting PAC use. Patients treated at hospitals with subproviders tended to have longer length index stays and higher probability of PAC use. These results suggest these hospitals may be treating sicker patients since the index stay was longer rather than shorter in hospitals with subproviders. The higher PAC use may be related to these differences. Co-location was also associated with a higher probability of PAC use. While these variables are interesting, the more refined measures of relationships between having a subprovider or co-located provider and the likelihood of using that type of service tell a slightly stronger story. Beneficiaries treated in hospitals with a subprovider or co-located IRF were more than two times likely to be discharged to an IRF and significantly less likely to be discharged to an LTCH or SNF. Similarly higher odds were found for LTCH admissions from hospitals that have hospitals-within-hospitals while their likelihood of using HHAs, IRFs, and SNFs is significantly lower. Similarly, having a subprovider SNF was significantly associated with lower likelihood of using all other services although co-located SNFs were associated with higher use of other PAC services.
The most important factor predicting readmission rates were the severity of illness, although variations in DRGs also were associated with different rates of readmission. Still, these results suggest that medical need is the greatest predictor of readmissions.
The last part of the section provides information on the relative effects of severity and the organizational factors in predicting the types of PAC services used. Two sets of base cases are presented: one for patients discharged from the hospital with DRG 89: Pneumonia and one for beneficiaries with DRG 209: Joint and Limb Replacements. The base case in these analyses is a white female, 65-74 years old, with no Medicaid history, in the ENC region, and the discharging provider has no sub-providers or co-located providers. In looking at the medical case, DRG 89, the less severe base case (APR-DRG 2) is most likely to be discharged to HHA (52 percent) although the more severely ill pneumonia case is most likely to be discharged to SNFs (48.3 percent of these cases). Having a SNF subprovider increases the relative likelihood of using SNF services from 30.8 percent for the APR-DRG 2 case to 35.7 percent while having a co-located provider (defined as a freestanding provider located within 250 yards) increases SNF use to 32.4 percent, a slightly smaller, but still significant increase in use. Similar effects are found for the more severely ill pneumonia case with the likelihood of using SNF services increasing almost 6 percentage points for patients discharged from a hospital with a SNF subprovider and almost 2 percentage points for those havng a co-located SNF. Similar effects are found for the LTCH users with pneumonia. Having a co-located LTCH increases the likelihood of using that service significantly, more than doubling the likelihood, all else constant.
In the DRG 209 group, similar increases are found for IRF and SNF users. The base case with an APR-DRG of moderate severity (group 2) is most likely to use HH (36.3 percent discharged to HH) but the effects of subproviders and co-location is muted here with little difference in probability associated with being a subprovider or co-located HHA. However, the probability of using SNFs and IRFs grows dramatically if the discharging hospital has a subprovider of co-located provider. The probability of SNF use increases 6.5 percentage points if the discharging hospital has a subprovider SNF. Having a subprovider IRF increases the likelihood of using IRF services by almost 15 percentage points from 21.5 to 36.1 percent likely to use IRF services. Among the APR-DRG group 4, the probability almost doubles if the hospital has a subprovider IRF unit. Having a co-located IRF has almost the same impact for both groups.
These results are important for understanding the factors affecting site of care choices. Medical need is important as shown by the consistently significant effects of the APR-DRG measure. But organizational relationships are also important, even after controlling for demographic and market characteristics. These factors are independent of medical need and reflect measures of supply, both formal and informal measures that may affect discharge decisions at the hospital level. The high level of potential substitution among PAC services underscores the importance of understanding the relative impact of medical and non-medical factors in determining site of care choices.
More work is needed in this area to better measure the relationship between the discharging hospital and the receiving PAC provider. This study examines whether having a PAC provider available through either a formal or informal relationship affects the probability of using that type of provider or decreases quality of care, as measured through readmission rates. The results suggest that these organizational relationships are significant in predicting service use but not in predicting outcomes. More refined analysis is needed to understand the effects of these relationships on whether the beneficiary uses the related PAC provider. These are some of the issues that will be examined in the coming year.
1. BACKGROUND
Medicare payment policies for post-acute care (PAC) have undergone dramatic changes over the last decade, evolving continuously since 1998 when skilled nursing facilities (SNFs) first shifted to prospective payment systems (PPS) and continuing through today as adjustments and refinements are implemented for inpatient rehabilitation facility (IRF) PPS, long-term care hospital (LTCH) PPS, home health PPS, and SNF PPS (Cotterill and Gage, 2002, Gage and Green, 2006; Gage et al., 2005). Each PPS has its own case-mix system, base rates, and payment rules leading to varying payment incentives across each setting. However, many of these providers may be treating the same patients and, depending on the geographic location and individual patient preferences, may even be providing substitute services for each other. Many researchers have explored some of the differences in populations admitted to these settings, particularly between those using hospital-based subproviders versus free-standing types of providers (Stearns, Dalton and Holmes, 2006; Dalton et al., 2005; Blewett, Kane, and Finch, 1995). Few have examined the effects of hospital ownership as a determinant of the type of post-acute service used. Yet, these issues were important enough to have been addressed in the Balanced Budget Act of 1997 which required hospitals to inform patients of the range of SNF or HHA providers available to them and not just refer them to their own sub-provider (42 CFR 482.43). Their importance continues today as the Centers for Medicare and Medicaid Services (CMS) attempts to understand the factors that predict the type of PAC service used, including patient, provider, and market-based factors (Gage, Ingber, Constantine, et al., 2008)
Medicare post-acute care (PAC) payment policies were significantly redesigned in the Balanced Budget Act of 1997 and subsequent legislation (Cotterill and Gage, 2002). Skilled nursing facilities (SNFs) moved from cost-based payment systems to case-mix adjusted prospective payment systems (PPS) in 1998, home health agencies (HHAs) in 2000, inpatient rehabilitation facilities (IRFs) in 2002 and long-term care hospitals (LTCHs) later that year. At the same time, the inpatient prospective payment system (IPPS) transfer policy was initiated, which reduced payments to general acute hospitals for 10 DRGs when they were discharged to a PAC setting.[2] Outpatient therapies, which serve as potential substitutes for home health therapy moved to a standardized fee schedule at this time.[3] These payment systems were implemented on a staggered basis. Each uses a different case-mix adjustment system and different tools to collect the case-mix factors (Gage and Green, 2006).
A few studies have examined the impact of these changes on access to certain PAC services, but typically they have focused on one particular PAC as a starting point. Several have focused on the effects of the home health payment changes (McCall et al., 2003; Gage, 1998); or changes related to the effects of the IRF PPS (Beeuwkes-Buntin et al., 2005; Gage and Morley, 2007); or SNF payment policy changes (Liu and Black, 2003; Stearns, Dalton and Holmes, 2006; Dalton et al., 2005; Gilman, Gage, and Osber, 2003). The LTCH PPS, which is the newest system, has undergone the fewest post-PPS studies (MedPAC, 2004; Gage et al., 2006). Several studies have looked across PAC episodes of care to follow changes in use resulting at one point in time (Gage, Morley, and Green, 2006; Gage and Morley, 2006; Buntin et al., 2005; Gage, 1999;), and one has examined differences over time in the types of PAC episodes experienced by different Medicare beneficiaries (Gage et al., 2005).
PAC policy reform presents special challenges as the factors affecting site of care for PAC include not only clinical issues such as severity of illness, but also supply factors. While SNFs and HHAs are available in most parts of the United States, IRFs and LTCHs are only available in select states (Gage, Moon, and Chi, 1999). In some areas, LTCHs may act as IRFs providing the exact same services to the same types of beneficiaries (Gage et al., 2005). SNF specialization may also vary widely with some providing subacute rehabilitation services in areas that lack IRF options.
The absence of consistent assessment tools across PAC settings to measure patient acuity and functional impairment adds to the difficulty of monitoring differences in levels of care and outcomes across settings. Most of the new PPSs are based on mandatory assessment data that measure patient acuity at various times throughout each stay. However, problems in using these tools to monitor episodes across settings are numerous (Gage and Green, 2006). While the concepts are similar in each assessment tool, the specific items vary making it difficult to track patient outcomes without creating crosswalks. Alternative methods must be used to case-mix adjust these populations and control for differences in acuity as they affect PAC choices. Current efforts at the Centers for Medicare & Medicaid Service (CMS) include the development of a uniform patient assessment instrument that can be used across post-acute settings (Gage et al, 2007). The use of this new instrument in the Post-Acute Care Payment Reform Demonstration, a Congressionally mandated demonstration, will help shed more light on patient case-mix differences across settings of care.
Further, differences in the constructs of each PAC payment system has made it difficult to compare program costs across settings. Each PPS has a different base rate per service unit, different service units, and different sets of relative value units (payment weights). For example, the base rate in FY 2007 for an IPPS stay was $5,309, whereas the IRF base rate was $12,952, and the LTCH base rate was $38,086. Without standardized case-mix measures across settings, it is difficult to assess whether these different rates are appropriate and for which cases. RTI has begun examining some of these issues in its analysis of certain PAC margins (Gage et al., 2006).
Payment units also vary by setting, with most hospital PPSs (except psychiatric) using discharge-based payments, SNFs using days of care, and HHAs using 60-day episodes; this further complicates the task of measuring the cost-effectiveness of Medicare services by site of care. Other factors affecting post-acute care cost per case are the differences in the payment systems include differences in eligibility criteria. For example, beneficiaries entering SNFs must have a 3-day acute hospital stay prior to SNF admission whereas beneficiaries entering IRFs and LTCHs do not have this requirement. CMSs Post-Acute Care Payment Reform Demonstration will improve cost comparisons by type of setting by collecting cost and resource data along with the patient assessment instrument data. These new data will provide standardized information on the costs and resources required to treat patients in each post-acute care setting.
Organizational linkages are another critical factor that may explain some of the differences observed in post-acute utilization patterns, and perhaps mistakenly ascribed to other factors, such as geographic variation or unobserved clinical differences. Many studies have examined differences between hospital-based and free-standing SNFs (Stearns, et al., 2006; Pizer, White, and White, 2002; MedPAC, 2005). Home health affiliations also have been studied extensively (Kenney, 1993; Kenney and Dubay, 1992; ProPAC, 1996). However, few studies have examined the effects of owning a PAC provider as it affects hospital discharges except on a small sample (Blewitt, Kane, and Finch, 1995). Yet, organizational relationships may play an important role in discharge patterns. For example, a hospital with an IRF unit may be more likely to discharge a patient to the IRF than to another setting, such as a SNF, depending on the relative payments per patient. Conversely, a hospital that owns both an IRF and a SNF may be more likely to discharge a lower paying rehabilitation patient, such as a single hip replacement to their SNF than to their IRF as the relative margins may be greater in the SNF. The physical proximity of this next level of care and the financial relationship between the settings may play a role in discharge decisions along with the clinical characteristics of the patient.
Information on the various relationships is limited. Ownership relationships can be identified between hospitals and PAC subproviders by using the Medicare Hospital Cost Report Information System (HCRIS). However, other types of relationships such as satellite facility locations or other types of co-located organizations are not as readily identifiable. For example, a third of the LTCHs are Hospital-within-Hospital organizations yet there is no centralized source for identifying the host facility in which the LTCH is located. Similarly, rehabilitation hospitals, SNFs, and Critical Access Hospitals (CAHs) may be co-located in other organizations buildings. If the addresses are exactly the same, one can identify these embedded organizations using the certification data, or the Online Survey and Certification Reporting System (OSCAR) data. However, the address for the co-located facility is often not provided in these sources. Instead, the parent organization is the only identified address. ThePECOS data set is a relatively new dataset that has the potential to capture location of satellite and other inter-governmental relationships at time, but does not for all providers. (please see discussion in next section for more information)
The goal of this study is to learn more about how provider organizational relationships may affect transfer patterns across post-acute settings. The analyses presented here use existing data sources and innovative methodologies, such as those developed by the medical geographers, to describe the current distribution of post-acute providers in the United States. Also included in the study are analyses of the average utilization and Medicare payments for a post-acute episode of care, and the effects of organizational links between acute hospitals and post-acute care providers on the likelihood of transfers to a Medicare post-acute provider. This study examines transfer patterns across post-acute care settings using a 5% national sample of 2005 Medicare claims data. The results of these analyses provide information on how post-acute transfer patterns from the acute hospital to the first site of post-acute care are affected by the presence of hospital-based sub-providers and co-located providers.
2. DATA AND METHODS
2.1 Data Sources
Four data sources were examined for this effort, although only three were used. The primary data source for this study was the 2005 Medicare claims data which provided information on utilization and Medicare payments associated with each hospital discharge and post-acute care episode. Several other data sources were examined for their use in determining the nature of organizational relationships between hospitals and PAC providers. We explored the use of the Hospital Cost Report Information System (HCRIS), the Online Survey and Certification Reporting System (OSCAR), and the Provider Enrollment Chain Ownership System (PECOS) in order to see which sources provided the most complete and reliable information on the relationships between hospitals and PAC providers. The use of each of these data sources is described below.
Medicare Claims Data. The 2005 Medicare claims files were used to track patterns of post-acute care use, including PAC service mix, length of stay, payment, and readmission rates. The Medicare claims files were used to build episodes of post-acute care using inpatient acute, inpatient rehabilitation facility, long term care hospital, skilled nursing, home health, and outpatient therapy claims. We also used the Medicare claims to examine transfer patterns within PAC episodes to learn more about factors predicting first site of care after an acute hospital discharge and subsequent settings of care in a PAC episode. We applied case mix measures to the PAC episodes using the 3M Health Information Systems All Patient Refined DRG (APR-DRG) software to assign severity of illness to index hospitalizations. The APR-DRG was used to distinguish beneficiary severity level at the time of PAC initiation. Key study variables from the Medicare data include lengths of stay by setting and Medicare payments by setting and across the episode.
Online Survey and Certification Reporting System (OSCAR). The 2006 OSCAR database contains information on facility characteristics including ownership, bed capacity, and rural versus urban location. These facility characteristics were used in both descriptive and multivariate analysis. The OSCAR data was the source for initial geographic analyses looking at the distribution of different types of post-acute providers by state. The OSCAR data were also used to identify co-located providers using the provider address reported in the OSCAR files. After geo-coding the addresses in the OSCAR data to identify the latitude and longitude of each provider, RTI used geographic mapping tools (GIS) to identify co-located facilities, defined as within 250 yards of each other. This definition of co-location is consistent with regulation defining co-located long term care hospitals. However, because the OSCAR data typically reports a corporate address and not the individual provider address, we suspect the co-location factor is under-reported in our analyses.
The GIS methods allow us to match latitude and longitude designations for each provider address. This information is used in a calculation of distance between providers. Providers with an address that is within 250 yards of other providers are considered co-located. Where this database lacks addresses for satellite facilities and hospitals-within-hospitals, these organizations are not counted as co-located.
Hospital Cost Report Information System (HCRIS). The HCRIS files (FY 2004-2005) are available for hospitals, hospices, renal dialysis facilities, skilled nursing facilities and home health agencies. Facility identification numbers for wholly-owned hospital-based PAC settings were identified from the parent institutions files and linked to provider IDs in the Medicare claims episode of care files. By linking provider IDs in this way, we were able to track referral patterns to related hospital-based sub-providers. RTI explored using the OSCAR files versus the HCRIS data to identify hospital-based sub-providers and found that the HCRIS data was more reliable than the OSCAR data for this purpose. Sub-providers have formal ownership relationships which must be reported in the HCRIS data.
Provider Enrollment, Chain, Ownership System (PECOS). The PECOS database is a national provider enrollment system that contains information on all providers that have filled out the 855 provider enrollment form since 2002. Though initially this data base seemed to have potential for identifying the full range of organizational relationships that may exist between providers, including sub-providers, satellite facilities, chain membership, and location of these related providers, these data are not sufficiently complete at this time for use in a national study. ASPE and RTI contacted those currently working to populate the PECOS data at CMS to learn more about the level of completeness. CMS indicated that the 855 forms are completed by newly enrolling Medicare providers and by providers that have had a change in ownership, but the forms are not completed by other providers already participating in Medicare. The data in the PECOS is a point in time snapshot of the facility organizational status and does not contain historical information. The data set is not complete at this time. Due to the fact that this data does not contain information on all providers in the nation, it was not feasible to use the PECOS to identify organizational relationships for the purposes of this national study, though this database has the potential to be a valuable resource for identifying organizational relationships in the future.
2.2 Episode Construction
Study Period. The 2005 Medicare claims were the basis for the analysis. Though the analysis took place on the 2005 data, we also used the last quarter 2004 and first quarter 2006 data to impose our episode construction criteria, which include a 60-day gap in acute and post-acute care service use before an index acute admission and following the last episode claim. These criteria eliminate any left-hand or right-hand truncation issues in analyzing the full 2005 claims file. Since the last post-acute prospective payment system was implemented in 2002, the data reflect full implementation of the post-acute prospective payment systems.
Episode Definition. PAC episodes were based on live beneficiary discharges from an index hospitalization into one of the related care settings: IRF, LTCH, SNF, HHA, or hospital outpatient therapy. Hospital outpatient therapy services were included in PAC use because these services could be a substitute for home health care.
Individual episodes were created at the person-level. Each beneficiarys claims were sorted chronologically to construct a file of the PAC services that meet the episode definition. Identification of an index admission requires a 60-day period prior to the index admission without an inpatient acute or post-acute claim. We used the following criteria to identify the start of a PAC episode of care:
Within 5 days discharge from an acute hospital bed, first PAC admission to:
- Inpatient Rehabilitation Facility (IRF) bed in either a free-standing IRF or a distinct part unit within acute hospital; or
- Long Term Care Hospital (LTCH) bed; or
- Skilled Nursing Facility (SNF); or
- Within 14 days of discharge from an acute hospital bed, first PAC service by:
- Home Health Agency (HHA); or
- Hospital outpatient therapy service use.
PAC episodes are variable in length and include all claims subsequent to the first PAC service until a 60-day gap in use occurs. Acute hospital readmissions are included in the post-acute care episode. We used this definition rather than analyzing all services within a 180 day period post index admission because it restricts use to those services that could be related to the initial reason for hospitalization. The variable length definition will exclude extraneous services in examining ownership effects. These services could otherwise moderate the effects of the relationships examined because the additional services were unrelated to the original index admission.
2.3 Defining Organizational Relationships
In the multivariate analyses we focused on the organizational relationship between the discharging acute provider and the first post-acute provider.[4] We identified three types of organizational relationships between the acute hospital and the first post-acute provider:
Acute hospital discharges to:
- Freestanding providers
- Hospital-based (owned) sub-providers
- Co-located providers (excluding sub-providers)
Hospital-based sub-providers were identified through the HCRIS data. These data contain the provider ID numbers of all HHA, SNF, and IRF sub-providers and their respective hosts. These data provided an accurate measure of the post-acute providers that an acute hospital owns.
Co-located providers were identified using the addresses reported in the OSCAR data. RTI geo-coded the addresses for all post-acute providers in the OSCAR data to identify the latitude and longitude of each provider. RTI used this geo-coded data with geographic mapping tools (GIS) to identify co-located facilities. Co-located providers were defined as within 250 yards of each other. It is important to note that the accuracy of this co-location definition is directly related to the level of accuracy of the address reported in OSCAR. Provider chains may report their corporate address in the OSCAR file, rather than the address of a specific provider, which limits the reliability of this measure.
These three types of organizational relationships are mutually exclusive. For example, a hospital-based sub-provider was classified as such, though it is also likely to be co-located (located within 250 yards) with the acute provider. Co-located providers were restricted to those providers that are co-located but not identified as a hospital-based sub-provider. This relationship is particularly relevant to LTCHs as LTCHs cannot be sub-providers of acute hospitals under current rules. However, a substantial number are co-located within a hospital although they must be certified (and meet the conditions of) independent hospitals. All other organizational relationships between an acute provider and the first post-acute provider not otherwise defined as hospital-based sub-provider or co-located were defined as freestanding.
One type of organizational relationship that we were unable to define using these data sources was satellite providers. A satellite provider is a provider that is owned by another organization but operates at a separate geographic location. Satellite providers do not have unique provider IDs which prevents them from being identified as separately located entities through OSCAR or HCRIS data. These providers have the same provider ID as their parent organization in most instances. Providers are required to report satellite facilities to their Fiscal Intermediaries but this is not consistently done. Geographic information on these providers is, therefore, unavailable although many function similarly to a sub-provider by making beds available to the host facility. Hence, while the host provider may have no measurable financial relationship with the satellite provider, they do have an incentive to discharge to the satellite facility to reduce the length of stay associated with their payment. The PAC provider also gains since they have a close referral source to increase their admissions. Yet, this relationship is not visible without accurate location information on each set of beds.
Chain relationships are another problematic area for measuring formal ties. The OSCAR data contains a variable identifying chain membership for each organization. Affiliation with a chain may reduce provider costs by allowing shared services across the corporation. However, the chain variable in the OSCAR data is not reliable and leads to undercounting of organizational relationships that exist between post-acute providers. Though the PECOS data collects this information, the level of completeness of the data at this time is not sufficient for the current study.
Using the available data on organizational relationships, we created a set of dummy variables to identify the type of organizational relationships existing for each acute provider in the sample. These dummy variables identified the presence or absence of any sub-provider, or any co-located provider. And more specifically, additional dummy variables were created to identify whether the acute hospital had any IRF sub-provider, any SNF sub-provider, any HH subprovider or any IRF co-located provider, or a SNF co-located provider. These variables were used in multivariate analysis to predict any post-acute care service use, first post acute discharge setting, index acute admission length of stay, and readmission during the post-acute episode.
2.4 Descriptive and Multivariate Analyses
2.4.1 Geographic Analyses
The OSCAR data were used to examine the distribution of post-acute providers nationally (see section 3). This included looking at the number of hospital-based versus freestanding SNFs, IRFs, LTCHs, and HHAs in each state. These analyses also looked at the distribution of types of co-located providers across the United States. In order to understand the difference in supply of each type of post-acute provider, we also examined differences in the number of available beds per type of post-acute provider per state. HHA capacity was not included in the models as the measure must rely on staffing or utilization since beds do not apply. Staffing estimates in the OSCAR are not reliable and utilization is based on claims data which is already being used in the models. Including a home health use measure would create endogeneity problems. However, capacity is described in this section.
2.4.2 Post-Acute Care Episode Analyses
Episodes of care were constructed to understand the factors associated with the use of different PAC services. Transition patterns were analyzed for different groups of patients to learn more about the proportion of patients discharged to each post-acute setting and where they are likely to be discharged next. DRG-specific episode transitions were also examined to identify variations in condition-specific discharge patterns. Descriptive tables examine up to 5 transfers between sites and report the volume having different episode patterns, their lengths of stay and Medicare payments associated with each subsequent setting (see Section 4).
The post-acute care episode data was also case-mix adjusted using the 3M APR-DRG grouping software to assign a severity of illness measure to the index acute hospitalization. The APR-DRG grouper uses principal diagnosis and secondary diagnoses to assign a severity of illness (SOI) subclass to each index admission. The SOI subclass has values of 1-4 corresponding to: minor severity (1), moderate severity (2), major severity (3), or extreme severity (4). Analyses of utilization, length of stay, and Medicare payments were performed by DRG and by APR-DRG to learn more about differences in post-acute service use by diagnosis and severity level.
2.4.3 Multivariate Analyses
Four multivariate models were run to examine the effects of organizational relationships on post-acute service use, readmission during post-acute episodes, index admission length of stay, and first site of post-acute care. The first two models predicting post-acute service use were binomial logistic regression models where the dependent variable was the presence or absence of a post-acute episode claim (1/0) or a hospital readmission during the episode of care. The third model was an ordinary least squares (OLS) regression model with a continuous dependent variable indicating the beneficiarys length of stay in the index hospitalization. The fourth model was a multinomial logistic regression model predicting the first site of post-acute care for the subset of hospital discharges with a post-acute episode claim. The reference group for this model was hospital outpatient therapy. The model predicts the odds of being discharged to SNF, HHA, IRF, or LTCH compared to being discharged to hospital outpatient therapy.
The independent variables across models included demographic characteristics such as gender, Medicaid status, age, and race; APR-DRG severity of illness level; supply of IRF, SNF, and LTCH beds per state; and census region. The supply measures of beds per beneficiary per state were included to control for availability of PAC providers and potential provider substitution. These measures are based on Medicare provider certification files (OSCAR). Home health agencies and hospital outpatient departments are widely available across the nation and were not identified in these models. Characteristics of the discharging acute hospital were also included in the models predicting any post-acute service use and acute admission length of stay. These variables included number of beds in the acute hospital, urban versus rural location, and for-profit versus not-for-profit versus government run control.
Dummy variables for the five most frequent hospital DRGs for PAC users were included in each model to capture the added effect of particular diagnoses and the impact of medical versus rehabilitation DRGS in each of the models. These top five DRGs included DRG 209: Major Joint & Limb Reattachment Procedures of Lower Extremity, DRG 089: Simple Pneumonia & Pleurisy Age > 17 w CC, DRG 014: Specific Cerebrovascular Disorders Except TIA, DRG 127: Heart Failure & Shock, and DRG 210: Hip & Femur Procedures Except Major Joint Age > 17 w CC. These five DRGs encompass the most common three DRGs in each PAC setting except for LTCH. The two most common LTCH DRGs are for tracheostomy procedures and these DRGs are discharged to non-LTCH settings with very low frequency. The uncommon observance of these DRGs in the other PAC settings led to model convergence issues when these DRGs were included.
The key study variables included in each multivariate model were related to organizational characteristics. The models predicting any PAC use, acute hospital readmission, and predicting acute index admission length of stay included dummy variables indicating if the acute index hospital had any type of sub-provider or any type of co-located provider. The multinomial logit model included more specific organizational relationship variables indicating the presence or absence of specific post-acute sub-providers or co-located providers. Since the multinomial logit predicts the specific setting of post-acute care, it is important to know whether the acute index hospital has an organizational relationship with the type of post-acute provider to which a beneficiary is discharged. Correlations were run for all independent variables included in the multivariate models and no significant correlation was noted.[5]
3. Geographic Analysis Results
3.1 Geographic Distribution of Providers: Free-standing versus Hospital-based
This section provides an overview of the availability of post-acute care services throughout the United States. We focus on the overall distribution of providers, differences in the share that are free-standing versus hospital-based, and differences in bed availability relative to population size. These results are discussed for specific U.S. states, Census divisions, and Census regions. The results are displayed both graphically in maps as well as in tabular form (see Appendices A and B for more detail).
3.1.1 Overall
In 2006, there were over 16,000 SNFs, IRFs, and LTCHs in the U.S. The majority of LTCHs, SNFs and HHAs tend to be free-standing providers whereas IRFs tend to be units in hospitals (Appendix A). As Figure 3-1 shows, the geographic distribution of SNFs, IRFs, and LTCHs vary widely across the U.S. The Northeast region was the most densely populated with post-acute care facilities, the majority of which were free-standing and the Mountain region was the least densely populated. Overall, Texas had the most facilities, with over 3,000. Florida, California, Pennsylvania, Ohio, and Illinois all had between 1,349 and 3,070 post-acute care facilities in 2006. In contrast, the majority of the states (particularly in the Midwest and West regions) had fewer than 318 free-standing or hospital-based SNFs, IRFs, and LTCHs in 2006.
3.1.2 Free-standing versus Hospital within Hospital (HwH) LTCHs
LTCHs are not equally available across the nation. The majority are located in the Northeast and Southern parts of the U.S. (Figure 3-2). In 2006, there were 392 LTCHs in the U.S., the majority of which were free-standing (244, or 62%) or not co-located with acute hospitals. It is notable that the majority of the West region and a large proportion of the Midwest region had fewer than 9 LTCHs per state in 2006. The exception was California, which had 14 LTCHs (all free-standing) and Oklahoma, which also had 14 LTCHs (11 of which were free-standing). Most notably, the states of Montana, Alaska, Iowa, Maine, Vermont, and Oregon had no LTCHs in 2006. Although overall, most LTCHs were free-standing in 2006, Texas and Ohio were the states with the most co-located hospital-within-hospital (HwH) LTCHs, with 27 and 14 respectively. HwHs include co-located providers and satellite facilities. As noted earlier, data limitations limit our ability to fully capture all satellite facilities. Texas also had the most free-standing LTCHs (40), followed by Louisiana (33). Behind Texas and Ohio, Michigan, Indiana, and Pennsylvania were the states most densely populated with LTCHs, with between 16 and 23 per state (mostly free-standing). Overall, the East North Central division of the Midwest and the Mid-Atlantic division of the Northeast were the most densely population regions of the U.S. in terms of LTCHs in 2006.
Figure 3-1. Distribution of Freestanding versus Hospital-based SNFs, IRFs, and Freestanding and HwH LTCHs in 2006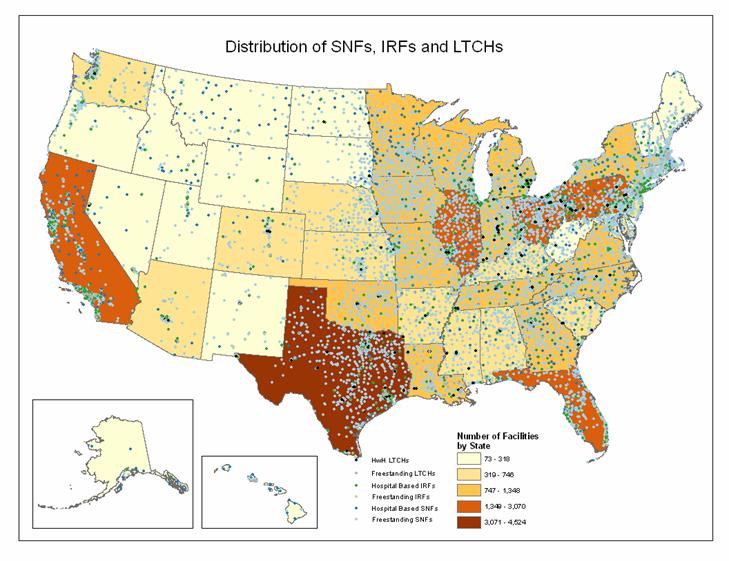
SOURCE: RTI Analysis of 2006 POS data
Figure 3-2. Distribution of Freestanding versus HwH LTCHs, 2006
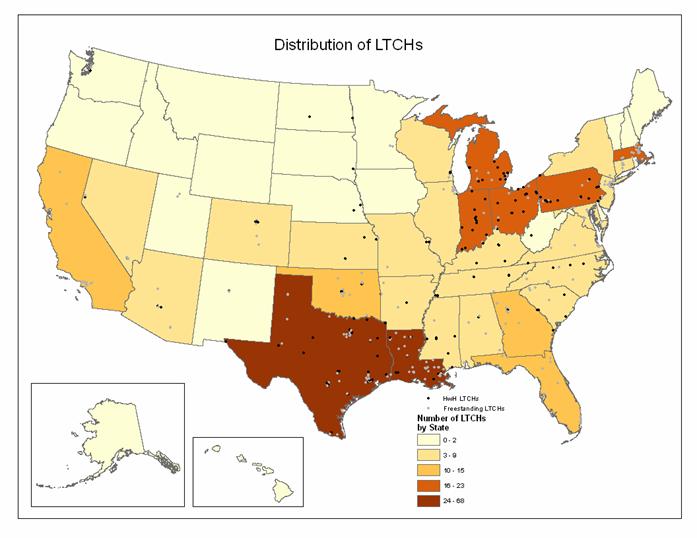
SOURCE: RTI Analysis of 2006 POS data and information provided by fiscal intermediaries on HwH LTCHs.
3.1.3 Free-standing versus Hospital-based IRFs
Figure 3-3 shows the geographic distribution of IRFs in 2006. There were 1,224 IRFs in the U.S in 2006, and the vast majority of them were hospital-based (1007, or 82%). Texas was the most densely populated in terms of IRFs, with 121 (89, or 73% hospital-based). After Texas, the four states with the most IRFs were Pennsylvania with 82 IRFs (66, or 80% hospital-based), California with 80 IRFs (74, or 93% hospital-based), and New York with 74 (with 73, or 99% hospital-based). In contrast to these states with many IRFs in 2006, the majority of U.S. states had fewer than 20 IRFs. In fact, Hawaii had only one IRF in 2006. Similar to the distribution seen for LTCHs, the East North Central division of the Midwest region and the Mid-Atlantic division of the Northeast region were most densely populated with IRFs in 2006, and the West region (with the exception of California) was the least densely population with IRFs in 2006.
3.1.4 Free-standing versus Hospital-based SNFs
Figure 3-4 shows the geographic distribution of SNFs in 2006. With 15,017 providers, SNFs were by far the most prevalent type of post-acute care facility in the U.S. in 2006. In contrast to LTCHs and IRFs, the vast majority of SNFs were free-standing (13,810, or 92%). The three states with the most SNFs in 2006 were Texas, with 1,071 (1,028, or 95%, free-standing), California, with 1,206 (1,061, or 88%, free-standing), and Ohio, with 944 (897, or 95%, free-standing).
3.2 Geographic Distribution of Providers: Co-located
Figure 3-5 shows the geographic distribution of co-located facilities in the U.S. in 2006. In this study, co-location was defined as a facility within 250 yards of another acute, SNF, IRF, or LTCH provider. Co-located facilities can also be in the same building as one another. This close proximity is often referred to as a medical mall where patients may be easily transported across the street but technically they are discharged out of the hospital system. All co-location analyses excluded home health as well as subproviders. Home health agencies were excluded from this definition because they provide de-centralized services in the home. Where ownership (defined in this study as a subprovider) may affect utilization patterns, the location of the agency is irrelevant since the service is delivered in the home. Overall, the most frequent co-located facility combination was IRFs that were co-located with acute care providers. Overall, Texas and California have the most co-located facilities in the U.S. and Vermont has the fewest. The New England division was the most densely populated with co-located providers, particularly IRFs co-located with acute care providers. Similar to findings previously described for freestanding versus hospital-based subprovider geographic analyses, the West region (with the exception of California) and the West North Central division of the Midwest region were the areas that were most sparsely populated with co-located providers.
Figure 3-3. Distribution of Freestanding versus Hospital-based IRFs, 2006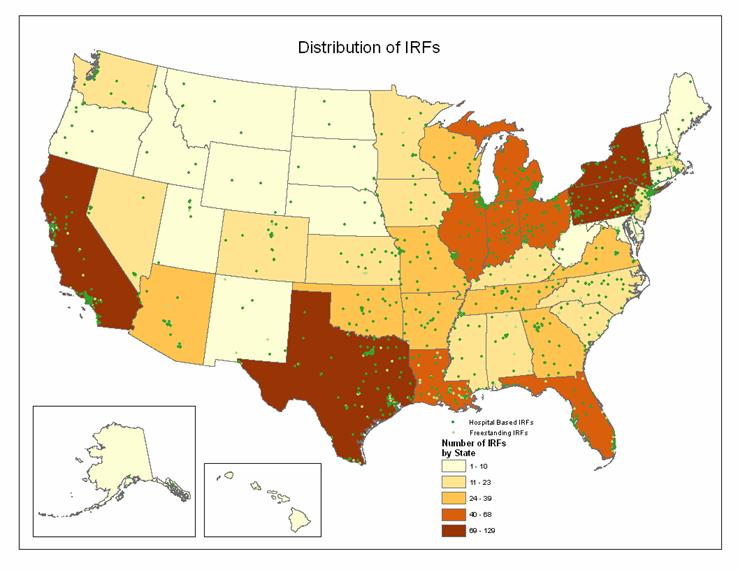
SOURCE: RTI Analysis of 2006 POS data.
Figure 3-4. Distribution of Freestanding versus Hospital-based SNFs, 2006
Figure 3-5. Geographic Distribution of Co-located Providers, 2006
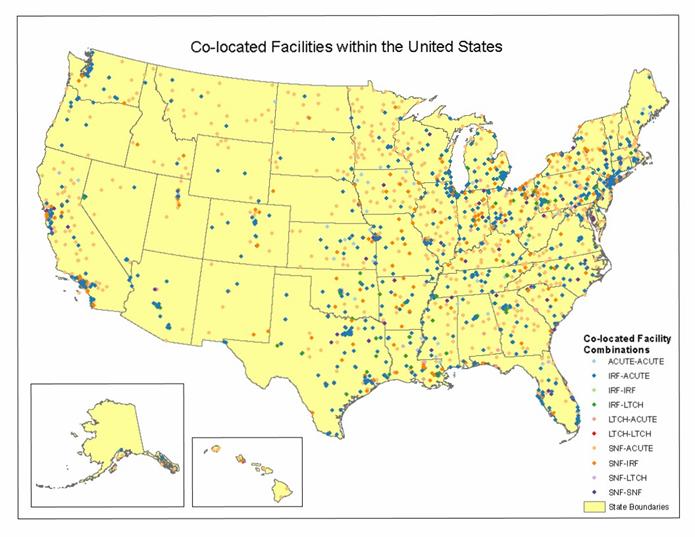
NOTE: Co-located providers were identified using geographic analysis (GIS) of POS provider addresses. Co-located providers were defined as providers within 250 yards of each other. SOURCE: RTI Analysis of 2006 POS data.
3.3 Beds per Beneficiary in 2006
While the previous section described overall numbers of providers, this section describes capacity relative to demand. The next few maps show the number of beds relative to 1000 beneficiaries in the state. This is useful for considering the relative availability of services and where organizations may have the greatest opportunity to provide substitute services by one of their subproviders or collocated facilities.
3.3.1 Acute Beds per 1000 Beneficiaries
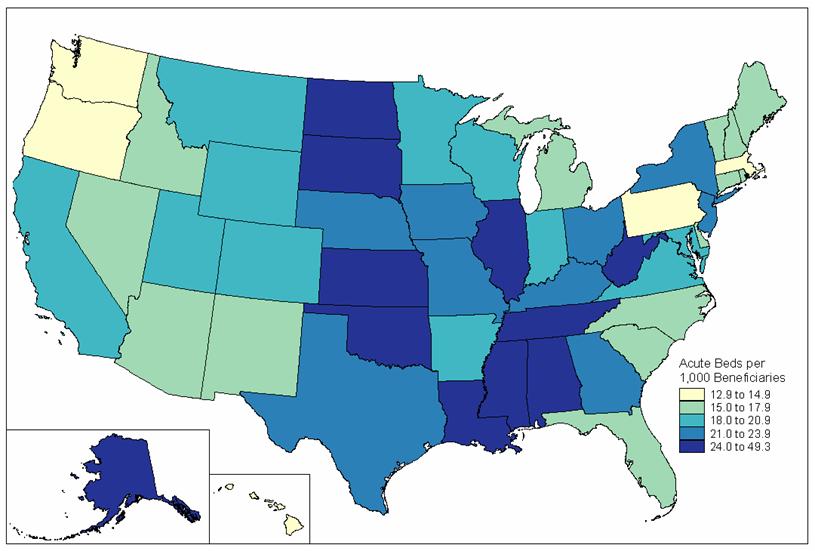
Figure 3-6 displays the geographic distribution of the acute beds per 1000 beneficiaries in the U.S. in 2006. Clearly there is wide variation. West Virginia had the most acute beds per 1000 beneficiaries at over 21. In contrast, Delaware had the fewest acute beds per 1000 beneficiaries, at fewer than 6. Most states (35) had between 6 and 14 acute beds per 1000 beneficiaries. Overall, the Midwest and South regions had, on average, the most acute beds per 1000 beneficiaries while the West region had the fewest acute beds per 1000 beneficiaries in 2006. These numbers may reflect differences in the presence of managed care which tends to have a minimizing effect on bed supply. Post-acute care, by definition, begins with an acute hospital discharge so this map is useful for understanding potential regional differences in hospital use, and therefore, PAC use.
3.3.2 SNF Beds per 1000 Beneficiaries
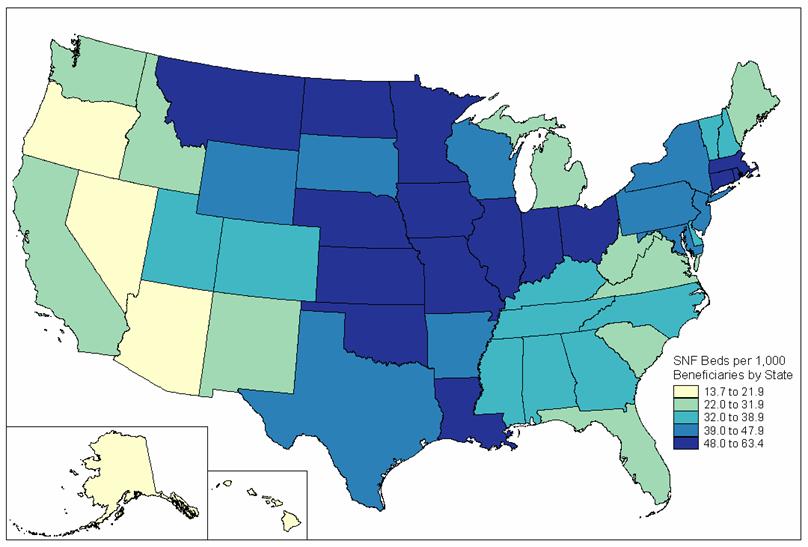
Figure 3-7 displays the geographic distribution of the SNF beds per 1000 beneficiaries in the U.S. in 2006. Five states had more than 52 SNF beds per 1000 beneficiaries in 2006: North Dakota, Nebraska, Iowa, Louisiana, and Connecticut. In contrast, four states had fewer than 20 SNF beds per 1000 beneficiaries (all in the West region): Oregon, Nevada, Arizona, and Alaska. By far, the West North Central division of the Midwest region, and the West South Central division of the South region had the most SNF beds per 1000 beneficiaries, as most of these states had between 41 and 63. The South Atlantic division in the South had the second highest beds SNF per 1000 beneficiaries, as all of these states had between 20 and 41. The Pacific and Mountain divisions in the West region had the fewest SNF beds per 1000 beneficiaries, as many of these stated has fewer than 20 in 2006.
Figure 3-6. Acute Beds per 1,000 Beneficiaries, 2006.
 SOURCE: RTI Analysis of 2006 POS data
Figure 3-7. SNF Beds per 1,000 Beneficiaries, 2006
 RTI Analysis of 2006 POS data
3.3.3 IRF Beds per 100,000 Beneficiaries
Figure 3-8 displays the geographic distribution of the IRF beds per 100,000 beneficiaries in the U.S. in 2006. Two Southern states, Louisiana and Arkansas, had the most IRF beds per 100,000 beneficiaries: between 153 and 267. Ten states had between 116 and 153 IRF beds per 100,000 beneficiaries in 2006, including three in the South (Texas, Oklahoma, and Tennessee), three states in the Northeast (Pennsylvania, New Hampshire, and Massachusetts), two in the West (Nevada and New Mexico), and one state in the Midwest (Kansas). In contrast, there were 10 states that had fewer than 60 IRF beds per 100,000 beneficiaries in 2006, mostly in the Pacific (Washington, Oregon, California, Alaska, and Hawaii) and Midwest (Minnesota and Iowa). Overall, the South region had the most states with high numbers of IRF beds per 100,000 beneficiaries, and the West region had the least.
3.3.4 LTCH Beds per 100,000 Beneficiaries
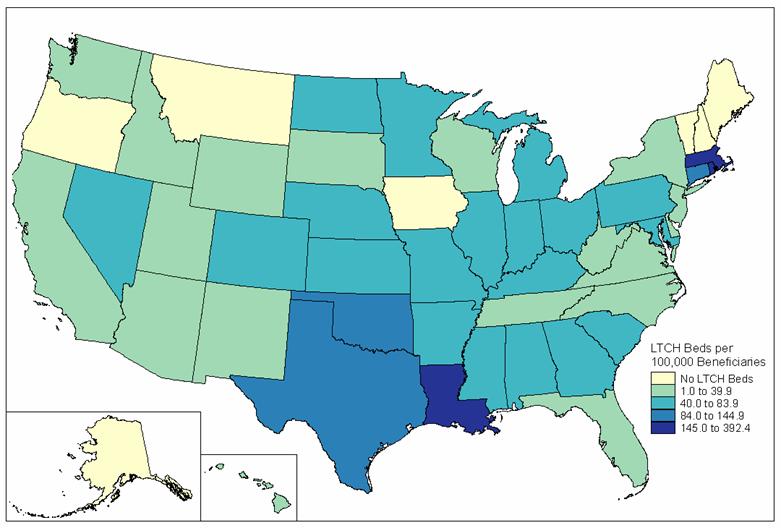
Figure 3-9 displays the geographic distribution of the LTCH beds per 100,000 beneficiaries in the U.S. in 2006. It is notable that the distribution of LTCH beds is not as uniform across the U.S. as is the distribution of other post-acute care facility types. Two states, Louisiana and Massachusetts, had the most LTCH beds per 100,000 beneficiaries, at more than 127. Oklahoma and Connecticut also had relatively high numbers of LTCH beds per 100,000 beneficiaries, between 81 and 127. In contrast to these four states, most states had between 1 and 44 LTCH beds per 100,000 beneficiaries. It is notable that there were 12 states that had no LTCH beds per 100,000 beneficiaries in 2005 (in fact, 50% of New England states had no LTCH beds). Some of this may be due to certificate of need and other state-level provider certification requirements. The South region and the Mid-Atlantic division of the Northeast were the areas with the highest number of LTCH beds per 100,000 beneficiaries in 2006.
3.3.5 Home Health Agencies per 100,000 Beneficiaries
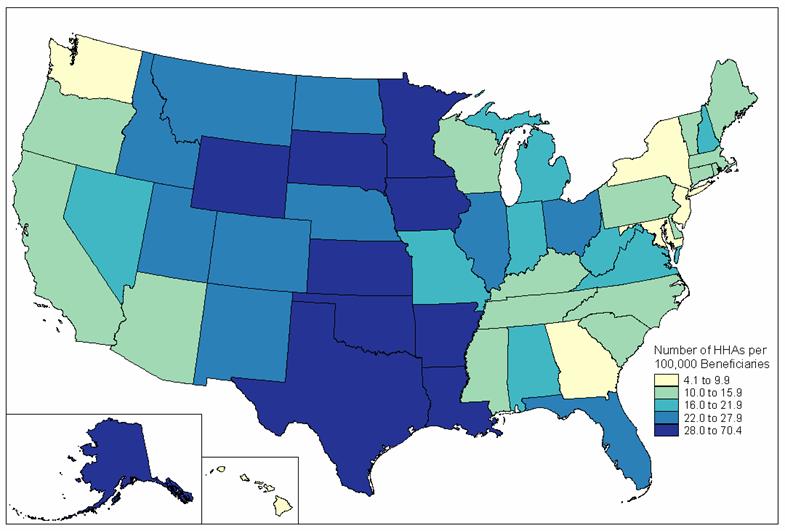
Figure 3-10 displays the geographic distribution of home health agencies per 100,000 beneficiaries in the U.S. in 2006. Home health agencies, together with SNFs provide the backbone of the PAC system in the U.S. In contrast to the geographic distribution of other post-acute care facilities, many states have high number of home health agencies. In fact, 10 states had between 28 and 70 home health agencies per 100,000 beneficiaries and another 10 states had between 22 and 28. Only six states (mostly in the South and Northeast regions) had very few home health agencies per 100,000 beneficiaries, between 4 and 10. States in the Midwest and West regions had the most home health agencies per 100,000 beneficiaries, and those in the Northeast had the least.
Figure 3-8. IRF Beds per 100,000 Beneficiaries, 2006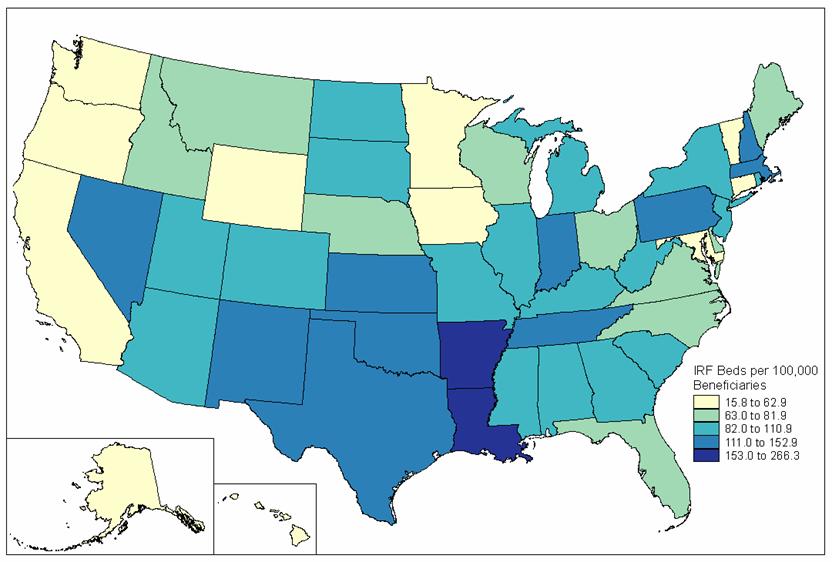
SOURCE: RTI Analysis of 2006 POS data.
Figure 3-9. LTCH Beds per 100,000 Beneficiaries, 2006
 SOURCE: RTI Analysis of 2006 POS data
Figure 3-10 Number of HHAs per 100,000 Beneficiaries, 2006
SOURCE: RTI Analysis of 2006 POS data.
3.4 Changes in Beds per Beneficiary between 2000 and 2006
The availability of PAC beds changed dramatically between 2000 and 2006, as depicted below in Table 3-1 and displayed geographically in Appendix B. Overall, the largest increase was in the number of LTCH beds. The five states that had the greatest growth in LTCH beds available per 100,000 beneficiaries were Arkansas (375%), Washington DC (281%), North Carolina (247%), Mississippi (199%), and Hawaii (190%). It is notable that four of the five states with the largest percent increases in LTCH availability were in the South region. In contrast, Virginia, Rhode Island, Colorado, New York, and Delaware showed an average percent decrease in LTCH availability of 35% (although Rhode Island still had a large number of LTCH beds per 100,000 beneficiaries, 290.2).
| LTCH Beds | IRF Beds | SNF Beds | |||||||
| Rank | State | % Change 2000-2006 | Beds/100,000 Beneficiaries 2006 | State | % Change 2000-2006 | Beds/100,000 Beneficiaries 2006 | State | % Change 2000-2006 | Beds/1,000 Beneficiaries 2006 |
| 1 | AR | 375.7% | 46.6 | MN | 58.0% | 56.7 | LA | 34.0% | 57.6 |
| 2 | DC | 281.5 | 116.5 | AZ | 54.7 | 99.1 | IA | 29.7 | 61.1 |
| 3 | NC | 247.2 | 33.4 | KY | 50.6 | 103.5 | MS | 22.7 | 34.1 |
| 4 | MS | 198.5 | 76.3 | MA | 34.0 | 124.4 | OK | 13.9 | 49.6 |
| 5 | HI | 190.1 | 22.8 | NE | 27.5 | 70.4 | AR | 10.5 | 46.6 |
| 6 | VA | -81.6% | 16.0 | MD | -51.2% | 15.9 | AK | -20.6% | 13.8 |
| 7 | RI | -48.2 | 290.2 | DE | -43.8 | 75.2 | WA | -18.8 | 26.8 |
| 8 | CO | -17.5 | 72.4 | AK | -43.8 | 50.8 | MN | -18.4 | 49.8 |
| 9 | NY | -17.1 | 36.6 | ND | -39.4 | 85.8 | WI | -18.4 | 44.4 |
| 10 | DE | -10.3 | 28.0 | WY | -25.3 | 62.8 | NV | -17.8 | 18.0 |
| SOURCE: RTI analysis of 2000 and 2006 POS data. | |||||||||
The states with the largest percent increases in IRF eds per 100,000 beneficiaries included Minnesota (58%), Arizona (55%), Kentucky (51%), Massachusetts (34%), and Nebraska (27%). Just as Delaware showed a decrease in the percentage of LTCHs between 2000 and 2006, it also decreased its percentage of IRF beds availability by 44%, as did Alaska (by 44%) and Maryland (by 51%). Of the five states with the largest increase in SNF beds per 1000 beneficiaries between 2000 and 2006, four of them were in the South region: Louisiana (34%), Mississippi (23%), Oklahoma (14%), and Arkansas (11%). In contrast, three of the five states with the largest percentage decrease in SNF beds per 1000 beneficiaries were in the West: Alaska (21%), Washington (19%), and Nevada (18%).
4. Post-Acute Care Episode Analysis Results
This section provides descriptive information on the populations using post-acute care, including their typical discharge destinations, and differences in the episode of care costs and utilization patterns for hospital discharges with different DRGs. Second, a more in-depth analysis of episode transfers is presented. These tables illustrate differences in PAC transitions, lengths of stay, and Medicare payments per setting, in general and for medical and rehabilitation type cases. Last, we present episode-level information on the organizational relationships between the acute hospital and PAC providers and how these relationships differ by geographic location. Together, these tables and graphs provide useful information for illustrating factors that affect the discharge patterns and other outcomes examined in the multivariate models in section 5.
4.1 Post-Acute Care Episodes: First PAC Site of Care, Index Admission Length of Stay and Payment, and Demographics
About 16 percent of all beneficiaries had at least one admission to an acute hospital in 2005[6]. Of live discharges from an acute hospital, 34.8 percent were discharged to a post-acute site of care for further treatment. The largest share of those discharged to PAC, were discharged to skilled nursing facilities (41.2 percent) or home health agencies (37.3 percent) while inpatient rehabilitation hospitals and hospital outpatient therapy providers accounted for the next 2 largest groups, 11.4 percent and 8.0 percent, respectively (Table 4-1). Only a small number of acute hospital users were discharged to LTCHs (2.1 percent).
These differences in first site of post-acute care are also associated with differences in the prior acute hospital stay. Beneficiaries discharged to LTCH hospitals had the longest acute hospital length of stay (16.4 days) compared to beneficiaries discharged to outpatient therapy who had the shortest average length of stay of 4.9 days in the acute setting. Payments for the acute settings corresponded to the observed length of stay. Beneficiaries discharged to LTCH hospitals had an average acute hospital payment of over $30,000 compared to patients discharged to outpatient therapy where acute hospital payments averaged $7,531. These results are as expected and reflect the sicker and more resource intensive populations treated in LTCHs.
Patients discharged to SNF had an average acute length of stay of 7.6 days compared to 6.7 days for patients discharged to IRF. Acute payments for these settings averaged $9,085 for patients discharged to SNF and $12,003 for patients discharged to IRF. The shorter length of stay and higher acute payments for patients discharged to IRF reflect the patient populations discharged to the IRF setting. These beneficiaries include those receiving surgical procedures for hip and knee replacements or other procedures that lead to higher resource utilization in the acute care setting.
PAC users also differed in terms of their demographics and severity levels, both relative to non-PAC users and across PAC services (Table 4-2). PAC users were more likely to be female and were older, on average than non-PAC users. Approximately 63.4% of PAC users were female compared to 53.6% of non-PAC users and 66.1% of PAC users were over age 75 compared to 45.1% of non-PAC users. The age distribution also varied among PAC users by first discharge destination. Beneficiaries discharged to SNF tended to be older than beneficiaries discharged to other PAC settings. Of beneficiaries discharged to SNF, 37.0% were ages 85 and over compared to 20.5% of patients discharged to HHA and 16.9% of patients discharged to IRF.
Severity of illness as measured by the APR-DRG Severity Index was higher for PAC users than for non-PAC users. Over 35% of PAC users had APR-DRGs in levels 3 or 4 compared to 19.4% of Non-PAC users. Of PAC users, beneficiaries discharged to LTCHs had the highest proportion of patients in APR-DRG level 4 at 33.2%. Beneficiaries discharged to HHAs and hospital outpatient therapy had a higher proportion in the lower severity levels compared to beneficiaries admitted to the inpatient settings. A chi-square test for the difference in the proportion of beneficiaries in each APR-DRG severity level discharged to each post-acute setting indicated these differences were significant (p0.0001). These differences provide empirical evidence of the differences in acuity using each type of service.
| PAC Users By First Discharge Destination | ||||||||
| No PAC Use | PAC Users | LTCH | IRF | SNF | HHA | HOPD Therapy | ||
| Total N | 209,547 | 111,879 | 2,368 | 12,759 | 46,129 | 41,726 | 8,897 | |
| % | (65.2%) | (34.8%) | (2.1%) | (11.4%) | (41.2%) | (37.3%) | (8.0%) | |
| Demographics | Percent Female | 53.6 | 63.4 | 52.6 | 63.8 | 67.4 | 60.6 | 58.3 |
| Age | Percent Less than 65 | 19.2 | 8.6 | 18.1 | 8.5 | 5.5 | 10.2 | 14.6 |
| Percent 65-74 Years | 35.7 | 25.3 | 29.2 | 31.7 | 17.3 | 30.4 | 32.5 | |
| Percent 75-84 Years | 32.5 | 39.3 | 36.0 | 42.9 | 40.2 | 39.0 | 32.4 | |
| Percent 85 Years and Over | 12.6 | 26.8 | 16.6 | 16.9 | 37.0 | 20.5 | 20.5 | |
| Race | Percent White | 84.3 | 87.0 | 77.6 | 87.2 | 89.1 | 85.1 | 86.9 |
| Percent Black | 11.0 | 9.4 | 16.9 | 8.9 | 8.3 | 10.3 | 9.6 | |
| Percent Other note1 | 4.7 | 3.6 | 5.4 | 3.9 | 2.6 | 4.6 | 3.6 | |
| APR-DRG Severity Index | Percent APR-DRG 1 (low) | 28.8 | 16.0 | 3.6 | 19.4 | 11.7 | 18.7 | 24.3 |
| Percent APR-DRG 2 | 48.8 | 46.5 | 24.1 | 48.5 | 45.7 | 47.6 | 48.9 | |
| Percent APR-DRG 3 | 17.5 | 29.3 | 36.6 | 25.7 | 33.3 | 27.3 | 21.8 | |
| Percent APR-DRG 4 (high) | 1.9 | 5.9 | 33.2 | 5.4 | 6.9 | 4.0 | 2.9 | |
| Percent with any Medicaid in 2005 | 23.5 | 23.9 | 30.2 | 15.6 | 27.9 | 21.1 | 27.2 | |
| NOTE: 1 Other includes Asian, Hispanic, North American Native, Unknown, and Other. | ||||||||
| SOURCE: RTI Analysis of 2005 Medicare Claims (mmor075b). | ||||||||
4.1.1 DRGs by Post-Acute Care Setting
Table 4-3 presents the 20 most common acute hospital DRGs discharged to PAC and the first site of care for each DRG. The goal of this table is to show how patients with the same index hospitalization condition may be discharged to multiple settings, although the type of setting may differ by whether the case is primarily medical or rehabilitation-oriented. The DRG from the index acute admission, rather than the DRG on the post-acute care claim, was used in order to standardize the analysis of post-acute episodes. Note that the 2005 DRG designations are presented here.
The most common DRG discharged to PAC is DRG 209 Major Joint & Limb Reattachment Procedures of Lower Extremity (typically hip or knee replacement procedures). Over 88 percent of beneficiaries in this DRG go on to use PAC. These rehabilitation patients are admitted to a range of settings following discharge from the acute hospital. In this DRG, 25.7% are discharged to IRF, 35.4 are discharged to SNF, and 31.5 are discharged to HHA. The second most common PAC DRG is medical in nature, DRG 089 Simple Pneumonia & Pleurisy. These patients are most frequently discharged from the hospital to less intensive settings, such as SNF (49.9%) or HHA (37.5%). In general, the majority of PAC cases are discharged to SNFs or HHAs but, as shown in Table 4-3, IRF services replace a substantial share of HHA services for certain DRGs, such as DRG 014 Stroke, DRG 210 Hip and Femur Procedures Except Major Joint, DRG 544 Major Joint Replacement or Reattachment of Lower Extremity, DRG 243 Medical Back Problems and DRG 107 CABG. These results clearly indicate that the first site of post-acute care varies by DRG.
While patients may be discharged to different settings, the relative importance of that type of case within each setting may vary. Table 4-4 illustrates the relative ranking within each site of care for the top 20 Index Admission DRGs using PAC. As noted above, DRG 209 was the most common index DRG with 12,970 admissions in 2005. This high volume DRG was also the most common admission to IRF, SNF, HHA, and hospital outpatient therapy settings, and ranked 9th for beneficiaries discharged to LTCHs.
The most common admissions to the IRF setting are for orthopedic procedures (DRG 209, DRG 210, and DRG 544) and strokes (DRG 014). Pneumonia, on the other hand, despite being the second most common DRG discharged to PAC services, ranked 13th in terms of admissions to IRF. This result is expected since IRF services include intensive rehabilitation therapy and pneumonia is a medical rather than a rehabilitative diagnosis. Only 1 percent of discharges to IRF settings have pneumonia as their acute index admission DRG. In general, the top 20 DRGs for index acute admissions are common across the post-acute care settings except for the case of LTCHs. The top two LTCH DRGs do not appear in the list of the most common index acute DRGs because the most common LTCH DRGs are related to ventilator cases which occur in very small numbers overall.
| Acute Index Admission DRG | Total Hospital Discharges for PAC Users | Percent Using PAC note 1 | Percent of Beneficiaries Discharged to Each Setting note2 | ||||
| LTCH | IRF | SNF | HHA | HOPD Therapy | |||
| 209: Major Joint & Limb Reattachment Procedures of Lower Extremity | 12,970 | 88.6 | 0.4 | 25.7 | 35.4 | 31.5 | 6.9 |
| 089: Simple Pneumonia & Pleurisy Age >17 w CC | 5,441 | 35.8 | 1.3 | 2.4 | 49.9 | 37.5 | 9.0 |
| 014: Specific Cerebrovascular Disorders except TIA | 5,244 | 66.7 | 2.2 | 34.8 | 36.9 | 17.7 | 8.4 |
| 127: Heart Failure & Shock | 4,209 | 35.2 | 1.3 | 2.6 | 40.0 | 49.2 | 6.9 |
| 210: Hip & Femur Procedures except Major Joint Age >17 w CC | 3,684 | 90.5 | 1.3 | 24.8 | 64.3 | 7.3 | 2.3 |
| 544: Major Joint Replacement or Reattachment of Lower Extremity | 3,304 | 87.7 | 0.5 | 23.2 | 34.7 | 33.5 | 8.1 |
| 088: Chronic Obstructive Pulmonary Disease | 2,794 | 26.3 | 1.6 | 2.3 | 33.8 | 52.0 | 10.2 |
| 416: Septicemia Age >17 | 2,361 | 48.3 | 4.9 | 3.2 | 58.2 | 26.4 | 7.2 |
| 320: Kidney & Urinary Tract Infections Age >17 w CC | 2,315 | 43.3 | 0.6 | 2.2 | 61.3 | 27.2 | 8.7 |
| 296: Nutritional & Misc Metabolic Disorders Age >17 w CC | 1,941 | 37.2 | 1.1 | 2.7 | 54.7 | 33.2 | 8.3 |
| 148: Major Small & Large Bowel Procedures w CC | 1,816 | 48.8 | 3.5 | 4.7 | 39.6 | 50.6 | 1.5 |
| 316: Renal Failure | 1,640 | 41.6 | 1.5 | 3.0 | 54.3 | 33.2 | 7.9 |
| 121: Circulatory Disorders w Ami & Major Comp Disch Alive | 1,569 | 49.3 | 1.5 | 3.7 | 54.3 | 35.9 | 4.6 |
| 174: G.I. Hemorrhage w CC | 1,508 | 23.6 | 0.9 | 2.1 | 49.7 | 36.7 | 10.5 |
| 243: Medical Back Problems | 1,501 | 50.4 | 0.5 | 10.6 | 53.0 | 26.9 | 8.9 |
| 079: Respiratory Infections & Inflammations Age >17 w CC | 1,488 | 52.5 | 2.4 | 1.7 | 62.2 | 24.9 | 8.9 |
| 182: Esophagitis, Gastroent & Misc Digest Disorders Age >17 w CC | 1,287 | 18.4 | 1.2 | 2.3 | 40.8 | 43.0 | 12.8 |
| 138: Cardiac Arrhythmia & Conduction Disorders w CC | 1,219 | 22.9 | 0.6 | 2.6 | 37.1 | 50.7 | 9.0 |
| 277: Cellulitis Age >17 w CC | 1,218 | 40.8 | 3.1 | 1.6 | 40.6 | 44.3 | 10.4 |
| 107: Coronary Bypass w/o Cardiac Cath | 1,094 | 61.8 | 2.7 | 10.6 | 18.9 | 66.5 | 1.4 |
| Note: 1. Indicates the percent of beneficiaries discharged from the acute hospital with this DRG who go on to use PAC.Note 2. Indicates the percent of PAC users in the DRG discharged to each type of post-acute setting. | |||||||
| SOURCE: RTI Analysis of 2005 Medicare Claims (mmor075). | |||||||
|
| First Site of Post-Acute Care | |||||||||||||||||
| TOTAL PAC Users | LTCH | IRF | SNF | HHA | Hospital Outpatient Therapy | |||||||||||||
| Acute Index Admission DRG | Rank | # | % T44 note 1 | Rank note 2 | # | % | Rank note 2 | # | % | Rank note 2 | # | % | Rank note 2 | # | % | Rank note 2 | # | % |
| 209: Major Joint & Limb Reattachment Procedures of Lower Extremity | 1 | 12,970 | 11.6 | 9 | 54 | 2.3 | 1 | 3,339 | 26.2 | 1 | 4,593 | 10.0 | 1 | 4,083 | 9.8 | 1 | 901 | 10.1 |
| 089: Simple Pneumonia & Pleurisy Age >17 w CC | 2 | 5,441 | 4.9 | 6 | 72 | 3.0 | 13 | 128 | 1.0 | 2 | 2,713 | 5.9 | 3 | 2,039 | 4.9 | 2 | 489 | 5.5 |
| 014: Specific Cerebrovascular Disorders except TIA | 3 | 5,244 | 4.7 | 3 | 117 | 4.9 | 2 | 1,823 | 14.3 | 4 | 1,935 | 4.2 | 6 | 929 | 2.2 | 3 | 440 | 4.9 |
| 127: Heart Failure & Shock | 4 | 4,209 | 3.8 | 8 | 55 | 2.3 | 16 | 110 | 0.9 | 5 | 1,683 | 3.6 | 2 | 2,071 | 5.0 | 4 | 290 | 3.3 |
| 210: Hip & Femur Procedures except Major Joint Age >17 w CC | 5 | 3,684 | 3.3 | 10 | 47 | 2.0 | 3 | 914 | 7.2 | 3 | 2,369 | 5.1 | 31 | 270 | 0.6 | 20 | 84 | 0.9 |
| 544: Major Joint Replacement or Reattachment of Lower Extremity | 6 | 3,304 | 3.0 | 32 | 17 | 0.7 | 4 | 765 | 6.0 | 8 | 1,146 | 2.5 | 5 | 1,108 | 2.7 | 6 | 268 | 3.0 |
| 088: Chronic Obstructive Pulmonary Disease | 7 | 2,794 | 2.5 | 11 | 45 | 1.9 | 27 | 65 | 0.5 | 10 | 944 | 2.0 | 4 | 1,454 | 3.5 | 5 | 286 | 3.2 |
| 416: Septicemia Age >17 | 8 | 2,361 | 2.1 | 4 | 116 | 4.9 | 23 | 76 | 0.6 | 7 | 1,375 | 3.0 | 11 | 623 | 1.5 | 8 | 171 | 1.9 |
| 320: Kidney & Urinary Tract Infections Age >17 w CC | 9 | 2,315 | 2.1 | 37 | 15 | 0.6 | 35 | 51 | 0.4 | 6 | 1,418 | 3.1 | 10 | 629 | 1.5 | 7 | 202 | 2.3 |
| 296: Nutritional & Misc Metabolic Disorders Age >17 w CC | 10 | 1,941 | 1.7 | 24 | 21 | 0.9 | 34 | 53 | 0.4 | 9 | 1,061 | 2.3 | 9 | 645 | 1.5 | 10 | 161 | 1.8 |
| 148: Major Small & Large Bowel Procedures w CC | 11 | 1,816 | 1.6 | 7 | 64 | 2.7 | 18 | 86 | 0.7 | 16 | 720 | 1.6 | 7 | 919 | 2.2 | 68 | 27 | 0.3 |
| 316: Renal Failure | 12 | 1,640 | 1.5 | 17 | 25 | 1.1 | 36 | 50 | 0.4 | 12 | 890 | 1.9 | 16 | 545 | 1.3 | 17 | 130 | 1.5 |
| 121: Circulatory Disorders w Ami & Major Comp Disch Alive | 13 | 1,569 | 1.4 | 19 | 24 | 1.0 | 30 | 58 | 0.5 | 13 | 852 | 1.8 | 13 | 563 | 1.3 | 23 | 72 | 0.8 |
| 174: G.I. Hemorrhage w CC | 14 | 1,508 | 1.3 | 38 | 14 | 0.6 | 55 | 31 | 0.2 | 15 | 750 | 1.6 | 14 | 554 | 1.3 | 11 | 159 | 1.8 |
| 243: Medical Back Problems | 15 | 1,501 | 1.3 | 54 | 8 | 0.3 | 9 | 159 | 1.2 | 14 | 796 | 1.7 | 21 | 404 | 1.0 | 13 | 134 | 1.5 |
| 079: Respiratory Infections & Inflammations Age >17 w CC | 16 | 1,488 | 1.3 | 13 | 36 | 1.5 | 67 | 25 | 0.2 | 11 | 925 | 2.0 | 23 | 370 | 0.9 | 16 | 132 | 1.5 |
| 182: Esophagitis, Gastroent & Misc Digest Disorders Age >17 w CC | 17 | 1,287 | 1.2 | 36 | 15 | 0.6 | 58 | 29 | 0.2 | 19 | 525 | 1.1 | 15 | 553 | 1.3 | 9 | 165 | 1.9 |
| 138: Cardiac Arrhythmia & Conduction Disorders w CC | 18 | 1,219 | 1.1 | 59 | 7 | 0.3 | 51 | 32 | 0.3 | 21 | 452 | 1.0 | 12 | 618 | 1.5 | 19 | 110 | 1.2 |
| 277: Cellulitis Age >17 w CC | 19 | 1,218 | 1.1 | 12 | 38 | 1.6 | 82 | 19 | 0.1 | 20 | 495 | 1.1 | 17 | 539 | 1.3 | 18 | 127 | 1.4 |
| 107: Coronary Bypass w/o Cardiac Cath | 20 | 1,094 | 1.0 | 16 | 29 | 1.2 | 14 | 116 | 0.9 | 35 | 207 | 0.5 | 8 | 727 | 1.7 | 109 | 15 | 0.2 |
| Note 1.Indicates the percent of all PAC users with this DRG. Note 2.Indicates the ranking of this DRG by PAC setting. For example, DRG 209 is the 9th most frequent DRG for beneficiaries discharged to LTCH and accounts for 2.3% of beneficiaries discharged to this PAC setting. | ||||||||||||||||||
| SOURCE: RTI Analysis of 2005 Medicare Claims (mmor075). | ||||||||||||||||||
4.2 Post-Acute Care Transition Patterns
Beneficiaries also differ in terms of the mix of services they use during an episode of care. This section examines transfer patterns following acute hospital discharge (Figure 4-1). The majority of beneficiaries use only one or two post-acute services following discharge, but some transfer multiple times between different types of settings or churn back and forth with hospital readmissions. The number of claims per episode varies depending on the beneficiarys first site of post acute care. Approximately 75% of beneficiaries discharged to LTCH or IRF and 85% of beneficiaries discharged to SNF or HHA have 4 or fewer post-acute claims following their acute index admission.
The transition tables show the proportion of patients in each type of episode and identify the percent using subsequent services of each type. As noted above, approximately 34% of Medicare hospital patients are discharged to post-acute care. The largest proportion of beneficiaries is discharged to SNF (41.2%) or HHA (37.3%). Beneficiaries discharged to ambulatory settings, such as HHA or outpatient therapy are more likely to only use those PAC services. For example, 62.1% of beneficiaries discharged to HHA and 67.5% of beneficiaries discharged to outpatient therapy are discharged home. In contrast, beneficiaries using inpatient PAC are more likely to have at least one follow-up PAC service. Approximately 88% of beneficiaries discharged to IRF and 74% of beneficiaries discharged to LTCH go on to use other services during their post acute episode.
The acute hospital readmission rate is also highlighted in this episode transition table. Readmission rates range from 11% for beneficiaries discharged to IRF to 28.1% for beneficiaries discharged to HHA. This readmission rate may be either an indication of severity of illness in the patient population or an indication of potential quality of care issues. Patients must be able to participate in an average of 3 hours of therapy/day to be in the IRF which typically reflects a medically healthier patient than one with functional impairments admitted elsewhere. Further analysis of these beneficiaries with acute readmissions indicates that 7.6% of these readmissions end in death suggesting these patients are higher severity patients.
PAC episodes appear to show a hierarchy in terms of service mix. While HHA, SNF, and outpatient therapy users have higher readmission rates, they appear to show a higher use of ambulatory service combinations. The most common discharge site for HHA, other than home or rehospitalization is outpatient therapy. Nine percent of beneficiaries discharged to home health are subsequently discharged to outpatient therapy. Similarly, outpatient therapy cases are most likely to be discharged to HHA (6.2%) if not readmitted (21.8%) or ending care (67.5%). SNF cases are most likely discharged to HHA (28.9 percent) or to outpatient therapy (6.3 percent). HHA is also the most likely discharge destination for IRF (46.6%) and LTCH (24.8%) cases reflecting the ability of HHA to provide follow-up therapy or nursing in the home, following discharge.
Figure 4-1. Post-Acute Care Transitions for Acute Hospital Discharges, 2005
Figure 4-1a. Number and Percent of Admissions
Note: Post-acute episodes presented here are truncated at the fourth post acute claim following acute hospital admissions. Also note that the denominators for the percents shown here are based on the number of discharges to the prior setting of care and therefore the percents are not equal to those presented in Table 4-5a.
Source: RTI analysis of 2005 Medicare claims.
Figure 4-1b presents the corresponding lengths of stay and payment for beneficiaries based on their patterns of post-acute care utilization. On average, beneficiaries discharged to post-acute care had acute index admissions of 7.0 days and Medicare payments of $10,056.
Figure 4-1b. Utilization and Medicare Payments
 Note: Post-acute episodes presented here are truncated at the fourth post acute claim following acute hospital admissions. The reported utilization and payment correspond to use at that level of care only, not to the entire episode. Utilization is measured in days for acute, IRF, LTCH, and SNF; visits for HHA; and units of service for hospital outpatient therapy.
Source: RTI Analysis of 2005 Medicare claims.
Beneficiaries discharged to LTCH had LTCH stays averaging 27.9 days and Medicare payments of $33,986. Beneficiaries discharged to SNF had similar length of stay in the SNF compared to beneficiaries discharged to LTCH (27.7 days), but had significantly lower payments for the stay ($8,090) reflecting the less intensive medical needs of patients discharged to this setting. Patients discharged to outpatient settings had longer lengths of stay (as measured in visit counts) in this setting indicating extended therapy treatments, but this outpatient care was significantly less expensive ($1,105) on average compared to treatment in inpatient or home health settings.
Transition patterns differ by patient diagnosis. Figure 4-2 illustrates the average transition patterns for beneficiaries who were hospitalized for DRG 89: Simple pneumonia and pleurisy with complicating conditions. Key differences are in the proportion being discharged to PAC, and among those cases, the subsequent destinations. Over 35 percent of pneumonia cases use PAC (Table 4-3). Almost half these cases are discharged to SNF (49.9 percent) and among those cases; over half will end their episode in the SNF (54.3 percent compared to 42.7 percent in the total PAC population).
PAC episode lengths of stay and payments for pneumonia patients are less than for PAC episodes overall (Figure 4-2b). The average pneumonia index acute admission was 6.4 days and corresponding Medicare payments were $5,020. Compared to PAC episodes overall (Figure 4-1b), Medicare payments for beneficiaries discharged to LTCH were significantly lower ($23,823 for pneumonia beneficiaries discharged to LTCH compared to $33,986 for all post-acute beneficiaries discharged to LTCH). Similar patterns in lengths of stay and payments were observed for pneumonia beneficiaries and PAC beneficiaries overall for those discharged to HHA, SNF, IRF, and outpatient therapy.
Figure 4-3 shows transition patterns for the more rehabilitation-oriented hospital discharge, DRG 209: Major Joint and Limb Reattachments for Lower Extremity. These cases are more likely to be discharged to PAC, in general, and to IRFs in particular. Over 88 percent of beneficiaries with this DRG in the acute hospital go on to use post-acute care (Table 4-3). The proportion of hospital discharges being admitted directly to IRFs is 25.7 percent compared to 11.4 percent in the total PAC population. This is offset by fewer SNF admissions (35.4 percent v.41.2 percent in the larger population). Beneficiaries in DRG 209 discharged to IRF had IRF lengths of stay of 9.9 days and IRF payments of $10,598. Over 35 percent of beneficiaries in this DRG were discharged to the SNF setting where their SNF lengths of stay were 18.9 days and payments were $6,267 on average. Again, the longer length of stay and smaller payments for beneficiaries discharged to the SNF compared to the IRF setting indicate the differences in patient medical complexity and resource intensity in each setting.
Figure 4-2. Transitions for Acute Hospital Discharges from DRG 89: Simple Pneumonia and Pleurisy Age >17 with CC
Figure 4-2a. Number and Percent of Admissions
 Note: Post-acute episodes presented here are truncated at the fourth post acute claim following acute hospital admissions. Also note that the denominators for the percents shown here are based on the number of discharges to the prior setting of care and therefore the percents are not equal to those presented in Table 4-5c.
Source: RTI analysis of 2005 Medicare claims.
Figure 4-2b. Utilization and Medicare Payments
 Note: Post-acute episodes presented here are truncated at the fourth post acute claim following acute hospital admissions. The reported utilization and payment correspond to use at that level of care only, not to the entire episode. Utilization is measured in days for acute, IRF, LTCH, and SNF; visits for HHA; and units of service for hospital outpatient therapy.
Source: RTI analysis of 2005 Medicare claims.
Figure 4-3. Transitions for Acute Hospital Discharges from DRG 209: Major Joint and Limb Reattachments for Lower Extremity
Figure 4-3a. Number and Percent of Admissions
Note: Post-acute episodes presented here are truncated at the fourth post acute claim following acute hospital admissions. Also note that the denominators for the percents shown here are based on the number of discharges to the prior setting of care and therefore the percents are not equal to those presented in Table 4-5b.
Source: RTI analysis of 2005 Medicare claims.
Figure 4-3b. Utilization and Length of Stay
Note: Post-acute episodes presented here are truncated at the fourth post acute claim following acute hospital admissions. The reported utilization and payment correspond to use at that level of care only, not to the entire episode. Utilization is measured in days for acute, IRF, LTCH, and SNF; visits for HHA; and units of service for hospital outpatient therapy.
Source: RTI analysis of 2005 Medicare claims.
Another way of examining post-acute care transitions is presented in Tables 4-5a, 4-5b, and 4-5c. These tables present the most common patterns of care, episode payments, and episode lengths of stay for post-acute users overall, post-acute users in DRG 089, and post-acute users in DRG 209. Patterns of post-acute care are shown for 85 percent of post-acute users. The most common episode patterns for PAC users overall are acute hospital admission followed by HHA (23.2 percent) and acute hospital admission followed by SNF (17.6 percent). Mean episode payments are lower for beneficiaries discharged to the HHA setting ($12,483) compared to patients discharged to SNF ($16,952). The most common episode pattern for beneficiaries in DRG 089 was acute hospital admission followed by SNF (27.1 percent). In contrast, this episode pattern accounted for only 8 percent of beneficiary post-acute care episodes for beneficiaries in DRG 209. Again, this difference reflects patterns of use for medical versus rehabilitation DRGs.
| Episode Pattern note1 | Count(5% Sample) | Percent of PAC Users (N=111,879) | Cumulative Percent note2 | Mean Episode Payment | Mean Episode Length of Stay (days) |
| AH | 25,916 | 23.2 | 23.2 | $12,483 | 47.0 |
| AS | 19,676 | 17.6 | 40.8 | 16,952 | 43.0 |
| ASH | 8,500 | 7.6 | 48.3 | 21,150 | 75.5 |
| AO | 6,002 | 5.4 | 53.7 | 8,364 | 46.4 |
| AHA | 5,148 | 4.6 | 58.3 | 24,383 | 58.0 |
| AIH | 3,593 | 3.2 | 61.5 | 29,399 | 65.6 |
| ASAS | 2,944 | 2.6 | 64.2 | 31,922 | 79.3 |
| AHO | 2,820 | 2.5 | 66.7 | 13,729 | 87.7 |
| ASA | 2,268 | 2.0 | 68.7 | 26,548 | 48.1 |
| ASO | 2,002 | 1.8 | 70.5 | 18,336 | 87.2 |
| AIO | 1,869 | 1.7 | 72.2 | 25,285 | 77.3 |
| AHAH | 1,603 | 1.4 | 73.6 | 26,238 | 162.5 |
| AI | 1,585 | 1.4 | 75.0 | 24,274 | 17.5 |
| ASHO | 1,177 | 1.1 | 76.1 | 21,218 | 116.9 |
| ASHA | 990 | 0.9 | 77.0 | 29,600 | 85.5 |
| AIHO | 864 | 0.8 | 77.7 | 30,376 | 117.9 |
| AOA | 776 | 0.7 | 78.4 | 18,520 | 67.8 |
| AHAS | 711 | 0.6 | 79.1 | 28,266 | 89.5 |
| ASASAS | 691 | 0.6 | 79.7 | 46,973 | 108.4 |
| AL | 622 | 0.6 | 80.2 | 63,233 | 43.8 |
| AHAHA | 550 | 0.5 | 80.7 | 40,868 | 151.4 |
| ASASH | 550 | 0.5 | 81.2 | 35,410 | 117.8 |
| ASASA | 501 | 0.4 | 81.7 | 41,741 | 74.0 |
| AIS | 497 | 0.4 | 82.1 | 41,985 | 79.1 |
| AIHA | 437 | 0.4 | 82.5 | 44,643 | 81.3 |
| ASHAS | 437 | 0.4 | 82.9 | 36,310 | 123.7 |
| ASHAH | 356 | 0.3 | 83.2 | 34,951 | 188.5 |
| ASAH | 350 | 0.3 | 83.5 | 30,085 | 90.6 |
| AHASH | 327 | 0.3 | 83.8 | 33,462 | 152.4 |
| AOAO | 322 | 0.3 | 84.1 | 19,246 | 119.6 |
| AISH | 321 | 0.3 | 84.4 | 41,525 | 117.1 |
| AIA | 307 | 0.3 | 84.7 | 39,370 | 42.7 |
| ALH | 291 | 0.3 | 84.9 | 51,447 | 106.4 |
| Note 1. A=Acute Hospital; H=HHA; I=IRF; L=LTCH; O=Outpatient Therapy; S=SNFNote 2. 85 percent of PAC episodes are shown here. | |||||
| SOURCE: RTI analysis of 2005 Medicare claims (mmor167). | |||||
| Episode Pattern note1 | Count (5% Sample) | Percent of PAC Users in DRG 209 (N=12,970) | Cumulative Percent note2 | Mean Episode Payment | Mean Episode Length of Stay |
| AH | 2,633 | 20.3 | 20.3 | $13,415 | 33.1 |
| ASH | 1,660 | 12.8 | 33.1 | 19,715 | 56.2 |
| AIH | 1,086 | 8.4 | 41.5 | 25,448 | 52.8 |
| AS | 1,039 | 8.0 | 49.5 | 19,234 | 35.1 |
| AHO | 1,023 | 7.9 | 57.4 | 14,086 | 78.6 |
| AO | 765 | 5.9 | 63.3 | 10,840 | 53.8 |
| AIO | 722 | 5.6 | 68.8 | 21,280 | 66.6 |
| ASO | 558 | 4.3 | 73.1 | 16,421 | 72.7 |
| AI | 452 | 3.5 | 76.6 | 19,841 | 13.4 |
| ASHO | 449 | 3.5 | 80.1 | 19,683 | 103.7 |
| AIHO | 332 | 2.6 | 82.6 | 25,896 | 105.0 |
| AHA | 163 | 1.3 | 83.9 | 21,713 | 41.2 |
| ASAS | 96 | 0.7 | 84.6 | 35,809 | 74.4 |
| Note 1. A=Acute Hospital; H=HHA; I=IRF; L=LTCH; O=Outpatient Therapy; S=SNFNote 2. 85 percent of PAC episodes are shown here. | |||||
| SOURCE: RTI analysis of 2005 Medicare claims (mmor167). | |||||
| Episode Pattern note1 | Count (5% Sample) | Percent of PAC Users in DRG 089 (N=5,441) | Cumulative Percent note2 | Mean Episode Payment | Mean Episode Length of Stay | |||
| AS | 1,474 | 27.1 | 27.1 | $13,237 | 39.3 | |||
| AH | 1,294 | 23.8 | 50.9 | 7,492 | 49.6 | |||
| ASH | 312 | 5.7 | 56.6 | 15,364 | 75.8 | |||
| AO | 296 | 5.4 | 62.0 | 5,626 | 34.5 | |||
| AHA | 273 | 5.0 | 67.1 | 17,351 | 61.4 | |||
| ASAS | 222 | 4.1 | 71.1 | 25,985 | 76.1 | |||
| ASA | 162 | 3.0 | 74.1 | 20,599 | 49.0 | |||
| ASO | 78 | 1.4 | 75.6 | 14,646 | 85.7 | |||
| AHAH | 76 | 1.4 | 77.0 | 23,313 | 190.4 | |||
| AOA | 64 | 1.2 | 78.1 | 14,294 | 59.3 | |||
| AHO | 59 | 1.1 | 79.2 | 8,254 | 84.1 | |||
| ASHA | 51 | 0.9 | 80.2 | 22,916 | 75.9 | |||
| AHAS | 46 | 0.8 | 81.0 | 23,711 | 86.5 | |||
| ASASAS | 43 | 0.8 | 81.8 | 36,963 | 93.8 | |||
| ASASA | 31 | 0.6 | 82.4 | 31,525 | 69.1 | |||
| AIH | 30 | 0.6 | 82.9 | 23,605 | 63.2 | |||
| AHAHA | 27 | 0.5 | 83.4 | 33,473 | 158.0 | |||
| AI | 25 | 0.5 | 83.9 | 16,143 | 17.0 | |||
| AOH | 19 | 0.3 | 84.2 | 7,354 | 56.6 | |||
| ASHAH | 19 | 0.3 | 84.6 | 23,557 | 202.3 | |||
| AL | 17 | 0.3 | 84.9 | 27,749 | 30.2 | |||
| Note 1. A=Acute Hospital; H=HHA; I=IRF; L=LTCH; O=Outpatient Therapy; S=SNFNote 2. 85 percent of PAC episodes are shown here. | ||||||||
| SOURCE: RTI analysis of 2005 Medicare claims (mmor167). | ||||||||
4.3 Discharges to Post-Acute Care by Organizational Relationship
The next set of tables examine differences in the proportion of index episodes that are discharged to freestanding, subprovider, or co-located PAC services and how this varies by region across the U.S. (Tables 4-6 through 4-15). Table 4-6 displays the national patterns (statistically significant differences, chi-sq p0.0001) and Tables 4-7 through 4-14 show the discharge patterns at the census division level to highlight regional differences in the supply of post-acute care providers and differences in practice patterns. These numbers reflect the supply of each type of provider nationally and in each region. For example, LTCHs are primarily freestanding hospitals. Approximately 20% of acute discharges to LTCHs nationally are to co-located LTCHs, which include LTCHs within 250 yards of the acute provider. However, this proportion differs significantly by region. For example, in New England, LTCHs are primarily freestanding providers and less than 4% of LTCH discharges are to co-located LTCHs. However, in the East South Central census division (Alabama, Kentucky, Mississippi, and Tennessee), over 42% of discharges to LTCH are to co-located LTCHs.
Data presented in the geographic distributions of providers indicates that there are many more hospital-based IRF providers than freestanding providers. However, freestanding IRF providers are generally larger facilities and have more beds than the hospital-based units. This explains the finding that of beneficiaries discharged to IRF nationally, the proportion discharged to freestanding IRFs (49.3%) is very similar to the proportion discharged to hospital-based units (47.8%). These numbers vary by region depending on the supply of freestanding IRFs. New England and East South Central both have a higher proportion of discharges to freestanding IRFs (67.7% and 60.7%, respectively) compared to the East North Central region (Illinois, Indiana, Michigan, Ohio, and Wisconsin) where only 33.6% of discharges to IRFs are to freestanding providers.
Smaller proportions of beneficiaries are discharged to co-located SNFs, HHAs, or IRFs, by definition. However, the additional contribution of the co-located counts is most noticeable in the West South Central which has greater numbers of co-located IRFs and SNFs and with SNFs in the Mid-Atlantic and Pacific areas. Here these factors identify closely related providers who would not have been identified using just the ownership definition.
4.4 Post-Acute Care Episode Utilization and Payment, By Claim Type, DRG, and APR-DRG
Episode utilization and Medicare payments by claim type during the full episode of care, by DRG, and by APR-DRG severity of illness index are examined in Table 4-16. This table shows the different services used during an episode of care for the five DRGs with the highest number of PAC users: DRG 209, DRG 089, DRG 014, DRG 127, and DRG 210. For each DRG, we present the number of patients, the percent using each type of service, the utilization and the payment for each of the four severity groups. Note that utilization is measured in days for acute, IRF, LTCH, and SNF; visits for HHA; and units of service for hospital outpatient therapy. This table is useful for illustrating different levels of medical severity for hospital discharges in different DRG groups. For example, the majority of beneficiaries in DRG 209 are in severity levels 1 (4,133) and 2 (5,999) while beneficiaries in DRG 089 have slightly higher severity levels. The majority of beneficiaries with this DRG are in severity levels 2 (2,712) and 3 (2,467).
In general, Table 4-16 shows that utilization and episode payments rise with increasing severity of illness across the DRGs. Beneficiaries in DRG 209, APR-DRG severity of illness level 1 had an average post-acute episode length of stay of 59.0 days and Medicare payments of $18,288 compared to beneficiaries in APR-DRG severity of illness level 4 where beneficiaries had episodes averaging 95.4 days and $36,628.
The results also demonstrate that beneficiaries using LTCH services are more likely to be in the higher APR-DRG levels, APR-DRG level 3 and 4, than patients using other PAC services. For example, in DRG 209, 7.1% of beneficiaries in severity level 4 had an LTCH admission compared to less than one percent in severity groups 1 and 2. Similarly, 27.2% of beneficiaries in DRG 089, severity level 4 had an LTCH claim compared to none in severity level 1 and less than 2 percent in severity level 2.
|
| APR-DRG Severity of Illness Level | ||||||||||||||||
| APR-DRG 1 | APR-DRG 2 | APR-DRG 3 | APR-DRG 4 | ||||||||||||||
| DRG | N | % with Claim | Mean Use | Mean Payment | N | % with Claim | Mean Use | Mean Payment | N | % with Claim | Mean Use | Mean Payment | N | % with Claim | Mean Use | Mean Payment | |
| 209Major Joint and Limb Reattachment Procedures of Lower Extremity (N=12,970) | Total Episode Days (Index Admission Days + PAC days) | 4,133 | 31.9 note1a | 59.0 | $18,288 | 5,999 | 46.3 note1a | 64.9 | $21,428 | 2,726 | 21.0 note1a | 70.0 | $23,925 | 112 | 0.9note1a | 95.4 | $36,628 |
| Index Admission (Days) | 4,133 | 100.0 | 3.7 | $10,214 | 5,999 | 100.0 | 4.2 | $10,506 | 2,726 | 100.0 | 5.1 | $10,623 | 112 | 100.0 | 12.8 | $15,078 | |
| Home Health (Visits) | 2,724 | 65.9 | 16.6 | $3,341 | 4,046 | 67.4 | 17.7 | $3,442 | 1,914 | 70.2 | 20.0 | $3,648 | 62 | 55.4 | 29.0 | $4,945 | |
| IRF (Days) | 965 | 23.3 | 9.3 | $10,128 | 1,638 | 27.3 | 10.6 | $11,352 | 806 | 29.6 | 11.6 | $12,299 | 31 | 27.7 | 16.4 | $14,834 | |
| LTCH (Days) | 13 | 0.3 | 26.1 | $26,425 | 39 | 0.7 | 30.0 | $30,207 | 41 | 1.5 | 28.8 | $29,218 | 8 | 7.1 | 45.1 | $57,427 | |
| Hospital Outpatient Therapy (Services) | 1,827 | 44.2 | 49.9 | $1,074 | 2,151 | 35.9 | 50.6 | $1,123 | 709 | 26.0 | 46.0 | $1,131 | 29 | 25.9 | 52.0 | $1,381 | |
| SNF (Days) | 1,218 | 29.5 | 18.1 | $6,025 | 2,422 | 40.4 | 24.1 | $7,656 | 1,252 | 45.9 | 25.8 | $8,152 | 67 | 59.8 | 34.9 | $10,492 | |
| Acute Readmission (Days) | 426 | 10.3 | 6.4 | $11,386 | 971 | 16.2 | 7.3 | $11,193 | 538 | 19.7 | 9.7 | $13,308 | 39 | 34.8 | 10.7 | $11,406 | |
| 089 Simple Pneumonia & Pleurisy Age >17 w CC (N=5,441) | Total Episode Days (Index Admission Days + PAC days) | 83 | 1.5note1a | 71.0 | $15,388 | 2,712 | 49.8note1a | 67.6 | $16,551 | 2,467 | 45.3note1a | 75.5 | $18,727 | 179 | 3.3 note1a | 77.3 | $21,726 |
| Index Admission (Days) | 83 | 100.0 | 5.3 | $4,927 | 2,712 | 100.0 | 5.5 | $4,886 | 2,467 | 100.0 | 7.1 | $5,139 | 179 | 100.0 | 10.3 | $5,462 | |
| Home Health (Visits) | 49 | 59.0 | 24.3 | $2,909 | 1,424 | 52.5 | 23.2 | $3,225 | 1,219 | 49.4 | 27.5 | $3,666 | 89 | 49.7 | 25.1 | $3,693 | |
| IRF (Days) | 2 | 2.4 | 25.0 | $22,838 | 99 | 3.7 | 15.1 | $15,824 | 79 | 3.2 | 14.8 | $16,785 | 8 | 4.5 | 14.1 | $19,031 | |
| LTCH (Days) | 0 | 0.0 | - | - | 44 | 1.6 | 26.0 | $30,721 | 57 | 2.3 | 28.9 | $36,796 | 11 | 6.1 | 27.2 | $28,852 | |
| Hospital Outpatient Therapy (Services) | 11 | 13.3 | 19.6 | $678 | 476 | 17.6 | 34.3 | $1,007 | 374 | 15.2 | 44.0 | $1,447 | 24 | 13.4 | 30.1 | $1,206 | |
| SNF (Days) | 45 | 54.2 | 34.2 | $9,186 | 1,412 | 52.1 | 34.7 | $9,376 | 1,459 | 59.1 | 35.9 | $9,688 | 102 | 57.0 | 33.0 | $9,190 | |
| Acute Readmission (Days) | 21 | 25.3 | 7.9 | $12,343 | 789 | 29.1 | 10.8 | $13,192 | 836 | 33.9 | 11.0 | $13,102 | 77 | 43.0 | 12.0 | $14,889 | |
| APR-DRG 1 N=523 | APR-DRG 2 N=3,075 | APR-DRG 3 N=1,456 | APR-DRG 4 N=190 | ||||||||||||||
| DRG | N | % with Claim | Mean Use | Mean Payment | N | % with Claim | Mean Use | Mean Payment | N | % with Claim | Mean Use | Mean Payment | N | % with Claim | Mean Use | Mean Payment | |
| 014 Specific Cerebrovascular Disorders except TIA (N=5,244) | Total Episode Days (Index Admission Days + PAC days) | 523 | 10.0note1a | 87.7 | $23,132 | 3,075 | 58.6note1a | 93.7 | $27,631 | 1,456 | 27.8 note1a | 100.7 | $32,516 | 190 | 3.6 note1a | 103.2 | $42,472 |
| Index Admission (Days) | 523 | 100.0 | 4.4 | $6,180 | 3,075 | 100.0 | 5.1 | $6,101 | 1,456 | 100.0 | 7.5 | $6,577 | 190 | 100.0 | 16.0 | $11,128 | |
| Home Health (Visits) | 296 | 56.6 | 27.2 | $4,444 | 1,543 | 50.2 | 32.9 | $4,901 | 613 | 42.1 | 37.1 | $5,618 | 47 | 24.7 | 43.7 | $5,893 | |
| IRF (Days) | 178 | 34.0 | 18.4 | $19,913 | 1,209 | 39.3 | 18.1 | $19,614 | 510 | 35.0 | 20.4 | $22,517 | 45 | 23.7 | 24.5 | $26,912 | |
| LTCH (Days) | 9 | 1.7 | 28.4 | $28,049 | 77 | 2.5 | 30.3 | $29,193 | 57 | 3.9 | 27.7 | $31,125 | 23 | 12.1 | 35.2 | $28,251 | |
| Hospital Outpatient Therapy (Services) | 182 | 34.8 | 69.6 | $1,738 | 964 | 31.3 | 72.2 | $1,899 | 362 | 24.9 | 80.0 | $2,184 | 32 | 16.8 | 86.1 | $2,633 | |
| SNF (Days) | 178 | 34.0 | 40.7 | $12,256 | 1,424 | 46.3 | 45.7 | $14,017 | 890 | 61.1 | 46.8 | $14,431 | 156 | 82.1 | 47.7 | $14,800 | |
| Acute Readmission (Days) | 130 | 24.9 | 7.8 | $9,657 | 868 | 28.2 | 9.6 | $12,545 | 559 | 38.4 | 11.4 | $13,294 | 88 | 46.3 | 12.8 | $16,188 | |
| 127 Heart Failure & Shock (N=4,209) | Total Episode Days (Index Admission Days + PAC days) | 415 | 9.9note1a | 85.9 | $17,699 | 2,486 | 59.1note1a | 85.6 | $19,680 | 1,164 | 27.7note1a | 83.8 | $22,495 | 144 | 3.4 note1a | 85.7 | $27,477 |
| Index Admission (Days) | 415 | 100.0 | 4.5 | $4,933 | 2,486 | 100.0 | 5.5 | $5,002 | 1,164 | 100.0 | 7.9 | $5,584 | 144 | 100.0 | 13.7 | $8,473 | |
| Home Health (Visits) | 303 | 73.0 | 26.3 | $3,475 | 1,615 | 65.0 | 29.7 | $3,840 | 678 | 58.2 | 26.5 | $3,539 | 73 | 50.7 | 26.8 | $3,506 | |
| IRF (Days) | 17 | 4.1 | 14.1 | $18,108 | 81 | 3.3 | 14.0 | $15,253 | 55 | 4.7 | 16.0 | $17,646 | 9 | 6.3 | 11.9 | $15,386 | |
| LTCH (Days) | 2 | 0.5 | 21.0 | $24,557 | 48 | 1.9 | 29.2 | $31,364 | 39 | 3.4 | 26.6 | $29,151 | 12 | 8.3 | 20.3 | $23,405 | |
| Hospital Outpatient Therapy (Services) | 50 | 12.0 | 39.5 | $1,007 | 340 | 13.7 | 39.5 | $1,482 | 158 | 13.6 | 33.6 | $1,750 | 21 | 14.6 | 70.2 | $3,184 | |
| SNF(Days) | 147 | 35.4 | 31.4 | $8,866 | 1,155 | 46.5 | 34.6 | $9,424 | 634 | 54.5 | 35.3 | $9,734 | 87 | 60.4 | 29.5 | $8,610 | |
| Acute Readmission (Days) | 140 | 33.7 | 12.5 | $18,103 | 989 | 39.8 | 12.3 | $16,338 | 535 | 46.0 | 13.0 | $16,315 | 69 | 47.9 | 15.2 | $18,048 | |
| 210 Hip & Femur Procedures except Major Joint Age >17 w CC (N=3,684) | Total Episode (Index Admission Days + PAC) | 312 | 8.5note1a | 87.7 | $28,479 | 2,248 | 61.0note1a | 91.7 | $30,211 | 1,009 | 27.4note1a | 103.6 | $33,171 | 107 | 2.9 note1a | 114.0 | $42,841 |
| Index Admission (Days) | 312 | 100.0 | 5.0 | $9,249 | 2,248 | 100.0 | 5.6 | $9,439 | 1,009 | 100.0 | 7.6 | $9,993 | 107 | 100.0 | 12.5 | $12,014 | |
| Home Health (Visits) | 174 | 55.8 | 28.3 | $4,678 | 1,221 | 54.3 | 27.8 | $4,647 | 505 | 50.0 | 32.8 | $5,317 | 42 | 39.3 | 48.1 | $7,148 | |
| IRF (Days) | 102 | 32.7 | 14.3 | $14,133 | 612 | 27.2 | 15.2 | $15,444 | 236 | 23.4 | 16.2 | $16,402 | 18 | 16.8 | 15.6 | $16,607 | |
| LTCH (Days) | 2 | 0.6 | 20.5 | $17,244 | 31 | 1.4 | 30.9 | $30,859 | 25 | 2.5 | 31.2 | $28,235 | 13 | 12.1 | 32.9 | $35,501 | |
| Hospital Outpatient Therapy (Services) | 53 | 17.0 | 49.5 | $1,147 | 373 | 16.6 | 58.1 | $1,437 | 173 | 17.1 | 118.1 | $1,556 | 14 | 13.1 | 73.5 | $1,651 | |
| SNF (Days) | 209 | 67.0 | 45.9 | $13,577 | 1,641 | 73.0 | 47.0 | $13,708 | 778 | 77.1 | 49.7 | $14,258 | 81 | 75.7 | 54.2 | $16,350 | |
| Acute Readmission (Days) | 65 | 20.8 | 8.6 | $12,481 | 611 | 27.2 | 9.3 | $12,409 | 342 | 33.9 | 10.9 | $13,925 | 48 | 44.9 | 15.4 | $18,549 | |
| NOTES:1. Utilization is measured in days for acute, IRF, LTCH, and SNF; visits for HHA; and units of service for hospital outpatient therapy.1a. This is a row percent.2. APR-DRG level 1 = Minor Severity; APR-DRG level 2 = Moderate Severity; APR-DRG level 3 = Major Severity; APR-DRG level 4 = Extreme Severity. | |||||||||||||||||
| SOURCE: RTI analysis of 2005 Medicare Claims (mmor140). | |||||||||||||||||
Another finding highlighted in this table is related to the use of IRF services. In looking at both the stroke (DRG 014) and hip (DRG 210) populations, we see that the percent of beneficiaries using IRF services decreases for patients in the highest APR-DRG severity levels. This may be reflective of the inability of these very sick beneficiaries to meet the minimum therapy requirements of the IRF setting.
5. Multivariate Analysis Results
5.1 Regression Results and Effect of Organizational Relationships
The regression models presented in Table 5-1 highlight the effect of organizational relationships and the use of any PAC services, the length of stay in the acute index admission, and the first setting of post-acute care after controlling for demographics, severity of illness, supply of PAC providers, and region. Exponentiated coefficients from the binomial logit identify the probability of using any PAC following a live hospital discharge.
Values below one indicate a negative association; above one, a positive association. Exponentiated coefficients from the multinomial logistic regression are relative risk ratios. They identify the proportional change in the risk (probability) of discharge to each PAC setting relative to the risk of discharge to hospital outpatient therapy, which is associated with a one unit change in the explanatory variable. Values below one indicate an associated risk reduction. The binomial results represent the average effects across PAC sites while the multinomial model presents the odds of using a particular type of service relative to the odds of using hospital outpatient therapy. This is useful for examining the magnitude of the differences in the probability of admission to one site versus another compared to the average case with a particular beneficiary or market characteristic. The coefficients reported for the ordinary least squares (OLS) model predicting index admission length of stay reflect the increase in index admission days for a one unit change in the independent variable. Positive coefficient values indicate an increase in length of stay with increasing values of the independent variable.
Demographics. Beneficiaries with any Medicaid enrollment in 2005 had longer index admission lengths of stay than non-Medicaid beneficiaries and were also 41% more likely to use any post-acute care following discharge from the index admission. Their odds of discharge to HHA, IRF, and LTCH (compared to hospital outpatient therapy) were lower than non-Medicaid enrollees, however, they were more likely to be discharged to the SNF setting (compared to hospital outpatient therapy).
The relationship between age and PAC use indicated that older beneficiaries are more likely to use PAC services than beneficiaries under age 65, especially the oldest beneficiaries. Those ages 85 and over are 5.1 times as likely to be discharged to a SNF (compared to hospital outpatient therapy) than beneficiaries under age 65. Age had little impact on predicting the use of LTCH services though both Medicaid status and race were significant in predicting LTCH use. Medicaid enrollees were 18% less likely to be discharged to LTCH (compared to hospital outpatient therapy) than non-Medicaid enrollees and the odds of being discharged to LTCH for black beneficiaries were 1.55 times the odds for other beneficiaries.
| OLS Regression Predicting Index Acute Admission LOS | Binomial Logit note1 Predicting PAC/NoPAC | Multinomial Logit: Predicting Discharge Destination note2 | |||||||||||
|
| Home Health | IRF | LTCH | SNF | |||||||||
| Variable | Coefficient note3 | Odds Ratio note3 | Odds Ratio note3 | Odds Ratio note3 | Odds Ratio note3 | Odds Ratio note3 | |||||||
| Intercept | 2.242 | *** | |||||||||||
| Demographics | Female | 0.007 | 1.310 | *** | 1.138 | *** | 1.257 | *** | 1.051 | 1.351 | *** | ||
| Any Medicaid in 2005 | 0.289 | *** | 1.410 | *** | 0.675 | *** | 0.573 | *** | 0.825 | ** | 1.265 | *** | |
| Age 65-74 note4 | 0.082 | ** | 1.641 | *** | 1.257 | *** | 1.196 | ** | 0.942 | 1.558 | *** | ||
| Age 75-84 | 0.233 | *** | 2.864 | *** | 1.567 | *** | 1.817 | *** | 1.187 | * | 3.583 | *** | |
| Ages 85 + | 0.120 | ** | 5.075 | *** | 1.266 | *** | 1.278 | *** | 0.892 | 5.120 | *** | ||
| Black note5 | 0.364 | *** | 0.968 | * | 1.227 | *** | 1.117 | * | 1.551 | *** | 1.000 | ||
| Severity | APR-DRG Severity Index = moderate note6 | 1.279 | *** | 1.762 | *** | 1.297 | *** | 1.479 | *** | 3.172 | *** | 1.869 | *** |
| APR-DRG Severity Index = major | 4.041 | *** | 3.310 | *** | 1.661 | *** | 2.105 | *** | 10.929 | *** | 3.226 | *** | |
| APR-DRG Severity Index = extreme | 12.212 | *** | 7.660 | *** | 1.867 | *** | 4.626 | *** | 80.265 | *** | 6.376 | *** | |
| Supply | IRF beds/1000 benes/state | 0.149 | ** | 1.068 | ** | 0.741 | *** | 1.654 | *** | 1.355 | ** | 0.718 | *** |
| SNF beds/1000 benes/state | 0.002 | 1.002 | ** | 0.978 | *** | 0.984 | *** | 0.989 | * | 0.999 | |||
| LTCH beds/1000 benes/state | -0.050 | * | 1.059 | *** | 1.256 | *** | 1.099 | ** | 1.621 | *** | 1.146 | *** | |
| Census Division note7 | Middle Atlantic | 0.642 | *** | 0.880 | *** | 0.970 | 0.969 | 0.605 | ** | 0.832 | * | ||
| East North Central | -0.354 | *** | 0.695 | *** | 0.581 | *** | 0.594 | *** | 0.651 | ** | 0.630 | *** | |
| West North Central | -0.293 | *** | 0.566 | *** | 0.407 | *** | 0.390 | *** | 0.410 | *** | 0.397 | *** | |
| South Atlantic | 0.018 | 0.667 | *** | 0.669 | *** | 0.690 | ** | 0.523 | *** | 0.643 | *** | ||
| East South Central | -0.157 | * | 0.578 | *** | 0.697 | *** | 0.900 | 0.810 | 0.680 | *** | |||
| West South Central | -0.194 | ** | 0.473 | *** | 0.869 | 0.947 | 2.185 | *** | 0.402 | *** | |||
| Mountain | -0.524 | *** | 0.573 | *** | 0.515 | *** | 0.713 | ** | 0.962 | 0.591 | *** | ||
| Pacific | -0.125 | 0.463 | *** | 0.708 | ** | 0.782 | * | 1.060 | 0.444 | *** | |||
| Organizational Relationships of Discharging Acute Hospital note8 | Any Colocated Provider | 0.025 | 1.029 | ** | - | - | - | - | |||||
| Any Subprovider | 0.126 | *** | 1.042 | *** | - | - | - | - | |||||
| Any Subprovider IRF | - | - | 1.092 | ** | 2.011 | *** | 0.900 | * | 0.844 | *** | |||
| Any Subprovider SNF | - | - | 0.924 | ** | 0.789 | *** | 0.824 | ** | 1.167 | *** | |||
| Any Subprovider HHA | - | - | 0.984 | 0.888 | *** | 0.832 | ** | 1.058 | * | ||||
| Any Colocated IRF | - | - | 1.237 | * | 2.012 | *** | 0.633 | ** | 0.888 | ||||
| Any Colocated SNF | - | - | 1.102 | * | 1.078 | 1.040 | 1.163 | *** | |||||
| Any Colocated HHA | - | - | 0.876 | * | 0.900 | 0.936 | 0.905 | ||||||
| Any Colocated LTCH | - | - | 0.901 | * | 0.962 | 2.095 | *** | 0.760 | *** | ||||
| OLS Regression Predicting Index Acute Admission LOS | Binomial Logitnote1 Predicting PAC/NoPAC | Multinomial Logit: Predicting Discharge Destinationnote2 | |||||||||||
|
| Home Health | IRF | LTCH | SNF | |||||||||
| Variable | Coefficientnote3 | Odds Rationote3 | Odds Rationote3 | Odds Rationote3 | Odds Rationote3 | Odds Rationote3 | |||||||
| Characteristics of Discharging Acute Hospital | Number of Beds | 0.000 | *** | 1.000 | ** | - | - | - | - | ||||
| Urban Location note9 | 0.414 | *** | 1.162 | *** | - | - | - | - | |||||
| Not-for-profit note10 | -0.067 | * | 1.024 | - | - | - | - | ||||||
| Government run note10 | 0.053 | 1.011 | - | - | - | - | |||||||
| Acute DRG note11 | DRG 209 Major Joint & Limb Reattachment Procedures of Lower Extremity | -0.256 | *** | 27.333 | *** | 1.036 | 4.964 | *** | 0.457 | *** | 1.687 | *** | |
| DRG 089 Simple Pneumonia & Pleurisy Age >17 w CC | -0.252 | *** | 0.965 | 0.822 | ** | 0.280 | *** | 0.471 | *** | 0.847 | ** | ||
| DRG 014 Specific Cerebrovascular Disorders except TIA | 0.203 | ** | 4.380 | *** | 0.415 | *** | 4.882 | *** | 1.163 | 0.892 | * | ||
| DRG 127 Heart Failure & Shock | -0.193 | *** | 0.999 | 1.436 | *** | 0.425 | *** | 0.762 | 0.936 |
| |||
| DRG 210 Hip & Femur Procedures Except Major Joint Age >17 w CC | 1.004 | *** | 17.758 | *** | 0.647 | ** | 12.386 | *** | 2.626 | *** | 5.240 | *** | |
| Adjusted R2 |
| 0.180 | |||||||||||
| NOTES:1. Note that the reference group for the binomial logit is No PAC Use.2. Note that the reference group for the multinomial logit is Outpatient Therapy.3. Significance * p0.05. ** p0.01, *** p0.0001.4. The reference group for age is 65.5. The reference group includes White, Asian, Hispanic, North American Native, Unknown, and Other.6. The reference group for APR-DRG Severity Index is minor.7. The reference group for the census division variables is New England. 8. The reference group for each of these variables is the absence of this type of organizational relationship.9. The reference group is rural location.10. The reference group is for-profit .11. The reference group for each of these variables is the absence of this DRG as the index acute admission DRG. | |||||||||||||
| SOURCE: RTI analysis of 2005 Medicare claims (mmor129). | |||||||||||||
Severity of Illness. The APR-DRG severity of illness variables had significant effects on predicting the index acute admission length of stay, any PAC use, and the first setting of care following discharge. Increasing severity of illness is associated with longer index admission lengths of stay and odds of PAC use. For example, beneficiaries in APR-DRG severity level 2 (moderate) have a 1.3 day longer stay in the index admission than beneficiaries in the lowest APR-DRG severity level, but beneficiaries in APR-DRG severity level 4 (extreme) have a 12.2 day longer index admission length of stay.
The odds of PAC use show similar results. The odds of PAC use for beneficiaries in APR-DRG severity level 4 (extreme) are 7.6 times the odds for beneficiaries in APR-DRG severity level 1. The odds of discharge to each of the PAC settings also increased with severity of illness level. The odds of discharge to LTCH for those in the highest APR-DRG severity level were notably higher than the odds of discharge to hospital outpatient therapy (odds ratio 80.3) indicating that these most severely ill patients are more likely to use LTCH services following acute hospital discharge.
Supply of Post-Acute Services and Region. The supply of post-acute beds per thousand beneficiaries had a small effect on predicting index admission length of stay and the use of any PAC services following discharge. However, supply had a greater effect in predicting the first site of PAC following discharge from the acute index admission. For example, each additional IRF bed relative to the number of 1000 beneficiaries increased the odds of being discharged to an IRF by 1.7 times relative to the odds of being discharged to hospital outpatient therapy. Similarly, the odds of discharge to LTCH were 1.6 greater for every increasing LTCH bed per thousand beneficiaries. Greater availability of SNF beds per thousand beneficiaries did not significantly affect the odds of being discharged to SNF. This result is likely due to the large number of SNF beds available throughout the country. Measures of HHA and hospital outpatient therapy providers were not included in the model since these services are more uniformly accessible to beneficiaries and would not affect variation in choice.
The region variables provide another opportunity to control for the effects of supply differences in the use of post-acute providers. The reference group for this variable is New England and the results indicate that for the most part, index admission length of stay, odds of PAC use, and odds of discharge to each of the PAC settings are lower for beneficiaries in regions other than New England. This result is consistent with the greater supply of providers in the New England region and regional physician practice patterns. However, a notable exception to this is seen in the odds of discharge to LTCH for the West South Central region (Arkansas, Louisiana, Oklahoma, and Texas) where the odds of discharge to LTCH (compared to the odds of discharge to hospital outpatient therapy) is 2.2 times higher than the odds of discharge to LTCH in New England.
Organizational Relationships. The regression models predicting Index admission length of stay and any PAC use included two variables indicating whether the acute hospital had PAC providers that were 1) co-located or 2) subproviders. Having a co-located provider was not significant in the model predicting index admission length of stay although beneficiaries discharged from an acute hospital with a subprovider showed a 0.126 day longer index admission length stay compared to beneficiaries discharged from acute hospitals without any subproviders. These organizational variables had a greater impact in predicting post-acute use. The odds of using post-acute care are 2.9% higher for beneficiaries discharged from acute hospitals with a co-located provider, and 4.2% higher for beneficiaries discharged from acute hospitals with a hospital-based subprovider compared to beneficiaries discharged from hospitals without these organizational relationships.
The multinomial logit model included more specific organizational variables which indicated whether individual acute hospitals had specific types of post-acute care providers. The results are similar for both the subprovider and co-located PAC providers and suggest that having a subprovider or co-located IRF, SNF, or LTCH significantly increases the probability of using those services. The odds of being discharged to an IRF are more than twice as high for beneficiaries discharged from acute hospitals with a co-located IRF or an IRF subprovider. Similarly, the odds of discharge to LTCH are 2.1 times greater for beneficiaries discharged from hospitals with a co-located LTCH than from hospitals without a co-located LTCH.
Similarly, the odds of being discharged to a SNF are 1.16 times greater for patients discharged from hospitals with either a SNF subprovider or a co-located SNF. These organizational factors do not show the same effects in predicting HHA use following discharge from the acute setting.
Characteristics of the Discharging Acute Hospital. Characteristics of the acute discharging hospital had minimal effects on the index acute admission length of stay or on the use of any PAC services. Urban location was the only characteristic with a significant effect. Beneficiaries discharged from acute hospitals located in urban settings had slightly longer (0.41 days) index acute admissions and their odds of using any PAC were 16.2 percent higher than beneficiaries discharged from acute hospitals in non-urban areas.
Acute DRG. Dummy variables for the five highest PAC user DRGs were also included in the models and demonstrate the differences in PAC use and discharge patterns across medical and rehabilitation DRGs. Acute index admission lengths of stay were shorter for beneficiaries in DRGs 209, 089, and 127 compared to beneficiaries with other DRGs, after controlling for severity of illness. The odds of PAC use were higher for beneficiaries in each of the three rehabilitative DRGs included in the model (DRGs 209, 014, and 210), all else equal. Beneficiaries in the three rehabilitative DRGs were more likely to be discharged to IRF compared to beneficiaries in other DRGs. These findings are consistent with past work looking at the use of PAC services for beneficiaries by DRG. Beneficiaries in DRGs 209 and 210 were also more likely to use SNF services following discharge from the acute index admission.
5.2 Effects of Organizational Relationships on Readmission Rates
Four logistic regression models were run to predict the probability of being readmitted to an acute care hospital during a PAC episode using the demographic, severity of illness, supply, census division, organizational relationships, characteristics of discharging acute hospital, and specified DRGs variables. The models varied by the inclusion/exclusion of the index admission length of stay and the inclusion/exclusion of the first site of post-acute care. The results are presented in Table 5-2a and Table 5-2b. Point estimates from the regression are relative risk ratios and identify the probability of readmission to an acute care setting. Values below one indicate a negative association; above one, a positive association.
Demographics. Younger (ages 65-74), female beneficiaries were less likely to experience an acute care readmission during their PAC episode than older or male beneficiaries. Conversely, beneficiaries with any Medicaid enrollment in 2005 were more likely to be readmitted compared to non-Medicaid beneficiaries. Race was significant in predicting readmissions and the odds of being readmitted for black beneficiaries were 1.1 times the odds for other beneficiaries (White, Asian, Hispanic, North American Native, Unknown, and Other).
Severity of Illness. The regression models demonstrate the significant role of the APR-DRG severity of illness variables in predicting acute care readmissions. Medicare beneficiaries in APR-DRG severity level 2 (moderate) are 1.4 times more likely to experience a readmission then APR-DRG severity level 1 (minor) and the probability increases with APR-DRG severity.
Supply of Post-Acute Services and Region. The supply of post-acute beds per thousand beneficiaries for IRFs and SNFs had no effect on predicting readmission to an acute care hospital although this probability increased slightly with the number of LTCH beds. The region variables provide another opportunity to control for regional differences in the supply of post-acute providers. The reference group for this variable is New England and the results indicate that Medicare beneficiaries residing in the East North Central, East and West South Central were slightly more likely to be readmitted while those beneficiaries in the Mountain region were less likely to have an acute care readmission.
| Variable | Model 1 Odds Ratio[note1] | Model 2 Odds Ratio[note1] | |||
| Demographics | Female | 0.922 | *** | 0.914 | *** |
| Any Medicaid in 2005 | 1.066 | *** | 1.059 | ** | |
| Age 65-74[note2] | 0.946 | * | 0.943 | * | |
| Age 75-84 | 1.031 | 1.015 | |||
| Ages 85 + | 1.014 | 0.978 | |||
| Black[note3] | 1.147 | *** | 1.163 | *** | |
| Severity | APR-DRG Severity Index = moderate[note4] | 1.398 | *** | 1.442 | *** |
| APR-DRG Severity Index = major | 1.859 | *** | 2.057 | *** | |
| APR-DRG Severity Index = extreme | 2.011 | *** | 2.718 | *** | |
| Supply | IRF beds/1000 benes/state | 0.970 | 0.973 | ||
| SNF beds/1000 benes/state | 0.998 | 0.998 | |||
| LTCH beds/1000 benes/state | 1.050 | ** | 1.048 | ** | |
| Census Division[note5] | Middle Atlantic | 1.055 | 1.086 | ||
| East North Central | 1.098 | * | 1.092 | * | |
| West North Central | 1.019 | 1.019 | |||
| South Atlantic | 0.976 | 0.986 | |||
| East South Central | 1.110 | * | 1.116 | * | |
| West South Central | 1.221 | *** | 1.221 | *** | |
| Mountain | 0.882 | * | 0.875 | * | |
| Pacific | 0.917 | 0.917 | |||
| Organizational Relationships of Discharging Acute Hospital[note6] | Any Colocated Provider | 0.998 | 0.996 | ||
| Any Subprovider | 0.993 | 0.998 | |||
| Characteristics of Discharging Acute Hospital | Number of Beds | 1.000 | 1.000 | * | |
| Urban Location[note7] | 1.054 | ** | 1.073 | ** | |
| Not-for-profit[note8] | 0.906 | *** | 0.904 | *** | |
| Government run[note8] | 0.974 | 0.979 | |||
| IndexLOS | 1.024 | *** | |||
| Acute DRG[note9] | DRG 209 Major Joint & Limb Reattachment Procedures of Lower Extremity | 0.446 | *** | 0.420 | *** |
| DRG 089 Simple Pneumonia & Pleurisy Age >17 w CC | 0.926 | * | 0.900 | ** | |
| DRG 014 Specific Cerebrovascular Disorders except TIA | 0.990 | 0.963 | |||
| DRG 127 Heart Failure & Shock | 1.496 | *** | 1.470 | *** | |
| DRG 210 Hip & Femur Procedures Except Major Joint Age >17 w CC | 0.900 | ** | 0.886 | ** | |
| Adjusted R2 | |||||
| NOTES:1. Significance * p0.05. ** p0.01, *** p0.0001.2. The reference group for age is 65.3. The reference group includes White, Asian, Hispanic, North American Native, Unknown, and Other.4. The reference group for APR-DRG Severity Index is minor.5. The reference group for the census division variables is New England. 6. The reference group for each of these variables is the absence of this type of organizational relationship.7. The reference group is rural location.8. The reference group is for-profit .9. The reference group for each of these variables is the absence of this DRG as the index acute admission DRG. | |||||
| SOURCE: RTI analysis of 2005 Medicare claims (mmor129). | |||||
| Variable | Model 3 Odds Ratio[note1] | Model 4 Odds Ratio[note1] | |||
| Demographics | Female | 0.921 | *** | 0.912 | *** |
| Any Medicaid in 2005 | 1.076 | *** | 1.067 | ** | |
| Age 65-74[note2] | 0.943 | * | 0.939 | * | |
| Age 75-84 | 1.028 | 1.008 | |||
| Ages 85 + | 1.019 | 0.976 | |||
| Black[note3] | 1.146 | *** | 1.160 | *** | |
| Severity | APR-DRG Severity Index = moderate[note4] | 1.397 | *** | 1.443 | *** |
| APR-DRG Severity Index = major | 1.858 | *** | 2.033 | *** | |
| APR-DRG Severity Index = extreme | 2.009 | *** | 2.632 | *** | |
| Supply | IRF beds/1000 benes/state | 0.961 | 0.963 | ||
| SNF beds/1000 benes/state | 0.998 | 0.998 | |||
| LTCH beds/1000 benes/state | 1.050 | ** | 1.047 | ** | |
| Census Division[note5] | Middle Atlantic | 1.058 | 1.088 | ||
| East North Central | 1.104 | * | 1.097 | * | |
| West North Central | 1.027 | 1.028 | |||
| South Atlantic | 0.980 | 0.989 | |||
| East South Central | 1.112 | * | 1.115 | * | |
| West South Central | 1.214 | *** | 1.208 | *** | |
| Mountain | 0.884 | * | 0.874 | * | |
| Pacific | 0.917 | 0.916 | |||
| Organizational Relationships of Discharging Acute Hospital[note6] | Any Colocated Provider | 0.997 | 0.994 | ||
| Any Subprovider | 0.991 | 0.997 | |||
| Characteristics of Discharging Acute Hospital | Number of Beds | 1.000 | 1.000 | * | |
| Urban Location[note7] | 1.044 | * | 1.061 | ** | |
| Not-for-profit[note8] | 0.91 | *** | 0.909 | *** | |
| Government run[note8] | 0.978 | 0.985 | |||
| IndexLOS | 1.024 | *** | |||
| Acute DRG[note9] | DRG 209 Major Joint & Limb Reattachment Procedures of Lower Extremity | 0.435 | *** | 0.408 | *** |
| DRG 089 Simple Pneumonia & Pleurisy Age >17 w CC | 0.932 | * | 0.908 | ** | |
| DRG 014 Specific Cerebrovascular Disorders except TIA | 0.959 | 0.927 | |||
| DRG 127 Heart Failure & Shock | 1.498 | *** | 1.477 | *** | |
| DRG 210 Hip & Femur Procedures Except Major Joint Age >17 w CC | 0.880 | ** | 0.857 | ** | |
| Variable | Model 3 Odds Ratio[note1] | Model 4 Odds Ratio[note1] | |||
| First PAC Setting[note10] | SNF | 1.114 | *** | 1.179 | *** |
| LTCH | 1.149 | ** | 1.371 | *** | |
| HHA | 1.145 | *** | 1.176 | *** | |
| IRF | 1.278 | *** | 1.347 | *** | |
| NOTES:1. Significance * p0.05. ** p0.01, *** p0.0001.2. The reference group for age is 65.3. The reference group includes White, Asian, Hispanic, North American Native, Unknown, and Other.4. The reference group for APR-DRG Severity Index is minor.5. The reference group for the census division variables is New England. 6. The reference group for each of these variables is the absence of this type of organizational relationship.7. The reference group is rural location.8. The reference group is for-profit .9. The reference group for each of these variables is the absence of this DRG as the index acute admission DRG.10. The reference group is outpatient therapy. | |||||
| SOURCE: RTI analysis of 2005 Medicare claims (mmor161) | |||||
Organizational Relationships. The logistic models predicting readmissions to an acute care hospital include two organizational variables. The first variable indicated that the acute discharging hospital had a co-located post-acute provider and the second variable indicated that the acute discharging hospital had a hospital-based post-acute subprovider. Neither of these variables were significant in predicting readmissions.
Characteristics of the Discharging Acute Hospital. Characteristics of the acute discharging hospital had some effects on acute care readmissions. Patients discharged from urban hospitals had a higher probability of being readmitted than those from other hospitals. However, patients discharged from a not-for-profit hospital had a lower likelihood of being readmitted.
Acute DRG. Dummy variables for the top five DRGs in terms of volume of admissions for PAC users were also included in these models. The probability of an acute care admission was lower for beneficiaries in DRGs 209, 089, and 210 compared to beneficiaries with other DRGs, all else equal. Beneficiaries in DRG 127 were more likely to have an acute care readmission. There was no significant difference for beneficiaries in DRG 014.
Index Admission Length of Stay. The models including index admission length of stay (Models 1 and 3) indicate that this variable is positively related to the odds of acute readmission. The odds ratio for the index admission length of stay variable was 1.02 in both models indicating that beneficiaries with longer index admission lengths of stay have a higher odds of acute readmission.
First Site of Post-Acute Care. Dummy variables for the first site of post-acute care were included models 3 and 4. The results indicate that beneficiaries discharged to SNF, LTCH, HHA, or IRF have a higher odds of an acute readmission compared to beneficiaries discharged to outpatient therapy. When controlling for index admission length of stay (Model 3), the odds of having an acute readmission were 1.15 times higher for beneficiaries discharged to HHA or LTCH compared to beneficiaries discharged to hospital outpatient therapy and 1.28 times higher for beneficiaries discharged to IRF.
5.3 Probability Estimates for First Post-Acute Discharge Destination
To provide a clearer picture regarding the likelihood of being discharged to the various post-acute care facilities, we used the multinomial regression coefficients depicted in Table 5-1 to calculate actual probability estimates for first post-acute discharge destination. The multinomial model indicates the effects of explanatory variables on the probability of an event indirectly through logarithms of odds. The probability of an event, like a type of discharge, is more informative. Another value of interest is the change in the probability of an event related to a change in a particular variable such as ownership. The change in probability depends on the probability before the change. Translating the model into probability terms enables us to compute the probability before and after the variable change and to directly compute the difference. The formula connecting the model coefficients to probabilities is:
Probability of discharge destination i = ( Exp ßix ) / ( 1 + Si Exp ßix )
where i = LTCH, IRF, SNF, HHA; Outpatient is the reference group in the model; x is the set of variables in the model, e.g., intercept, age group, race, ...; ßi is the set of coefficients of the x variables that pertains to discharge to destination i. Exp signifies exponentiation and S signifies summation.
Probability of discharge destination Outpatient = 1 S probabilities of other discharge destinations
For these probability calculations, we created a dynamic Excel spreadsheet within which the parameters can be changed to reflect the changing probabilities. For example, one can change the value for Female to be 0 rather than 1, and this will reflect the discharge probabilities for males rather than females. The variable values can be modified in any combination to reflect the particular probabilities for a specific patient group.
Below in Table 5-3(a and b), we depict the probabilities of being discharged to LTCH, IRF, SNF, HHA, or hospital outpatient therapy facility depending on whether the discharging hospital has sub-providers or co-located PAC providers. For illustrative purposes, probabilities are shown for both DRG 89 (Simple Pneumonia) and DRG 209 (Joint and Limb Reattachment Procedure), as well as for APR-DRG severity levels 2 or 4 (within DRG). The first row of each table represents the probability (%) of first post-acute discharge destination for the base case: white female, 65-74 years old, with no history of Medicaid, in the ENC census region, and the discharging hospital has no sub-providers and no co-located providers.
The remaining table rows show how the probabilities change depending on whether the discharging hospital has sub-providers or co-located providers. It must be noted that when changing the variables to indicate the presence of a sub-provider or a co-located provider, the remaining sub-providers and co-located providers are still assumed to be absent. For example, when a hospital is assumed to have an IRF sub-provider, the probabilities are calculated assuming that the hospital does not have any other sub-providers and co-located providers.
5.3.1 DRG 089: Simple Pneumonia
As Table 5-3a shows, the base pneumonia patient is much more likely to be discharged to a home health agency or to a SNF than to the other settings. The base case diagnosed with simple pneumonia at severity level 2 is most likely to be discharged to an HHA (52.1%) and least likely to be discharged to an LTCH (0.6%). This base case also has a 30.8% chance of being discharged to a SNF, a 14.3% chance of being discharged to outpatient care, and a 2.2% chance of being discharged to an IRF. For the relatively low severity patients (level 2), the largest effect of sub-provider or co-located providers is noted for inpatient facilities. In the presence of a SNF sub-provider, the probability that the base pneumonia patient of severity level 2 is discharged to a SNF increases from 30.8% to 35.7%. In the presence of a co-located SNF, the probability that the base pneumonia patient of severity level 2 is discharged to a SNF also increases slightly, from 30.8% to 32.4%. Similar increases were noted for IRF and LTCH, although the likelihood that a pneumonia patient would be discharged to one of these facility types is much lower than that for SNF, with or without an organizational relationship. Similar trends were also noted for the base pneumonia patient of highest severity (level 4), although those of highest severity are much more likely to be discharged to a SNF and much less likely to be discharged to an HHA than those of lower severity (level 2).
It is notable to compare the probabilities based on severity level. The base case with pneumonia at the highest severity level (APR-DRG 4) has a much higher probability of being discharged to either an LTCH or SNF, and a much lower probability of being discharged to an outpatient or HHA facility, compared with a base case at lower severity (APR-DRG 2).
Table 5-3. Probabilities of first post-acute discharge destinations, represented as percentages, based on whether the discharging hospital has sub-providers or co-located providers.
| Probability of First Post-Acute Discharge Destination (%) | ||||||||||
| LTCH | IRF | SNF | HHA | Outpatient | ||||||
| APR-DRG Severity Level | APR-DRG 2 | APR-DRG 4 | APR-DRG 2 | APR-DRG 4 | APR-DRG 2 | APR-DRG 4 | APR-DRG 2 | APR-DRG 4 | APR-DRG 2 | APR-DRG 4 |
| Base Case[note1] | 0.6 | 7.4 | 2.2 | 3.2 | 30.8 | 48.3 | 52.1 | 34.5 | 14.3 | 6.6 |
| IRF Sub-provider[note2] | 0.6 | 6.8 | 4.3 | 6.5 | 25.4 | 41.5 | 55.7 | 38.4 | 14.2 | 6.7 |
| SNF Sub-provider | 0.5 | 5.9 | 1.7 | 2.4 | 35.7 | 54.5 | 47.8 | 30.8 | 14.2 | 6.4 |
| HHA Sub-provider | 0.5 | 6.2 | 1.9 | 2.8 | 32.4 | 50.8 | 51.0 | 33.7 | 14.2 | 6.5 |
| Co-located IRF | 0.4 | 4.6 | 4.0 | 6.1 | 24.7 | 41.6 | 58.1 | 41.3 | 12.9 | 6.4 |
| Co-located SNF | 0.6 | 6.9 | 2.1 | 3.0 | 32.4 | 50.2 | 51.9 | 34.0 | 13.0 | 5.9 |
| Co-located HHA | 0.7 | 7.7 | 2.2 | 3.1 | 30.8 | 48.4 | 50.5 | 33.5 | 15.8 | 7.3 |
| Co-located LTCH | 1.5 | 16.8 | 2.4 | 3.3 | 26.5 | 39.5 | 53.3 | 33.4 | 16.2 | 7.1 |
| Probability of First Post-Acute Discharge Destination (%) | ||||||||||
| LTCH | IRF | SNF | HHA | Outpatient | ||||||
| APR-DRG Severity Level | APR-DRG 2 | APR-DRG 4 | APR-DRG 2 | APR-DRG 4 | APR-DRG 2 | APR-DRG 4 | APR-DRG 2 | APR-DRG 4 | APR-DRG 2 | APR-DRG 4 |
| Base Case[note1] | 0.3 | 3.4 | 21.5 | 26.7 | 33.9 | 46.0 | 36.3 | 20.8 | 7.9 | 3.1 |
| IRF Sub-provider[note2] | 0.3 | 2.6 | 36.1 | 44.2 | 23.9 | 32.0 | 33.1 | 18.7 | 6.6 | 2.6 |
| SNF Sub-provider | 0.3 | 2.8 | 17.2 | 21.1 | 40.3 | 53.7 | 34.1 | 19.2 | 8.1 | 3.2 |
| HHA Sub-provider | 0.3 | 2.9 | 19.3 | 24.0 | 36.3 | 49.2 | 36.1 | 20.7 | 8.0 | 3.2 |
| Co-located IRF | 0.2 | 1.7 | 34.2 | 42.7 | 23.9 | 32.5 | 35.5 | 20.5 | 6.3 | 2.5 |
| Co-located SNF | 0.3 | 3.2 | 20.9 | 25.7 | 35.6 | 47.8 | 36.1 | 20.5 | 7.1 | 2.8 |
| Co-located HHA | 0.4 | 3.6 | 21.4 | 26.6 | 34.1 | 46.1 | 35.3 | 20.2 | 8.8 | 3.5 |
| Co-located LTCH | 0.8 | 8.0 | 23.5 | 28.6 | 29.4 | 39.0 | 37.3 | 20.9 | 9.0 | 3.5 |
| 1. Note that the base case is represented as: White female, aged 65-74 years old, with no history of Medicaid, in the ENC census region, and the discharging hospital has no sub-providers and no co-located providers. 2. Note that when changing the variables so that the hospital has the sub-provider or a co-located provider displayed in each row, the remaining sub-providers and co-located providers are still assumed to be absent. For example, when a hospital is assumed to have an IRF sub-provider, it is assumed that the hospital does not have any other sub-providers and co-located providers. | ||||||||||
| Source: RTI analysis of 2005 Medicare claims. | ||||||||||
Furthermore, it is notable how the difference in the percentages changes depending on severity level and whether the patient has a small, medium, or large chance of being discharged to that setting at all. For example, the base case at severity level 2 has a 0.6% chance of being discharged to an LTCH if the hospital has no sub-providers and no co-located providers, but a 1.5% chance of being discharged to an LTCH if the hospital has a co-located LTCH (both still small chances). However, that same base case at severity level 4 has a 7.4% chance of being discharged to an LTCH if the hospital has no sub-providers and no co-located providers, but a 16.8% chance of being discharged to an LTCH if the hospital has a co-located LTCH. From this we can see that the real marginal effect of co-location or sub-provider depends on whether the patient has a small, medium or large chance of going to that setting at all.
There are other notable findings in Table 5-3a. The presence of a co-located HHA or an HHA sub-provider slightly lowers the probability that the base pneumonia patient of severity level 2 will be discharged to an HHA by a few percentage points (from 52.1% to around 50%). However, the presence of a HHA sub-provider slightly increases the probability that a patient will be discharged to a SNF (from 30.8% to 32.4%). Furthermore, for the base pneumonia patient, the probability of being discharged to an outpatient facility remains essentially unchanged by the presence or absence of sub-providers or co-located providers (between 13% and 16% for severity level 2, and between 5.9% and 7.3% for severity level 4). Another notable finding is that severity level for people diagnosed with pneumonia has little effect on the probability of being discharged to an IRF. On the other hand, the probability that a patient with pneumonia is discharged to outpatient is more than twice as high for severity level 2 compared to severity level 4.
5.3.2 DRG 209: Joint and Limb Reattachment Procedure
Table 5-3b shows the probabilities of first post-acute discharge destination for a patient with DRG 209: Joint and Limb Reattachment Procedure. Unlike the base pneumonia patient, these patients are much more likely to be discharged to an inpatient facility (LTCH, IRF, or SNF) rather than an outpatient facility (HHA or outpatient). The base joint/limb patient at severity level 2 is most likely to be discharged to an HHA (36.3%) and least likely to be discharged to an LTCH (0.3%). This base case also has a 33.9% chance of being discharged to a SNF, a 21.5% chance of being discharged to an IRF, and a 7.9% chance of being discharged to outpatient. For the low severity patients (level 2), the largest effect of sub-provider or co-located providers is noted in IRFs. In the presence of an IRF sub-provider, the probability that the base joint/limb patient of severity level 2 is discharged to an IRF increases from 21.5% to 36.1%. This probability increases from 21.5% to 34.2% in the presence of a co-located IRF. Positive co-location and sub-provider effects were also noted for SNF. Similar trends for SNF and IRF were also noted for the base joint/limb patient of highest severity (level 4).
There are other notable findings in Table 5-3b. For joint/limb patients, the probability of discharge to an HHA is unchanged by the presence or absence of an HHA sub-provider or a co-located HHA (although the likelihood that a joint/limb patient will be discharged to an HHA is on average 15 percentage points lower for severity level 4 as it is for severity level 2 patients). Furthermore, for the base joint/limb patient, the probability of being discharged to outpatient remains essentially unchanged by the presence or absence of sub-providers or co-located providers (between 6% and 9% for severity level 2, and between 2.5% and 3.5% for severity level 4).
Just as was noted for the pneumonia patients, it is useful to compare the probabilities based on severity level. The base joint/limb patient at the highest severity level (APR-DRG 4) has a much higher probability of being discharged to either an LTCH or SNF, and a much lower probability of being discharged to an outpatient or HHA facility, compared with a base case at lower severity (APR-DRG 2). Furthermore, the difference in the percentages change depending on severity level and whether the patient has a small, medium, or large chance of being discharged to that setting at all. For example, the base joint/limb patient at severity level 2 has a 0.3% chance of being discharged to an LTCH if the hospital has no sub-providers and no co-located providers, and this probability increases only to 0.8% in the presence of a co-located LTCH. However, that same base case at severity level 4 has a 3.4% chance of being discharged to an LTCH if the hospital has no sub-providers and no co-located providers, but a 8% chance in the presence of an co-located LTCH. Similar to what was found for the base pneumonia patient, patient severity of illness drives the likelihood of discharge to each post-acute setting and the marginal effect of co-location or sub-provider is secondary to the patients probability of going to that setting. However, having a co-located LTCH significantly increases the probability of its use by the severely ill (APR-DRG level 4) by almost 5 percentage points.
6. Discussion
6.1 Implications of the Findings
These analyses provide important information on the effects of different organizational relationships for predicting PAC use. As an access issue, the Medicare program is concerned with beneficiaries having access to the range of appropriate providers. These analyses suggest that while site of care choices appear to differ by severity of illness, these choices are not mutually exclusive and there is still overlap in the choices made for patients with similar diagnosis and severity levels. The availability of providers significantly affected these choices, all else equal. These analyses showed that while substitution, to some extent, is possible and likely the presence of a subprovider or co-located provider may influence the relative use of a particular type of PAC provider.
One concern was that hospitals with subproviders or co-located providers may be more likely to discharge patients earlier, all else equal. This did not appear to be the case. In fact, the hospitals that had subproviders tended to have statistically significant longer length index admissions (0.126 days longer or less than one day longer) compared to hospitals without subproviders and the presence of a co-located provider did not have a statistically significant effect on index admission length of stay (0.025 days longer). More analysis is necessary to examine the clinical and policy significance of these findings. While the models controlled for DRGs and APR-DRG severity levels, they did not control for more refined measures of medical complexity or functional impairment. Some of these differences may be better explained with more complete patient information.
The most notable effect in this study was how having a particular type of subprovider or co-located provider appeared to be related to the use of that type of provider, with the exception of home health. SNF effects were lower than IRF or LTCH and this may be due to the greater availability of these providers in a local market area. The models just controlled for availability in the state, but not at the market level. Alternatively, these differences may be related due to differences in administrative requirements. Hospitals must provide patients being discharged to a SNF or HHA with a list of all the local providers. This requirement does not apply to those being discharged to IRFs and LTCHs. While the availability of IRFs and LTCH is much lower, in general, certain market areas have multiple choices of both IRFs and LTCHs. This analysis may suggest that similar information requirements may be useful for discharges to these settings as well.
The analysis of readmission rates suggest that organizational relationships did not have a significant effect on patient outcomes. These organizational variables were not significant in predicting the probability of hospital readmission. Patients discharged from hospitals with subproviders or co-located providers were no more likely to be readmitted than those discharged from hospitals without these options.
These analyses were important for exploring the informal relationships among providers. PAC services that are located nearby, whether down the hall or across the street are easier to use. Physicians are more likely to practice in the near-by setting; families will be more familiar with the near-by services. The concept of a medical mall has been growing over the past 15 years with little documentation of this growth. Much of it has occurred through the establishment of satellite facilities which are not clearly reported in the OSCAR data nor completely identified in the PECOS data. As a result, these analyses under-identify co-located providers as they failed to identify satellite beds that may be available in a geographic area. The results for the co-located providers may be yet much stronger than those we found here. Yet, the addition of the co-located providers contributed to otherwise omitted options in prior analyses which focused only on subproviders status in examining organizational effects. These informal relationships may be just as important in explaining PAC discharge choices.
6.2 Next Steps
These analyses were useful as a first step in examining the effects of having a subprovider or co-located provider available. However, better data on co-location and satellite facility locations are needed. While the FIs are supposed to receive this data, little information is recorded in the PECOS or other administrative systems on the actual location of subproviders and satellite facilities. This creates problems implementing regulations in areas that are affected by these characteristics. For example, LTCH payments are adjusted if a hospital is receiving a high proportion of their admissions from any one hospital. Understanding the effects of being a co-located LTCH or a hospital-within- hospital would be useful for tracking these transfers, and also, considering the impact of this regulation on patient outcomes. Yet, under the current administrative files, it is difficult to identify which hospitals are co-located or satellite facilities co-located in other hospitals. This is the first systematic attempt to identify embedded providers and it required a GIS assignment by latitude and longitude, and assumes the OSCAR data provided an accurate address for all the PAC beds associated with each provider identification number.
Second, these analyses answered whether, at the grossest level of measurement, the availability of a subprovider or collocated provider influenced utilization patterns in the episode of care. A more refined analysis of this issue will be completed during the coming year where PAC providers will be matched with individual index hospitals. The sample will be reduced to PAC users discharged from hospitals that have subproviders or co-located providers. After restricting the sample, we can address the more specific issue of whether patients are more likely to be discharged to a hospitals subprovider or collocated PAC provider, all else equal. We will also have more complete information on the total Part A and Part B episode costs.
Physician and other Part B bills will be included in our summary of episode use and payments. This analysis omitted these claims from the episode files.
In addition, we will be examining market-level differences in site of care choices, length of stay, and readmission rates. The markets will be selected to reflect those participating in the CMS PAC Payment Reform Demonstration and will provide in-depth information on the historical patient composition and episode of care patterns in these areas. This information will also be useful in future P4P discussions.
7. REFERENCES
Beeuwkes Buntin, M., A.D. Garten, S. Paddock, M. Totten, and J.J. Escarce. 2005. How Much Is Postacute Care Use Affected by Its Availability? Health Services Research 40(2): 413434.
Blewett, L.A., R.L. Kane, and M. Finch. 1995. Hospital Ownership of Post-Acute Care: Does it Increase Access to Post-Acute Care Services? Inquiry 32: 457467.
Cotterill, P. and B. Gage. 2002. Overview: Medicare Post-Acute Care Since the Balanced Budget Act of 1997. Health Care Financing Review 24(2): 16.
Dalton, K. and S. Stearns. 2005. Comparing Patient Outcomes in Hospital-Based versus Freestanding Skilled Nursing Facilities. Boston, MA.
Gage, B., R. Constantine, J. Aggarwal et al. 2008. "The Development of the Continuity Assessment Record and Evaluation (CARE) Tool." Report, CMS Contract No. HHSM-500-2005-00291.
Gage, B., M. Ingber, R. Constantine, et al. 2008. "Post Acute Care Payment Reform Demonstration (PAC:PRD)." Year 1 Report, CMS Contract No. HHSM-500-2005-0029I/0005.
Gage, B., M. Morley, J Green. 2007. A New Era: Post Acute Use Under PPS, Report, CMS Contract No. 500-00-0030, T.O. #2.
Gage, B., and M. Morley. 2007. Changes in Inpatient Rehabilitation Facility Use Pre and Post PPS, Report, CMS Contract No. 500-00-0030, T.O. #2.
Gage, B., and J. Green. 2006. The State of the Art: Current CMS PAC Instruments, Chapter 2 in Kramer, A. and D. Holthaus, Division of Health Care Policy and Research, University of Colorado at Denver and Health Sciences Center Uniform Patient Assessment for Post-Acute Care. Final Report, prepared for the Centers for Medicare & Medicaid Services under subcontract to IFMC, Contract No. IFMC 500-2IA03.
Gage, B., N. Pilkauskas, W. Bartosch, M. Leung, S. Hoover and J. Green. 2005. Long-Term Care Hospital (LTCH) Payment System Monitoring and Evaluation. Phase II Report, Draft, Centers for Medicare & Medicaid Services, CMS Contract No. 500-00-0024, TO#20.
Gage, B., W. Bartosch, and J. Green. 2005. Long-Term Care Hospital (LTCH) Project Approach Phase I Report, Draft. Centers for Medicare & Medicaid Services, CMS Contract No. 500-00-0024, TO#20.
Gage, B., W.J. Bartosch, and D.S. Osber. 2005. Medicare Post-Acute Care: Evaluation of BBA Payment Policies and Related Changes. Issues Report, CMS Contract No. 500-96-0006, T.O. #4.
Gage, B., M. Moon, and S. Chi. 1999. State-level Variation in Medicare Spending. Health Care Financing Review. 21(2):85-98.
Gage, B. 1999. Impact of the BBA on Post-acute Utilization. Health Care Financing Review 20(4): 8595.
Gage, B. 1998. Medicare Home Health and the IPS: Is Access a Problem? The Commonwealth Fund: New York. Working paper submitted to various Congressional committees and DHHS offices.
Gilman, B., B. Gage, D.S. Osber. 2005. Impact of Post-BBA Rate Adjustments under SNF PPS on Access to Non-Therapy Ancillary Services. Final Report, CMS Contract No. 500-96-0006, T.O. #4.
Gage, B., A.M. Lynch, and M.A. Miles. 1996. Post-Acute and Ambulatory Care Providers. Report and Recommendations to the Congress, Washington, DC: ProPAC.
Health Care Financing Review 2007 Statistical Supplement. Table 2.1 Medicare Enrollment: Hospital Insurance and/or Supplementary Medical Insurance Programs for Total, Fee-for-Service and Managed Care Enrollees as of July 1, 2005: Selected Calendar Years 1966-2005. Pg. 32
Kenney, G.M. 1993. How Access to Long-Term Care Affects Home Health Transfers Journal of Health Politics, Policy and Law, 18(4):937965.
Kenney, G.M. and L.C. Dubay. 1992. Explaining Area Variations in the Use of Medicare Home Health Services. Medical Care, 30(1): 4357.
Liu, K., and K.J. Black. 2003. Hospital-Based and Freestanding Skilled Nursing Facilities: Any Cause for Differential Medicare Payments? Inquiry. 40(1):94-104.
McCall, N., J. Korb, A. Petersons and S. Moore. 2003. Reforming Medicare Payment: Early Effects of the 1997 Balanced Budget Act on Post-acute Care. Milbank Quarterly 81 (2): 277303, 1723.
Medicare Payment Advisory Commission (MedPAC). 2006. Report to Congress: Medicare Payment Policy. Medicare Prospective Payment Commission, Washington, DC, March 2006.
Medicare Payment Advisory Commission (MedPAC). 2005. Report to Congress: Issues in a Modernized Medicare Program. Medicare Prospective Payment Commission, Washington, DC, June 2005.
Medicare Payment Advisory Commission (MedPAC). 2005. Report to Congress: Medicare Payment Policy. Medicare Prospective Payment Commission, Washington, DC, March 2005.
Medicare Payment Advisory Commission (MedPAC) 2004. Report to Congress: New Approaches to Medicare. Medicare Prospective Payment Commission, Washington, DC, June 2004.
Pizer S.D., A.J. White, C. White. 2002. Why are Hospital-Based Nursing Homes So Costly? Relative Importance of Acuity and Treatment Setting. Medical Care. 40(5): 40515.
Prospective Payment Assessment Commission (ProPAC). 1996. Report to Congress: Medicare and the American Health Care System.
Prospective Payment Assessment Commission, Washington, DC, June 1996.
Stearns, S., K. Dalton, and M. Holmes. 2006. Using Propensity Stratification to Compare Patient Outcomes in Hospital-Based versus Freestanding Skilled Nursing Facilities (under review).
8. Footnotes
APPENDIX A Number and Type of Providers, By State, 2006
| SNF | IRF Hospital Based | LTCH Hospital Based | HHA Hospital Based | |||||||||
| State | Acute Hospital | Hospital Based | Freestanding | Co-located | Hospital Based | Freestanding | Co-located | HwH | Freestanding | Hospital Based | Freestanding | Co-located |
| Total | 4,929 | 1,207 | 12,208 | 1,602 | 1,007 | 138 | 79 | 148 | 244 | 1,659 | 5,252 | 1,846 |
| Alabama | 104 | 17 | 193 | 18 | 10 | 6 | 1 | 1 | 5 | 52 | 80 | 13 |
| Alaska | 22 | 9 | 5 | 1 | 3 | - | - | - | - | 6 | 9 | 1 |
| Arizona | 81 | 5 | 102 | 28 | 18 | 4 | 3 | 2 | 5 | 14 | 56 | 12 |
| Arkansas | 79 | 15 | 177 | 18 | 21 | 4 | 3 | 3 | 3 | 58 | 106 | 10 |
| California | 359 | 145 | 814 | 247 | 74 | 6 | - | - | 14 | 85 | 365 | 212 |
| Colorado | 72 | 15 | 140 | 38 | 17 | 3 | - | 3 | 4 | 26 | 93 | 23 |
| Connecticut | 33 | 4 | 213 | 28 | 8 | 1 | - | - | 3 | 7 | 66 | 10 |
| Delaware | 5 | 3 | 34 | 1 | 3 | - | - | 1 | - | 2 | 8 | 6 |
| District of Columbia | 7 | 5 | 14 | - | 2 | - | 1 | - | 2 | 1 | 19 | 3 |
| Florida | 189 | 20 | 580 | 79 | 31 | 8 | 6 | - | 10 | 28 | 495 | 222 |
| Georgia | 145 | 51 | 271 | 33 | 30 | 1 | 1 | 4 | 11 | 30 | 59 | 10 |
| Hawaii | 23 | 18 | 20 | 4 | - | - | 1 | - | 2 | 6 | 7 | 1 |
| Idaho | 42 | 20 | 52 | 5 | 4 | 1 | - | - | 1 | 19 | 25 | 4 |
| Illinois | 185 | 60 | 585 | 54 | 45 | 3 | 1 | - | 6 | 71 | 253 | 103 |
| Indiana | 116 | 30 | 414 | 48 | 35 | 4 | 3 | 12 | 3 | 53 | 94 | 49 |
| Iowa | 124 | 27 | 358 | 28 | 14 | - | - | - | - | 72 | 85 | 24 |
| Kansas | 145 | 13 | 228 | 23 | 17 | 4 | 3 | 2 | 59 | 68 | 9 | |
| Kentucky | 97 | 34 | 238 | 21 | 11 | 5 | 1 | 6 | - | 34 | 60 | 10 |
| Louisiana | 134 | 23 | 218 | 51 | 32 | 12 | 12 | 11 | 33 | 27 | 158 | 39 |
| Maine | 40 | 9 | 98 | 6 | 4 | 1 | - | - | - | 6 | 22 | 1 |
| Maryland | 47 | 17 | 186 | 23 | - | 1 | 1 | - | 4 | 8 | 36 | 6 |
| Massachusetts | 70 | 21 | 372 | 50 | 6 | 5 | 3 | - | 17 | 15 | 93 | 13 |
| Michigan | 145 | 18 | 335 | 43 | 48 | 4 | 1 | 11 | 8 | 43 | 181 | 91 |
| Minnesota | 134 | 59 | 302 | 25 | 17 | 1 | - | - | 2 | 80 | 105 | 29 |
| Mississippi | 103 | 15 | 125 | 29 | 15 | - | - | 7 | 1 | 15 | 38 | 3 |
| Missouri | 114 | 26 | 428 | 28 | 35 | 1 | 2 | 3 | 4 | 57 | 101 | 9 |
| Montana | 62 | 33 | 54 | 9 | 5 | - | - | - | - | 25 | 11 | 1 |
| Nebraska | 87 | 9 | 178 | 5 | 6 | - | 1 | 2 | - | 44 | 18 | 8 |
| Nevada | 34 | 10 | 31 | 4 | 9 | 1 | 2 | 2 | 3 | 4 | 38 | 21 |
| New Hampshire | 26 | 4 | 65 | 5 | 4 | 1 | 1 | - | - | 4 | 28 | 4 |
| New Jersey | 76 | 15 | 309 | 37 | 9 | 4 | 5 | - | 7 | 15 | 30 | 5 |
| New Mexico | 42 | 4 | 56 | 7 | 4 | 3 | 2 | 1 | 1 | 14 | 48 | 6 |
| New York | 206 | 65 | 491 | 97 | 73 | - | 1 | - | 4 | 71 | 104 | 12 |
| North Carolina | 117 | 40 | 354 | 27 | 21 | 2 | - | 3 | 4 | 33 | 117 | 18 |
| North Dakota | 45 | 17 | 60 | 6 | 4 | - | - | 2 | - | 19 | 5 | 2 |
| Ohio | 171 | 47 | 801 | 96 | 56 | 1 | 2 | 14 | 8 | 73 | 268 | 105 |
| Oklahoma | 126 | 11 | 244 | 24 | 22 | 2 | - | 3 | 11 | 58 | 136 | 11 |
| Oregon | 57 | 4 | 112 | 5 | 9 | - | - | - | - | 41 | 16 | 4 |
| Pennsylvania | 170 | 60 | 587 | 58 | 66 | 13 | 3 | 13 | 9 | 61 | 209 | 44 |
| Rhode Island | 11 | 1 | 83 | 3 | 4 | 1 | - | - | 1 | 2 | 16 | 4 |
| South Carolina | 59 | 19 | 142 | 14 | 12 | 5 | - | 2 | 4 | 16 | 41 | 12 |
| South Dakota | 63 | 11 | 71 | 10 | 5 | - | - | 1 | - | 29 | 11 | 2 |
| Tennessee | 127 | 26 | 244 | 30 | 27 | 4 | 2 | 7 | 2 | 38 | 85 | 18 |
| Texas | 393 | 43 | 883 | 145 | 89 | 18 | 14 | 27 | 40 | 85 | 1072 | 596 |
| Utah | 41 | 11 | 65 | 9 | 8 | 1 | - | - | 2 | 9 | 42 | 12 |
| Vermont | 14 | 3 | 30 | 8 | 3 | - | - | - | - | 0 | 10 | 2 |
| Virginia | 90 | 20 | 221 | 16 | 18 | 3 | 3 | - | 3 | 45 | 112 | 21 |
| Washington | 90 | 13 | 197 | 24 | 21 | - | 1 | 1 | 1 | 27 | 27 | 6 |
| West Virginia | 57 | 26 | 91 | 4 | 2 | 4 | 1 | 1 | 1 | 28 | 29 | 5 |
| Wisconsin | 124 | 26 | 315 | 29 | 27 | - | 1 | 2 | 2 | 32 | 83 | 13 |
| Wyoming | 26 | 10 | 22 | 1 | 3 | - | - | - | 1 | 12 | 14 | 1 |
| Source: RTI Analysis of 2006 POS Data (mmor022, mmor080). | ||||||||||||
APPENDIX B Percentage change in beds per beneficiaries, 2000 2006
Percent change in LTCH beds per 100,000 beneficiaries 2000 2006
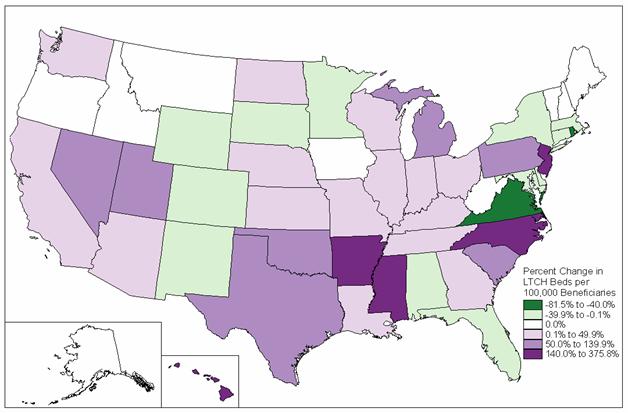 SOURCE: RTI Analysis of 2006 POS data.
Percent change in IRF beds per 100,000 beneficiaries 2000 2006
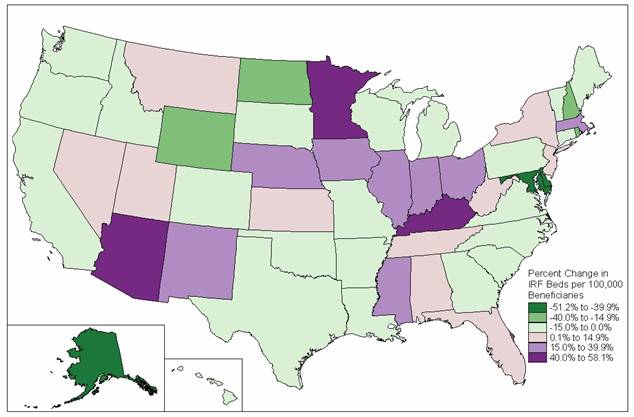 SOURCE: RTI Analysis of 2006 POS data.
Percent change in SNF beds per 100,000 beneficiaries 2000 2006
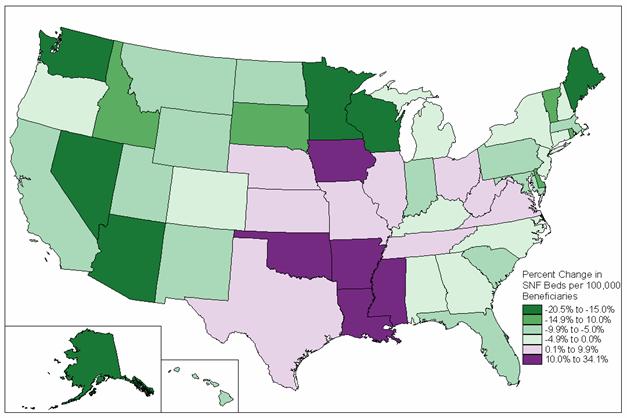 SOURCE: RTI Analysis of 2006 POS data.