
By: ASPE Staff
Abstract
This ASPE Issue Brief details estimates of federal child care assistance eligibility and receipt for 2009. About 18 percent of federally-eligible children received subsidized care through CCDF or related government funding streams in an average month in fiscal year 2009. This Issue Brief also explores estimates of child care assistance eligibility and receipt based on state-defined eligibility rules, as well as the age and poverty status of eligible children and those who receive assistance.
"I. Overview
This ASPE Issue Brief details estimates of federal child care assistance eligibility and receipt for 2009. In fiscal year 2009, federal and state spending totaled roughly $11 billion to support child care services to improve the affordability, and availability of child care for low-income working families through the Child Care and Development Fund (CCDF) and related government funding streams.1 Typically, CCDF funds are used to subsidize child care services through vouchers, although some States also provide services through grants or contracts. In 2009, States also spent over $1 billion on activities to improve the quality of child care.
Approximately 18 percent of federally-eligible children received subsidized care through CCDF or related government funding streams in an average month in fiscal year 2009 (see Table 1). We define federally-eligible children to include all children who are potentially eligible to receive subsidized care based on the federal eligibility parameters of CCDF. Federal statute permits states to provide child care subsidies to qualifying families with incomes below 85 percent of state median income. Within federal eligibility parameters, states have flexibility in setting more restrictive rules for income eligibility. This Issue Brief also explores estimates of child care assistance eligibility and receipt based on state-defined eligibility rules, as well as the age and poverty status of eligible children and those who receive assistance.
Table 1: Number of Children Potentially Eligible and Percent of Eligible Children Receiving Child Care Subsidies, Average Monthly, 2009
| Children Potentially Eligible for CCDF Under Federal Parameters | Children Receiving Subsidies | Percent of Potentially Eligible Children Receiving Subsidies | |
|---|---|---|---|
| All Children | 13,760,000 | 2,505,000 | 18% |
II. Child Care Estimates Based on Federal Eligibility Parameters
Eighteen percent of federally-eligible children received subsidized care through CCDF or related government funding streams in fiscal year 2009. This number is based on estimates of the number of children eligible for child care under federal eligibility parameters and the number of children receiving subsidized care.
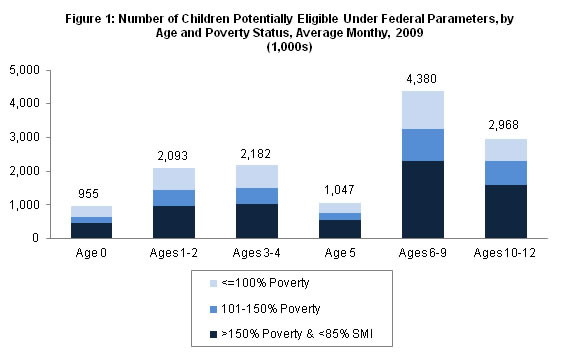
An estimated 13.76 million children were potentially eligible for child care assistance under the federal eligibility parameters of CCDF in an average month in 2009 (see Table 1).2 Federal eligibility parameters include:
- Children must be under age 13 (unless the child has special needs and is age 13-18);
- The income of the child’s family must be less than 85 percent of the state median income (SMI) for a family of the same size;3 and
- The child’s parents must be working or participating in education or training activities.4
Figure 1 shows a breakdown of federally-eligible children by age and poverty status.
An estimated 2.51 million children received child care services through CCDF or related government funding streams in an average month in fiscal year 2009 (see Table 1).5 While the majority of these children, 1.63 million, received assistance through CCDF, this estimate of receipt also includes roughly 878,000 children with subsidies funded directly through the Temporary Assistance for Needy Families (TANF) program or the Social Services Block Grant (SSBG), and state expenditures claimed as TANF maintenance of effort (MOE) funds.6
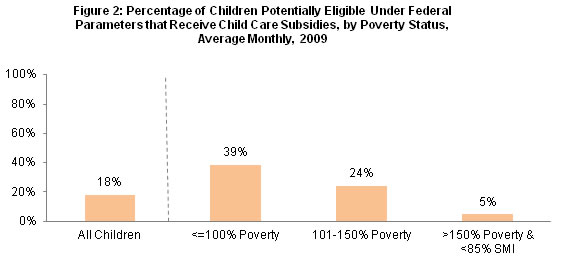
Some children were more likely to receive services than others. Eligible children from the lowest-income families were the most likely to receive child care assistance. Roughly 39 percent of federally-eligible children from families with incomes below 100 percent of poverty and 24 percent of those from families with incomes between 101 percent and 150 percent of poverty were served (see Figure 2).7 By comparison, 5 percent of federally-eligible children from families with incomes greater than 150 percent of poverty were served. In the case of families with one adult and two children, eligible children from families with incomes greater than 150 percent of poverty would include those from families with an income greater than roughly $25,900 (about $2,200 when measured monthly) but less than 85 percent of their state’s SMI.
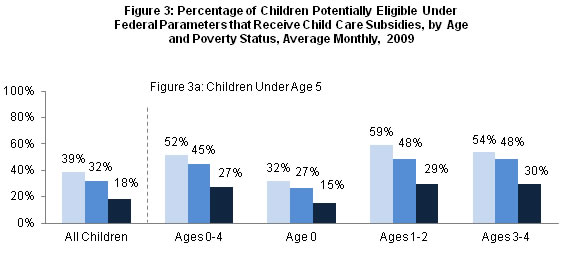
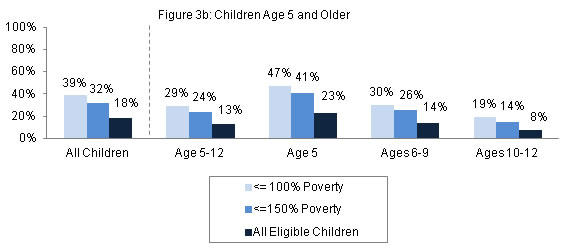
Figures 3a and 3b show that federally-eligible children between ages 0 and 4 were much more likely to receive subsidized care than eligible children older than age 5. In 2009, 27 percent of federally-eligible children ages 0 to 4 were served (including 15 percent of infants, 29 percent of children ages 1-2, and 30 percent of children ages 3-4). By comparison, 14 percent of federally-eligible children ages 6-9 and 8 percent of federally-eligible children ages 10-12 received subsidized care. Figures 3a and 3b also show differences in the proportion of federally-eligible children served by family income and age.
III. Child Care Estimates Based on State Eligibility Rules
Within the federal eligibility parameters of CCDF, states have flexibility in setting income eligibility guidelines, parental co-payment fees, reimbursement rates to child care providers, target populations receiving priority for services, the number of work or education/training hours required, and the length of certification periods.8 Based on state-defined eligibility rules for fiscal year 2009, the average initial income eligibility limits for three person families across the 50 states and the District of Columbia was $2,800.9 Some states allow counties and other localities to set income eligibility limits lower than the limit set by the state. Some states also allow higher income eligibility limits for families already receiving child care subsidies.
An estimated 13.76 million children were federally-eligible for child care assistance in an average month in 2009. Under state-defined eligibility rules, an estimated 8.86 million children were eligible for child care assistance in an average month in 2009 (see Figure 4).10
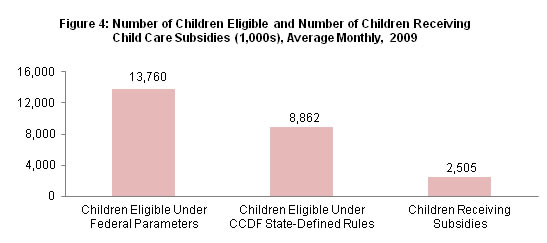
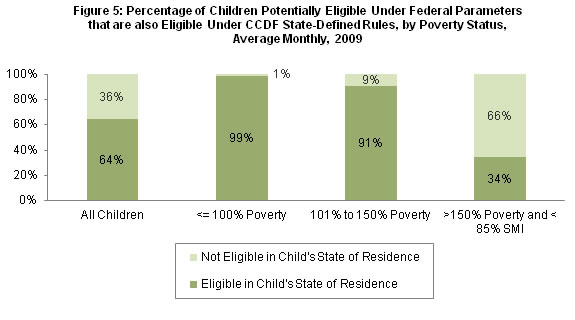
Figure 5 shows the extent to which children eligible for child care subsidies based on federal parameters were eligible under the rules defined by their state of residence. Almost 2 out of 3 (64 percent) of federally-eligible children were eligible for subsidies under state-defined rules. Almost all federally-eligible children from families with incomes less than 100 percent of poverty were eligible under state-defined eligibility rules. By comparison, about a third (34 percent) of federally-eligible children from families with incomes greater than 150 percent of poverty were eligible for services in their state. This Figure11 shows only the percentage of children eligible for subsidies based on federal parameters that also were eligible under state rules and does not indicate rates of participation.
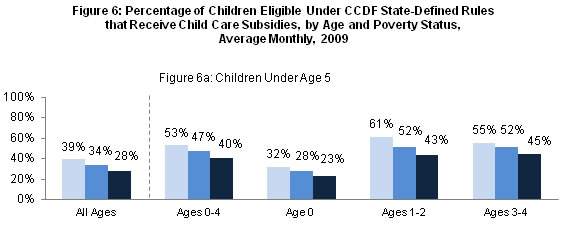
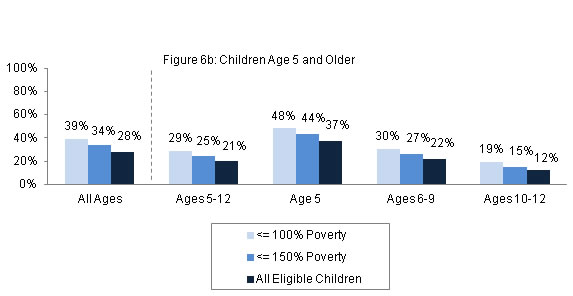
Approximately 28 percent of all children eligible under state-defined rules received subsidized care through CCDF or related government funding streams in fiscal year 2009 (see Figures 6a and 6b). As was the case when considering federally-eligible children, children eligible for assistance under state-defined rules who were between the ages of 1 and 4 (43 percent of children ages 1-2 and 45 percent of children ages 3-4) or from families with incomes below poverty (39 percent of all eligible children from families with incomes below 100 percent of poverty) were the most likely to be served.
IV. Conclusion
Based on federal parameters that determine permissible eligibility, an estimated 13.76 million children were potentially eligible to receive child care subsidies in 2009. Roughly 2.51 million children, or 18 percent of federally-eligible children, received subsidized care through CCDF or related government funding streams in an average month of fiscal year 2009, with rates of coverage varying by age and poverty status.
Appendix I. Recent Changes to the Estimates of Child Care Subsidy Eligibility and Receipt
Improvements over Previous Estimates
ASPE has produced estimates of eligibility for and receipt of subsidized care through CCDF and related government funding streams for several years. During this time ASPE has sought to make continuous improvements to the estimation model and methodology. These improvements allow the most precise estimate to be shown at the time of their release but they increase the difficulty in interpreting the estimates across years.12
Unmarried Cohabiting Parents
Several recent methodological improvements are particularly noteworthy.13 One improvement was implemented in 2006. As a result of improvements made to the Current Population Survey (CPS), the estimates since 2006 are able to include all unmarried parents living with their children when determining the eligible population. In previous estimates before 2006, only one of the unmarried parents could be considered in the eligibility determination process because of data limitations. Had the improvements made to the CPS been unavailable for the 2006 estimate, the number of children estimated to be federally-eligible for subsidies would have been 516,000 children14 higher (an increase of about 4 percent), and the percent served would have been 0.6 percentage points lower (16.6 percent instead of 17.2 percent).
Endings of Employment Spells
Another methodological improvement addressed the modeling problem that some children incorrectly appear to be eligible because their families’ incomes drop below the eligibility thresholds solely due to the fact that their parents are ending a period of employment. A new method was added in 2007 which excludes those children with parents that had earnings above the eligibility thresholds before and/or after the temporary period without employment. In these cases, the children are not considered eligible during the month of employment exit. This change reduced the number of children eligible.Noncitizen Children
Another set of methodological improvements were made starting with the 2009 estimates. One of these changes excluded children that were unlikely to be eligible based on citizenship status. In 2009 this affected about 484,000 children. Of these 484,000, about 154,000 would have otherwise been eligible for child care subsidies under federal parameters. While some noncitizen children are eligible to receive subsidies, undocumented children and children living with parents with temporary visas are generally not eligible to receive subsidies. Had these children been included in the FY 2009 estimates the percentage of federally-eligible children served would have been 17.6 percent instead of 18.2 percent with their exclusion. As defined by federal law, citizen children with noncitizen parents are eligible for federal child care subsidies as long as they meet other eligibility criteria.
Family Income
Another methodological improvement was made starting with the 2009 eligibility estimates that affected the number of children eligible under federal parameters. This change included the treatment of income of assistance-unit members other than the spouse, head, and eligible children. Before 2009 older siblings of the children were included in the family count but their incomes were not included. Starting in 2009, the estimates include the older children in the family count and their incomes are added to their parents when determining family income. For purposes of these estimates the definition of the assistance unit is based on the subfamily, as defined by the Census Bureau, and family members outside of the subfamily unit are not included in the benefit determination formulas.
Eligibility Under State Parameters
It should also be noted that about 237,000 children are defined as eligible in this Issue Brief under state parameters that are not considered eligible under the federal parameters used in this brief. This discrepancy occurs because states vary in their treatment of which family members are included when considering family size and family total incomes. For example, the earnings of an older sister residing in the household are included in calculations for determining eligibility under federal subsidies, but they are not included in the benefit eligibility formulas for particular states that have different eligibility parameters.
Details of State Rules
Another set of methodological improvements include the transition from using the eligibility rules submitted to HHS as part of each state’s biannual state plans to the CCDF Policies Database. The new CCDF Policies Database includes more detailed information on how states calculate eligibility. For example, the Policies Database provides more detailed information on how states treat extended family members when determining family size, family incomes, and minimum work requirements. They also provide more detailed information on how states treat specific forms of income such as child support, Supplemental Security Income (SSI), and Temporary Assistance for Needy Families (TANF).
Net Effects
Based on alternative simulations using FY 2008 data, the effect of excluding ineligible noncitizens and the addition of more detailed eligibility reported in the CCDF Policies Database increased the number of eligible children by 120,000 and 727,000 children under state and federal parameters respectively. The decrease in the percentage of children served was less than 1 percent under state eligible parameters and about 1 percent under federal parameters.
Trends in Eligibility and Receipt Using Alternative Definitions
Appendix Figure 1 displays the number of children who are federally-eligible for subsidies and the number of children receiving subsidies during the period 1999-2009.15 The number of children eligible under federal parameters in Appendix Figure 1 is calculated without excluding children that are unlikely to be eligible based on their citizenship status, and without including unmarried partners in the eligibility determination process. These exclusions were made to provide a series of consistent, although less precise, estimates to analyze changes in estimated eligibility over time. The trends shown in the graph should be interpreted with caution due to changes in estimation methods, measurement error, and demographic shifts affecting eligibility over time. Some of the methodological improvements described in this section have been applied retrospectively and the estimates may not match exactly the estimates shown in ASPE’s previous Issue Briefs.
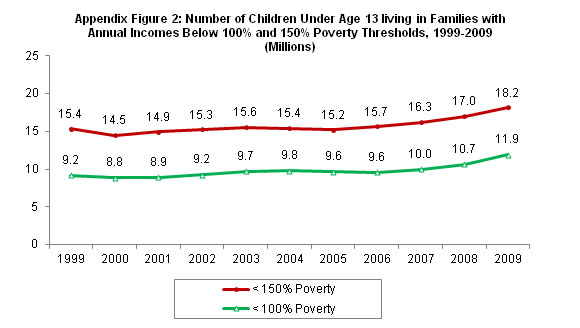
For reference, Appendix Figure 2 shows the total number of children, regardless of child care eligibility, estimated to have been living in households with incomes below 100 percent and 150 percent of poverty thresholds from 1999 to 2009.
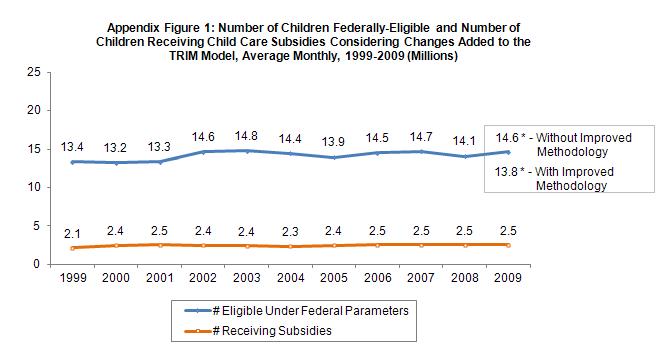
*Appendix Figure 1 was estimated without using an alternative methodology that excludes improvements made to the TRIM model for the 2006-2009 estimates. With the improvements, the estimate of the number of federally-eligible children in 2009 is 13.8 million (see Table 1 on page 1).
Source: ASPE tabulations from the Current Population Survey, ASEC
Appendix II. Child Care Eligibility and Receipt - Tables
Appendix Table 1: Number of Children Potentially Eligible for Child Care Subsidies under Federal Parameters, Average Monthly, Calendar Year 2009
| Age of Child | Parent is Student | Parent Employed 1-19 Hours | Parent Employed 20+ Hours | Family Income <=100% Poverty | Family Income 101-150% Poverty | Family Income >150% Poverty | All Eligible Children |
|---|---|---|---|---|---|---|---|
| ** Cells with estimated populations under 50,000 are not shown Totals may not sum due to rounding See Notes on Appendix II Tables Source: Current Population Survey, ASEC, analyzed with the TRIM3 Microsimulation Model | |||||||
| 0 | 133,850 | 66,210 | 755,280 | 314,240 | 182,210 | 458,880 | 955,330 |
| 1 | 112,270 | 108,930 | 797,890 | 298,850 | 244,710 | 475,530 | 1,019,090 |
| 2 | 113,610 | 106,420 | 854,260 | 339,630 | 244,750 | 489,920 | 1,074,290 |
| 3 | 123,640 | 70,380 | 923,300 | 335,300 | 243,050 | 538,970 | 1,117,320 |
| 4 | 117,210 | 78,510 | 868,470 | 341,960 | 236,220 | 486,010 | 1,064,190 |
| 5 | 88,370 | 90,720 | 868,000 | 288,400 | 216,180 | 542,520 | 1,047,090 |
| 6-9 | 297,300 | 322,770 | 3,759,530 | 1,142,740 | 944,660 | 2,292,200 | 4,379,600 |
| 10-12 | 181,000 | 229,550 | 2,557,190 | 679,300 | 694,630 | 1,593,820 | 2,967,740 |
| 13+ | ** | ** | 103,680 | ** | ** | 67,100 | 135,120 |
| All | 1,181,810 | 1,090,370 | 11,487,600 | 3,765,180 | 3,049,670 | 6,944,930 | 13,759,780 |
Appendix Table 2: Number of Children Eligible for Child Care Subsidies under CCDF State-Defined Rules, Average Monthly, Calendar Year 2009
| Age of Child | Parent is Student | Parent Employed 1-19 Hours | Parent Employed 20+ Hours | Family Income <=100% Poverty | Family Income 101-150% Poverty | Family Income >150% Poverty | All Eligible Children |
|---|---|---|---|---|---|---|---|
| ** Cells with estimated populations under 50,000 are not shown Totals may not sum due to rounding See Notes on Appendix II Tables Source: Current Population Survey, ASEC, analyzed with the TRIM3 Microsimulation Model | |||||||
| 0 | 117,040 | ** | 480,950 | 312,000 | 165,320 | 154,190 | 631,510 |
| 1 | 98,540 | ** | 549,880 | 287,760 | 220,710 | 178,360 | 686,830 |
| 2 | 100,310 | ** | 586,740 | 328,740 | 219,930 | 184,460 | 733,130 |
| 3 | 112,010 | ** | 603,150 | 326,950 | 214,560 | 192,480 | 733,990 |
| 4 | 104,170 | ** | 591,360 | 330,820 | 214,380 | 175,560 | 720,760 |
| 5 | 71,000 | ** | 547,050 | 281,300 | 196,710 | 174,300 | 652,320 |
| 6-9 | 254,330 | 112,000 | 2,428,580 | 1,140,600 | 867,260 | 787,050 | 2,794,910 |
| 10-12 | 140,680 | 86,170 | 1,590,910 | 675,500 | 634,830 | 507,430 | 1,817,760 |
| 13+ | ** | ** | 66,820 | ** | ** | ** | 91,010 |
| All | 1,011,500 | 405,280 | 7,445,440 | 3,710,220 | 2,764,640 | 2,387,370 | 8,862,220 |
Appendix Table 3: Estimated Number of Children Receiving Child Care Subsidies through CCDF, SSBG, and TANF-Direct, Average Monthly, Fiscal Year 2009
| Age of Child | <= 100% Poverty | 101-150% Poverty | >150% Poverty | Total |
|---|---|---|---|---|
| Totals may not sum due to rounding See Notes on Appendix II Tables Source: Form-801 CCDF Administrative Records, U.S. Department of Health and Human Services, Administration for Children and Families | ||||
| 0 | 99,520 | 34,080 | 12,930 | 146,540 |
| 1 | 179,180 | 74,480 | 29,980 | 283,650 |
| 2 | 199,090 | 93,140 | 40,010 | 332,240 |
| 3 | 189,740 | 101,090 | 46,140 | 336,960 |
| 4 | 173,480 | 95,570 | 44,770 | 313,820 |
| 5 | 135,820 | 72,280 | 34,470 | 242,580 |
| 6-9 | 345,800 | 187,310 | 82,800 | 615,910 |
| 10-12 | 130,520 | 68,190 | 28,360 | 227,070 |
| 13+ | 3,810 | 1,930 | 670 | 6,420 |
| All | 1,456,970 | 728,070 | 320,140 | 2,505,180 |
Appendix Table 4: Number of Children Potentially Eligible for Child Care Subsidies by State, Two Year Average Monthly Estimates, Calendar Year 2008-2009
| State | Children Potentially Eligible Under Federal Parameters (Family Incomes < 85% SMI) Estimate | 95% Confidence Interval, 2-Year Average (Low-High) | Children Eligible Under State-Defined Rules Estimate | Estimate95% Confidence Interval, 2-Year Average (Low-High) | ||
|---|---|---|---|---|---|---|
| See Notes on Appendix II Tables Source: Current Population Survey, ASEC, analyzed with the TRIM3 Microsimulation Model | ||||||
| Alabama | 210,490 | 172,260 | 248,720 | 118,500 | 89,800 | 147,190 |
| Alaska | 28,320 | 22,510 | 34,130 | 23,640 | 18,340 | 28,950 |
| Arizona | 247,290 | 202,470 | 292,110 | 168,280 | 131,290 | 205,260 |
| Arkansas | 124,580 | 100,910 | 148,260 | 74,500 | 56,180 | 92,810 |
| California | 1,609,490 | 1,494,390 | 1,724,580 | 1,410,420 | 1,302,620 | 1,518,210 |
| Colorado | 209,360 | 168,640 | 250,080 | 162,720 | 126,790 | 198,650 |
| Connecticut | 155,050 | 124,990 | 185,100 | 102,200 | 77,800 | 126,600 |
| Delaware | 45,050 | 36,950 | 53,140 | 29,540 | 22,980 | 36,100 |
| DC | 20,250 | 15,340 | 25,150 | 22,570 | 17,380 | 27,750 |
| Florida | 761,420 | 686,370 | 836,470 | 390,360 | 336,630 | 444,080 |
| Georgia | 519,150 | 458,280 | 580,030 | 262,300 | 219,010 | 305,590 |
| Hawaii | 72,390 | 60,600 | 84,180 | 59,680 | 48,970 | 70,380 |
| Idaho | 63,910 | 51,570 | 76,250 | 30,310 | 21,810 | 38,810 |
| Illinois | 576,060 | 510,470 | 641,640 | 407,620 | 352,450 | 462,790 |
| Indiana | 337,770 | 288,660 | 386,870 | 151,150 | 118,290 | 184,010 |
| Iowa | 149,350 | 121,760 | 176,940 | 59,530 | 42,110 | 76,950 |
| Kansas | 156,260 | 128,790 | 183,740 | 110,180 | 87,110 | 133,250 |
| Kentucky | 160,160 | 126,790 | 193,520 | 95,820 | 70,020 | 121,630 |
| Louisiana | 243,790 | 202,640 | 284,940 | 205,420 | 167,650 | 243,190 |
| Maine | 39,560 | 29,450 | 49,660 | 43,400 | 32,810 | 53,980 |
| Maryland | 273,280 | 228,080 | 318,480 | 117,220 | 87,640 | 146,800 |
| Massachusetts | 247,020 | 205,400 | 288,640 | 133,590 | 102,990 | 164,190 |
| Michigan | 434,970 | 379,010 | 490,920 | 187,010 | 150,320 | 223,700 |
| Minnesota | 276,030 | 231,830 | 320,230 | 111,660 | 83,530 | 139,780 |
| Mississippi | 158,850 | 131,530 | 186,170 | 137,410 | 112,000 | 162,820 |
| Missouri | 274,260 | 229,380 | 319,130 | 111,510 | 82,920 | 140,090 |
| Montana | 36,800 | 29,160 | 44,440 | 19,480 | 13,940 | 25,020 |
| Nebraska | 102,590 | 84,920 | 120,270 | 35,900 | 25,470 | 46,330 |
| Nevada | 101,550 | 80,440 | 122,660 | 101,930 | 80,740 | 123,130 |
| New Hampshire | 47,940 | 37,560 | 58,330 | 34,550 | 25,730 | 43,360 |
| New Jersey | 393,980 | 339,960 | 448,000 | 178,600 | 142,220 | 214,980 |
| New Mexico | 91,490 | 72,750 | 110,230 | 101,650 | 81,900 | 121,400 |
| New York | 792,050 | 713,820 | 870,280 | 523,060 | 459,460 | 586,660 |
| North Carolina | 398,450 | 344,370 | 452,520 | 351,970 | 301,150 | 402,790 |
| North Dakota | 28,510 | 23,010 | 34,000 | 15,950 | 11,840 | 20,050 |
| Ohio | 500,560 | 440,500 | 560,620 | 257,000 | 213,950 | 300,050 |
| Oklahoma | 151,810 | 121,580 | 182,040 | 137,340 | 108,580 | 166,090 |
| Oregon | 153,590 | 121,550 | 185,630 | 104,730 | 78,280 | 131,190 |
| Pennsylvania | 464,380 | 406,540 | 522,220 | 295,310 | 249,160 | 341,450 |
| Rhode Island | 45,240 | 35,760 | 54,720 | 21,100 | 14,630 | 27,570 |
| South Carolina | 184,730 | 148,740 | 220,720 | 105,110 | 77,960 | 132,270 |
| South Dakota | 44,430 | 37,360 | 51,490 | 35,190 | 28,900 | 41,480 |
| Tennessee | 285,210 | 240,070 | 330,340 | 183,440 | 147,290 | 219,580 |
| Texas | 1,246,520 | 1,143,960 | 1,349,080 | 1,069,920 | 974,860 | 1,164,970 |
| Utah | 119,800 | 99,160 | 140,430 | 66,280 | 50,910 | 81,650 |
| Vermont | 26,280 | 20,680 | 31,870 | 17,490 | 12,920 | 22,050 |
| Virginia | 343,830 | 294,270 | 393,390 | 168,890 | 134,140 | 203,630 |
| Washington | 280,070 | 233,920 | 326,230 | 199,450 | 160,500 | 238,400 |
| West Virginia | 41,820 | 31,430 | 52,210 | 27,290 | 18,900 | 35,680 |
| Wisconsin | 248,840 | 206,280 | 291,390 | 154,340 | 120,820 | 187,860 |
| Wyoming | 23,150 | 18,370 | 27,930 | 25,950 | 20,870 | 31,020 |
Appendix Table 5: Number of Children Potentially Eligible for Child Care Subsidies under Federal Parameters Living in Families with Incomes Under 100% and 150% Poverty by State, Two Year Average Monthly Estimates, Calendar Year 2008-2009
| State | Children Potentially Eligible Under 100% Poverty Estimate | Children Potentially Eligible Under 100% Poverty 95% Confidence Interval, 2-Year Average (Low-High) | Children Potentially Eligible Under 150% Poverty Estimate | Children Potentially Eligible Under 150%95% Confidence Interval, 2-Year Average (Low-High) | ||
|---|---|---|---|---|---|---|
| See Notes on Appendix II Tables Source: Current Population Survey, ASEC, analyzed with the TRIM3 Microsimulation Model | ||||||
| Alabama | 81,980 | 58,110 | 105,860 | 143,280 | 111,720 | 174,830 |
| Alaska | 4,910 | 2,490 | 7,330 | 12,010 | 8,240 | 15,780 |
| Arizona | 73,500 | 49,050 | 97,950 | 144,000 | 109,800 | 178,200 |
| Arkansas | 45,210 | 30,950 | 59,480 | 81,990 | 62,780 | 101,210 |
| California | 373,100 | 317,570 | 428,630 | 742,830 | 664,520 | 821,140 |
| Colorado | 50,110 | 30,200 | 70,020 | 94,280 | 66,960 | 121,610 |
| Connecticut | 21,390 | 10,280 | 32,500 | 50,770 | 33,570 | 67,960 |
| Delaware | 10,330 | 6,460 | 14,200 | 18,340 | 13,170 | 23,500 |
| DC | 8,870 | 5,630 | 12,110 | 13,000 | 9,060 | 16,930 |
| Florida | 208,340 | 169,070 | 247,600 | 395,420 | 341,320 | 449,520 |
| Georgia | 195,670 | 158,270 | 233,060 | 301,570 | 255,160 | 347,980 |
| Hawaii | 11,960 | 7,170 | 16,750 | 28,800 | 21,360 | 36,230 |
| Idaho | 16,950 | 10,590 | 23,310 | 37,800 | 28,310 | 47,290 |
| Illinois | 132,340 | 100,880 | 163,800 | 268,840 | 224,010 | 313,680 |
| Indiana | 107,520 | 79,800 | 135,240 | 178,750 | 143,010 | 214,490 |
| Iowa | 38,770 | 24,740 | 52,810 | 72,480 | 53,260 | 91,700 |
| Kansas | 40,480 | 26,530 | 54,440 | 78,040 | 58,630 | 97,450 |
| Kentucky | 58,450 | 38,290 | 78,610 | 94,450 | 68,820 | 120,070 |
| Louisiana | 108,550 | 81,130 | 135,970 | 165,310 | 131,450 | 199,160 |
| Maine | 9,830 | 4,790 | 14,860 | 18,040 | 11,220 | 24,870 |
| Maryland | 47,600 | 28,800 | 66,400 | 92,440 | 66,160 | 118,720 |
| Massachusetts | 43,830 | 26,290 | 61,370 | 83,690 | 59,460 | 107,920 |
| Michigan | 133,240 | 102,260 | 164,220 | 214,160 | 174,910 | 253,410 |
| Minnesota | 64,230 | 42,900 | 85,560 | 101,820 | 74,960 | 128,670 |
| Mississippi | 70,520 | 52,310 | 88,720 | 127,720 | 103,230 | 152,200 |
| Missouri | 89,090 | 63,540 | 114,630 | 139,420 | 107,430 | 171,410 |
| Montana | 11,050 | 6,860 | 15,230 | 21,150 | 15,360 | 26,930 |
| Nebraska | 23,910 | 15,420 | 32,400 | 48,290 | 36,170 | 60,400 |
| Nevada | 25,280 | 14,720 | 35,840 | 48,600 | 33,990 | 63,210 |
| New Hampshire | 8,900 | 4,430 | 13,370 | 15,710 | 9,770 | 21,660 |
| New Jersey | 62,460 | 40,950 | 83,970 | 131,430 | 100,210 | 162,640 |
| New Mexico | 41,750 | 29,090 | 54,400 | 71,700 | 55,110 | 88,290 |
| New York | 224,770 | 183,090 | 266,450 | 382,690 | 328,280 | 437,100 |
| North Carolina | 132,470 | 101,270 | 163,670 | 227,790 | 186,900 | 268,670 |
| North Dakota | 8,230 | 5,280 | 11,170 | 14,550 | 10,630 | 18,470 |
| Ohio | 135,730 | 104,440 | 167,020 | 247,050 | 204,840 | 289,260 |
| Oklahoma | 54,590 | 36,500 | 72,690 | 97,140 | 72,950 | 121,320 |
| Oregon | 37,670 | 21,800 | 53,530 | 76,950 | 54,270 | 99,630 |
| Pennsylvania | 108,080 | 80,160 | 136,000 | 191,240 | 154,100 | 228,380 |
| Rhode Island | 9,770 | 5,370 | 14,170 | 18,490 | 12,440 | 24,540 |
| South Carolina | 57,670 | 37,560 | 77,780 | 102,940 | 76,060 | 129,810 |
| South Dakota | 12,590 | 8,830 | 16,350 | 23,370 | 18,240 | 28,500 |
| Tennessee | 107,550 | 79,880 | 135,220 | 193,170 | 156,060 | 230,280 |
| Texas | 436,350 | 375,600 | 497,100 | 770,180 | 689,490 | 850,860 |
| Utah | 29,810 | 19,490 | 40,140 | 53,170 | 39,410 | 66,930 |
| Vermont | 4,610 | 2,280 | 6,940 | 10,160 | 6,690 | 13,640 |
| Virginia | 64,100 | 42,690 | 85,510 | 131,790 | 101,100 | 162,470 |
| Washington | 60,810 | 39,450 | 82,170 | 112,350 | 83,100 | 141,590 |
| West Virginia | 16,300 | 9,810 | 22,780 | 25,910 | 17,740 | 34,090 |
| Wisconsin | 48,300 | 29,570 | 67,030 | 104,750 | 77,150 | 132,360 |
| Wyoming | 3,320 | 1,510 | 5,130 | 7,870 | 5,080 | 10,670 |
Notes on Appendix II Tables
Poverty Status
In Appendix Tables 1, 2, 3, and 5, poverty status is based on 2009 poverty thresholds published by the U.S. Census Bureau, Housing and Household Economic Statistics Division. Since state-submitted Form-801 CCDF monthly child care data reports show recipients’ monthly income, the Census Bureau threshold is divided by twelve to create a comparable monthly threshold. Due to the source and limitations of data, the family income used to estimate poverty status of children who receive subsidies is calculated differently than for children who are eligible for subsidies. Recipient poverty status is based on family income used to determine child care subsidy eligibility, as reported by the state on Form-801 CCDF monthly child care data report for fiscal year 2009. Family income is reported after any relevant income disregards have been applied. Poverty status of eligible children is determined based on full family income reported to the Current Population Survey for calendar year 2009 prior to application of any relevant income disregard.
Parent is Employed or Student Status
In Appendix Tables 1 and 2, “parent is student” status indicates that an eligible recipient lives in a household with a parent who is not employed because he or she is in school. Eligible recipients living with an employed parent who is also in school would not be included in the “parent is student” category. In the case of multiple parent households, children are categorized by the parent with the least amount of employment hours. For example, if an eligible child has one parent working 40 hours per week and another parent working 18 hours per week, the child will be categorized as “parent employed 1-19 hours.” Eligible recipients living with a parent who is employed and a parent who is not employed because he or she is in school would be included in the “parent is student” category.
State by State Estimates of Eligibility
In Appendix Table 4, the estimate of potentially eligible children under federal parameters does not consider state-allowable income disregards when determining whether a child’s family income is below 85 percent of SMI. In some states, income disregards could lead to a higher estimate of children eligible under state-defined rules than under federal parameters. In Appendix Table 5, some children from families below 150 percent of poverty are ineligible for subsidies because their family income exceeds 85 percent of SMI. In Appendix Tables 4 and 5, the two-year average monthly estimates for calendar years 2008 and 2009 use the state median incomes published in the Federal Register: March 28, 2007 (Volume 72, Number 59) and March 5, 2008 (Volume 73, Number 44). The two-year averages estimated with the state-defined rules use the rules in place for October 2009. The incomes from the 2008 data were indexed for inflation to 2009 dollars using the CPI-U.
Endnotes
1 The estimated $11 billion spent through CCDF and related government funding streams in fiscal year 2009 includes estimated expenditures on direct child care services of $7.2 billion in federal CCDF funds (including the Child Care and Development Block Grant and supplemental funds appropriated through the American Recovery and Reinvestment Act , the Child Care Entitlement to States, state matching and maintenance of effort (MOE) funds for CCDF, and transfers from the Temporary Assistance for Needy Families Block Grant (TANF) to CCDF). Additional expenditures include $1.8 billion in TANF funding spent directly on child care services, $1.6 billion in “excess TANF MOE” (state child care expenditures claimed as TANF MOE to the extent such amounts are above the amounts already claimed as CCDF MOE), and $0.4 billion in Social Services Block Grant expenditures related to child care.
2 The 2009 estimates of eligibility were produced using the Transfer Income Model (TRIM), a micro-simulation model maintained by the Urban Institute under contract with ASPE. TRIM converts annual data from the Current Population Survey (CPS) into monthly data, compares these monthly data on family income and work status to CCDF rules, and generates monthly estimates of children and families eligible for CCDF child care subsidies. Monthly estimates are averaged to produce an average monthly estimate for the year. The 2009 estimate of eligibility relies upon data from the CPS for calendar year 2009, federally-permitted eligibility rules under CCDF, and state-defined eligibility rules reported in ACF’s CCDF Policies Database as of October 1, 2009.
3 States are given broad flexibility in deciding what is countable family income for purposes of determining a child’s eligibility. For example, states could disregard TANF payments in income eligibility determinations. As a result, some states may serve children in families with unadjusted incomes greater than 85 percent of the state median income, as defined in this Issue Brief. In FY 2009, the mean value of the federal maximums (i.e., 85% SMI) for three person families was about $4,130 per month (about $50,000 annually). However, the average initial eligibility limit before applying disregards for the states was about $2,830 monthly ($34,000 annually) as of October 2009. State SMI is based on estimates published for fiscal year 2009 in the Federal Register: March 5, 2008 (Volume 73, Number 44).
4 For this eligibility estimate “working” includes all work of one hour or more in a month. The majority (83 percent) of federally-eligible children come from families where the parent or parents were employed an average of at least 20 hours per week. An estimated 8 percent of federally-eligible children did not live with a parent who was employed an average of at least 20 hours per week. An estimated 9 percent of federally-eligible children lived with a parent that was not working but was in school.
5 This estimate of receipt excludes about 10,400 children served in U.S. territories as well as children receiving services from only Head Start, state pre-kindergarten programs, or other early childhood programs without funding from CCDF or related government funding streams.
6 CCDF-funded children include children funded through federal CCDF funds, state CCDF funds, and transfers of TANF funds to the CCDF program. While some states include children other than CCDF-funded children in their child care data reports (generally because they combine funds from several funding streams into one child care program), these states also report the percentage of pooled funding coming from CCDF, and this percentage is used to estimate the CCDF-funded children. The estimate assumes that children funded by TANF, TANF MOE, and SSBG have the same subsidy costs per child as CCDF-funded children, about $355 per month based on state-reported ACF-801 administrative data, and the same age and poverty distribution as CCDF-funded children.
7 Poverty figures are based on 2009 poverty thresholds published by the U.S. Census Bureau, Housing and Household Economic Statistics Division. The Census Bureau threshold is divided by twelve to create a monthly, rather than yearly, threshold. For purposes of determining recipients’ poverty status for this estimate, recipient income is measured after any applicable state-determined income disregards are applied. This estimation process likely overestimates to a small degree the number and percent of children from families below 100 percent of poverty who are served.
8 Based on data from ACF’s CCDF Policies Database as of October 1, 2009, recipient eligibility was redetermined every twelve months in 22 states and every six months in 29 states.
9 The range of income eligibility limits is based on data as of October 1, 2009. In some states eligibility limits differ for certain groups, such as TANF and SSI recipients. Expressed in terms of state median income, state limits for initial income eligibility in CCDF plans for fiscal year 2009 ranged from 38 percent to 86 percent of SMI. This estimate of state median income for fiscal year 2009 is based on the U.S. Census Bureau calculations published in the Federal Register: March 5, 2008 (Volume 73, Number 44). While the law restricts eligibility to children from families below 85 percent of SMI, states are able to determine the method used to calculate state median income which may differ from the method used in this Issue Brief.
10 Some of ASPE’s previous eligibility estimates excluded children age 4 and older that lived with at least one parent working between 1 and 19 hours per week. The estimates shown in this Issue Brief include this population when it is otherwise eligible. Had the previous methodology been used, the estimated number of children eligible under state-defined rules would have been about 3 percent lower (8,593,800 instead of 8,862,200) and the percentage of children served who were eligible under CCDF state rules would have been about 1 percentage point higher (29 percent instead of 28 percent). This change in methodology was made to provide greater internal consistency with the numerator of the calculation, which includes all children receiving subsidies, including school-aged children living with parents working less than 20 hours per week. This change does not impact the estimated number of children potentially eligible under federal parameters.
11 These numbers overstate to a small degree the percentages of children that are eligible under federal parameters that are also eligible under state-defined rules because some states define the eligibility units differently than what is used to define the eligibility units under federal parameters in this Issue Brief. This issue is discussed further in Appendix I.
12 For additional information on previous changes in the estimation of eligibility and receipt through 2006 see Child Care Eligibility and Enrollment Estimates for Fiscal Year 2005 (http://aspe.hhs.gov/hsp/08/cc-eligibility/ib.pdf), and Estimates of Child Care Eligibility and Receipt for Fiscal Year 2006. http://aspe.hhs.gov/hsp/10/cc-eligibility/ib.shtml.
13 Other methodological changes not described in the above text include: changes to the estimation of monthly earnings based on the number of days in each month and the reported hours worked per week; imputations to underreporting of child support payments for children also receiving TANF cash benefits; and the treatment of children receiving Supplemental Security Income.
14 The 516,000 estimate was calculated using the TRIM methodologies in place when the 2006 estimates were released. The modeling improvements implemented after 2006 were not used to calculate this number.
15 Where possible, improvements in the methodology and model for child care estimation have been applied to estimates of child care eligibility and receipt in previous years. For this reason, prior year estimates shown in Appendix Figure 1 will not match estimates published in previous Issue Briefs.