
U.S. Department of Health and Human Services
Cost of Care for Medicaid-Enrolled Children with Selected Disabilities
Henry T. Ireys, Gerard Anderson, Carol Han and John Neff
Johns Hopkins University
May 22, 1996
PDF Version (18 PDF pages)
This report was prepared under a grant between HHS's ASPE/DALTCP and Johns Hopkins University. For additional information about this subject, you can visit the DALTCP home page at http://aspe.hhs.gov/_/office_specific/daltcp.cfm or contact the office at HHS/ASPE/DALTCP, Room 424E, H.H. Humphrey Building, 200 Independence Avenue, S.W., Washington, D.C. 20201. The e-mail address is: webmaster.DALTCP@hhs.gov. The Project Officer was Kathleen Bond.
The opinions and views expressed in this report are those of the authors. They do not necessarily reflect the views of the Department of Health and Human Services, the contractor or any other funding organization.
TABLE OF CONTENTS
- METHODS
- Tracer Conditions
- Sample Description
- Costs Estimation Procedures
- RESULTS
- Total and Mean Costs
- Expenditure by Service Category
- LIST OF FIGURES AND TABLES
- FIGURE 1: Washington State Medicaid Data -- FY93
- TABLE 1: Selected Conditions
- TABLE 2: Sample Profile
- TABLE 3: Mean Costs and Total Expenditures
- TABLE 4: Expenditure Breakdown by Provider Category of Service
INTRODUCTION
Approximately 15% of children enrolled in Medicaid (2.5 million children) chronic health condition (Newacheck et al., 1994; Newacheck et al., 1995). Although these children represent the high-cost segment of the childhood population (Newacheck, Hughes, McManus, et al., 1994; Regenstein & Meyer, 1994), information regarding variation in cost and expenditure patterns among different diagnostic groupings is sharply limited. For example, a recent study of Medicaid-enrolled children with asthma suggests that costs are somewhat elevated for this population (Lozano et al., 1995), but no direct comparisons were made between this group and children with other chronic health problems. In the mid-1980s, per capita annual health care expenditures in a national sample of youth with severe mental retardation were found to range from less than $100 to $43,000 (Birenbaum et al., 1990); these data are now over a decade old and may have little relevance to children with medical conditions that fluctuate in symptom expression. Variation in life-span costs have been examined for selected conditions (Waitzman et al, 1994), but these estimates shed little light on yearly costs. Overall, better estimates of costs are needed to assist in developing policy options as states consider enrolling these children into managed care systems (McManus et al., 1996).
A major challenge in estimating costs of care for this population involves understanding the variation in costs between and within diagnostic categories. In any given year, for example, services for children with asthma are likely to cost on average much less than children with leukemia because of the clinical treatment protocols associated with the two conditions. In the same year, however, some children with asthma will require many inpatient and outpatient services, with correspondingly high costs; some children who have been treated for leukemia in previous years may still carry the diagnosis but require relatively few follow-up services. Variation is likely to be substantial both between and within diagnostic categories. Few data are currently available that can be used to compare annual cost and expenditure patterns for children with diverse chronic health conditions, or to compare these children with children who have no chronic conditions.
Knowledge of variation in cost and expenditures for children with chronic illnesses and disabilities is necessary for purposes of program planning. Clinicians, administrators of managed care organizations, and the leadership of advocacy organizations require this information to assure that resources are allocated in a reasoned manner so that this population of children has access to and receives needed services of high quality.
The purpose of this study is to estimate and compare costs of care for children with 11 selected chronic conditions, to compare these costs with costs of care for children without any of these conditions, and to identify whether selected demographic variables are associated with cost variation. We focus on Medicaid-enrolled children with chronic conditions because this population presents particular challenges to states as they consider implementing managed care programs for the Medicaid population and because a disproportionate number of children in Medicaid have chronic health conditions.
METHODS
Tracer Conditions
Children with selected tracer conditions were used for this study because there is little consensus in the field regarding the definition of children with disabilities or chronic conditions and because this methodology permits investigation of the variation among the selected conditions. The specific conditions were selected using a broad set of criteria, including comparatively high incidence rates within a Medicaid sample and the likelihood of high costs of care. In addition, we wanted to include in the list conditions that would illustrate a wide range of care patterns involving medical, surgical, and developmental services to varying degrees. The conditions used in this study and the specific associated ICD-9 codes are listed in Table 1.
Sample Description
For the purposes of this study, we identified children aged 0 through 18 who were enrolled in the Washington State Medicaid program at any time in fiscal year 1993. A child was included if a selected diagnosis was listed in any of the five spaces on the record set aside for diagnoses during any encounter within the given fiscal year. This approach will lead to conservative cost estimates because it will include children for whom this condition was listed as a "rule-out" condition but who do not actually have the condition. Partly as a result of this inclusion rule, sample prevalence rates for children with the selected conditions are generally higher than national prevalence estimates (cf. Gortmaker and Sappenfield, 1984).
Costs Estimation Procedures
Services rendered to children in the Washington State Medicaid program in 1992 and 1993 were reimbursed on a fee-for-service basis according to standard Medicaid payment rates. Therefore, it is assumed that the Medicaid program paid providers the charges that were submitted (i.e., claims). To calculate total costs per enrolled child, all claims made for the child were summed. However, claims do not include DRG charges made by hospitals. Therefore, an adjustment to total costs was made to account for DRG charges. When a DRG code was present on a claim, the total charge allowed by the Medicaid program for that service was included as the DRG charge in the calculation of total costs for the child.
Expenditures were grouped by services using standard Medicaid categories. For the purposes of this report, six categories were examined: inpatient costs (excluding psychiatric hospitalizations and stays in residential treatment facilities), physicians costs (excluding costs for physician services rendered in hospital, which are included in the inpatient category), private nursing services (i.e., home health care services), outpatient services other than physician encounters (including emergency room visits), medications, and other services. Other services include physical therapy, audiology, hospice, orthopedic devices, and other services. Breakdowns for this category are not reported here because many cell sizes become quite small for individual diagnoses, and as a result cost estimates may be unreliable.
RESULTS
As Table 2 illustrates, of the 308,752 children enrolled in 1993, about 23,500 children (7.6%) had at least one of the 11 selected chronic conditions. If a child had more than one condition, she or he was counted once. The sample included 1,157 children who had two of the selected conditions, and 103 children with three or more. Children with asthma are the single largest subgroup within the sample. Age, gender, and racial distributions across diagnoses generally reflect the expected patterns associated with clinical manifestations of each diagnosis.
Total and Mean Costs
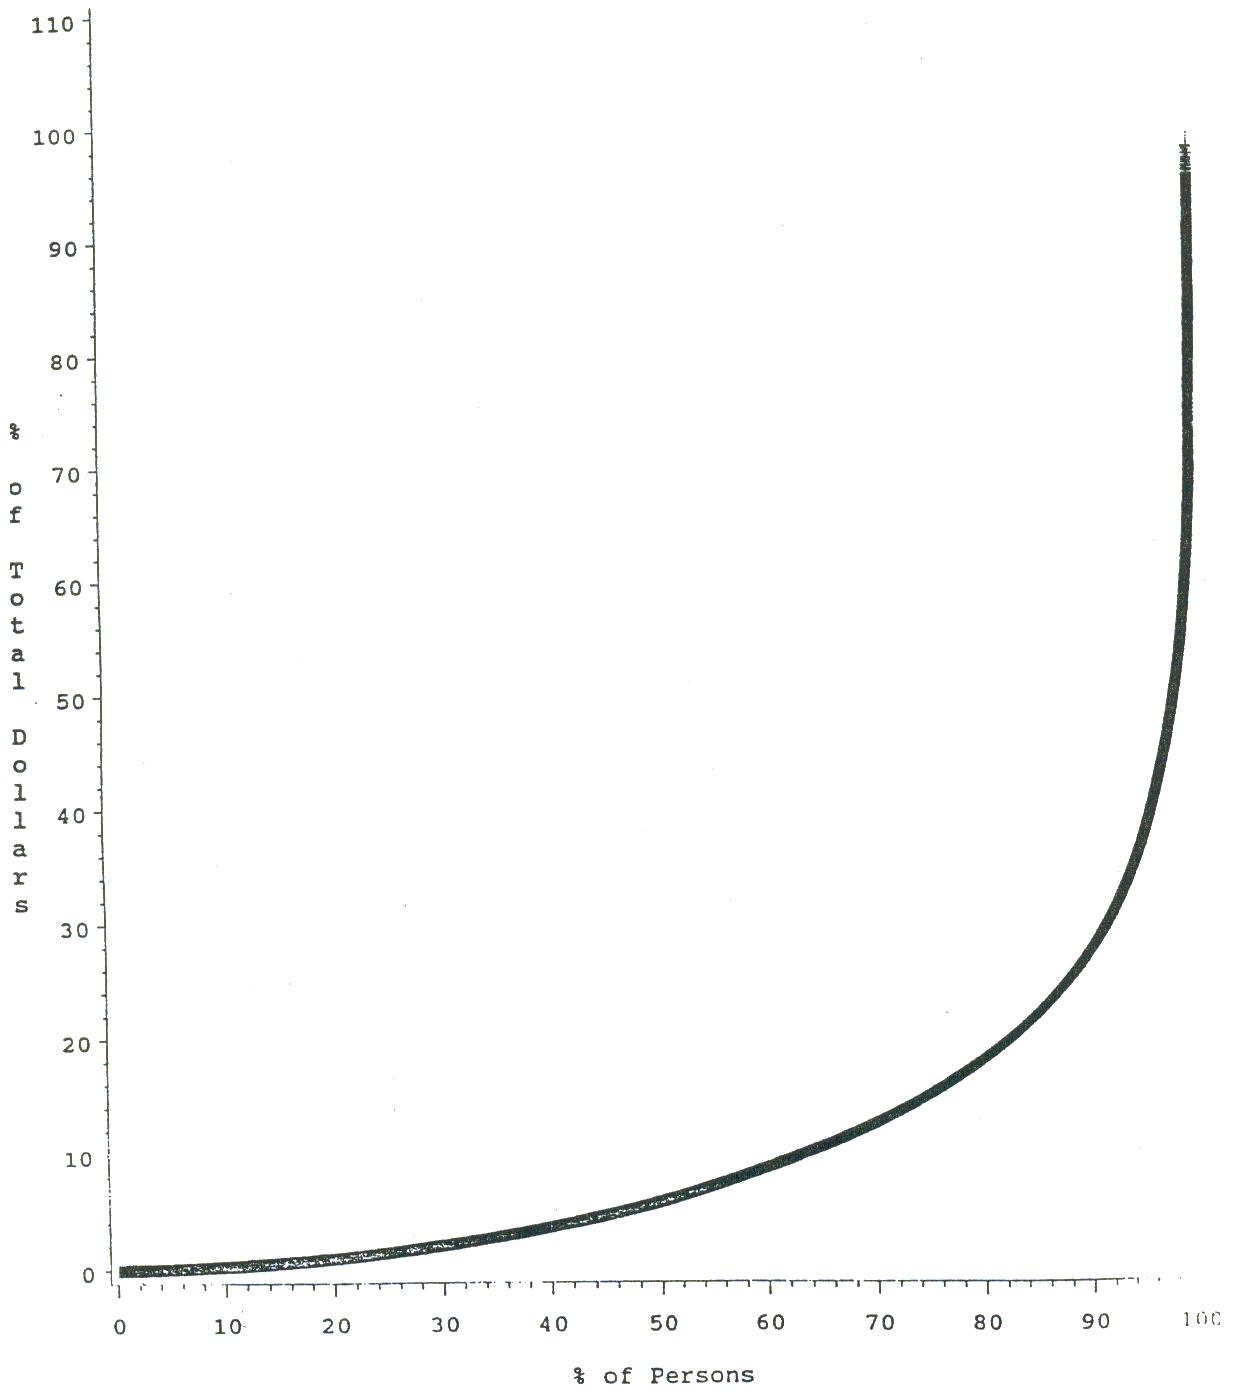
The percentile distribution of costs for the sample overall is shown in Figure 1. Ten percent of the group accounted for 70% of total expenditures. Table 3 illustrates the total expenditures and mean costs per child with each selected condition and the overall mean costs for a child who has none of these conditions. Mean costs range from $2,503 (for children with diabetes) to $36,713 for children with CRD. These mean costs vary from three and to more than 40 times the mean cost of care for children without these conditions ($827).
Rankings based on based on mean costs are substantially different from rankings based on total expenditures because of differences in prevalence rates within the sample. Asthma is a clear example of one pattern; it is ranked second to the lowest in mean costs but highest in total expenditures. Conversely, children with muscular dystrophy rank third from the highest in mean costs, but third from the lowest in total expenditures. Children with chronic respiratory conditions rank high on both mean and total costs.
ICD codes were examined further to determine potential subgroupings of children that might be associated with particularly high costs. For example, children with diabetes include children with diabetes accompanied by ketoacidosis. This subgroup (N=88) had substantially higher mean costs than all children with diabetes ($9,628 vs. $2,503); the children in this subgroup represented 7% of all children with diabetes and accounted for 26% of total expenditures for children with diabetes. Mean costs for children with cerebral palsy accompanied by quadriplegia (N=201) were substantially higher than children with CP as a whole ($15,959 vs. $10,437). Mean costs for children with epilepsy accompanied by paralysis (N=503) were greater than all children with epilepsy ($11,316 vs. $8,613). These specific subgroup analyses illustrate the general pattern in which relatively few children within each diagnostic group account for a disproportionate share of the costs. For these diagnostic categories, the ICD coding conventions allow for identification of a high cost subgroup; for most other diagnostic groupings, this is not possible at the present time.
Children with more than one of these conditions had substantially higher costs that children with only one of the conditions. Mean costs for children with 2 conditions (N=1,157) and with 3 or more conditions (N=103) were $17,569 and $47,153, respectively. Overall, for the group of children with two or more of the selected conditions means costs approached $20,000.
Expenditure by Service Category
Table 4 illustrates the distribution of costs across service categories for children with selected conditions. For most of the diagnostic groupings, inpatient services account proportionally for a higher percentage of costs than any other service category. This is not true for children with cerebral palsy (where physical therapy and orthopedic services in the "other" category account for the highest percentage of costs) or with muscular dystrophy (where home health care services account for the highest percentage of costs). Within most costs categories, proportional expenditures vary considerably across diagnostic groupings. For example, within the medication category, costs vary form less than 1% of total costs to more than 16% of total costs. Much of this variation can be explained by the different biological processes of the selected conditions. For example, costs of infants with chronic respirator conditions are largely related to inpatient services because these infants remain in intensive care units for relatively long periods of time. Many youngsters with muscular dystrophy, especially as they move through adolescence, require increasing amounts of home health services; hence it is expected that costs for this care will be proportionately high, as Table 4 indicates.
The data in Table 4 imply differential patterns in service use across the different diagnoses. For example, claims for physician services, as a proportion of total costs, is comparatively higher for children with asthma or diabetes than for children with any of the other selected conditions. This reflects a heavy reliance on outpatient care for children with these diagnoses. For children with cystic fibrosis, medications reflect the second highest category of costs relative to the other categories, suggesting that medications figure heavily in the care of children with this condition.
DISCUSSION
Our analyses confirm that children with selected chronic conditions enrolled in the Washington State Medicaid program incur mean yearly medical costs that exceed those for children without any of the selected conditions. In fiscal year 1993, mean costs per child with the selected conditions ranged from approximately $3,000 to $37,000 depending on the particular condition. Care for children without any of the selected conditions averaged slightly more than $800. Rankings of yearly mean cost for children with a particular condition provide little indication of total costs associated with that condition because of variability in prevalence rates among the conditions. For fiscal year 1993, the condition that had the second lowest mean cost (asthma) had the highest total expenditures.
For some conditions, it was possible to use the subordinate ICD-9 codes to identify subgroups within the overall diagnostic category that included children with particularly high costs. For example, the mean costs for children with diabetes who have also experienced ketoacidosis are higher than for children with diabetes as a whole. For most conditions, this was not possible because existing subordinate codes are not consistently associated with high-cost treatments.
Our analyses also indicate that the contributions of particular services to total costs vary considerably across the diagnostic categories. Inpatient costs represent about 83% of total costs for children with chronic respiratory disease, for example, but only 28% of the total costs of care for children with cerebral palsy. These figures underscore the potential vulnerability of children with certain conditions to insurance policies that exclude or limit access to certain services. For example, children with muscular dystrophy will be particular affected by policies that limit private duty nurses. Families of children with cystic fibrosis will be disproportionately affected by policies that require co-payments for medications.
States that have established Medicaid managed care programs often "carve out" children with special health care needs. It is highly likely, however, that these children will be included eventually in managed care programs. Our data indicate enormous variation in cost and utilization patterns between diagnostic categories, suggesting that different conditions will need to be kept distinct for purposes of estimating costs of care.
Pediatricians and other child health professionals will need to assure that policies adopted by managed care organizations do not affect this population adversely. We believe that part of the problem involves managed care organizations' relative lack of knowledge and experience with this population. In the absence of little fiscal information on which to base policies, managed care programs are understandably hesitant to include this group. Additional information on costs and service use is needed to "demystify" this population for managed care organizations, to build the foundation for reasonable risk adjustment to account for higher costs in this population, and to provide child health professionals with the foundation of knowledge needed to argue for sound policies and comprehensive benefit packages.
This study provides basic descriptive information that begins to fill a critical gap, but it is limited by the inclusion of Medicaid data from only one state. Similar analyses using data from other states are needed to determine whether the patterns identified in this report are similar in other Medicaid populations. In addition, it would be of substantial interest to compare percentile distributions across service categories in fee-for-service and managed care systems for both Medicaid and employer-based pools. However, assembling the requisite data bases and assuring treat data from each can be compared reliably present major challenges because of different classification and coding conventions.
Within the group of children with disabilities and chronic illnesses, a relatively small percentage of individuals are likely to account for most of the medical care costs. However, few data are available to identify high-cost cases because most available studies have not accounted for critical factors, including age of child, primary diagnosis, presence of other impairments or disabilities, access to care, rates of hospitalization or institutionalization, and insurance status. Also, the pattern of medical and health-related costs for children with chronic can vary considerably from one year to the next in response to biological, developmental, and family factors. Additional analyses are needed to address these issues.
Nonetheless, the data presented in this study and other reports represent a foundation on which to build informed advocacy efforts. Pediatricians, the leadership of parent organizations, and other child health professionals must work collaboratively with directors of managed care organizations to assure that needed information is available and used to create policies that will assure care of high quality for children with special needs and their families.
REFERENCES
Anderson, G.F., Steinberg, E.P., Whittle, J. et al. (1990). Development of clinical and economic prognoses from Medicare claims data. JAMA. 263:967-972.
Assistant Secretary for Planning and Evaluation. (1995). Disability data for disability policy: Availability, access, and analysis. Office of Disability, Aging, and Long-term Care Policy, ASPE, DHHS. Washington, D.C.
Birenbaum, A., Guyot, D., & Cohen, H. (1990). Health Care Financing for Severe Developmental Disabilities. Monographs of the American Association on Mental Retardation (M. Begab, Series Editor), Number 14. Washington, D.C.: American Association on Mental Retardation.
Cartland, J.D.C., & Yudkowsky, B.K. (1992). Barriers to pediatric referral in managed care systems. Pediatrics, 89, 183-192.
Fox, H., Nadash, P., McManus, M., & Wicks, L. (December, 1994). A preliminary examination of state Medicaid demonstration waiver programs and children with special health needs. Washington, DC: Fox Health Policy Consultants.
Fox, H.B., Wicks, L.B., & Newacheck, P.W. (1993). State Medicaid health maintenance organization policies and special-needs children. Health Care Financing Review, 15, 25-37.
Hobbs, N. Perrin, J., & Ireys, H. (1985). Chronicallv Ill Children and Their Families. San Francisco, CA: Jossey-Bass.
Ireys, H. (November, 1994). Children with special health care needs: Evaluating their needs and relevant service structures. Paper commissioned by the Institute of Medicine, Washington, DC.
Ireys, H., Grason, H., & Guyer, S. (1995). Quality of care for children with special health care needs in managed care programs. Pediatrics. Under review.
Lave, J., Pashos, C., Anderson, G., et al. (1994). Costing medical care: Using Medicare administrative data. Medical Care, 32(Suppl 7, JS77-89.
Leatherman, S., Peterson, E., Heinen, L., Quam, L. (1991). Quality screening and management using claims data in a managed care setting. Quality Review Bulletin, 17, 349-359.
Mauldon, J., Leibowitz, A., Buchanan J.L., Damberg, C., & McGuigan, M.S. (1994). Rationing or rationalizing children's medical care: Comparison of a Medicaid HMO with fee-for-service care. American Journal of Public Health, 84, 899-904.
Newacheck, P., Hughes, D., Stoddard, J., & Halfon, N. (1994). Children with chronic illness and Medicaid managed care. Pediatrics, 93, 497-500.
Newhouse, J., Sloss, E., Manning, W., Keeler, E. (1993). Risk adjustment for a children's capitation rate. Health Care Financing Review, 15, 39-54.
Regenstein, M & Meyer, JA. (1994) Low Income Children with Disabilities: How Will Thev Fare Under Health Care Reform? Portland, ME: National Academy for State Health Policy.
Steinberg, E.P., & Whittle, J. (1990). Impact of claims data research on clinical practice. International Journal of Technical Assessment in Health Care, 6, 282-287.
US General Accounting Office. (March, 1993). Medicaid: States turn to managed care to improve access and control costs. Washington, DC: GAO/HRD-93-46
Valdez, R.B., Ware, J.E., Jr., Manning, W.G., Brook, R.H., Rogers, W.H., Goldberg, G.A., & Newhouse, J.P. (1989). Prepaid group practice effects on the utilization of medical services and health outcomes for children: Results from a controlled trial. Pediatrics, 93, 168-180.
Waitzman, N.J., Romano, P.S., & Scheffler, R.M. (1994). Estimates of the economic costs of birth defects. Inquiry, 33, 188-205.
| TABLE 1. Selected Conditions | |
| Condition | ICD-9 Code |
| Asthma | 493 |
| Attention deficit disorder | 314 |
| Cerebral palsy | 343 |
| Chronic respiratory disease | 770.7, .8 |
| Cystic fibrosis | 277 |
| Diabetes | 250.1, .8 |
| Epilepsy | 345 |
| Malignant neoplasms | 140-208 |
| Mental retardation | 317-19, 758 |
| Muscular dystrophy | 335, 359 |
| Spina bifida | 741 |
| TABLE 2. Sample Profile | ||
| N | Prevalence Rate (per 1,000) | |
| Total | 308,752 | |
| Children with at least one condition | 23,568 | 76.3 |
| Children with: | ||
| Asthma | 14,343 | 46.5 |
| ADD | 4,682 | 15.2 |
| CP | 950 | 3.1 |
| CRD | 889 | 2.9 |
| CF | 129 | 0.4 |
| Diabetes | 1,299 | 4.2 |
| Epilepsy | 1,284 | 4.2 |
| MR | 343 | 1.1 |
| MD | 169 | 0.5 |
| Neoplasm | 573 | 1.9 |
| Spina Bifida | 190 | 0.6 |
| Children with 2+ conditions | 1,260 | 4.1 |
| TABLE 3. Mean Costs and Total Expenditures | ||
| Mean Per Child (Rank) | Total Expenditures (Rank) | |
| Children with no selected conditions | $827 | |
| Children with at least one condition | 5,138 | |
| Children with: | ||
| CRD | 36,713 (1) | $32,637,958 (2) |
| Neoplasm | 20,176 (2) | 11,560,734 (4) |
| MD | 18,517 (3) | 3,129,442 (9) |
| CF | 14,860 (4) | 1,916,904 (11) |
| Spina Bifida | 12,454 (5) | 2,366,330 (10) |
| MR | 12,126 (6) | 4,159,099 (7) |
| CP | 10,437 (7) | 9,915,057 (6) |
| Epilepsy | 8,613 (8) | 11,059, 516 (5) |
| ADD | 5,810 (9) | 27,200,267 (3) |
| Asthma | 3,035 (10) | 43,530,543 (1) |
| Diabetes | 2,503 (11) | 3,252,005 (8) |
| Children with 2+ conditions | 19,987 | 25,184,092 |
| TABLE 4. Expenditure Breakdown by Provider Category of ServicePercent of Total ExpendituresWashington State Medicaid, FY 1993, Children age 18 and under | |||||||
| Inpatient | Physicians | Private LPN/RN | Outpatient | Drugs | Other | Total | |
| Asthma | 42.1% | 15.4% | 10.8% | 8.6% | 7.7% | 15.3% | 100% |
| Attention Deficit Disorder | 56.7% | 6.1% | 0.7% | 2.3% | 3.5% | 30.6% | 100% |
| Chr Resp Disease | 83.1% | 4.7% | 6.6% | 1.3% | 0.5% | 3.9% | 100% |
| Cerebral Palsy | 28.1% | 7.3% | 20.3% | 5.2% | 4.5% | 34.6% | 100% |
| Epilepsy | 51.0% | 9.4% | 8.1% | 6.5% | 5.9% | 19.0% | 100% |
| Malignant Neoplasm | 73.6% | 8.0% | 2.6% | 7.2% | 4.4% | 4.2% | 100% |
| Diabetes Mellitus | 43.5% | 20.6% | 0.9% | 7.9% | 10.1% | 17.0% | 100% |
| Mental Retardation | 56.2% | 8.1% | 5.1% | 4.4% | 3.9% | 22.3% | 100% |
| Muscular Dystrophy | 34.6% | 4.8% | 36.3% | 2.9% | 1.6% | 19.9% | 100% |
| Spina Bifida | 52.7% | 6.0% | 12.2% | 6.0% | 3.9% | 19.3% | 100% |
| Cystic Fibrosis | 50.0% | 7.2% | 10.1% | 3.7% | 16.4% | 12.6% | 100% |
| Ave Child w/o disease | 31.3% | 23.3% | 0.6% | 11.8% | 6.3% | 26.8% | 100% |
| Other includes: PT, neuromuscular centers, audiologists, speech pathologists, prosthetists/orthotists, nurse anesthetists, hospice care. | |||||||
| FIGURE 1. Washington State Medicaid Data -- FY93 Percentage Persons by Percentage of Total Costs |
 |