
Final White Paper
Contract # HHSP2333700IT
September 20, 2013
Prepared for:
James Sorace, MD, MS
Michael Millman, PhD
Assistant Secretary for Planning and Evaluation
U.S. Department of Health & Human Services
200 Independence Ave. S.W.
Washington, DC 20201
Prepared by:
Michael E. Rezaee, MPH
Lisa LeRoy, MBA, PhD
Alan White, PhD
Emma Oppenheim
Ken Carlson
Melanie Wasserman, PhD
Abt Associates Inc.
55 Wheeler Street
Cambridge, MA 02138
The information contained in this white paper was compiled by Abt Associates, Inc. under contract #HHSP2333700IT to the Assistant Secretary for Planning and Evaluation (ASPE) in September 2013. The findings and conclusions of this report are those of the authors and do not necessarily represent the views of ASPE or HHS.
"
1. Executive Summary
Understanding how to better care for individuals with multiple chronic conditions (MCC) is a priority for the Department of Health and Human Services due to the growing cohort of people with MCC and the associated health care cost and quality of care implications. In recent decades health services research has focused on one disease at a time, or on highly prevalent co-occurring conditions, leaving a large gap in our knowledge about how to optimally treat individuals who have more than one chronic illness. Individuals living with MCC know firsthand the difficulty of navigating the health care system, the lack of coordination between different health care clinicians, the impact of illness on daily living, the toll on family and friends, and the impediments to maximizing quality of life, among other difficulties. For the numerous patients with rare combinations of multiple chronic conditions, the difficulties are exacerbated by having few peers to talk with and learn from, and few clinicians who are familiar with best treatment and options for their particular combination of conditions.
Current MCC research has focused primarily on studying the impact of high-prevalence diseases (i.e. hypertension, hyperlipidemia, diabetes, arthritis, etc.) in terms of patient outcomes, care utilization and cost. However, an understudied group comprises patients with less prevalent combinations of MCC. How the group may change over time as individuals acquire new chronic conditions, or certain conditions change in intensity, has not been well examined. There are many unique constellations of MCC; for example, a recent study of approximately 32 million Medicare beneficiaries found over 2,000,000 unique combinations of MCC (Sorace et al. 2011). The distribution of constellations of MCC results in a curve with a very “long tail” of complex patients that changes nationally over time. Sources and methods for studying the long tail and recommendations for future research on less prevalent MCC are the primary focus of our paper.
Our methods included a review of the peer-reviewed and grey literature, facilitating discussions of a Technical Advisory Group, and interviews with key informants. Most of the published studies examined a small number of high prevalence conditions ( e.g., hypertension, hyperlipidemia, ischemic heart disease, diabetes, arthritis) and almost none focused on low prevalence MCC. Claims data and large surveys are most appropriate for exploring rare combinations because of the small cell size for any one unique combination of conditions but are limited by code misspecification, upcoding to maximize reimbursement and poor demographic and socioeconomic variables in the case of claims, and recall bias and insufficient diagnostic detail in the case of surveys, as well as other limitations. The sheer volume of data needed to study the long tail distribution necessitates using a diagnostic grouping system. Of the 14 grouping systems we reviewed, the number of diagnostic groups ranged from 25 to 272 with 1080 subgroups. The number of diagnoses that are included determines the number of groups that can be studied. Grouping classifications are not well documented or explained by the researchers who utilize them. We found other methodological and analytical issues that complicate our ability to study MCC in general, and the long tail in particular. The paper serves as a resource for researchers interested in building the knowledgebase on MCC.
There is much to be learned about individuals who have less prevalent combinations of MCC and therefore many opportunities for future research, both substantive and methodological. We need to understand who comprises the long tail (including when looking at data other than Medicare claims), and better understand their demographic characteristics, cost patterns, and clusters of biologically related and unrelated conditions. Comparisons with similar populations in other countries will help shed light on treatment options. Self-management techniques and disease management for MCC combinations are critical to achieving improved quality of life, but we know little about those interventions in the low prevalence MCC population. Research methods need to be adapted and documented to help build the knowledge base about persons with MCC and lead to more valid, reliable findings. We need quality measures that take multiple illnesses into account, and much better research on the service utilization patterns in order to accurately attribute and address costs.
Finally, there is much to be learned from individuals who have less prevalent conditions of MCC: how they prioritize and manage their own illnesses, what outcomes are most important to them, where they obtain information, and how their conditions relate to one another. In the paper which follows we identify gaps in the current knowledge base, methodological constraints with existing analytical tools, and opportunities for future research to improve the care and lives of a growing, disadvantaged population.
2. Introduction
Individuals with multiple chronic conditions (MCC) represent a growing percentage of the population. Some chronic diseases commence at birth, while others occur later in life, and they may be caused by genetic, behavioral, environmental, or infectious factors. Chronic diseases may become acute at times, may impair functioning or may be asymptomatic. While estimates vary by data source and methodology, those from the following studies are illustrative: in 2006, 28% of the population had MCC and by 2010 this increased to about 32% (RWJF, 2000 & Abt Associates, 2013). In 2010, 14% of Medicare beneficiaries with 6+ chronic conditions accounted for 46% of total Medicare spending (CMS, 2012). As individuals age, they are more likely to acquire MCC, however the rate of comorbidities is also increasing in the under 65 years-of-age population. As a high need population, the MCC cohort represents a large percentage of healthcare service utilization and cost. For example, persons with disabilities (the vast majority of whom have multiple chronic conditions) make up only 15% of the United States Medicaid population, but account for 43% of nearly the $350 billion per year in expenditures nationwide (Kaiser Family Foundation, 2009 & CMS, 2011).
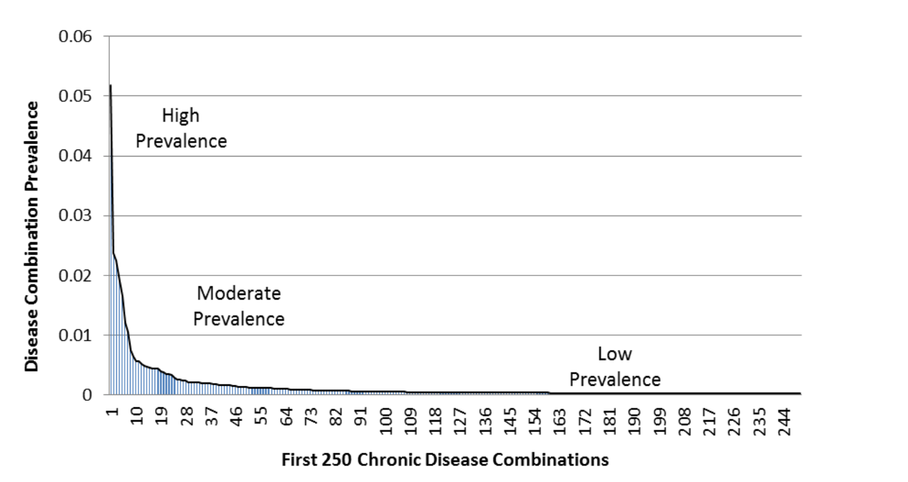
Research on multiple chronic conditions has been scant in recent decades but is growing as the affected population increases. Understandably, current MCC research has focused primarily on studying the impact of high-prevalence diseases (i.e., hypertension, hyperlipidemia, diabetes, arthritis, etc.) in terms of patient outcomes, care utilization and cost. However, an understudied group comprises patients with less prevalent combinations of MCC. How this group may change over time as individuals acquire new chronic conditions, or certain conditions change in intensity, has only recently been examined. Overall, there are many unique constellations of MCC; for example, a recent study of approximately 32 million Medicare beneficiaries found over 2,000,000 unique disease combinations (Sorace et al. 2011). The distribution of constellations of diseases results in a curve with a very “long tail” of complex patients. Exhibit 1 depicts the beginning of Medicare’s long tail distribution. Sources and methods for studying the long tail are the primary focus for this white paper.
Exhibit 1: The Beginning of Medicare’s Long Tail: Prevalence of Top 250 Disease Combinations
Constellations categorized as “rare” can result from combinations of common chronic conditions and/or less common or rare diseases. In other words, there are multiple pathways to becoming less prevalent (See Exhibit 2), and combining less prevalent combinations may account for as much as 79% of Medicare expenditures and 32% of beneficiaries (Sorace et al. 2011). Unique constellations are especially complex when multiple organ systems are involved and the combination of diseases, or treatments interact with one another. Developing treatment strategies for these complex patients is extremely difficult.
Exhibit 2: Multiple Chronic Condition Combination Types
| MCC Types | Example |
|---|---|
| Rare or less prevalent Condition in Combination with a Rare Condition | Multiple sclerosis and schizophrenia |
| Rare or less prevalent Condition in Combination with a Moderately Common Condition | Multiple sclerosis and lung cancer |
| Rare Condition or less prevalent in Combination with Common Chronic Conditions | Multiple myeloma, hypertension and depression |
| Combinations of Moderately Common Chronic Conditions with Common Chronic Conditions | Breast cancer, COPD, and arthritis |
| Unique Combinations of Common Chronic Conditions | Hypertension, hyperlipidemia, chronic back pain, and depression |
Acknowledging the “long tail” is important in interpreting the results of many types of healthcare studies. If the long tail is not accounted for, the following can potentially occur:
- Quality measures may show skewed calculations due to inaccurately classified individuals. For example, a person with type 2 diabetes and Alzheimer’s disease may not be a good candidate for tight glycemic control.
- Healthcare costs are inaccurately calculated. The patient with heart disease and MS may have all of their healthcare utilization and cost attributed to their heart disease when it is really a combination of the two or the majority of the cost is due to MS-related service utilization.
- Randomized controlled trials (RCTs) may be designed inappropriately, causing the results to not be generalizable to non-experimental settings. For example:
- The patients enrolled in the trial do not represent the comorbidities present in the actual patient population.
- Complex patients may have higher attrition compared to other patients (e.g., MCC patients fall out of a study arm).
- Investigators do not necessarily randomize for complexity or check to see if randomization has been successful for patients who may have MCC.
- Even if complex patients are involved in RCTs, patients with different patterns of complexity will likely be encountered in the future, which may limit the generalizability and long term implications of results.
- Disease management guidelines for a specific chronic disease may not work when combined together with other chronic conditions, and, in some cases, may contradict other guidelines (Boyd et al. 2005.)
Purpose of the Paper
The Assistant Secretary for Planning and Evaluation (APSE) Office of Science and Data Policy contracted Abt Associates to explore how the “long tail” of the MCC population can be appropriately studied. As a first step, ASPE wanted to identify and review the existing data sources that can be used to understand the population, and to describe relevant methodological research issues. The paper is intended to serve as a resource for investigators working on MCC by describing the strengths and limitations of currently available databases and methods. The information can help both researchers and stakeholders better understand and interpret research results, as well as consider what steps might be taken in the future to improve the knowledgebase on health care for MCC. Specifically, ASPE’s guiding study questions were as follows:
Study question #1 – What are the findings from MCC research related to prevalence and patterns of chronic disease combinations, health care utilization and cost, with particular attention to addressing less prevalent combinations of chronic conditions (i.e., the long tail)?
Study question #2 – What methodologies and analytic techniques have been used to study MCC? What are the potential limitations of these approaches in considering less prevalent combinations of MCC?
Study question #3 – What data systems and data sets exist that can be analyzed to better improve HHS’s understanding of and approaches to addressing numerous less prevalent combinations of chronic conditions?
Study question #4 – What combinations of less prevalent combinations of chronic comorbidities are most critical to address in terms of care utilization and cost? What are the future research considerations for MCC research?
In the Background section of the paper (Section 4) we describe why less prevalent MCC are an important area of study, as well as address the definitional problems and the interests of various stakeholders in MCC research. We describe the data collection and analysis methods we have used in Section 5: (1) literature review, (2) Technical Advisory Group, (3) key informant interviews, and (4) datasets and grouping systems. In Section 6, we characterize the literature on prevalence and patterns of MCC that has been conducted to-date. Methodological and analytic considerations of MCC research, such as grouping systems and study designs, are discussed in Section 7. Section 8 contains a review of potential datasets for MCC research. Section 9 discusses consideration for future areas of inquiry.
3. Background
The Context for Studying the Long Tail of Low-Prevalence Combinations
Clinical research has focused on single chronic disease conditions for decades. For many reasons, researchers have focused on understanding one medical condition at a time. Although especially true for clinical trials due to the need to reduce confounders and increase the strength of evidence, there is growing recognition of the limitations of this approach. As pointed out in a recent article by Tinetti and colleagues (2012) in the Journal of the American Medical Association, United States payment systems, service delivery, clinical decision making, and quality measurement have all been designed around single diseases. Until very recently, clinicians were paid according to individual diagnoses; in addition, many practitioners treat their patients according to guidelines and practices for a specific disease because guidelines for MCC do not exist in clinical practice. Paradoxically, however, most individuals with a chronic disease have more than one condition, and the group of individuals with MCC is growing.
Two thirds of healthcare spending is for multimorbid individuals over age 65 (Anderson, 2010). Boyd and colleagues (2005) examined the consequences of applying single disease guidelines to a hypothetical 79-year old woman with osteoporosis, osteoarthritis, type II diabetes mellitus, hypertension and chronic obstructive pulmonary disease, all of moderate severity. The results of these multiple guidelines for single conditions resulted in the patient being prescribed 12 medications requiring 19 doses per day, 14 non-pharmacological activities (e.g., nutrition), one-time education and rehabilitation interventions, and daily to biennial monitoring of chronic conditions requiring at least 2 to 4 primary care visits and 1 ophthalmology visit per year. In addition, there was potential for medication contraindications. The regime is not only impractical, it would result in potential risks, lack of care coordination, and burden on the patient and caregivers. In order for the United States health care system—particularly Medicare—to be successful, it must adapt to meet the needs of specific patients with MCC and their providers. To do so, accelerated knowledge and research about MCC is needed by policy-makers and healthcare providers.
There is extensive research on the most common chronic conditions in the Medicare population: hypertension, hyperlipidemia, ischemic heart disease, diabetes, arthritis, heart failure, depression, chronic kidney disease, osteoporosis, Alzheimer’s disease, etc.; and extensive research on these conditions in conjunction with a specific co-occurring chronic condition (for example hypertension and depression, or diabetes and chronic obstructive pulmonary disease); but very little research on low-prevalence MCC (CMS, 2011).
Definitions of Multiple Chronic Conditions
One of the difficulties in studying multiple chronic conditions is the lack of a clear definition of the phenomenon. For example, the official definitions in Exhibit 3 below, created by three organizations, are similar but not the same. A recent paper by Goodman and colleagues provides a robust discussion of definitional issues related to multiple chronic conditions and elaborates the many different definitions being used in different contexts by different stakeholders (Goodman, et al., 2013). In addition, the authors offer a conceptual model for classifying chronic conditions and call for a collaborative process to begin to standardize and systemize definitions and set of conditions that are important for clinical practice, research and policy making.
Exhibit 3: Definitions of Multiple Chronic Conditions by Three Organizations
| Organization | Definition of Multiple Chronic Conditions |
|---|---|
| HHS Assistant Secretary for Health | Chronic conditions are conditions that last a year or more and require ongoing medical attention and/or limit activities of daily living. They include both physical conditions such as arthritis, cancer, and HIV infection. Also included are mental and cognitive disorders, such as ongoing depression, substance addiction, and dementia. MCC are concurrent chronic conditions. In other words, multiple chronic conditions are two or more chronic conditions that affect a person at the same time. For example, either a person with arthritis and hypertension or a person with heart disease and depression, both have multiple chronic conditions (DHHS 2013). |
| National Quality Forum | Two or more concurrent chronic conditions that collectively have an adverse effect on health status, function, or quality of life, and that require complex healthcare management, decision-making, or coordination (NQF 2012). |
| Institute for Medicine | Definition: Long-term health conditions that threaten well-being and function in an episodic, continuous, or progressive way over many years of life (IOM 2012). |
In a study of Medicare patients, Fortin and his colleagues (2012) concluded that the lack of uniformity in definition results in dramatically different prevalence estimates. Because there are numerous different constellations of MCC (particularly low prevalence MCC), researchers have used simple counts of the number of conditions an individual has as a measure of intensity or comparison. Although the specific conditions that are included differ by study, reporting only the number of MCC can lead to inconsistent conclusions and lack of comparability (Fortin et al. 2012 & Salive, 2013). Individuals with MCC are often defined as “complex patients,” which is both a physiological description that encompasses the complexity of having more than one condition as well as a characterization of their interface with the health care system—which is complicated by multiple conditions (Rich et al., 2012, Safford et al., 2007, & Grant et al., 2011).
Consensus-building efforts may in the future help to refine the definition of MCC used by researchers. In the meantime, given the sparse literature, we examined all papers related to multiple chronic conditions reagardless of the definition used by the authors.
Federal Initiatives on Multiple Chronic Conditions
The need to better understand how to care for individuals with multiple chronic conditions is a priority for the Department of Health and Human Services because of the growing size of the MCC cohort and the associated health care cost implications. In 2008, the HHS Office of the Assistant Secretary for Health launched an initiative to strengthen efforts directed at MCC, including establishment of the HHS Interagency Workgroup on MCC (Parekh et al., 2011). The Workgroup included representatives from key HHS Operating Divisions and Offices and was charged with identifying gaps in research and health care services for individuals with MCC. The Workgroup developed the HHS Strategic Framework on MCC (DHHS, 2010), a national roadmap for public and private stakeholders, and also produced and disseminated an annotated inventory of initiatives involving MCC. The Strategic Framework, published in December 2010, has four major goals:
- Fostering health care and public health system changes to improve the health of individuals with MCC.
- Maximizing the use of proven self-care management and other services by individuals with MCC.
- Providing better tools and information to health care, public health, and social services workers who deliver care to individuals with MCC.
- Facilitating research to fill knowledge gaps about, and interventions and systems to benefit, individuals with MCC.
For each goal there are subsets of objectives and action strategies for HHS, healthcare providers, and other stakeholders. The updated inventory of HHS MCC-related activities, programs, and initiatives, released in 2011, contains information on over 100 projects and studies organized according to the four goals, with web links for users (DHHS, 2011). The MCC Strategic Framework has helped to focus and align the activities of HHS agencies, and many agencies have initiatives that contribute to the four goals. It is important to note that there are a number of important research initiatives and collaborations currently underway that will produce findings and new analytic methods that will greatly shape MCC research moving forward. For example, the Agency for Healthcare Research and Quality’s (AHRQ) created the MCC Research Network, a collaborative of researchers from across the country conducting foundational research to improve our understanding of how to best study and treat MCC patients (AHRQ, 2013). The network includes 45 research teams with grants as follows:
- Eighteen exploratory and developmental R21 grants funded in 2008 to address the gaps in knowledge related to MCC patients and preventive services.
- Thirteen infrastructure development R24 grants funded in 2010 to develop new databases and information systems study MCC patients.
- Fourteen exploratory R21 grants funding in 2010 to conduct comparative effectiveness research using currently available data.
Although we do not focus on the current federal initiatives in-progress, the methodological challenges and considerations discussed in the white paper can be applied to all types of MCC research, including both past and future efforts.
Stakeholder Perspectives
It is important to note that the significance of examining less prevalent, or rare, MCC combinations depends on the perspective of the stakeholder, which ranges from the patient to the provider to the health plan risk adjuster. A clinician trying to assess the best course of treatment for a patient has different information needs than does a health insurer that is attempting to reduce health care costs, or a state chronic disease director who wants to reduce chronic disease burden for a population of people. The level of detail needed about multiple chronic conditions at the individual level—and therefore the importance of the long tail—will vary according to stakeholders’ goals. Similarly, where research is concerned, the number of diagnostic codes needed to categorize individuals with multiple chronic conditions depends on the perspective of the information users. However, from the patient’s perspective, every condition and every diagnosis matters.
There are small numbers of patients in many, many combinations of MCC (Sorace et al., 2011) and any one provider or health plan may have extremely few patients with a specific combination of conditions. For a clinician the specific constellation of MCC is critical in determining what the best possible treatment is, but studies on small, unique sets of people with MCC are rare. Likewise, a person with a less prevalent combination of MCC may have difficulty finding information on how to best manage their personal conditions.
Policy makers are faced with a challenge because there is a lack of evidence on treatment for low-prevalence MCC and it is not clear at what level in the health care system interventions can be effective, or how transferable interventions are from one patient population to another. Demonstration projects, natural experiments and research studies can all contribute to new learning.
In the table below, we identify groups with a stake in multiple chronic conditions research and list their primary interests (See Exhibit 4). The degree to which stakeholders see value in studying less prevalent MCC is a matter of perspective and purpose. Similarly, the research aims will differ by stakeholder.
Exhibit 4: MCC Research Stakeholder Perspectives
| Stakeholder | Interest in Multiple Chronic Conditions Research |
|---|---|
| Clinicians |
|
| Policymakers |
|
| Public Health Officials |
|
| Risk Adjusters |
|
| Provider Organizations/ Systems |
|
| Financing Entities |
|
| Patients |
|
| Researchers |
|
| Federal Demonstrations |
|
The patient perspective was illuminated through discussion with a representative of “Patients Like Me,” a company that encourages individuals to share their medical and treatment information on a web platform, and to connect with other people who are also willing to share. The company initially invited consumers to identify themselves with a primary disease (like ALS) as they were promoting sharing by individuals with the same medical condition. However, the participants typically listed more than one condition in their profiles. After a number of years, the company opened the platform to allow participants to label their own medical conditions, and to choose which one was their “primary” condition rather than offering only pre-determined categories. Due to this expanded patient input, the number of medical conditions included on the website grew from 300 to 2,000 as people wanted more specific and discrete disease categories by which to identify themselves and their peers.1
1 Personal communication with Sally Okun, RN, MMHS, VP of Advocacy, Policy & Patient Safety at PatientsLikeMe.
4. Methods
Our methods for addressing the four research questions included a review of the peer-reviewed and grey literature, convening a Technical Advisory Group, and interviewing key informants.
TAG Member Agencies
- Agency for Healthcare Research & Quality
- Centers for Disease Control and Prevention
- Centers for Medicare & Medicaid Services
- National Institute on Aging
- Office of the Assistant Secretary for Health
- Office of the National Coordinator
Abt Associates conducted a review of the peer-reviewed and grey literature related to prevalence of MCC, disease combinations, diagnosis coding, and databases and analytic techniques that have been used to conduct chronic disease research. Our detailed MEDLINE search strategy can be found in Appendix A. The purpose of the literature review was to identify MCC research studies and methods papers on multimorbidity research. Studies that focused on individual chronic diseases were excluded from the review. The results of the review are found in Sections 6 and 7 of the white paper.
To advise the project, Abt Associates and ASPE organized a Technical Advisory Group (TAG), which was comprised of MCC experts from a variety of different HHS agencies. A list of the TAG members and their affiliations is contained in Appendix D. On December 18th, 2012, Abt and ASPE conducted an in-person meeting with the TAG. The objectives of the meeting were:
- To discuss the initial findings from literature and database reviews related to less prevalent combinations of MCC, as well as the search strategy itself.
- To generate a list of potential databases and methods that could be used to study less prevalent combinations of chronic conditions, and to discuss the challenges and limitations of these approaches.
- To identify additional peer-reviewed articles and grey literature, and databases that were relevant for the project.
During the meeting, TAG members provided insightful comments and feedback that were later directly incorporated in the study. On May 10th, 2013, the TAG was convened for a second meeting to review and provide edits and suggestions on the first complete draft of the white paper, that were later incorporated.
To further inform study of the long tail, Abt and ASPE conducted key informant interviews with seven individuals representing various stakeholder perspectives. A list of key informants can found be found in Appendix E. Each of the individuals was asked to share his or her perspective and knowledge regarding MCC research, studying less prevalent combinations of MCC, and priorities for MCC research moving forward. The information gleaned from key informants is integrated throughout the report.
Key Informant Interview Perspectives
- Health Services Research
- Insurance Providers
- Grouping Systems
- Large-scale Demonstrations
- Patient Advocacy & Activation
- Rare Disease Research
- Clinician
Additionally, Abt Associates conducted a detailed review of 17 databases that may potentially be used for MCC research on less prevalent MCC, as well as 14 diagnosis grouping systems that can be used to categorize diagnosis information for MCC research. A more detailed description of these reviews can be found in Sections 7 and 8.
5. Characterizing the MCC Literature on Prevalence and Patterns of Chronic Disease Combinations (Study Question #1)
What are the findings from MCC research related to prevalence and patterns of chronic disease combinations, health care utilization and cost, with particular attention to addressing less prevalent combinations of chronic conditions (i.e., the long tail)?
For decades, chronic disease research has focused on studying prevalence, patterns, and the health and healthcare impacts of individual chronic conditions. However, the field of chronic disease research is currently evolving from a single disease focus to a paradigm that places emphasis on the importance of studying multiple chronic conditions (MCC). The shift in priorities is due to growing awareness of the compounding impacts of MCC on patients’ health, the United States healthcare system and society. As a result, MCC patients are becoming a focus of chronic disease researchers and are being targeted by providers and health plans for intervention.
Below we characterize the research that has been conducted on MCC to date. Based on the findings from the literature review, key informant interviews, and TAG meetings, we summarized MCC research according to three broad topic areas:
- Prevalent combinations of MCC
- Chronic condition clusters and co-occurring conditions
- Less prevalent combinations of MCC
We provide a brief introduction to each of these research areas and describe some of the findings that have been published to date.
Prevalent Combinations of MCC
In the United States, much of the research on multiple chronic conditions focuses on highly prevalent conditions ( e.g., obesity, hypertension, and diabetes) because they affect a large number of individuals, may be successfully managed or controlled, and they are included in major national surveys and other data collection efforts. The purpose of the literature was two-fold: 1) to characterize the burden of MCC across various populations, and 2) to identify MCC populations associated with increased healthcare utilization and poorer quality of care, so that patients can be targeted for intervention by providers, health plans and public health officials.
To conduct the work, researchers have employed methods such as basic prevalence and incidence calculations, and regression modeling and odds ratios to predict healthcare utilization and cost based on either the occurrence of MCC or the number of MCC a patient has. MCC prevalence has commonly been measured as the percent of patients in a population with two or more chronic conditions, while chronic disease complexity has been assessed through examining the distribution of MCC patients across an increasing number of chronic conditions ( e.g., 2, 3, 4, 5 + conditions). Predictive statistics are then used to estimate healthcare utilization, cost and quality of care based on the occurrence of MCC or the number of MCC for a specific patient.
A number of studies and initiatives have investigated both the prevalence and complexity of MCC across a variety of different populations (See Exhibit 5). One of the most well-known is the CMS Chronic Conditions Data Warehouse (CCW), which not only provides a database of patients with chronic conditions for research purposes, but also an interactive dashboard to investigate chronic condition prevalence, condition counts, and utilization information using a variety of different demographic filters ( e.g., gender, geographic area, and dual eligibility status). Information contained in the CCW database originates from Medicare and Medicaid beneficiary claims and assessment data from different healthcare settings across the continuum of care (CMS, 2013). By using the dashboard (which can be applied to Medicare fee-for-service beneficiaries only), users can compare prevalence estimates between states or between a state and national benchmarks. As an example, 37% of Medicare beneficiaries in New Hampshire have five or more chronic conditions, compared to 41% in Alabama and 43% nationwide.
The Faces of Medicaid publications have articulated the prevalence of MCC among Medicaid beneficiaries. The 2007 publication The Faces of Medicaid II: Recognizing Needs of People with Multiple Chronic Conditions estimated that 10% of non-disabled, adult Medicaid beneficiaries had three or more chronic condition categories, compared to 35% of adults with a disability and 39% of elderly Medicaid beneficiaries (Kronick et al., 2007). Similarly, in 2012 the National Center for Health Statistics reported that 21% of non-elderly, United States adult civilians have two or more chronic conditions, and that the rate of MCC in populations is increasing over time (Fried et al., 2012). As shown in Exhibit 5 below, prevalence estimates differ by study, depending on the population being studied, the number of chronic conditions per person included in the study, and the number of combinations of MCC.
Exhibit 5: Comparison of MCC Prevalence Estimates by Study; for Over and Under Age 65
| Author | Country | Population | Primary Data Source | Grouping System | # of CCs | MCC Prevalence | # of Comb. |
|---|---|---|---|---|---|---|---|
| Legend: Primary Data Source, what data was analyzed in each study (NHIS=National Health Interview Survey, MEPS=Medical Expenditure Panel Survey, HRS=Health & Retirement Study, EMR=Electronic Medical Record, BRFSS=Behavioral Risk Factor Surveillance System); Grouping Systems, system used to aggregate diagnosis codes together (ACG=Adjusted Clinical Groups Case-mix System, CDPS=Chronic Illness Disability Payment System, CCS=Clinical Classification System, CCW ALGM=Chronic Conditions Data Warehouse Algorithm, ADG=Aggregated Diagnosis Groups; # of CCs, number of chronic conditions categories studied; # of Comb. (Combinations), how researchers examined complexity by stratifying patients into categories representing the occurrence of different numbers of chronic conditions ( e.g., e.g., 2, 3, 4, 5 + conditions, etc.). | |||||||
| Average Population Age < 65 Years | |||||||
| Fortin et al. (a) 2010 | Canada | Adult Civilians | Community Survey | n/a | 7 | 14% | ≥ 2 |
| Fried et al. (a) 2012 | U.S. | Adult Civilians | NHIS | n/a | 9 | 21% | ≥ 2 |
| Machlin & Soni 2013 | U.S. | Adult Civilians | MEPS | n/a | 20 | 25% | 1 to > 4 |
| Ward et al. 2013 | U.S. | Adult Civilians | NHIS | n/a | 10 | 26% | 1 to > 4 |
| Prados-Torres et al. (a) 2012 | Spain | Primary Care Patients | EMR Data (ICD-9) | ACG | 264 | 26% | 1 to 14 |
| RWJF 2010 | U.S. | Adult Civilians | MEPS | n/a | 9 | 28% | 1 to 5 |
| Chen et al. 2011 | U.S. | Adult Civilians | BRFSS | n/a | 8 | 29% | 1 to ≥ 3 |
| Kronick et al. 2007 | U.S. | Medicaid Patients | Medicaid Claims | CDPS | 20 | 39% | 1 to > 7 |
| Lee et al. 2007 | U.S. | VA Patients | VA Databases | CCS | 11 | 41% | 1 to > 4 |
| Yoon et al. 2011 | U.S. | VA Patients | VA Databases | n/a | 16 | 48% | 1 to > 4 |
| Yu et al. 2003 | U.S. | VA Patients | VA Databases | n/a | 29 | 52% | 1 to > 3 |
| Naessens et al. 2011 | U.S. | Adult Employees & Dependents | Insurance Claims | CCS | 259 | 54% | ≥ 2 |
| Fortin et al. (b) 2010 | Canada | Family-Practice Patients | Family Practice- based Sample | n/a | 7 | 58% | ≥ 2 |
| Schneider et al. 2012 | Sweden | Adult Inpatients | EMR Data (ICD-10) | n/a | 22 | 93% | ≥ 2 |
| Average Population Age ≥ 65 Years | |||||||
| Ford et al. 2013 | U.S. | Adult Civilians | NHIS | n/a | 9 | 15% | 1 to 5 |
| Schneider et al. 2009 | U.S. | Medicare Patients | CMS CCW | CCW ALGM | 9 | 20% | 1 to > 3 |
| Erdem et al. (a) 2013 | U.S. | Medicare Part A Patients | CMS CCW | CCW ALGM | 27 | 37% | 1 to 10 |
| Erdem et al. (b) 2013 | U.S. | Medicare Part B Patients | CMS CCW | CCW ALGM | 27 | 41% | 1 to 10 |
| Fried et al. (b) 2012 | U.S. | Adult Civilians | NHIS | n/a | 9 | 45% | ≥ 3 |
| Schoenberg et al. 2007 | U.S. | Adult Civilians | HRS | n/a | 8 | 58% | 1 to > 5 |
| Salisbury et al. 2011 | U.K. | Adult GP Patients | GP Database | ACG | 260 | 58% | 1 to ≥ 5 |
| Wolff et al. 2002 | U.S. | Medicare Patients | Medicare Claims | ADG | 24 | 65% | 1 to ≥ 4 |
| Glynn et al. 2011 | U.K. | Family-Practice Patients | Medical Record Data | n/a | 147 | 66% | 1 to > 4 |
| Salive 2013 | U.S. | Medicare Patients | Medicare Claims | CCW ALGM | 15 | 67% | ≥ 2 |
| Prados-Torres et al. (b) 2012 | Spain | Primary Care Patients | EMR Data (ICD-9) | ACG | 264 | 67% | 1 to 14 |
| Lochner et al. 2013 | U.S. | Medicare Patients | Medicare Claims | CCW ALGM | 15 | 68% | 1 to ≥ 4 |
| CMS Chartbook 2012 | U.S. | Medicare Patients | CMS CCW | CCW ALGM | 15 | 69% | 1 to >6 |
| CMS CCW 2013 | U.S. | Medicare Patients | CMS CCW | CCW ALGM | 27 | 73% | 1 to > 6 |
| John et al. 2003 | U.S. | American Indians | Community Survey | n/a | 11 | 74% | 1 to > 6 |
| Steinman et al. 2012 | U.S. | VA Patients | VA Databases | CCS | 23 | 90% | 1 to > 8 |
When studying MCC prevalence among Veteran Affairs (VA) patients, Yu and colleagues found that 52% of VA patients had two or more chronic conditions. Of that number, 17% of patients had two chronic conditions, while 35% had three or more (Yu et al. 2003). Similarly, Steinman and colleagues found that approximately 90% of elderly VA patients had three or more chronic conditions; 44% has three to five chronic conditions, while 32% and 14% had six to eight and greater than eight conditions, respectively (Steinman et al. 2012). These prevalence estimates are considerably higher than the 21% that has been reported for all Americans (Vogeli et al., 2007), but demonstrate that MCC are more prevalent within certain populations and increasing age groups. The studies listed in Exhibit 5 have been stratified by average patient population age (less than or greater than or equal to 65 years) to demonstrate the effect of age on MCC prevalence calculations.
As shown in Exhibit 5 prevalence estimates ranged from 14% in Canadian civilians to 93% in Swedish adult in-hospital patients. Although patient population and setting play important roles in determining prevalence, utilizing different methods and analytic techniques can also lead to inconsistent estimations. Researchers used anywhere from nine to 260 chronic conditions categories to study prevalence and the occurrence of one to fourteen chronic conditions to examine different depths of chronic disease complexity. Various data sources and diagnosis code grouping systems were also used.
Just as MCC prevalence is associated with patient age, it has been well documented that healthcare expenditures are positively associated with an increasing number of MCC (Lehnert et al., 2011). In the study by Yu and colleagues 73% of total costs to the VA healthcare system were found to be attributable to patients with three or more chronic conditions, while only 13% and 9% of costs could be attributed to patients with two or a single chronic condition, respectively (Yu et al. 2003). Likewise, in a study of working-age self-funded health plan enrollees, mean annual cost of MCC increased from $4,442 for patients with one chronic condition to over $23,000 for patients with five or more MCC (Naessens et al., 2011). A similar relationship between MCC and cost has also been observed with regard to out-of-pocket medical expenditures (Schoenberg et al., 2007).
MCC are also associated with increased healthcare utilization and mortality as well as poorer quality of life for patients. In a cross-sectional study of Medicare fee-for-service beneficiaries, Wolff and colleagues found a positive relationship between inpatient admissions and hospitalizations and the number of chronic conditions a patient had (Wolff et al., 2002). Similarly, Glynn and colleagues found a strong association between an increasing number of chronic conditions and the frequency of primary care consultations, hospital admissions and hospital out-patient visits among primary care patients (Glynn et al., 2011). With regard to mortality, research suggests that patients with MCC have higher mortality rates compared to patients without chronic conditions. Lee and colleagues found that the five year mortality rate for patients without chronic conditions (4%) was considerably lower than for patients with one (6%), two (8%), three (11%) or four or more (17%) diseases (Lee et al 2007). Lastly, patients with MCC are known to more frequently report limitations in daily living/instrumental activities and “fair” or “poor” overall health status compared to patients without MCC (Chen et al., 2011 & Gulley et al., 2011). However, arguments have been made that patients with a large number of MCC may actually receive higher quality care than patients with fewer conditions due to the increased number of physician visits these patients make (Bae & Rosenthal, 2008).
Overall, the majority of MCC research conducted to-date describes prevalence and complexity of multimorbidity, as well as the relationships that exist between MCC and healthcare utilization, cost and other related metrics. Findings demonstrate that MCC are common across all populations, but are concentrated in specific patient populations and age groups (e.g., the elderly, disabled and VA patients). Furthermore, MCC are associated with increased healthcare utilization, costs, and mortality, as well as lower quality of life. Finally, MCC research in the United States has primarily been conducted on chronic conditions that are highly prevalent and well-known; low-prevalence conditions have not been well studied.
Chronic Condition Clusters and Co-occurring Conditions
Research on chronic condition clusters and conditions that co-occur with a primary or “index” disease is increasing and leading to understanding of patterns of chronic disease combinations and how MCC co-occur or spread across populations in clinically and statistically meaningful ways. Knowing which chronic diseases tend to co-occur together and manifest over time offers clinicians the ability to develop multi-disease clinical guidelines and to identify opportunities for longitudinal disease prevention for patients. Conditions that co-occur may be statistically associated with one another with no known causal relationship or have an underlying pathophysiological connection (van den Akker et al., 1998). Although more research may be warranted to further investigate non-causal disease relationships, understanding which chronic conditions tend to cluster together provides clinicians with the opportunity to more accurately target disease prevention efforts and understand multimorbid complexity on a more granular scale. Metabolic syndrome is an example of a cluster that is widely recognized in the United States as well as internationally.
Two methodological approaches have been used to study patterns of chronic disease combinations and MCC co-existence. The more simplistic of these two approaches is to calculate the most common dyads and triads of co-occurring chronic conditions by determining what chronic conditions co-occur with an index disease, or by simply examining the percentage of patients in a population with a given combination of chronic diseases (Marengoni et al., 2009). For example, Lochner and colleagues found that hypertension and hyperlipidemia was the most common dyad among Medicare patients of all age groups (Lochner et al., 2013) while diabetes, hypertension, and hyperlipidemia was the most prevalent triad among younger Medicare patients, and ischemic heart disease, hypertensions, and hyperlipidemia, and arthritis, hypertension, and hyperlipidemia were the most common triads among older Medicare patients. As shown in Exhibit 6, a number of different dyads and triads have been reported in the literature to-date. Most studies report two-way and three-way combinations that include chronic diseases such as hypertension, hyperlipidemia, heart disease, diabetes and arthritis. Low-prevalence chronic disease combinations have not been included within reported dyads and triads.
Exhibit 6: Research on Co-occurring Chronic Condition Dyads and Triads
| Author | Country | Population | Mean Age (≥65) | # of CCs | # of Clusters | Description of Chronic Disease Clusters |
|---|---|---|---|---|---|---|
| Legend: # of CCs, number of chronic conditions categories studied; # of clusters, the number of chronic condition clusters observed by researchers; Description of chronic disease clusters, how authors characterized the chronic condition clusters they observed. | ||||||
| CMS Chartbook 2012 | U.S. | Medicare Patients | Yes | 15 | Dyads
Triads
(Most prevalent clusters listed) | |
| Fried et al. (a) 2012 | U.S. | Adult Civilians | No | 9 | 3 | Dyads
|
| Fried et al. (a) 2012 | U.S. | Adult Civilians | Yes | 9 | 3 | Dyads
|
| Kronick et al. (2007) | U.S. | Medicaid Patients | No | 20 | 5 | Triads
|
| Lochner et al. (a) 2013 | U.S. | Medicare Patients | No | 15 | 5 | Dyads
Triads
(Two most prevalent clusters listed by sex) |
| Lochner et al. (b) 2013 | U.S. | Medicare Patients | Yes | 15 | 5 | Dyads
Triads
(Two most prevalent clusters listed by sex) |
| Machlin & Soni 2013 | U.S. | Adult Civilians | No | 20 | 12 | Dyads Hypertensions & hyperlipidemia
Triads
(Most prevalent clusters listed) |
| Schoenberg et al. 2007 | U.S. | Adult Civilians | Yes | 8 | 7 | Dyads
Triads
(Most prevalent clusters listed) |
| Steinman et al. (2012) | U.S. | VA Patients | Yes | 23 | 30 | Triads
(Two most prevalent clusters listed by sex) |
The second methodological approach that has been used to study patterns of chronic disease combinations and MCC is cluster analysis. Cluster analysis is a type of statistical approach that groups relatively homogenous or similar patients into clinically relevant groupings based on calculated correlations between diagnoses. Cluster analysis is a relatively “novel” statistical method and as a result, specific methods employed vary significantly across studies. For example, researchers have used techniques such as agglomerative hierarchical clustering, factor analysis, and multiple correspondence analysis, among other approaches, to examine correlations between diagnoses. The variability in these approaches makes it difficult to interpret chronic condition clustering research, as differences in analytic approach may influence results.
The number of chronic disease clusters vary by study, reporting anywhere from three to thirty clinically significant chronic disease clusters or patterns that warrant attention or further investigation (Schafer et al. 2010 & Steinman et al., 2012). In a study by Prados-Terros and colleagues, five patterns of chronic disease clustering were observed in a primary care population: cardio-metabolic, psychiatric-substance abuse, mechanical-obesity-thyroidal, psychogeriatric, and depressive disorders (Prados-Torres et al., 2012). Similarly, John and colleagues found four clusters among a rural community-dwelling population which included cardiopulmonary, sensory-motor, depressive and arthritic disorders (John et al., 2003). As shown in Exhibit 7, the majority of chronic condition clusters include diagnoses related to cardiovascular, metabolic, neurological and mental health conditions, which are common conditions. Low-prevalence chronic disease combinations that would be found in the “long tail” have not been reported as outputs of cluster analysis studies to-date.
To-date studies on chronic condition clusters have primarily been conducted outside of the United States, in countries such as Sweden, Spain and Germany. The international tendency speaks to the quality and granularity of data available in the United States compared to other countries. European countries in-particular have more standardized and robust healthcare data infrastructures compared to the United States (OECD, 2013).
Exhibit 7: MCC Research Studies Using Cluster Analysis by Author
| Author | Country | Population | Mean Age (≥65) | # of CCs | # of Clusters | Description of Chronic Disease Clusters |
|---|---|---|---|---|---|---|
| Legend: # of CCs, number of chronic conditions categories studied; # of clusters, the number of chronic condition clusters observed by researchers; Description of chronic disease clusters, how researchers characterized the chronic condition clusters they observed. | ||||||
| Garcia- Olmos et al. (2012) | Spain | GP Patients | No | n/a | 4 |
|
| John et al. (2003) | U.S. | Community- resident American Indians | Yes | 11 | 4 |
|
| Marengoni et al. (2009) | Sweden | Stockholm Community Members | Yes | 15 | 5 |
|
| Newcomer et al. (2011) | U.S. | KPCO Insurance Members | No | 17 | 10 |
|
| Prados- Torres et al. (2012) | Spain | Primary Care Patients | No | 264 | 5 |
|
| Schafer et al. (2010) | Germany | Ambulatory Care Patients | Yes | 46 | 3 |
|
Although chronic condition clustering and co-occurring conditions research is relatively new, it is a promising means by which to study patterns of chronic disease combinations and the full complexity of disease in various populations. However, the variability in analytic methods used to study co-existing MCC (e.g., dyads, triads, cluster analysis) make the results of these studies difficult to interpret and generalize to other populations. Also, clustering research has primarily been conducted on chronic conditions that are prevalent and/or aggregated into large groups (e.g., all cancers and mental illness); studies have not reported “long tail” distributions of potential disease clusters.
Less Prevalent Combinations of MCC
Little MCC research has focused on studying the numerous less prevalent combinations of MCC. However, two recent studies have addressed how less prevalent chronic disease combinations are cumulatively associated with healthcare costs. Sorace and colleagues used the Hierarchical Condition Categories (HCC) model to group conditions and found that Medicare beneficiaries could be classified into three distinct groups according to their chronic condition combinations: 1) patients who didn’t have chronic conditions as defined by the HCC model, 2) patients belonging to the 100 most prevalent chronic disease combinations, and 3) patients belonging to the remaining two million possible disease combination categories (Sorace et al., 2011). They found that approximately one-third of beneficiaries could be classified into each group, but that 79% of expenditures were associated with the third group of beneficiaries who had one of two million possible disease combinations. The authors concluded that the majority of Medicare expenditures can be attributed to a complex group of patients with less prevalent combinations of MCC; this results in a “long tail” distribution as displayed in Exhibit 8. In interpreting Exhibit 8, the reader should note that as there are over 2 million disease combinations calculated by this methodology, the figure’s X-axis would need to be extended over 8,000 fold to the reader’s right before both the expenditure and the population cumulative lines reached 100%. A follow-up study confirmed this complexity and found that national distribution of disease combinations changed over time (Sorace et al., 2013).
Exhibit 8: Percent of Disease Prevalence and Cost in the Beginning of Medicare’s Long Tail
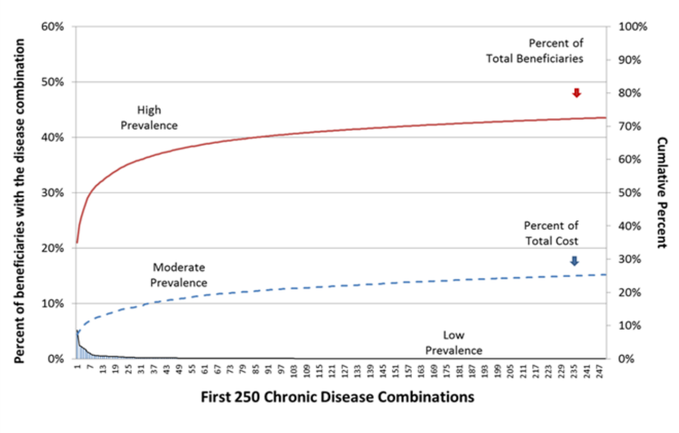
Note on the Exhibit: The exhibit displays the first 250 Disease Combinations (ranked by prevalence) from the baseline HCC analysis as calculated by Sorace and colleagues (Sorace et al. 2011). Chronic disease combination classifications ( e.g., high, moderate and low) represent rough approximations; specific criteria for each classification have not been defined. Note that the left Y-axis represents the proportion of the population that is included in each unique disease combination, and is adjusted for the 32% of beneficiaries and 6% of expenditures that are associated with the no-MCC population. The right Y-axis represents the cumulative percent of the total population (red format) and the total expenditure (blue format). Note that approximately 75% of expenditures are associated with the 27% of patients that are not represented by the most prevalent 250 disease combinations. As there are over 2 million disease combinations calculated by this methodology, the figure’s X-axis would need to be extended over 8,000 fold to the reader’s right before both cumulative lines reached 100%.
There are two important concepts to be gleaned from these findings. First, the issue of “small cell size” limits the ability to intervene on or study a substantial number of patients with similar diagnoses. For example, given that approximately 65% of the over 32,000,000 beneficiaries studied had one of over 2,000,000 disease combinations the average cell size for a disease combination is in the range of 10 to 11 beneficiaries nationally.
The second important concept that can be learned from Sorace and colleagues is that healthcare costs for MCC patients with low-prevalence chronic disease combinations are significantly higher than those costs for patients with high prevalence combinations. As can be seen from Exhibit 8 approximately 75% expenditures are associated with the 27% of patients that are not represented by the most prevalent 250 disease combinations. To effectively address healthcare costs associated with MCC patients, efforts focused on patients with low-prevalence disease combinations must also be considered.
Finally it is important to note that the degree of complexity presented in Exhibit 8 is based on the observed frequency of disease combination phenotypes alone and does not include demographic traits ( e.g., sex, age, and race) or biological variables such as genomic variation. These additional variables may also be important in a given individuals health care plan.
Overall, research on less prevalent combinations of MCC represents a change in thinking from studying highly prevalent chronic diseases to understanding chronic disease complexity at a much more granular level ( e.g., the “long tail” distribution). Although other researchers have verbally confirmed similar research findings, Sorace and colleague’s work remains the only published literature on low-prevalence combinations of MCC the authors are aware of to-date. In the sections that follow, methodological considerations for MCC research are discussed with a special emphasis on the implications for conducting research on low-prevalence combinations of MCC.
6. Methodologies and Analytic Techniques (Study Question #2)
What methodologies and analytic techniques have been used to study MCC? What are the potential limitations of these approaches in considering less prevalent combinations of MCC?
In the section below we discuss the methodological and analytic concepts to consider when conducting MCC research, with a special emphasis on less prevalent combinations of chronic conditions. We discuss the methodologies and analytic techniques that have been used to conduct MCC research to-date, the potential strengths and limitations of these approaches and how they relate to studying less prevalent combinations of MCC.
Defining Diagnosis of Chronic Condition
There are two main sources of information about patients’ chronic conditions: 1) surveys that collect self-reported disease status, and 2) claims and clinical systems that contain diagnosis codes (e.g., International Classification of Disease, 9th edition [ICD-9], ICD-10, Systematized Nomenclature of Medicine Clinical Terms [SNOMED CT]). Other sources of information, such as pharmaceutical prescription or laboratory data, can also be used to identify patients’ chronic conditions. However, these additional modalities are not thoroughly discussed in this paper.
MCC research has been conducted using both primary sources of diagnostic information noted above. For example, Schoenberg and colleagues analyzed Health and Retirement Study (HRS) data to understand the relationship between chronic disease constellations and out-of-pocket medical expenditures. In the study, chronic conditions were identified using eight self-reported chronic conditions from the HRS (Schoenberg et al. 2008). Similarly, Bae and Rosenthal used 177 ICD-9 codes derived from self-reported chronic conditions from the Medical Expenditure Panel Survey to study MCC and quality of care (Bae & Rosenthal, 2008). Conversely, Sorace et al., used approximately 3,000 ICD-9 codes derived from the HCC model to study the complexity of disease combinations in the Medicare population (Sorace et al., 2011).
There are strengths and weaknesses of self-reported versus claims-based information for identifying chronic conditions (See Exhibit 9). Claims-based diagnosis codes allow researchers to study a large number of chronic conditions at a very fine level of granularity and to understand the full range of patients’ diagnoses, including which specific diagnoses are present ( e.g., primary malignant neoplasm of the lung or carcinoma in situ of the lung vs. simply lung cancer). Sensitivity is critically important in enabling the study of less prevalent or rare chronic disease combinations. Claims are usually provider-generated and based on a differential diagnosis and supporting clinical documentation, eliminating potential error associated with patient self-reported information and other survey-related biases, such as recall and selection concerns. However, there are systematic limitations associated with ICD-9 codes, such as misspecifications, unbundling, and upcoding by providers and coders (O’Mailley et al., 2005). There is also a tendency for providers and billers to under-report diagnoses that lack payment incentive, such as mental health conditions. These issues can lead to inaccurate estimates of chronic disease prevalence and imprudent results. Diagnosis coding using ICD-9 and ICD-10 codes has also been shown to misestimate the prevalence of certain conditions.
Exhibit 9: Strengths and Weaknesses of Self-Reported versus Claims-Based Chronic Conditions
| Coding Type | Strengths | Limitations |
|---|---|---|
| Self-Report | Easy to collect, used to identify prevalent conditions, patient-derived. | Subject to recall, sampling and selection bias. Few diagnoses studied and at a coarse level of granularity. Limited number of patients surveyed/studied. |
| ICD-9 | A large number of diagnoses are considered at a fine level of granularity. Commonly used in the United States. Used in large administrative databases; large sample size. | There are a number of well documented limitations, such as over and underestimation of certain diseases, as well as inaccuracies due to malicious coding behavior |
| ICD-10 | Associated with improved coding accuracy. Greater number of diagnoses considered and at a more granular level. Used in large administrative databases; large sample size. | Not in widespread use in the United States and won’t be for a number of years. Limited research available on coding inaccuracies and other shortcomings. |
| SNOMED CT | Greatest number of diagnosis codes considered at the finest level of granularity. | Limited research available on coding inaccuracies and other shortcomings. Potentially too granular for use in certain healthcare settings. |
Underestimation is a concern when a significant proportion of the population may not have a claim during the study period; overestimation may occur for conditions that lead to higher payment rates if they are reported as being present. Woo et al. found that obesity identified by discharge ICD-9 codes underestimated the true prevalence of obesity in an inpatient pediatrics population (Woo et al., 2009), while Kern et al. found that ICD-9-CM codes failed to identify the majority of veteran patients with comorbid chronic kidney disease (Kern et al., 2005). ICD-10 codes have also been shown to overestimate the prevalence of certain diagnoses, such as post-traumatic stress disorder (Rosner & Powell, 2009). However, recent evidence suggests that the introduction and use of ICD-10 coding may be associated with improved accuracy of co-morbidity coding for the majority of clinical conditions (Januel et al., 2011). It is unclear whether the improvement is due to the ICD-10 coding system itself or changes in coder and physician behavior.
Self-reported diagnoses from surveys or those that are mapped to ICD-9 or ICD-10 codes from surveys provide a much smaller number of chronic conditions for analysis, at a very coarse level of detail. Typically surveys do not include the breadth of chronic conditions a patient has or the specific types of chronic conditions (e.g., a specific type of cancer). For example, the HRS only allows researchers to investigate eight chronic conditions (hypertensions, diabetes, cancer, chronic lung disease, heart conditions, arthritis, stroke and psychiatric/emotional problems) and it does not allow them to drill down to what specific types of conditions a patient has (e.g., what type of cancer?). Thus, the use of surveys limits the ability to understand the true complexity of chronic disease combinations a patient is experiencing as well as the occurrence of less prevalent chronic conditions. In addition, self-reported diagnoses can be limited due to survey-related biases, such as recall, ascertainment and selection bias. For example, those individuals who avoid or who do not have access to healthcare may not be evaluated for potential chronic conditions of interest. Although evidence suggests that self-reported chronic conditions may be reasonably valid (Martin et al., 2000), self-reported diagnoses are not provider generated, may be subject to recall error by patients, and may not be captured in a sufficiently structured and systematic manner for analysis. Biases in self-reported diagnoses may be reduced through survey question structure; many surveys typically ask patients, “Has the doctor told you….?”. Overall, self-reported conditions can lead to non-uniform and inaccurate diagnosis categories and errors when mapping self-reported information to ICD-9 or ICD-10 codes.
In addition to the considerations described above, it is also important to note that validity of the presence of chronic conditions and reliability of reporting/detecting chronic conditions are two key issues that challenge MCC research. Researchers have attempted to improve validity by examining diagnoses across care settings and determining if patients have two or more claims reporting a specific diagnosis code over a given period of time to confirm disease occurrence. However, validity and reliability will remain a challenge given the vastness and complexity of many of the large databases and systems used to collect and analyze diagnostic information.
It is important to recognize that the trajectory of diagnosis coding in the United States is moving away from ICD-9 codes and towards larger, more detailed coding schemes, such as ICD-10 and SNOMED. In fact, on January 16th, 2009 the Department of Health and Human Services published a final rule specifying an anticipated ICD-10 implementation date of October 1, 2013 (although this may be delayed). The World Health Organization (WHO) has already begun work on developing ICD-11. It is inevitable that diagnosis coding will continue to become more refined over time, providing researchers with the ability to study disease complexity at a level of detail not currently possible. Although “new” coding schemes will improve our ability to identify specific diagnoses of individuals with MCC, they will have some limitations.
The transition from ICD-9 to ICD-10, as well as to other future coding schema, will present challenges to researchers. During coding transition periods back-coding ICD-10 codes to ICD-9 and forward-coding ICD-9 codes to ICD-10 will be necessary for longitudinal analyses and comparative investigations. ICD-9 based indexes and measures, such as the Charlson Comorbidity Index and AHRQ’s Patient Safety Indicators, will also need to be translated to ICD-10 systems to support their continued use. There may be a “lag time” associated with re-specifying these tools, which researchers will need to be aware of. Additionally, there will most likely be a “testing” period after new coding systems are implemented, as researchers will need to explore the nuances and limitations of new systems prior to conducting analyses (Iezzoni, 2010). Researchers may also need to observe a data “black out” period as clinicians learn, perfect and then settle into new coding behaviors associated with the transition to ICD-10 (Januel et al., 2011). This “black out” period may also be needed by individual health systems and providers. The transition from ICD-9 to ICD-10 in the United States will not be smooth and universal. Health systems and providers will “go live” with ICD-10 at various points in time with different levels of success.
Despite the challenges, more refined coding systems will greatly enhance our ability to conduct research on less prevalent combinations of MCC. New coding systems will provide a very detailed level of diagnostic information.
Data Aggregation and Grouping Systems
Grouping systems, such as AHRQ’s clinical classification system and CMS’s Hierarchical Conditions Categories, are used to organize and aggregate diagnosis codes into different disease categories. These systems serve a variety of different purposes (e.g., research, risk-adjustment, etc.) and vary significantly in terms of which clinical conditions are considered and the number of diagnosis codes that are included in each disease group, as well as the number of groups (See ICD-9 Comparison Excel File). Regardless of their original intent or grouping methodology, however, many different types of grouping systems have been used to conduct MCC research, raising concerns about interpreting research results and comparing findings across MCC studies.
The decision to use specific grouping systems for MCC research should be informed by four key considerations: 1) the function, purpose and original intent of the grouper, 2) the behavior change that is desired by using the grouper to produce actionable information, 3) the end-users and their data needs ( e.g., data granularity), and 4) the research question. Researchers should not assume that a grouping system designed by and for one stakeholder group for one purpose is appropriate for another purpose. In fact, none of the currently available groupers are meant to serve multiple purposes (e.g., clinical decision support and risk-adjustment). Grouping systems are carefully designed and statistically calibrated to serve a specific aim. Using a grouping system for a different aim than intended can lead to meaningless results and misguided interpretation. MCC research which aggregates diagnosis codes should use grouping systems that are well documented, produce useful information for end-users (e.g., fine granularity for clinical decision support), and provide information that is meaningful, actionable and promotes provider behavior change (e.g., to reduce cost or improve care for specific groups). Grouping systems should be in alignment with the research questions at hand; research questions should ultimately drive MCC research designs (Wallace & Salive, 2013).
In choosing which grouping system to use for MCC research, stakeholder agendas matter. Each stakeholder group needs different types of information at varying levels of granularity. For example, those interested in clinical decision support needs a finer level of diagnostic information than risk-adjusters. Similarly, healthcare economists may need more detailed data than public health interventionists. Thus, it is important to consider the degree of coding granularity needed by each stakeholder. Understanding which stakeholder aims can be supported at specific levels of diagnostic granularity may be a beneficial area for investment for MCC researchers.
To determine which clinical classification systems exist and have been used for MCC or disease complexity research, a comprehensive grouping systems review was conducted. Grouping systems were identified through the literature review as well as input form the Co-Project Officers, TAG and key informants. Full descriptions of each classification system and the methodological issues to consider when using the grouper can be found in Appendix C. A condensed version of the results is shown in Exhibit 10 below.
Exhibit 10: Summary of Diagnostic Grouping Systems
| Grouping System | Sponsor | Level of Diagnosis Aggregation | Number of ICD-9 Codes Included |
|---|---|---|---|
| Legend: Sponsor: agency, organization or company that maintains the grouping system; Level of Diagnosis Aggregation: the number of chronic condition categories included in the grouping systems; Number of ICD-( Codes: Grouping systems that are proprietary do not make ICD-9 codes available for public review | |||
| Adjusted Clinical Groups Case-mix System (ACG) | Johns Hopkins University | 102 discrete categories | Proprietary |
| Aggregated Diagnosis Groups (ADG) | Johns Hopkins University | 32 discrete categories | Proprietary |
| All Patient Refined Diagnosis Related Groups (APR-DRG) | 3M Health Information Systems | 314 base categories and 1256 subclasses | Proprietary |
| Chronic Conditions Data Warehouse Algorithm | Centers for Medicare & Medicaid Services | 27 chronic condition categories | 581 |
| Chronic Illness Disability Payment System (CDPS) | University of California, San Diego/Medicaid Programs | 96 categories of diagnoses that correspond body systems and specific diagnoses | 11603 |
| Clinical Classification System (CCS) | Agency for Healthcare Research & Quality | 285 mutually exclusive categories | 14567 |
| Clinical Risk Groups (CRG) | 3M Health Information Systems | 272 clinically-based categories and 1,080 subclasses | Proprietary |
| Diagnosis Related group (DRG) | Centers for Medicare & Medicaid Services | 538 categories | Not Specified |
| Dyani Diagnosis Grouper | Axiomedics Research, Inc. | 200-300 categories depending on the criteria being examined | Proprietary |
| Hierarchical Condition Categories (HCC) | Centers for Medicare & Medicaid Services | 70 CMS-HCC categories | 2916 |
| International Shortlist for Hospital Morbidity Tabulation (ISHMT) | World Health Organization | 130 categories | Not Specified |
| Major Diagnostic Categories | Health Level Seven International | 25 categories | Not Specified |
| Medicare Severity Diagnosis Related Grouper (MS-DRG) | 3M Health Information Systems | 745 categories | Proprietary |
| Thomson Medstat Medical Episode Grouper | Thomson Medstat Inc. | 550 disease conditions | Proprietary |
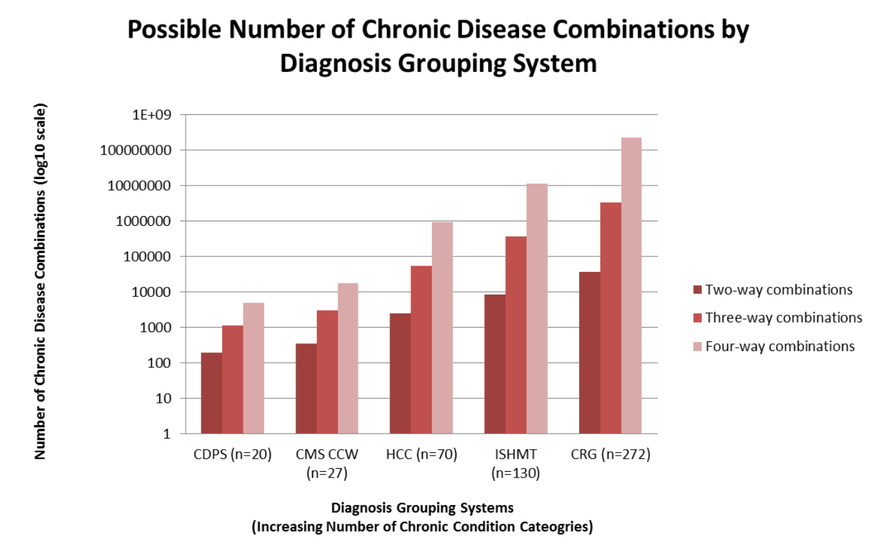
We reviewed fourteen grouping systems which were found to serve a variety of different purposes ranging from risk adjustment to comparing morbidity across hospitals internationally. The grouping methodologies of the systems are remarkably different and vary in level of complexity. For example, diagnosis aggregation ranged from 25 categories for the Major Diagnostic Categories to 272 clinically-based groups with 1,080 subclasses for 3M’s Clinical Risk Groups. The difference has a dramatic consequence for the number of disease combinations that can be explored by researchers because the number of combinations (without replacement) scales as per the following formula: C(n,k)=n!/k!(n-k)! (Ammann 2011). In this formula “C” is the number of disease combinations, “n” is the number of disease groups in the grouping system, “k” is the number of disease groups included in the calculation, and “!” stands for factorial. Applying the formula to the Chronic Illness Disability Payment System (CDPS) for two-way disease combinations would result in the following calculation: C(n,K)=20!/(2!)*(18!); or 190 disease combinations could be studied. Using the same formula, but with three-way and four-way combinations, the CDPS model would provide 1,140 and 4,845 disease combinations respectively.
As shown in Exhibit 11 (logarithmic scale), the number of disease combinations for analysis increases rapidly as the number of chronic condition categories and number of diseases that are included in the combinations are increased. Thus, grouping systems with more chronic condition categories (greater “n”) will generate more chronic disease combinations (“C”) for analysis, especially when the number of diseases allowed in the disease combination calculation (“k”) is not truncated at an arbitrary level (i.e. calculate dyads or triads and then truncate at four or more diseases).
The number of diagnosis codes included in each grouping system could not be evaluated across all systems because the information is proprietary for privately owned grouping systems. The lack of transparency represents a methodological limitation and bias for researchers, as they cannot know which diagnoses were included in analyses and therefore assess the level of complexity captured by the grouping system. Despite their differences, the majority of groupers have been used in some form of multimorbidity research to-date. For example, Sorace and colleagues used the HCC model to study complexity in Medicare patients, while Salisbury and colleagues used John’s Hopkins ACG system to study general practice patients and Steinman and colleagues used the CCS to study VA patients (See Exhibit 5 in Section 6).When interpreting published MCC literature as well as designing future MCC research, the methodological differences between grouping systems should be reviewed and considered. For example, grouping systems that provide the finest level of diagnostic information and the greatest number of chronic condition categories, such as AHRQ’s CCS, would be most appropriate for research on less prevalent chronic disease combinations.
Exhibit 11: Possible Number of Chronic Disease Combinations by Diagnosis Grouping System
It is also important to note that many MCC researchers have designed and employ their own groupers or modify an existing grouper which affects the methodological quality of results. Decisions to include, exclude or aggregate diagnoses often are not reported in author’s methodology sections. Authors may state that the decisions were guided by physician consensus or technical expert panels, but do not list specific diagnosis codes that were included or excluded. The impact of grouping algorithms on other analysis steps and how they may affect the interpretation of results are also missing from studies. For example, authors do not discuss how costs are allocated to disease categories after eliminating certain diagnosis codes from analyses, nor the percentage and types of patients that are excluded from a study.
Consequently, researchers are creating unique diagnostic categories that may be fundamentally different from one another making it difficult to interpret how one researcher’s disease category for “cancer” compares to another. If researchers utilized publicly available, well documented grouping systems (standardization) such as AHRQ’s CCS, the challenges of interpreting results across studies would be minimized. However, it is not practical and may not make clinical sense to use only publicly available grouping systems. For example, some diagnosis codes may warrant exclusion from analyses because they are ambiguous (physician consensus does not yet exist on the diagnostic criteria for a particular condition) and over time grouping systems will become obsolete as new coding systems are adopted ( e.g., ICD-10) and new, more robust groupers are developed. Regardless of the future of grouping systems in MCC research, providing researchers and readers with the ability to understand how disease categories are constructed across studies will help make methodologies more transparent and results more interpretable.
Study Designs and Analytic Methods
As discussed above, most studies examine chronic conditions with the highest prevalence, costs, utilization, hospitalizations, and adverse events. For example, to study chronic disease prevalence in male Medicare patients, Black and colleagues limited their analyses to the “top ten” most prevalent diseases (Black et al., 2007). Other researchers have examined a somewhat larger number of conditions, but have purposely excluded less prevalent diseases (Schafer et al. 2010). It is critical to take the number of chronic conditions being investigated into account because prevalence estimates of multimorbidity are dependent on the number of diseases that are examined. This limitation was recently discussed by Salive, who found a prevalence estimate of 17.1% for 25–44 year old primary care patients when considering a list of seven conditions, and 73.9% when considering all possible conditions (Salive, 2013). Similarly, Fortin and colleagues found prevalence estimates of 47.3% among 45–64 year old primary care patients when considering seven conditions, and 93.1% when considering an open list (Fortin et al., 2010). Schneider and colleagues found that over 20% of Medicare beneficiaries had two or more chronic conditions when using the CMS Chronic Conditions Warehouse and a list of nine potential diseases, (Schneider et al., 2009). A considerably larger figure (52%) was reported for Veteran Affairs (VA) patients when almost triple the number of potential diseases (29 conditions) was considered (Yu et al., 2003). Thus, MCC prevalence can be under-estimated when fewer chronic conditions are investigated.
In addition to the number of chronic conditions that are studied, the specific types of chronic conditions that are examined across studies differ (e.g., cardiovascular conditions are studied vs. all possible chronic conditions). The “filtering” phenomenon can be observed when comparing a list of the chronic conditions that are investigated in two separate studies. For example, comparing the chronic conditions that were studied by Newcomer and colleagues (2011) (17 chronic conditions) to Chen and colleagues (2011) (8 chronic conditions), only three conditions were found to overlap. Although prevalence estimates for single conditions may be comparable across different data collection systems and surveys (Li et al., 2012), multimorbidity prevalence estimates across studies that include different conditions complicated the interpretation, generalizability and comparability of results.
MCC research has been conducted using a variety of different study designs (See Exhibit 12). However, the majority of MCC studies used retrospective cohort and cross-sectional designs, including secondary data analyses of data, due to the need for large sample sizes. It is important to note that these study designs have systematic limitations. For example, although retrospective cohorts are longitudinal and usually contain information on a large number of patients, they are often subject to attrition bias and bias due to changes in data collection procedures over time. This is an important concern for MCC studies, as prevalence estimates may be directly impacted by changes in data collection procedures, for example sampling strategies that change in terms of periodicity and population observed over time. Similarly, cross-sectional designs are not longitudinal and provide a “snap-shot” of information at one point in time. Future MCC research may benefit from employing longitudinal, prospective studies that provide researchers with large sample sizes, but also the ability to appropriately assess potential biases and study limitations as they occur. Preferred study designs for research on less prevalent combinations of MCC produce large sample sizes, are longitudinal, and provider researchers with the ability to assess the accuracy of diagnostic coding over time. Therefore, large prospective cohorts are advantageous for research on less prevalent combinations of MCC, although they are usually very expensive. The research questions that need to be answered may also dictate which study designs are most appropriate for certain MCC studies.
Exhibit 12: MCC Study Designs and Considerations
| Author | Study Designs | Design Considerations |
|---|---|---|
| Ben-Noun 2001 | Case-Control | Small sample size, prone to recall/retrospective and selection bias, suited for rare conditions. |
| Salisbury et al. 2011 | Retrospective Cohort | Large sample size, prone to attrition bias, potential unknown coding practices and changes in data collection method, longitudinal. |
| Shelton et al. 2000 | Prospective Cohort | Large sample size, prone to attrition bias, known methodology changes, potential for missing data, longitudinal, highly expensive. |
| Wolff et al. 2002 | Cross-sectional | Large sample size, not longitudinal, cannot measure changes over time, cannot draw causal inferences, descriptive in nature. |
| Yu et al. 2003 | Secondary Data Analysis | All type of sample sizes, potential unknown coding practices and data anomalies. |
Other important considerations for MCC research are the limitations of the databases and algorithms used to house and analyze chronic conditions data. Over and underestimation of chronic disease prevalence may be due to database-specific characteristics. For example, the CMS Chronic Conditions Warehouse algorithm, which is used to estimate chronic disease prevalence, has been shown to underestimate the prevalence of chronic conditions requiring less frequent healthcare utilization, such as arthritis (Gorina & Kramarow, 2011). The underestimation is due to the fact that the reference period (or look back period) used in the CCW algorithm does not go back far enough to capture diagnoses that were reported on early healthcare claims and not on more recent claims. Setting (e.g., inpatient, nursing home, etc.) and other database characteristics also impact prevalence estimates and the interpretation of multimorbidity. For example, Schram and colleagues (2008) found that multimorbidity prevalence significantly varied across settings, from 22% in the inhospital setting to 82% in nursing homes. As expected, given the inherent differences between these populations, Fortin and colleagues (2010) found that MCC prevalence was much smaller in a general civilian population compared to family practice patients. In addition to the effect of “setting” on chronic disease prevalence estimates, Schram et al. (2008) also concluded that prevalence estimates are dependent on the number of chronic conditions being studied, the data collection method used to capture diagnosis information (i.e., ICD-9 vs. survey) and the time-frame being investigated, similar to the concerns raised by Gorina and Kramarow with the CCW’s look back period.
Database comprehensiveness, sampling frame and the patient population being studied all affect results. In drawing conclusions about analyses conducted on CCW data or AHRQ’s National Inpatient Sample (NIS) data, it is important to know that the CCW covers all Medicare patients, while the publically available version of the NIS covers only 20% of hospital discharges. Understanding these types of database characteristics will help researchers interpret the generalizability of their findings. The fact that the occurrence and clustering of MCC is time-dependent as patients grow older means that longitudinal datasets are best positioned to accumulate a patient’s chronic conditions over time and provide more accurate estimates of disease prevalence than cross-sectional assessments (France et al., 2011 & Wong et al., 2011). Time-dependency is an especially important concept for research on less prevalent combinations of MCC, as less common diseases are more likely to manifest over a long period of time, and diseases have different durations. Cross-sectional studies and analyses of longitudinal datasets covering limited time periods may not contain sufficient diagnostic information to study less prevalent combinations of MCC. Database size is important for research on less prevalent combinations of MCC. Large administrative datasets provide the best option due to the sheer volume of data and number of patients available for study. Less prevalent combinations of MCC are less likely to occur in small datasets with a limited number of patients and diagnoses to consider. Rare disease researchers face similar challenges.
Longitudinal databases have limitations. First, false discoveries and associations between chronic disease on the basis of too few observed diagnoses, inconsistent findings, and multiple test corrections need to be addressed (Wong et al. 2011). Additionally, the further back in time you examine longitudinal claims, the less accurately you can predict resource use and cost for a given condition or combination of conditions because of changing illness intensity over time. Although large administrative databases provide useful, current information on financial burden of disease (Riley, 2009), to more accurately predict resource use and cost, researchers need to know which diagnoses are “active” for patients currently receiving care. A laundry list of diagnoses is of little utility without a way to identify “active” conditions. Many patients will have ICD-9 codes on their past claims that represent errors, unconfirmed suspected diseases, and conditions that have been cured or are in remission. “Non-active” ICD-9 codes captured in longitudinal databases can negatively impact predictions of resource use and cost associated with MCC. Solutions may include an active problem list for patients and/or the use of supplemental data ( e.g., pharmacy and laboratory data) to confirm “active” diagnoses.
The challenges associated with conducting research on less prevalent MCC are very similar to those faced by researchers of rare diseases. Within the United States, a disease is considered to be rare when it affects less than 1 in 1000 individuals. Thus, like researchers studying less prevalent MCC, rare disease researchers are limited by small patient sample sizes and the inability of data sources to collect information on rare diagnoses, making it difficult to design clinical trials and test new treatments. In a research environment constrained by limited resources, rare disease research is given lower priority than conditions affecting more individuals (Griggs et al., 2009 & Ragni et al., 2012). It is important to consider that while any given rare disease by definition does not represent a prevalent illness, there are many rare diseases that may cumulatively affect a significant segment of the population. Finally, the likelihood of coding a rare chronic condition as a mistake may be similar to the likelihood of a patient truly having a rare disease and having this diagnosis coded accurately on a claim. Although not well studied, both research on rare diseases and research on less prevalent combinations of MCC may suffer from difficulty assessing validity.
Lastly, it is important to recognize that traditional statistical approaches may not be applicable to research on low-prevalence MCC. The issue of multiple comparisons is highly relevant for MCC research due to the number of chronic disease combinations that can be considered in the long tail. In fact, there are almost as many chronic disease combinations as there are patients. For example, if working at the three digit ICD-9 code level with approximately 1,000 diagnosis codes, about one-million pair wise comparisons would be possible. In this case, correcting for multiple comparisons using the Bonferroni method would require p-values of less than 0.00000005 to be significant. To understand the differences between low-prevalence MCC new or modified statistical approaches may need to be considered to address the multiple comparison limitation.
Reporting of MCC Research Methods
The amount and level of methodological detail published in MCC research papers varies greatly. Lack of consistency and detail regarding inclusion and aggregation of diagnosis codes hinders our ability to interpret research results and judge methodological quality. For example, in a manuscript describing chronic disease clustering, Schafer and colleagues provide a list of the specific ICD-10 codes they investigated in their study (Schafer et al., 2010). Conversely, in a paper looking at prevalence of chronic conditions in the VA Health Care System, Yu and colleagues did not report the ICD-9 codes that were examined. Instead the authors stated that “the diagnoses and specific codes used to identify each condition are available upon request from the authors” (Yu et al., 2003). For the purpose of developing this paper, we contracted Yu and his colleagues to obtain the list of the diagnoses and ICD-9 codes used in their study. Unfortunately, we were unable to reach the lead author and could not obtain the information.2 However, an inquiry regarding a different, but related investigation (Yoon et al., 2011) resulted in a list of diagnoses and ICD-9 codes (in SAS) that could be examined and compared to other studies.
A lack of consistency and detail in reporting diagnosis codes is only one example of the variability in methods sections in published MCC studies. Variability is also a concern in understanding why specific conditions are examined vs. others, why certain diagnosis codes are excluded from analyses, how chronic condition categories are constructed, how costs are allocated to chronic condition categories after dropping certain diagnosis codes, etc. A repository of author’s ICD-9 codes is a potential mechanism by which authors could explain why certain diagnosis codes were included or excluded from specific analyses. However, to effectively address the variability across MCC studies a reporting framework or set of criteria, such as the Preferred Reporting Items for Systematic Reviews and Meta-Analyses (PRISMA), may be necessary to begin to standardize efforts and reporting across researchers (Moher et al., 2009).
2 Personal communication with available authors of Prevalence and Costs of Chronic Conditions in the VA Health Care System in Medicare Care Research and Review, 2003.
7. Data Systems and Datasets Review (Study Question #3)
What data systems and data sets exist that can be analyzed to better improve HHS’s understanding of and approaches to addressing numerous less prevalent combinations of chronic conditions? To answer the question we conducted a comprehensive review of data systems and datasets that were identified through the literature review, as well as input from the Co-Project Officers, TAG and key informants.
Overall, 17 data sources were reviewed and specific criteria were used to evaluate the appropriateness of each data source for use in less prevalent MCC research. The full data systems and datasets review is contained in Appendix B. A small set of excerpted data are shown in Exhibit 13.
Exhibit 13: Excerpt of Data Systems and Datasets Review
| Data Type | Description | Less Prevalent MCC Research Considerations |
|---|---|---|
| Medicare Claims |
|
|
| HCUP Data |
|
|
| Medicaid Data |
|
|
| Survey/ Questionnaire Data |
|
|
| Other |
|
|
As discussed above, in general, research on less prevalent combinations of MCC can be most appropriately conducted using Medicare Claims, Medicaid Claims or HCUP data. These data sources are nationally-representative, longitudinal to capture the accumulation of diagnoses over time and contain a fine level of diagnostic codes. Other healthcare claims-based datasets such as state all-payer claims registries or Veteran Affairs data, are also good sources although they would not produce nationally-representative results and may be generalizable only to the specific populations included.
Survey or questionnaire data, while useful for certain types of MCC research, are limited because they include a small, select list of chronic conditions; typically not less prevalent conditions. Furthermore, diagnosis information from these data sources is often at a gross level of detail that inhibits the ability to study specific chronic conditions. For example, the Behavioral Risk Factor Surveillance System asks respondents about 15 conditions: myocardial infarction, coronary heart disease, skin cancer, other cancer, chronic obstructive pulmonary disease, depression, kidney disease, vision impairment, diabetes, and HIV/AIDS (CDC, 2011). Not only is the list not comprehensive, it also doesn’t capture information on the specific type of condition (i.e. what specific mental illness or cancer does the person have?). There is also the issue of respondents not specifying all of the chronic conditions they may have when interviewed or surveyed perhaps due to reluctance to divulge a specific condition. To ensure completeness, major national surveys were included in our review.
To enhance data richness and the ability to understand drivers of healthcare cost in addition to diagnostic information, researchers are able to link or match many of the datasets contained in our review. For example, Health and Retirement Study data can be linked with Medicare claims to better articulate the relationship between patient medical history, financial status, age, diagnoses and healthcare costs (ResDAC, 2013). Although data linking may improve data quality and robustness for specific variables, most linked datasets will not be advantageous for research on low-prevalence MCC due to small sample sizes and limited diagnostic information. However, these types of linked datasets may be an important source of information for future study on more prevalent chronic disease combinations. Linking claims to other Medicare data sources is one way to overcome limitations related to small sample sizes. For Medicare beneficiaries who are nursing home residents, linking Medicare claims data to the Minimum Data Set (MDS) assessment tool is possible. The MDS is part of the federally mandated assessment of all residents in Medicare or Medicaid certified nursing homes and contains items that measure physical, psychological and psychosocial functioning. Linking the MDS to claims data would permit in-depth analysis of how MCC patterns differ based on patient characteristics and also support analysis of the relationship between MCC and patient outcomes, at least for Medicare beneficiaries in nursing homes. Linking claims data to the Outcome and Information Assessment System (OASIS) would allow similar exploration for patients receiving home health services.
It is important to note that additional data sources may become available in the future that will be appropriate for research on less prevalent combinations of MCC. New data sources may include electronic healthcare record based registries, large employer databases, managed care patient registries, practice-based network data, and other data sharing and collection initiatives. Descriptions of these other potential data sources were not included in our review.
8. Opportunities and Considerations for Future Research (Study Question #4) and Conclusions
What combinations of less prevalent combinations of chronic comorbidities are most critical to address in terms of care utilization and cost? What are the future research considerations for MCC research?
While a number of studies in recent years have examined patients with MCC, patients with less common combinations have largely been overlooked. Given the growth and aging of the United States population, and the continual rise in healthcare costs, the “long tail” will likely only become larger and more complex and costly over time. Studying the population with less prevalent MCC combinations represents a shift from studying more prevalent chronic conditions to focusing on chronic disease complexity at a finer level of detail. Many combinations of MCC make up the long tail and, in the aggregate, a substantial number of patents with less prevalent MCC combinations and above-average costs and healthcare needs, are excluded from clinical research studies. Understanding how the long tail impacts healthcare costs and quality and improved treatment of MCC patients is a clear need.
Development of a research agenda for the population with low prevalence MCC should be guided by consideration of issues related to the data available for conducting this research and the types of research questions to be explored:
- Data for conducting research on this patient population: How well do existing data sources support research of this patient population? What types of additional types of data are needed? What types of additional studies are needed to understand the types of research on the long tail that existing data sources that can support?
- Research questions: What types of analyses are needed to improve our understanding of the long tail? What types of research are most likely to contribute to improvements in the effectiveness and efficiency of care for patients with MCC in the long tail? How can this research influence the way MCC patients are managed and treated, both in terms of patients with common combinations of chronic conditions and those with less prevalent combinations? What types of research studies can be informative for MCC patients?
As in all MCC research, different stakeholders will have different requirements in the level of clinical detail their disease models must support. Improved understanding of the MCC population has implications for quality of care, disease management, reimbursement, and the design of research studies. Below, we discuss potential topics for future research and initiatives on patients with low prevalence of MCC, organized by stakeholder.
Researcher & Interventionist Stakeholders
- Reproducing the long tail. To date, the long tail distribution of low-prevalence chronic disease combinations has been observed using Medicare claims data only. Other large, detailed sources of diagnostic information should be analyzed to determine if the long tail can be reproduced and if differences in distributions are evident among varying populations. Due to their large sample size and comprehensiveness, databases such as HCUP’s NIS, Medicaid’s MAX, and the National Ambulatory Care Survey (NAMCS) would be viable candidates for this type of research. Only recently has HCUP’s NIS and NAMCS been leveraged to study MCC prevalence and healthcare utilization (Ashman et al., 2013 & Steiner et al., 2013).
- Improving our understanding of how MCC prevalence and outcomes vary by patient characteristics. Because they have not been the focus of many prior studies, our understanding of patients with complex combinations of MCC who comprise the long tail is limited. Basic descriptive studies that examine the number of patients with various MCC combinations, the number of possible combinations, and the costs incurred by this population would be useful. Given the clinical detail (e.g., ICD-9 codes from claims data) needed to identify patients in the long tail, claims data (from Medicare, Medicaid, or private payers) have been the main data source for studies of the MCC population. Other potential data sources, such as surveys that collect information on self-reported conditions, typically lack the clinical detail needed to support research on the less prevalent MCC. While claims data have the large sample size and clinical detail that such studies require, they have several limitations that affect the types of MCC research that they can support:
- Lack of demographic and socioeconomic variables. Medicare claims data can be linked to administrative data with information on enrollee characteristics, but the administrative data contains limited demographic information (e.g., gender, age, and race) and no real socioeconomic information.
- Inclusion of patients only if treatment for a condition occurs in the specified time period. Only iif the patient is treated for the condition (i.e., has a claim with the ICD-9 code listed) during the period that the claims data cover will the diagnosis be included, and thus the data may underestimate prevalence. Some patients lack access to appropriate healthcare and claims data will not include all of their medical conditions. For other patients who have access, differences in screening, diagnosis, and coding practices can lead to differences in the types of diagnoses that are recorded in claims data.
- Claims data are not representative of the United States population. For example, Medicare claims data are only available for Medicare fee-for-service beneficiaries; HCUP’s full NIS database represents about 90% of hospitals and 95% of discharges, but has unique limitations; and all-payer databases are only available for certain states.
- Claims have limited information on patient outcomes. Alternatives or supplements to claims data will need to be explored to understand the relationship between MCC and patient characteristics and outcomes associated with MCC and the different treatment patterns for them. Linking claims to other data sets is one way that our understanding can be improved, at least for specific patient populations. For Medicare beneficiaries who are nursing home residents, linking Medicare claims data to the Minimum Data Set assessment tool would allow more detailed exploration of how MCC patterns differ based on patient characteristics and also support analysis of the relationship between MCC and patient outcomes. Linking claims data to the Outcome and Information Assessment System (OASIS) would allow similar exploration for patients receiving home health services. While only feasible for small numbers of patients, chart review for a sample of complex patients may be useful for better understanding and defining complexity. Given the unique disease combinations that one tends to find on the long tail, the generalizability of such results to other patients may be limited.
- Developing a reporting and theoretical framework. MCC researchers have utilized a variety of different systems of diagnostic classification and analytical methods. In the context of each individual research paper, these choices may have been reasonable and appropriate, but these choices can strongly influence the findings of research calculations. For example, an analysis with more diagnostic categories automatically finds more chronic disease combinations. Because findings depend on methods, it may be difficult or near impossible to combine research from diverse sources in order to synthesize consistent results. Different stakeholder groups are concerned with different aspects of MCC research; consequently, differences in diagnostic classification are likely to persist in future research. Standardization cannot be demanded merely for the sake of making literature review and synthesis easier. However, it can be suggested that authors of papers relevant to the MCC field begin considering how to cast their results in ways that facilitate comparison with the rest of the MCC literature, and that the scientific community address the development of a theoretical framework that would support more systematic reporting of MCC findings. In particular, methods developed for producing results that are invariant across methodologies, and for distinguishing clinically important combinations from those that are the inevitable result of arithmetic may be beneficial.
- Understanding how study conclusions are impacted by the classification system that is used. Little is known about how robust study findings are to the disease classification system that they use. As part of this study, we examined the ICD-9 codes used in three widely used classification systems: the CCS, HCCs, and the CCW. These systems vary with respect to the number of disease categories that they include—the CCS includes 285 categories, there are 70 HCC categories, and the CCW includes 27 chronic condition categories. These differences may contribute to differences in study findings that are purely driven by the classification system—a study that uses the CCS would presumably have more MCC combinations than one that uses the CCW just due to the difference in the number of categories in the two systems. The number of combinations actually observed in the data is an artifact of the classification plus the sample size.
The classification systems also vary with respect to the number of ICD-9 codes that they use. The HCUP system includes virtually all of the 14,573 ICD-9 codes, the HCC system uses around 3,000 ICD-9 codes, while the CCW uses approximately 600 ICD codes. As a result, a higher proportion of patients would be classified into a disease category for studies that use the CCS than for studies that use HCCs or the CCW. Additional research is needed to understand the robustness of study findings to the classification system that is used. - Cost patterns for those with MCC: Additional research on the healthcare costs incurred by patients in the long tail is important for understanding the potential savings from programs targeted at this population. There has been little research on the cost and utilization patterns for patients with specific combinations of MCC; the large number of possible combinations is a limiting factor. But identification of specific combinations associated with high costs is important for shaping development of cost effective programs for MCC treatment.
- Analysis of disease combinations (or clusters). For the most part, disease classification systems focus on individual conditions rather than specific combinations or clusters of conditions. As a result, few studies have examined the clustering of MCC, particularly for less prevalent MCC combinations for which there are a very large number of possible combinations. The lack of research on disease clusters is related to the large amounts of data that such studies require. Rare clusters cannot be identified without large amounts of data with detailed information on patient diagnoses (i.e., claims data). Analysis of such large data files will identify more disease combinations than it is possible to analyze. Additional research is needed to identify the disease clusters that should be the focus of future research efforts—for example, combinations associated with high-risk patient populations.
- Comparing MCC Studies Across Countries. MCC studies have primarily been conducted in the United States and Europe. Assessment of the data sources and methods used in these studies should be conducted to determine whether the results of these studies are comparable. That is, do data quality or infrastructure concerns suggest that research from one country may be more reliable than another? What do such comparisons suggest about how information and analytic techniques can be leveraged across international borders? Are there any potential implications for the treatment of MCC patients? Are there any studies of patients on the long tail that can be compared across countries or are there too few of these studies to draw any meaningful comparisons?
- Understanding the impact of transition to ICD-10. While this question will affect many types of research and transcends research on the long tail, the impact on MCC research resulting from efforts to map ICD-9 to ICD-10 is not known; at a minimum, this transition is likely to limit researchers’ ability to measure changes in disease prevalence and patient complexity over time. The ICD-10 transition will also affect classification systems such as HCUP and HCCs which are an important component of MCC research.
Patient and Provider Stakeholders
- Disease management programs. Clinical approaches often focus on individual diseases, without considering how the presence of MCC may affect healthcare needs. This is particularly true for patients in the long tail. As a result, clinicians have a very limited body of evidence-based knowledge for approaching the care for these patients. A focus of additional research should be improvements in disease management programs that are effective for patients with multiple conditions and prioritizes the role of care coordination. For example, how many different providers do MCC patients visit during the course of one year? Who do patients consider to be their “primary” physician? How many different physician offices and healthcare facilities do patients visit? How many different combinations of pharmaceutical drugs are MCC patients prescribed? What are the different types of systems indicators that can be used to monitor MCC patients?
- Patient perspectives on living in the long tail. There is a large patient stake in MCC research. For example, PatientsLikeMe expanded their list of potential diagnoses from 300 to 2,000 due to patient demand, a list that continues to increase. The “long tail” is not just a conceptual problem, but a problem that affects many patients. How do we bring the patient voice to MCC research? What would MCC patients like to know? How do we focus MCC efforts on patients and not a research paradigm or list of chronic conditions? One option is to provide opportunities through digital media for individuals with multiple chronic conditions to provide information about “a day in their lives” and their medical and health needs so that we can better understand what information is needed to better care for those with MCC. This would provide insights that cannot be obtained via data analyses, although it is not clear how generalizable findings would be to other MCC patients. Another option would be to develop patient-reported outcomes specific to MCC patients and to leverage patient-reported information that is collected through EHR systems. As EHRs continue to advance and online patient portals become more widely available, electronic information that is patient-derived may be a robust source of data that helps bring the patient voice to the forefront of MCC research.
- Understanding the different types of interactions between low-prevalence chronic disease combinations. When chronic diseases co-occur they can have additive, multiplicative or even protective effects. For example, body mass has been found to have a paradoxical effect on mortality in patients with rheumatoid arthritis (Escalante et al., 2005). Understanding the different types of interactions between chronic diseases can allow providers to better target groups of MCC patients for intervention (e.g., patients with chronic diseases that have a multiplicative effect).
Policymaker Stakeholders
- Payers. Reimbursement systems may fail to recognize the incremental costs associated with MCC, particularly for the less prevalent MCC combinations that comprise the long-tail. As a result, the full costs of caring for these patients may not be reflected in payment rates, potentially impacting quality and access to care for these patients. Additional research on patients with MCC combinations may lead to improvements in the ability of payment systems to recognize the incremental costs associated with specific MCC combinations, thus promoting appropriate reimbursement rates for these patients, promoting access to care. Some examples of potential research questions may include: How can patient diagnoses be more accurately identified and costs more accurately predicted? How can “active” diagnoses be determined compared to those patients are no longer seeking treatment for? What risk stratification levels may be warranted for persons with different combinations of chronic disease?
- Quality Measures and value-based purchasing programs. Quality measures may show skewed calculations due to inaccurately classified individuals if low-prevalence MCC are not accounted for. For example, a person with type 2 diabetes and Alzheimer’s disease may not be a good candidate for tight glycemic control. Exclusion of patients with specific MCC combinations is one option for dealing with this issue, but this would reduce the incentives to provide high quality care to this patient population, and also lead to a lack of relevant information on provider quality for MCC patients. Focusing on applicable quality measures that can be applied broadly across both MCC and non-MCC patients (e.g., related to patient-centeredness or care coordination, or self-management) is a better option. Development of MCC-disease-specific quality measures seems impractical for those on the long tail given the many MCC combinations and small sample sizes that would be available for measure calculation.
Similarly, value-based purchasing programs may not account for disease complexity, as many metrics used in adjusting reimbursement are focused on single diseases and related clinical processes. The quality of care coordination and the ability to manage complexity may be more accurately assess by examining MCC patients, including those with low-prevalence conditions.
As is clear from the discussion above, there are many gaps in our knowledge of patients with less prevalent combinations of MCC. These gaps are partly a reflection of the data and analytic-related challenges that must be resolved to conduct research on this population and partly due to the inclination to focus on patients with individual conditions or on the more prevalent combinations of MCC. There are, however, a number of opportunities for future research that would improve our knowledge of the long-tail and perhaps lead to improvements in the care for this population. These potential research questions differ by stakeholder perspective. However, opportunities to share information, ideas and initiatives should be pursued across these perspectives to cultivate a community of professionals focused on improving care for all types of MCC patients.
9. References
Abt Associates Inc. (2013). Unpublished Analysis of 2010 Medical Expenditure Panel Survey (MEPS) Data, Cambridge, MA.
Agency for Healthcare Research and Quality (AHRQ). Multiple Chronic Conditions. Available at http://www.ahrq.gov/professionals/prevention-chronic-care/decision/mcc/. Accessed 2013.
Ammann L. Combinations without replacement. University of Texas – Dallas. 2011. Available at http://www.utdallas.edu/~ammann/stat5351/node8.html.
Anderson G. Chronic Care: Making the Case for Ongoing Care. Princeton, NJ: Robert Wood Johnson Foundation, 2010. Available at http://www.rwjf.org/en/search-results.html?u=&k=Anderson+G.+Chronic+Care%3A+Making+the+Case+for+Ongoing+Care..
Ashman JJ, and Beresovsky V. Multiple Chronic Conditions Among US Adults Who Visited Physician Offices: Data From the National Ambulatory Medical Care Survey, 2009. Prev Chronic Dis. 2013;10:E64.
Bae S and Rosenthal MB. Patients with multiple chronic conditions do not receive lower quality of preventive care. J Gen Intern Med. 2008;23(12):1933–1939.
Ben-Noun L. Characteristics of comorbidity in adult asthma. Public Health Rev. 2011; 29(1)49–61.
Black L, Runken MC, Eaddy M, and Shah M. Chronic disease prevalence and burden in elderly men: An analysis of Medicare claims data. J Health Finance. 2007;33(4):68–78.
Boyd C, Darer J, Boult C, Fried LP, Boult L, and Wu AM . Clinical practice guidelines and quality of care for older patients with multiple comorbid disease: implications for pay for performance. JAMA. 2005;294(6):716–724.
Centers for Disease Control and Prevention (CDC). Behavioral Risk Factor Surveillance System Survey Questionnaire. Atlanta, Georgia: U.S. Department of Health and Human Services, Centers for Disease Control and Prevention, 2011.
Centers for Medicare & Medicaid Services (CMS ). Chronic Conditions among Medicare Beneficiaries, Chartbook. Baltimore, MD. 2011.
Centers for Medicare & Medicaid Services (CMS ). Chronic Conditions among Medicare Beneficiaries, Chartbook. 2012 Edition. Baltimore, MD. 2012.
Centers for Medicare & Medicaid Services (CMS). Chronic Conditions Data Warehouse: Chronic Conditions Dashboard. 2013.
Chen H-Y, Baumgardner DJ, and Rice JP. Health-related quality of life among adults with multiple chronic conditions in the United States, Behavioral Risk Factor Surveillance System, 2007. Prev Chronic Dis. 2011;8(1):A09.
Erdem E, Prada SI, and Haffer SC. Medicare Payments: How Much Do Chronic Conditions Matter? MMRR. 2013;3(2):E1–E15.
Escalante A, Haas RW, and del Rincon I. Paradoxical effect of body mass index on survival in rheumatoid arthritis. Role of comorbidity and system inflammation. Arch Intern Med. 2005; 165:1624–1629.
Ford ES, Croft JB, Posner SF, Goodman RA, and Giles WH. Co-Occurrence of Leading Lifestyle-Related Chronic Conditions Among Adults in the United States, 2002-2009. Prev Chronic Dis. 2013;10:E60.
Fortin M, Hudon C, Haggerty G, Akker MV, and Almirall J. Prevalence estimates of multimorbidity: a comparative study of two sources. BMC Health Serv Res. 2010;10(111):1–6.
Fortin M, Stewart M, Poitras ME, Almirall J, and Maddocks H. A systematic review of prevalence studies on multimorbidity: Toward a more uniform methodology. Ann Fam Med. 2012; 10(2):142–151.
France EF, Wyke S, Gunn JM, Mair FS, McLean G, and Mercer SW. Multimorbidity in primary care: A systematic review of prospective cohort studies. Br J Gen Pract. 2012; 62(597):e297–e307.
Fried VM, Bernstein AM, and Bush MA. Multiple chronic conditions among adults aged 45 and over: Trends over the past 10 years. NCHS data brief, no.100. Hyattsville, MD: National Center for Health Statistics. 2012.
Garcia-Olmos L, Salvador CH, Alberquilla A, Lora D, Carmona M, Garcia-Sagredo P, Pascual M, Munoz A, Monteagudo JL, and Garcia-Lopez F. Comorbidity patterns in patients with chronic disease in general practice. PLoS ONE, 2010;7(2):1–7.
Glynn LG, Valderas JM, Healy P, Burke E, Newell J, Gillespie P, and Murphy AW. The prevalence of multimorbidity in primary care and its effects on health care utilization and cost. Fam Pract. 2011;28(5):516–523.
Goodman RA, Posner SF, Huang ES, Parekh AK, Koh HK. Defining and Measuring Chronic Conditions: Imperatives for Research, Policy, Program, and Practice. Prev Chronic Dis 2013;10:120239.
Gorinam Y, and Kramarow EA. Identifying chronic conditions in Medicare claims data: valuating the Chronic Conditions Data Warehouse algorithm. Health Serv Res. 2001;46(5):1610–1627.
Grant RW, Ashburner JM, Hong CC, Chang Y, Barry MJ, and Atlas SJ. Defining patient complexity from the primary care physician's perspective: a cohort study. Ann Intern Med. 2011;155(12):797–804.
Griggs RC, Batshaw M, Dunkle M, Gopal-Srivastava R, Kaye K, Krischer J, Nguyen T, Paulus K, Merkel PA, and the Rare Disease Clinical Research Network. Clinical research for rare disease: opportunities, challenges, and solutions. Mol Genet Metab. 2009;96(1):20–26.
Gulley SP, Rasch EK, and Chan L. The complex web of health: relationships among chronic conditions, disability, and health services. Public Health Rep. 2011;126(4):495–507.
Iezzoni LI. Multiple chronic conditions and disabilities: implications for health services research and data demands. Health Serv Res. 2010; 45(5):1523–1540.
Institute of Medicine (IOM). 2012. Living well with chronic illness: A call for public health action. Washington, DC: The National Academies Press.
Januel JM, Luthi JC, Quan H, Borst F, Taffe P, Ghali WA, and Burnand B. Improved accuracy of co-morbidity coding over time after the introduction of ICD-10 administrative data. Health Serv Res. 2011; 11(194):1–10.
John R, Kerby D, and Hennessy C. Patterns and impact of comorbidity and multimorbidity among community-resident American Indian elders. Gerontologist. 2003; 43(5):649–660.
Kaiser Family Foundation. Medicaid enrollees and expenditures, FY 2009. 9 May 2012. Available at http://facts.kff.org/chart.aspx?ch=465. Accessed 2013.
Kern FO, Maney M, Miller DR, Tseng CL, Tiwari A, Rajan M, Aron D, and Pogach L. Failure of ICD-9-CM codes to identify patients with comorbid chronic kidney disease in diabetes. Health Serv Res. 2006; 41(2):564-580.
Kronick RG, Bella M, Gilmer TP, and Somers, SA. The Faces of Medicaid II: Recognizing the Care Needs of People with Multiple Chronic Conditions. Center for Health Care Strategies, Inc., October 2007.
Lee TA, Shields AE, Vogeli C, Gibson TB, Woong-Sohn M, Marder WD, Blumenthal D, and Weiss KB. Mortality rate in veterans with multiple chronic conditions. J Gen Intern Med. 2007; 22(Suppl 3):403v7.
Lehnert T, Heider D, Leicht H, Heinrich S, Corrieri S, Luppa M, Riedel-Heller S, and Konig HH. Review: health care utilization and costs of elderly persons with multiple chronic conditions. Med Care Res Rev. 2011; 68(4):387–420.
Li C, Balluz LS, Ford ES, Okoro CA, Zhao G, and Pierannunzi C. A comparison of prevalence estimates for selected health indicators and chronic diseases or conditions from the Behavioral Risk Factor Surveillance System, the National Health Interview Study, and the National Health and Nutrition Examination Survey, 2007-2008. Prev Med. 2012; 54(6):381–387.
Lochner KA, and Cox CS. Prevalence of Multiple Chronic Conditions Among Medicare Beneficiaries, United States, 2010. Prev Chronic Dis. 2013;10:E61.
Machlin SR, and Soni A. Health Care Expenditures for Adults With Multiple Treated Chronic Conditions: Estimates From the Medical Expenditure Panel Survey, 2009. Prev Chronic Dis. 2013;10:E63.
Marengoni A, Rizzuto D, Wang HX, Winblad B, and Fratiglioni L. Patterns of chronic multimorbidity in the elderly population. J Am Geriatr Soc. 2009; 57(2):225–230.
Martin LM, Leff M, Calonge N, Garrett C, and Nelson DE. Validation of self-reported chronic conditions and health services in a managed care population. Am J Prev Med, 2000;18(3):215-8.
Moher D, Liberati A, Tetzlaff J, Altman DG, and the PRISMA Group. Preferred reporting items for systematic reviews and meta-analyses: The PRISMA Statement. Int J Surg. 2010;8(5):336–41.
Naessens JM, Stroebel RJ, and Finnie DM. Effect of multiple chronic conditions among working-age adults. Am J Manag Care, 2001;17(2):118–122.
National Quality Forum (NQF). MCC Measurement Framework Final Report. May 2012. Accessed 2013. http://www.qualityforum.org/Publications/2012/05/MCC_Measurement_Framework_Final_Report.aspx
Newcomer SR, Steiner JF & Bayliss EA. Identifying Subgroups of Complex Patients with Cluster Analysis. Am J Manag Care, 2011;17(2):118–122.
OECD. Strengthening health information infrastructure for health care quality governance. Good practices, new opportunities and data privacy protection challenges. Preliminary Version. April 2013. Accessed 2013. Available at http://www.oecd.org/els/health-systems/Strengthening-Health-Information-Infrastructure_Preliminary-version_2April2013.pdf.
O’Malley KJ, Cook KF, Price MD, Wildes KR, Hurdle JF, and Ashton CM. Measuring diagnoses: ICD code accuracy. Health Serv Res, 2005;40(5 Pt 2):1620–1639.
Parekh AK, Goodman RA, Gordon C, Koh HK, and the HHS Interagency Workgroup on Multiple Chronic Conditions. Managing multiple chronic conditions: a strategic framework for improving health outcomes and quality of life. Public Health Rep. 2011; 126(4): 460–471.
Prados-Torres A, Poblador-Plou B, Calderon-Larranaga A, Gimeno-Feliu LA, Gonzalez-Rubio F, Poncel-Falco A, Sicras-Mainar A, and Alcala-Nalvaiz JT. Multimorbidity patterns in primary care: interactions among chronic diseases using factor analysis. PLoS One. 2012;7(2):e32190.
Ragni MV, Moore CG, Bias V, Key NS, Kouides PA, Francis CW, and the Hemostasis Thrombosis Research Society (HTRS). Challenges of rare disease research: limited patients and competing priorities. Haemophilia. 2012;18(3):e192–194.
Research Data Assistance Center (ResDAC). Health and Retirement Survey-Medicare Linked Data. Accessed 2013. Available at http://www.resdac.org/cms-data/files/hrs-medicare.
Rich E, Lipson D, Libersky J, Parchman M. Coordinating Care for Adults with Complex Care Needs in the Patient-Centered Medical Home: Challenges and Solutions. White Paper (Prepared by Mathematica Policy Research under Contract No. HHSA290200900019I/HHSA29032005T). AHRQ Publication No. 12-0010-EF. Rockville, MD: Agency for Healthcare Research and Quality. January 2012.
Riley GF. Administrative and claims records as sources of health care cost data. Med Care. 2009; 47(7 Suppl 1):S51–S55.
Robert Wood Johnson Foundation (RWJF) & Johns Hopkins Bloomberg School of Public Health. Chronic Care: Making the Case for Ongoing Care. 2010. Accessed 2013. http://www.rwjf.org/content/dam/farm/reports/reports/2010/rwjf54583.
Rosner R, and Powell S. Does ICD-10 overestimate the prevalence of PTSD? Effects of differing diagnostic criteria on estimated rates of posttraumatic stress disorder in ware zone exposed civilians. Trauma & Gewalt. 2009; 3(2):1–8.
Salisbury C, Johnson L, Purdy S, Valderas JM, & Montgomery AA. Epidemiology and impact of multimorbidity in primary care: a retrospective cohort study. Br J Gen Pract. 2011;61(582):e12–21.
Salive ME. Multimorbidity in older adults. Epidemiol Rev. 2013; 35(1):75–83.
Safford MM, Allison JJ, and Kiefe CI. Patient Complexity: more than comorbidity. The vector model of complexity. J Gen Intern Med. 2007; 22 (Suppl 3):382–390.
Schafer I, von Leitner E-C, Schon G, et al. Multimorbidity patterns in the elderly: A new approach of disease clustering identifies complex interrelations between chronic conditions. PLoS One. 2010; 5(2):e1594.
Schneider F, Kaplan V, Rodak R, Battegay E, and Holzer B. Prevalence of multimorbidity in medical inpatients. Swiss Med Wkly. 2012;142:1–9.
Schneider KM, O’Donnell BE, and Dean D. Prevalence of multiple chronic conditions in the United States’ Medicare population. Health Qual Life Outcomes, 2009;7(82):1–11.
Schoenberg NE, Kim H, Edwards W, and Fleming ST. Burden of common multiple-morbidity constellations on out-of-pocket medical expenditures among older adults. Gerontologist. 2007;47(4):423–437.
Schram MT, Frijters D, van de Lisdonk EH, Ploemacher J, de Craen AJ, de Waal MW, van Rooij FJ, Heeringa J, Hofman A, Deeq DJ, and Schellevis FG. Setting and registry characteristics affect the prevalence and nature of multimorbidity in the elderly. J Clin Epidemiol. 2008; 61(11):1104–1112.
Shelton P, Sager MA, and Schraeder C. The community assessment risk screen (CARS): identifying elderly persons at risk for hospitalization or emergency department visit. Am J Manag Care. 2000;6(8):925–933.
Sorace J, Wong HH, Worrall C, Kelman J, Saneinejad S, and MaCurdy T. The complexity of disease combinations in the Medicare population. Popul Health Manag. 2011;14(4):161–166.
Sorace J, Millman M, Bounds M, et al. Temporal variation in patterns of comorbidities in the Medicare population. Popul Health Manag. 2013;16(2):120–124.
Steiner CA, and Friedman B. Hospital Utilization, Costs, and Mortality for Adults With Multiple Chronic Conditions, Nationwide Inpatient Sample, 2009. Prev Chronic Dis. 2013;10:E62.
Steinman MA, Lee SJ, Boscardin WJ, Miao Y, Fung KZ, Moore KL, and Schwartz JB. Patterns of multimorbidity in elderly veterans. J Am Geriatr Soc. 2012; 60(10):1872–1880.
Tinetti ME, Fried TR, and Boyd CM. Designing health care for the most common chronic condition – multimorbidity. JAMA. 2012;307(23):2493–2494.
U.S. Department of Health and Human Services (DHHS). Multiple Chronic Conditions - A Strategic Framework: Optimum Health and Quality of Life for Individuals with Multiple Chronic Conditions. Washington, D.C. December 2010.
U.S. Department of Health and Human Services (DHHS). U.S. Department of Health and Human Services (HHS) Inventory of Programs, Activities, and Initiatives Focused on Improving the Health of Individuals with Multiple Chronic Conditions (MCC). Complied by the HHS Interagency Workgroup on Multiple Chronic Conditions under the direction of Anand Parkeh, MD, MPH, Deputy Assistant Secretary for Health (Science and Medicine), Office of the Assistant Secretary for Health. September 2011.
U.S. Department of Health and Human Services (DHHS). HHS Initiative on Multiple Chronic Conditions. Available at: http://www.hhs.gov/ash/initiatives/mcc/#_edn3. Accessed 2013.
Vogeli C, Shields AE, Lee TA, Gibson TB, Marder WD, Weiss KB, and Blumenthal D. Multiple chronic conditions: prevalence, health consequences, and implications for quality, care management, and costs. J Gen Intern Med, 2007;22(Suppl 3):391–395.
van den Akker M, Buntinx F, Metsemakers JF, Roos S, and Knottnerus JA. Multimorbidity in general practice: prevalence, incidence, and determinants of co-occurring chronic and recurrent diseases. J Clin Epidemiol. 1998;51(5):367–375.
Wallace RB, and Salive ME. The Dimensions of Multiple Chronic Conditions: Where Do We Go From Here? A Commentary on the Special Collection of Preventing Chronic Disease. Prev Chronic Dis. 2013;10:E59.
Ward BW, and Schiller JS. Prevalence of multiple chronic conditions among US adults: estimates from the National Health Interview Survey, 2010. Prev Chronic Dis. 2013;10:E65.
Wolff JL, Starfield B, and Anderson G. Prevalence, expenditures, and complications of multiple chronic conditions in the elderly. Arch Intern Med. 2002;162(20):2269–2276.
Wong A, Boshuizen HC, Schellevis FG, et al. Longitudinal administrative data can be used to examine multimorbidity, provided false discoveries are controlled for. J Clin Epidemiol, 2011; 64(1):1109–1117.
Woo JG, Zeller MH, Wilson K, and Inge T. Obesity identified by discharge ICD-9 codes underestimates the true prevalence of obesity in hospitalized children. J Pediatr. 2009; 154(3):327–331.
Yoon J, Scott JY, Phibbs CS, and Wagner TH. Recent trends in Veterans Affairs chronic condition spending. Popul Health Manag. 2011;14(6):293–298.
Yu W, Ravelo A, Wagner TJ, et al. Prevalence and costs of chronic conditions in the VA health care system. Med Care Res and Rev. 2003;60(3 Suppl):146S–167S.
Appendices
The appendices listed below are supplemental materials and are attached to the white paper.
Appendix A - Literature Search Methodology
The literature search methodology outlines the MEDLINE search terms that were used to conduct the literature review of the peer-reviewed and grey literature related to prevalence of MCC, disease combinations, diagnosis coding, and databases and analytic techniques that have been used to conduct chronic disease research. The number of papers that were identified with each search term and combination are presented.
Appendix B – Review of National Datasets and Data Systems: Summary Tables
The review of national datasets provides a descripton of seventeen national data systems that can be used for multiple chronic conditions research, including a description of each data system, the diagnosis information measured in each data system, the cost, utilization, and clinical information captured in each data system, and the strengths, limitations, and appropriateness of each data system for MCC research.
Appendix C – Clinical Classification Systems ( Grouper ) Review
The Clinical Classification Systems (Grouper) Review provides a summary of fourteen systems for organizing and aggregating diagnosis codes into different disease categories, and an assessment of each grouper system’s feasibility for disease complexity research.
Appendix D - Technical Advisory Group List
The Technical Advisory Group (TAG) List provides of experts consulted about the overall conduct of the studies and their affiliations. TAG members participated in an initial in-person meeting in December 2012 and provided feedback on the original literature review to determine additional databases, grouping systems, and methods for studying MCC in disparities populations. TAG members then participated in a second meeting by teleconference in May 2013 to review and provide feedback on the first draft of the White Paper.
Appendix E - Key Informants
The list of key informants includes the individually interviewed experts and their affiliations. Key informants were identified by the ASPE Project Officers and the Technical Advisory Group (TAG). Key informant interviews were conducted to provide the Project Team with in-depth expertise on topics covered in the White Paper. Findings from the Key Informant Interviews have been incorporated throughout the White Paper.
Appendix A – Literature Search Methodology
The literature search methodology outlines the MEDLINE search strategy that was used to conduct the literature review of the peer-reviewed and grey literature related to prevalence of MCC, disease combinations, diagnosis coding, and databases and analytic techniques that have been used to conduct chronic disease research. The number of papers that were identified with each search term and combination are presented.
Search Strategy
MEDLINE
- Date – Last 10 Years (as of January 1, 2013)
- Language – English
- Limits – Human
- Limits – Abstract Available
- Search Field Tags – All fields
Key Terms
| Search # | Key Terms | Number of Articles |
|---|---|---|
| #1 | Chronic Disease/classification/epidemiology/economics | 2425 |
| #2 | Multiple Chronic Conditions | 127 |
| #3 | Multimorbidity | 207 |
| #4 | Comorbidity | 42895 |
| #5 | Disease Combinations | 11 |
| #6 | Aging Chronic Disease | 3236 |
| #7 | Health Expenditures | 4888 |
| #8 | Economics | 96447 |
| #9 | Healthcare Utilization | 30769 |
| #10 | Healthcare Costs | 27841 |
| #11 | Cost of Illness | 11424 |
| #12 | United States | 611178 |
| #13 | Clinical Coding | 5252 |
| #14 | Medical Informatics | 109606 |
| #15 | Multiple Chronic Conditions Data Sets | 15 |
| #16 | # 1 AND #7 | 119 |
| #17 | # 1 AND #8 | 678 |
| #18 | # 1 AND #9 | 243 |
| #19 | # 1 AND #10 | 257 |
| #20 | # 1 AND #11 | 183 |
| #21 | #16 OR #17 OR #18 OR #19 OR #20 | 799 |
| #22 | # 21 AND #12 | 442 |
| #23 | # 4 AND #7 | 197 |
| #24 | # 4 AND #8 | 2611 |
| #25 | # 4 AND #9 | 1211 |
| #26 | # 4 AND #10 | 1032 |
| #27 | # 4 AND # 11 | 675 |
| #28 | # 22 OR #23 OR #24 OR #25 OR #26 | 3529 |
| #29 | #27 AND #12 | 1904 |
| #31 | # 6 AND #7 | 38 |
| #32 | # 6 AND #8 | 186 |
| #33 | # 6 AND #9 | 69 |
| #34 | # 6 AND #10 | 98 |
| #35 | # 6 AND #11 | 58 |
| #36 | #31 OR #32 OR #33 OR #34 OR #35 | 261 |
| #37 | # 13 AND #1 | 8 |
| #38 | # 13 AND #2 | 2 |
| #39 | # 13 AND #3 | 1 |
| #40 | # 13 AND #4 | 73 |
| #50 | # 13 AND #5 | 0 |
| #51 | # 37 OR # 38 OR #39 OR #40 OR #41 | 80 |
| #52 | # 14 AND #1 | 124 |
| #53 | # 14 AND #2 | 6 |
| #54 | # 14 AND #3 | 8 |
| #55 | # 14 AND #4 | 1217 |
| #56 | # 14 AND #5 | 2 |
| #57 | #52 OR #53 OR #54 OR #55 OR #56 | 1328 |
| #58 | #57 AND #12 | 545 |
| #59 | #2 OR #3 OR #5 OR #15 OR #22 OR #28 OR #36 OR #51 OR #58 | 3323 |
Article Selection
- A title review of 3,323 articles.
- 3,201 articles eliminated due to one of following:
- Single disease focus
- Clinical interventions, therapies, and prevention practices
- Quality improvement practices and interventions
- Unrelated to topic
- 3,201 articles eliminated due to one of following:
- An abstract review of 122 articles.
- 53 articles eliminated due to one of the following:
- Single disease focus
- Clinical interventions, therapies, and prevention practices
- Quality improvement practices and interventions
- Unrelated to topic
- 53 articles eliminated due to one of the following:
- 69 relevant articles were identified during the abstract review for potential incorporation into the white paper. Additional relevant articles, not identified by the search methodology, were identified by the co-project officers, TAG and Key Informants.
Appendix B – Review of National Datasets and Data Systems: Summary Tables
The data systems review provides summaries of seventeen national datasets that can be used for multiple chronic conditions research, including a description of each data system, sponsor, the diagnosis information measured in each data system, the cost, utilization, and clinical information captured in each data system, and the strengths, limitations, and feasibility of each data system for MCC research.
Agency for Healthcare Research and Quality Datasets
| Consumer Assessment of Healthcare Providers & Systems (CAHPS) | |
|---|---|
| Database Description | |
| White Paper(s): | Multiple Chronic Conditions and Disparities |
| Sponsorship: | Agency for Healthcare Research and Quality |
| Description: | CAHPS is a series of surveys that are used to ask consumers and patients about their experiences with healthcare. These surveys cover a wide spectrum of topics, such as provider communication skills and healthcare access. The goal of CAHPS is two-fold: 1) to develop standardized patient surveys that can be used to compare results across providers over time and 2) to generate tools and resources users can use to create comparative information for all stakeholders. There are CAHPS surveys for a variety of different care settings, including hospital, home health care, health plans, and in- center hemodialysis and clinician groups. |
| Database: (Scope, Size, Setting, Population, Age Range) | CAHPS surveys are used at various levels in the healthcare delivery system; anywhere from individual practices to national samples. |
| Database Type: (Survey, Registry, Research Study, Program Database, Claims, Administrative Data, and Clinical Databases) | Survey & Program Database. The CAHPS Database is a compilation of survey results from a large pool of healthcare consumers that are maintained in a national database. |
| Database Source/Origin: | Survey Data |
| Date or Frequency of Data Collection: | Annually, since 1995. |
| Longitudinal vs. Cross-sectional Database: | Serial Cross-Sectional Survey |
| Data Collection Methodology: | Data collection methodology varies by CAHPS sponsor and vendors administering the CAHPS survey. Surveys can be completed via the mail, telephone or internet. |
| Sampling Strategy: | Sampling strategies for CAHPS vary by sponsor. CAHPS provides guidelines for sampling, including determining eligibility, calculating the estimated sample size needed for reporting, and creating a sub-sample of a specific patient population. |
| Unit of Analysis: | Multiple (patients, providers, health plan, etc.) and dependent on survey type. |
| Diagnosis Information | |
| Diagnosis Variable Type: (Chronic Condition Status, Principal Diagnosis, Primary Diagnosis, Secondary Diagnosis, Admit/Discharge Diagnosis and Self-Reported Diagnosis) | A patient’s principal diagnosis at discharge is used to determine whether he or she falls into a specific service line for CAHPS eligibility. Diagnosis is not capture on the survey itself. |
| Diagnosis Codes: (ICD-9, ICD-10, SNOMED, CPT) | Principal diagnosis ICD-9 codes at discharge. |
| Number of Diagnoses Captured: | Only the principal diagnosis at discharge is used to determine CAHPS eligibility. |
| Cost, Utilization & Clinical Information | |
| Measures of Cost: (Claims, Out-of-pocket expenses, Self- reported expenditures, and Prescription Drug Costs) | CAHPS does not include measures of cost. |
| Measures of Healthcare Utilization: (Number of Visits, Any Procedures/Number of Procedures/Type of Procedure, Number of Admission/Type of Admission, Length of Stay, Hospitalizations, Emergency Department Utilization, etc.) | CAHPS does not include measures of healthcare utilization, but the number of survey respondents can be used as a proxy for the number of discharges. |
| Measures of Healthcare Access: | Ease of access to healthcare services. |
| Demographic Information: (Sex, Age, Race, Ethnicity, Marital Status, Disability Status, Language, Insurance Type, Educational Attainment). | Age, Sex, Educational Attainment, Hispanic or Latino, Race/Ethnicity, Language |
| Clinical Information: (BMI, Medical Conditions [high blood pressure], Smoker Status, History of Various Conditions, Preventative Health Measures , Activities of Daily Living, Instrumental Activities of Daily Living) | CAHPS does not include additional clinical information. |
| Measures of Socioeconomic Status: (Occupation, Employment Status, Income, Wealth, Place of Residence, Household Size & Composition, geographic location) | Health Literacy/Understanding |
| Site of Service Information: | Limited - Department Based |
| Measures of Healthcare Outcomes: (Mortality, Morbidity, Mobility, Functional Status, Quality of Life, Quality Measures, Quality of Care, Readmissions) | Self-reported health status, Self-reported mental health status, Quality of Care, Quality Measures and Patient Satisfaction |
| Strengths, Limitations & Feasibility | |
| Data Strengths: | Select CAHPS datasets contain a large number of minority respondents. Data are collected on key health policy issues, including health status. |
| Data Limitations: | The CAHPS survey is not administered in a consistent fashion. The CAHPS database is a collection of surveys administered at various levels. As such, not all providers participate each year, so the mix of users will vary across years. Sampling and data collection methods also vary by user and are cross-sectional. |
| Data Access Restrictions: | To access CAHPS data, a data release agreement, description of the planned research, and IRB documentation must be submitted to AHRQ. Survey instruments are publically available. |
| Data Linking Feasibility: (Unique identifiers or sufficient demographics to allow for data linkages) | No unique identifiers. However, CAHPS surveys have been administered to Medicare Fee-for-Service patients, which may have resulted in a linked CAHPS-claim dataset. |
| Related Grouping Systems: | n/a |
|
References: Agency for Healthcare Research & Quality. Consumer Assessment of Healthcare Providers and Systems (CAPHS). 2013. http://cahps.ahrq.gov/about.htm |
|
| Healthcare Cost & Utilization Project - Kids’ Inpatient Database | |
|---|---|
| Database Description | |
| White Paper(s): | Data Systems and the Prevalence of Chronic Disease Combinations & Multiple Chronic Conditions and Disparities |
| Sponsorship: | Agency for Healthcare Research & Quality |
| Description: | The Kids' Inpatient Database (KID) is a unique and powerful database of hospital inpatient stays for children. The KID was specifically designed to permit researchers to study a broad range of conditions and procedures related to child health issues. Researchers and policymakers can use the KID to identify, track, and analyze national trends in health care utilization, access, charges, quality, and outcomes. It is the only all-payer inpatient claims database for children in the U.S. |
| Database: (Scope, Size, Setting, Population, Age Range) | National; Adolescents Only (< 20 years old); 2–3 million records a year. |
| Database Type: (Survey, Registry, Research Study, Program Database, Claims, Administrative Data, and Clinical Databases) | A Federal-State-Industry database of Medicare, Medicaid, Private Insurance and Uninsured patient discharges. |
| Database Source/Origin: | Administrative data from 4,121 community, non- rehabilitation hospitals in 44 states. |
| Date or Frequency of Data Collection: | 1997-2009; updated every three years. |
| Longitudinal vs. Cross-sectional Database: | Longitudinal |
| Data Collection Methodology: | Discharge data submitted by participating organizations. |
| Sampling Strategy: | Sampling frame is limited to pediatric discharges from community, non-rehabilitation hospitals in participating HCUP partner states. For sampling, pediatric discharges in participating States are stratified by uncomplicated birth, complicated birth, and all other cases. To ensure an accurate representation of each hospital’s case-mix, the discharges are sorted by State, hospital, DRG and a random with each DRG. Systematic random sampling is then used to select 10% of uncomplicated births and 80% of complicated births and other cases form each from hospital |
| Unit of Analysis: | Multiple (patient, region, etc.) |
| Diagnosis Information | |
| Diagnosis Variable Type: (Chronic Condition Status, Principal Diagnosis, Primary Diagnosis, Secondary Diagnosis, Admit/Discharge Diagnosis and Self-Reported Diagnosis) |
Number of Chronic Conditions (based on a list of 25 possible chronic condition indicators) Primary and Secondary Diagnoses Admission and Discharge Status |
| Diagnosis Codes: (ICD-9, ICD-10, SNOMED) | ICD-9-CM codes |
| Number of Diagnoses Captured: | KID contains up to 25 diagnoses per patient per record. This number can vary by State. |
| Cost, Utilization & Clinical Information | |
| Measures of Cost: (Claims, Out-of-pocket expenses, Self- reported expenditures, and Prescription Drug Costs) |
Expected Primary and Secondary Payer Total Charges |
| Measures of Healthcare Utilization: (Number of Visits, Any Procedures/Number of Procedures/Type of Procedure, Number of Admission/Type of Admission, Length of Stay, Hospitalizations, Emergency Department Utilization, etc.) |
Admission Type Procedure Type ED Visits Length of Stay Number of Discharges |
| Measures of Healthcare Access: | Database used to evaluate healthcare access through the use of geographic and hospital type variables (i.e. critical access). |
| Demographic Information: (Sex, Age, Race, Ethnicity, Marital Status, Disability Status, Language, Insurance Type, Educational Attainment). |
Age at Admission Gender Race Hospital Characteristics Physician Identifiers |
| Clinical Information: (BMI, Medical Conditions [high blood pressure], Smoker Status, History of Various Conditions, Preventative Health Measures , Activities of Daily Living, Instrumental Activities of Daily Living) |
Comorbidity Measures Birth Weight |
| Measures of Socioeconomic Status: (Occupation, Employment Status, Income, Wealth, Place of Residence, Household Size & Composition, geographic location) |
Place of Residence Median Household Income |
| Site of Service Information: |
Hospital Location ( e.g., State, zip code, etc.) Site of Service Transition Information |
| Measures of Healthcare Outcomes: (Mortality, Morbidity, Mobility, Functional Status, Quality of Life, Quality Measures, Quality of Care, Readmissions) |
In-Hospital Mortality Disposition of Patient |
| Strengths, Limitations & Feasibility | |
| Data Strengths: | Representative of all insurance types. Large sample size that allows researchers to study rare conditions. |
| Data Limitations: | Missing data values can compromise the quality of estimates. If the outcome for discharges with missing values is different from the outcome for discharges with valid values, then sample estimates for that outcome will be biased and inaccurately represent the discharge population. For example, race is missing on 15% of discharges in the 2009 KID because some hospitals and HCUP State Partners do not supply it. |
| Data Access Restrictions: | Access to KIDs is open to users who complete a Data Use Agreement and purchase the data. Uses are limited to research and aggregate statistical reporting. |
| Data Linking Feasibility: (Unique identifiers or sufficient demographics to allow for data linkages) | The database contains AHA hospital identifiers. However, many states do not report this information. |
| Related Grouping Systems: | HCUP Clinical Classifications System (CCS) |
|
References: Overview of the Kids’ Inpatient Database (KID). 2013. http://www.hcup-us.ahrq.gov/kidoverview.jsp Introduction to The HCUP KID’s Inpatient Database (KID) 2009. Healthcare Cost and Utilization Project (HCUP). 2013. http://www.hcup-us.ahrq.gov/db/nation/kid/KID_2009_Introduction.pdf |
|
| Healthcare Cost & Utilization Project - Nationwide Emergency Department Sample | |
|---|---|
| Database Description | |
| White Paper(s): | Data Systems and the Prevalence of Chronic Disease Combinations & Multiple Chronic Conditions and Disparities |
| Sponsorship: | Agency for Healthcare Research & Quality |
| Description: | The Nationwide Emergency Department Sample (NEDS) is a unique and powerful database that yields national estimates of emergency department (ED) visits. The NEDS was created to enable analyses of emergency department (ED) utilization patterns and support public health professionals, administrators, policymakers, and clinicians in their decision-making regarding this critical source of care. NEDS is the largest all-payer ED database in the U.S. |
| Database: (Scope, Size, Setting, Population, Age Range) | National; 25–30 million records |
| Database Type: (Survey, Registry, Research Study, Program Database, Claims, Administrative Data, and Clinical Databases) | A Federal-State-Industry database of Medicare, Medicaid, Private Insurance and Uninsured ED patient discharge records. |
| Database Source/Origin: | As of 2010, NEDS contains administrative data from over 961 hospitals in 28 States. |
| Date or Frequency of Data Collection: | 2006-2010; updated yearly. |
| Longitudinal vs. Cross-sectional Database: | Longitudinal |
| Data Collection Methodology: | NEDS is developed from data from ED visits submitted by participating States. |
| Sampling Strategy: | Similar to the design of the Nationwide Inpatient Sample (NIS), NEDS is developed using a 20% stratified sample of institutions; NEDS is a sample of U.S. hospital-based EDS who participate in the program (n=28). Sampling rate is 20% NEDS to Universe and 37.6% NEDS to Frame. |
| Unit of Analysis: | Episode |
| Diagnosis Information | |
| Diagnosis Variable Type: (Chronic Condition Status, Principal Diagnosis, Primary Diagnosis, Secondary Diagnosis, Admit/Discharge Diagnosis and Self-Reported Diagnosis) |
Number of Chronic Conditions Primary and Secondary Diagnoses Injury Descriptive Variables |
| Diagnosis Codes: (ICD-9, ICD-10, SNOMED) | ICD-9-CM, CPT-4 |
| Number of Diagnoses Captured: | NEDS contains up to 15 diagnoses per record. This number may differ by State. |
| Cost, Utilization & Clinical Information | |
| Measures of Cost: (Claims, Out-of-pocket expenses, Self- reported expenditures, and Prescription Drug Costs) | Total ED charges and total hospital charges (for inpatient stays for those ED visits that result in admission) |
| Measures of Healthcare Utilization: (Number of Visits, Any Procedures/Number of Procedures/Type of Procedure, Number of Admission/Type of Admission, Length of Stay, Hospitalizations, Emergency Department Utilization, etc.) |
ED Event Type/Number of Visits Length of Stay Number of Discharges |
| Measures of Healthcare Access: | Database used to evaluate healthcare access through the use of geographic and hospital type variables (i.e. critical access). |
| Demographic Information: (Sex, Age, Race, Ethnicity, Marital Status, Disability Status, Language, Insurance Type, Educational Attainment). | Gender, Age, Urban-Rural designation of resident, expected payment source ( e.g., Medicare, Medicaid, self- pay) |
| Clinical Information: (BMI, Medical Conditions [high blood pressure], Smoker Status, History of Various Conditions, Preventative Health Measures , Activities of Daily Living, Instrumental Activities of Daily Living) | ICD-9-CM and CPT-4 procedures and diagnoses Identification of injury-related ED visits including mechanism and intent of injury and severity of injury Discharge status from the ED |
| Measures of Socioeconomic Status: (Occupation, Employment Status, Income, Wealth, Place of Residence, Household Size & Composition, geographic location) | National quartile of median household income (from patient’s ZIP Code) |
| Site of Service Information: | Hospital location (e.g., State, zip code, etc.) and characteristics (e.g., teaching status, region, ownership type). |
| Measures of Healthcare Outcomes: (Mortality, Morbidity, Mobility, Functional Status, Quality of Life, Quality Measures, Quality of Care, Readmissions) | Discharge Status |
| Strengths, Limitations & Feasibility | |
| Data Strengths: | NEDS is the largest all-payer ED database in the U.S., with many research applications. It includes information on patients covered by all types of insurances. |
| Data Limitations: | The NEDS contains event-level records, not patient-level records. This means that individual patients who visit the ED multiple times in one year may be present in NEDS multiple times. There is no uniform patient identifier available that would allow a patient-level analysis with the NEDS. In contrast, the HCUP state databases may be used for this type of analysis |
| Data Access Restrictions: | Access to NEDS is open to users who complete a Data Use Agreement and purchase the data. Uses are limited to research and aggregate statistical reporting. |
| Data Linking Feasibility: (Unique identifiers or sufficient demographics to allow for data linkages) | For most States, the NIS includes hospital identifiers that permit linkages to the American Hospital Association Annual Survey Database and county identifiers that permit linkages to the Area Resource File. |
| Related Grouping Systems: | HCUP Clinical Classifications System (CCS) |
|
References: Overview of the Nationwide Emergency Department Sample (NEDS). 2013. http://www.hcup-us.ahrq.gov/nedsoverview.jsp |
|
| Name: Healthcare Cost & Utilization Project - Nationwide Inpatient Sample | |
|---|---|
| Database Description | |
| White Paper(s): | Data Systems and the Prevalence of Chronic Disease Combinations & Multiple Chronic Conditions and Disparities |
| Sponsorship: | Agency for Healthcare Research & Quality |
| Description: | The Nationwide Inpatient Sample (NIS) is a unique and powerful database of hospital inpatient stays. Researchers and policymakers use the NIS to identify, track, and analyze national trends in health care utilization, access, charges, quality, and outcomes. It is the largest publicly available all-payer patient care database in the U.S. |
| Database: (Scope, Size, Setting, Population, Age Range) | National; Information available on approximately 8 million hospital stays per year. |
| Database Type: (Survey, Registry, Research Study, Program Database, Claims, Administrative Data, and Clinical Databases) | A Federal-State-Industry database of Medicare, Medicaid, Private Insurance and Uninsured patient discharges. |
| Database Source/Origin: | Administrative data from 1,051 hospitals from 44 states. |
| Date or Frequency of Data Collection: | 1988–2010; updated yearly |
| Longitudinal vs. Cross-sectional Database: | Longitudinal |
| Data Collection Methodology: | NIS contains clinical and resource use information included in a patient discharge abstract and is submitted to HCUP by over 1,000 hospitals in the U.S. |
| Sampling Strategy: | The NIS is a stratified probability sample of hospitals, with sampling probabilities calculated to select 20% of the universe of community, non-rehabilitation hospitals in specific strata for ease of use. The entire sampling frame from 46 states includes >90% of hospitals and >95% of discharges from community hospitals. |
| Unit of Analysis: | Multiple (patient, hospital, region, etc.) |
| Diagnosis Information | |
| Diagnosis Variable Type: (Chronic Condition Status, Principal Diagnosis, Primary Diagnosis, Secondary Diagnosis, Admit/Discharge Diagnosis and Self-Reported Diagnosis) | Major Diagnosis Category (MDC) Primary and secondary diagnosis Admission and discharge status Number of Chronic Conditions |
| Diagnosis Codes: (ICD-9, ICD-10, SNOMED) | ICD-9 |
| Number of Diagnoses Captured: | NIS contains up to 25 diagnoses per record (15 prior to the 2009 NIS). The number of diagnoses varies by State; some states provide as many as 66 diagnoses while other states provide as few as 9 diagnoses. |
| Cost, Utilization & Clinical Information | |
| Measures of Cost: (Claims, Out-of-pocket expenses, Self- reported expenditures, and Prescription Drug Costs) | Total Charges |
| Measures of Healthcare Utilization: (Number of Visits, Any Procedures/Number of Procedures/Type of Procedure, Number of Admission/Type of Admission, Length of Stay, Hospitalizations, Emergency Department Utilization, etc.) |
Length of Stay Type of Admission Number of Discharges |
| Measures of Healthcare Access: | Database used to evaluate healthcare access through the use of geographic and hospital status variables ( e.g., CAH status). |
| Demographic Information: (Sex, Age, Race, Ethnicity, Marital Status, Disability Status, Language, Insurance Type, Educational Attainment). | Gender, age, race, median income for zip code, and Expected Primary and Secondary Payment Sources. |
| Clinical Information: (BMI, Medical Conditions [high blood pressure], Smoker Status, History of Various Conditions, Preventative Health Measures , Activities of Daily Living, Instrumental Activities of Daily Living) |
Primary and secondary procedures Disease Severity Measures Comorbidity Measures |
| Measures of Socioeconomic Status: (Occupation, Employment Status, Income, Wealth, Place of Residence, Household Size & Composition, geographic location) |
Place of Residence Median household income for patient’s ZIP Code |
| Site of Service Information: | Hospital location ( e.g., State, zip code, etc.) and characteristics ( e.g., teaching status, region, ownership type). |
| Measures of Healthcare Outcomes: (Mortality, Morbidity, Mobility, Functional Status, Quality of Life, Quality Measures, Quality of Care, Readmissions) |
Disposition of Patient In-hospital Death |
| Strengths, Limitations & Feasibility | |
| Data Strengths: | The NIS is the largest publicly available all-payer inpatient care database in the U.S. with information from 45 states, comprising over 96% of the U.S. population. The NIS’ large sample size enables analyses of rare conditions, uncommon treatments, and special patient populations (such as the uninsured). |
| Data Limitations: | Missing data values can compromise the quality of estimates. If the outcome for discharges with missing values is different from the outcome for discharges with valid values, then sample estimates for that outcome will be biased and inaccurately represent the discharge population. For example, race is missing on over 11% of discharges in the 2010 NIS because some hospitals and HCUP State Partners do not supply it. Not all states report patient identifiers and complete diagnostic information. |
| Data Access Restrictions: | Access to NIS is open to users who complete a Data Use Agreement and purchase the data. |
| Data Linking Feasibility: (Unique identifiers or sufficient demographics to allow for data linkages) | The database contains AHA hospital identifiers. However, many states do not report this information. |
| Related Grouping Systems: | HCUP Clinical Classifications System (CCS) |
|
References: Overview of Nationwide Inpatient Sample (NIS). 2013. http://www.hcup-us.ahrq.gov/nisoverview.jsp |
|
| Medical Expenditure Panel Survey | |
|---|---|
| Database Description | |
| White Paper(s): | Data Systems and the Prevalence of Chronic Disease Combinations & Multiple Chronic Conditions and Disparities |
| Sponsorship: | Agency for Healthcare Research and Quality |
| Description: | The Medical Expenditure Panel Survey (MEPS) is a set of large-scale surveys of families and individuals, their medical providers, and employers across the United States. MEPS is the most complete source of data on the cost and use of health care and health insurance coverage. |
| Database: (Scope, Size, Setting, Population, Age Range) | National; approximately 35,000 persons interviewed annually. |
| Database Type: (Survey, Registry, Research Study, Program Database, Claims, Administrative Data, and Clinical Databases) | Survey/Interviews
Two Primary Components
|
| Database Source/Origin: | Survey data from a set of large-scale surveys of families and individuals, their medical providers, and employers in the U.S. |
| Date or Frequency of Data Collection: | 1996–2012; updated annually. |
| Longitudinal vs. Cross-sectional Database: | Longitudinal |
| Data Collection Methodology: | For the Household Component, a panel survey design in used to collect data via multiple rounds of interviewing over a two year period of time. For the Insurance component, an annual survey of employers is conducted that collections information on health insurance offerings. |
| Sampling Strategy: | The Household Component collects data from a sample of families and individuals in selected communities across the U.S., drawn from a nationally representative subsample of households that participated in the prior year’s National Health Interview Survey. The Insurance Component collects information from Household Component respondent employers or other non-related employers. |
| Unit of Analysis: | Household or Employer |
| Diagnosis Information | |
| Diagnosis Variable Type: (Chronic Condition Status, Principal Diagnosis, Primary Diagnosis, Secondary Diagnosis, Admit/Discharge Diagnosis and Self-Reported Diagnosis) | Self-Reported Diagnosis transformed into ICD-9 Codes |
| Diagnosis Codes: (ICD-9, ICD-10, SNOMED) | ICD-9 |
| Number of Diagnoses Captured: | MEPS identifies specific physical and mental health conditions, accidents, or injuries affecting each respondent. 670 clinical categories are created. |
| Cost, Utilization & Clinical Information | |
| Measures of Cost: (Claims, Out-of-pocket expenses, Self- reported expenditures, and Prescription Drug Costs) | Total Health Care Expenditures, Total Expenditures Paid by Insurance, Hospital Outpatient Expenditures, Hospital Emergency Room Expenditures, Hospital Inpatient Expenditures, Dental Expenditures, Home Health Care Expenditures, Vision Aid Expenditures, Other Medical Equipment and Service Expenditures, and Prescription Drug Expenditures |
| Measures of Healthcare Utilization: (Number of Visits, Any Procedures/Number of Procedures/Type ofProcedure, Number of Admission/Type ofAdmission, Length of Stay, Hospitalizations, Emergency Department Utilization, etc.) | Medical Provider Visits (Physician, etc.), Hospital Outpatient Visits, Hospital Emergency Room Visits, Hospital Inpatient Visits, Dental Visits, Home Health Care Visits, Number of Drugs Prescribed , and Length of Stay |
| Measures of Healthcare Access: | Presence of provider who provides the usual source of care, reasons why members without usual care do not have it, various aspects of satisfaction with usual care providers, and problems experience in obtaining needed health care |
| Demographic Information: (Sex, Age, Race, Ethnicity, Marital Status,Disability Status, Language, Insurance Type, Educational Attainment). | Age, Sex, Race/Ethnicity, Insurance Status, Marital Status, and Disability Status |
| Clinical Information: (BMI, Medical Conditions [high blood pressure], Smoker Status, History of Various Conditions, Preventative Health Measures , Activities of Daily Living, Instrumental Activities of Daily Living) | Prescribed Medicine, Pregnancy Detail |
| Measures of Socioeconomic Status: (Occupation, Employment Status, Income, Wealth, Place of Residence, Household Size & Composition, geographic location) | Family Income as Percent of Poverty Line, Employment Status, Total Income, geographic location, and Size of Family |
| Site of Service Information: | Type of Service ( e.g., hospital, nursing home, etc.) |
| Measures of Healthcare Outcomes: (Mortality, Morbidity, Mobility, Functional Status, Quality of Life, Quality Measures, Quality of Care, Readmissions) |
Self-Reported Overall Health Status Self-Reported Physical Health Status Self-Reported Mental Health Status |
| Strengths, Limitations & Feasibility | |
| Data Strengths: | MEPS provides a level of breadth and depth of healthcare utilization information that is not captured in other surveys. |
| Data Limitations: | Even after pooling several years of MEPS data, sample size limitations and confidentiality restrictions make MEPS data unsuitable for certain types of analysis. For example, the MEPS data do not support research on rare conditions. Moreover, information on conditions is household-reported and not verified by clinical records. All MEPS data are reported by one designated household respondent. |
| Data Access Restrictions: | Some files are accessible to the public; however only researchers and users with approved access can gain access to restricted files. |
| Data Linking Feasibility: (Unique identifiers or sufficient demographics to allow for data linkages) | Data can only be linked be survey number, which limits the feasibility of linking to non-MEPS-related data sources. |
| Related Grouping Systems: | ICD-based grouping systems. |
|
References: Medicare Expenditure Panel Survey (MEPS). 2013. http://meps.ahrq.gov/mepsweb/ |
|
Center for Disease Control and Prevention Datasets
| Behavioral Risk Factor Surveillance System | |
|---|---|
| Database Description | |
| White Paper(s): | Data Systems and the Prevalence of Chronic Disease Combinations & Multiple Chronic Conditions and Disparities |
| Sponsorship: | Center for Disease Control and Prevention |
| Description: | The Behavioral Risk Factor Surveillance System (BRFSS) is the world’s largest, on-going telephone health survey system, tracking health conditions and risk behaviors in the United States yearly since 1984. Currently, data are collected monthly in all 50 states, the District of Columbia, Puerto Rico, the U.S. Virgin Islands, and Guam. |
| Database: (Scope, Size, Setting, Population, Age Range) | National; approximately 350,000 non-institutionalized adults (aged 18 years or older) are interviewed each year. One adult is interviewed per household. |
| Database Type: (Survey, Registry, Research Study, Program Database, Claims, Administrative Data, and Clinical Databases) | Multi-mode survey (mail, landline, and cell phone) |
| Database Source/Origin: | Initiated in 1894 with 15 states collecting surveillance data on risk behaviors through monthly telephone interviews. By 2001 the 50 states, District of Columbia, Puerto Rico, and Virgin Islands were participating in the BRFSS. |
| Date or Frequency of Data Collection: | 1984–2012; survey conducted monthly and report compiled by the CDC annually |
| Longitudinal vs. Cross-sectional Database: | Cross-sectional |
| Data Collection Methodology: | With technical assistance from the CDC, state health departments use in-house interviewers or contract with telephone call centers of universities to conduct BRFFS survey. |
| Sampling Strategy: | The survey is conducted using Random Digit Dialing (RDD) techniques on both landlines and cell phones. |
| Unit of Analysis: | Respondent |
| Diagnosis Information | |
| Diagnosis Variable Type: (Chronic Condition Status, Principal Diagnosis, Primary Diagnosis, Secondary Diagnosis, Admit/Discharge Diagnosis and Self-Reported Diagnosis) | Self-reported conditions |
| Diagnosis Codes: (ICD-9, ICD-10, SNOMED) | The BRFSS does not utilized diagnosis codes. |
| Number of Diagnoses Captured: | BRFSS asks respondents about the following conditions: MI, CHD, Stroke, Asthma, Skin Cancer, Other Cancer, COPD, Arthritis, Depression, Kidney Disease, Vision Impairment, Diabetes, and HIV/AIDS. |
| Cost, Utilization & Clinical Information | |
| Measures of Cost: (Claims, Out-of-pocket expenses, Self- reported expenditures, and Prescription Drug Costs) | The BRFSS only asks if cost is a barrier to obtaining healthcare services for specific conditions. |
| Measures of Healthcare Utilization: (Number of Visits, Any Procedures/Number of Procedures/Type of Procedure, Number of Admission/Type of Admission, Length of Stay, Hospitalizations, Emergency Department Utilization, etc.) | Utilization of preventive healthcare services information is collected. |
| Measures of Healthcare Access: | Questions are included related to insurance, regular care provider, and last health checkup. |
| Demographic Information: (Sex, Age, Race, Ethnicity, Marital Status, Disability Status, Language, Insurance Type, Educational Attainment, Income). | Age, Gender, Hispanic vs. Latino, Race, Military Status, Insurance Status/Type, Educational Obtainment, Disability Status and Income. |
| Clinical Information: (BMI, Medical Conditions [high blood pressure], Smoker Status, History of Various Conditions, Preventative Health Measures , Activities of Daily Living, Instrumental Activities of Daily Living) | Hypertension Status, High Cholesterol Status, Risky Health, Behaviors (i.e. tobacco use), Pregnancy Status, Fruit and Vegetable Consumption, Physical Activity Level, and Immunizations. |
| Measures of Socioeconomic Status: (Occupation, Employment Status, Income, Wealth, Place of Residence, Household Size & Composition, geographic location) | Household Size, Employment Status, Household Income, Zip Code, and Own vs. Rent Home. |
| Site of Service Information: | The BRFSS does not include information on site of service. |
| Measures of Healthcare Outcomes: (Mortality, Morbidity, Mobility, Functional Status, Quality of Life, Quality Measures, Quality of Care, Readmissions) |
Self-reported Health Status Self-reported Health-Related Quality of Life |
| Strengths, Limitations & Feasibility | |
| Data Strengths: | THE BRFSS raking methodology includes categories of age by gender, detailed race and ethnicity groups, education levels, marital status, regions within states, gender by race and ethnicity, telephone source, renter/owner status, and age groups by race and ethnicity. In 2011, 50 states, the District of Columbia, Guam, and Puerto Rico collected samples of both landline and cell phone interviews, while the Virgin Islands collected a sample of landline-only interviews. |
| Data Limitations: | Limitations on the reliability and validity of self-reported behaviors, with some over-reported, and others underreported. Only administered in English and Spanish. An increasing numbers of households lack landlines. |
| Data Access Restrictions: | BRFSS data is publicly available. |
| Data Linking Feasibility: (Unique identifiers or sufficient demographics to allow for data linkages) | No direct identifiers, except telephone number. |
| Related Grouping Systems: | n/a |
|
References: Centers for Disease Control and Prevention. Behavioral Risk Factor Surveillance System. 2013. http://www.cdc.gov/brfss/ |
|
| National Ambulatory Medical Care Survey | |
|---|---|
| Database Description | |
| White Paper(s): | Data Systems and the Prevalence of Chronic Disease Combinations |
| Sponsorship: | Centers for Disease Control and Prevention |
| Description: | The National Ambulatory Medical Care Survey (NAMCS) is a national survey designed to provide information about the provision and use of ambulatory medical care services in the United States. Data are obtained on patients' symptoms, physicians' diagnoses, and medications ordered or provided. Information on services provided, including information on diagnostic procedures, patient management, and planned future treatment. |
| Database: (Scope, Size, Setting, Population, Age Range) | National; the NAMCS includes data on approximately 11,000 physicians from office-based settings and more than 6,000 CHC providers. |
| Database Type: (Survey, Registry, Research Study, Program Database, Claims, Administrative Data, and Clinical Databases) | Survey of physicians and providers. |
| Database Source/Origin: | Findings are based on a sample of visits to non-federal employed office-based physicians who are primarily engaged in direct patient care. Physicians in the specialties of anesthesiology, pathology, and radiology are excluded from the survey. |
| Date or Frequency of Data Collection: | The survey was conducted annually from 1973 to 1981, in 1985, and annually since 1989. |
| Longitudinal vs. Cross-sectional Database: | Cross-sectional. |
| Data Collection Methodology: | Specially trained interviewers visit physicians prior to their participation in the survey in order to provide them with survey materials and instruct them on how to complete the forms. Data collection is from physicians, rather than from patients, which provides an analytic base that expands information on ambulatory care collected through other ambulatory surveys. Each physician is randomly assigned to a 1-week reporting period. During this period, data for a systematic random sample of visits are recorded by the physician or office staff on an encounter form provided for that purpose. |
| Sampling Strategy: | Data is obtained from sample of visits to non-federal employed office-based physicians who are primarily engaged in direct patient care. |
| Unit of Analysis: | Physicians |
| Diagnosis Information | |
| Diagnosis Variable Type: (Chronic Condition Status, Principal Diagnosis, Primary Diagnosis, Secondary Diagnosis, Admit/Discharge Diagnosis and Self-Reported Diagnosis) | Common primary diagnosis. |
| Diagnosis Codes: (ICD-9, ICD-10, SNOMED) | ICD-9-CM. Drug data are coded using a unique classification scheme developed at NCHS. |
| Number of Diagnoses Captured: | Information is collected on the following chronic conditions: Cerebrovascular disease, Congestive heart failure, Chronic renal failure, HIV, and diabetes. |
| Cost, Utilization & Clinical Information | |
| Measures of Cost: (Claims, Out-of-pocket expenses, Self- reported expenditures, and Prescription Drug Costs) | Source of payment |
| Measures of Healthcare Utilization: (Number of Visits, Any Procedures/Number of Procedures/Type ofProcedure, Number of Admission/Type ofAdmission, Length of Stay, Hospitalizations, Emergency Department Utilization, etc.) | Number of past visits in last 12 months, major reason for visit, time spent with the physician, previous care – seen in ED in last 72 hours/ discharged from hospital in last 7 days, counseling/ education/ therapy, surgical procedures, patient’s primary care physician provider, was patient referred for visit, and patient seen before. |
| Measures of Healthcare Access: | NAMCS does not have measures of healthcare access. |
| Demographic Information: (Sex, Age, Race, Ethnicity, Marital Status, Disability Status, Language, Insurance Type, Educational Attainment). | Age, Sex, and Ethnicity/Race. |
| Clinical Information: (BMI, Medical Conditions [high blood pressure], Smoker Status, History of Various Conditions, Preventative Health Measures , Activities of Daily Living, Instrumental Activities of Daily Living) | Pain level, Tobacco use, Respiratory rate, Episode of care, Glasgow coma scale (GCS), and On oxygen on arrival. |
| Measures of Socioeconomic Status: (Occupation, Employment Status, Income, Wealth, Place of Residence, Household Size & Composition, geographic location) | Place of residence |
| Site of Service Information: | Hospitals and community health centers identified. |
| Measures of Healthcare Outcomes: (Mortality, Morbidity, Mobility, Functional Status, Quality of Life, Quality Measures, Quality of Care, Readmissions) | Discharge status |
| Strengths, Limitations & Feasibility | |
| Data Strengths: | Data are collected on key policy issues pertaining to health. There are multiple years of data available. |
| Data Limitations: | The item nonresponse rate for ethnicity and race is approximately 20%. |
| Data Access Restrictions: | Data are available to the public at no cost. Restricted files which contain additional variables and non-masked data can be accessed by applying to the NCHS Research Data Center and paying a fee. |
| Data Linking Feasibility: (Unique identifiers or sufficient demographics to allow for data linkages) | The NAMCS does not include unique identifiers to link patients. |
| Related Grouping Systems: | ICD-based grouping systems. |
|
References: Centers for Disease Control and Prevention. Ambulatory Health Care Data. 2013. http://www.cdc.gov/nchs/ahcd.htm |
|
| National Health Interview Survey | |
|---|---|
| Database Description | |
| White Paper(s): | Data Systems and the Prevalence of Chronic Disease Combinations & Multiple Chronic Conditions and Disparities |
| Sponsorship: | Centers for Disease Control and Prevention |
| Description: | The National Health Interview Survey is the principal source of information on the health of the civilian non- institutionalized population of the United States and is one of the major data collection programs of the National Center for Health Statistics. |
| Database: (Scope, Size, Setting, Population, Age Range) | National; approximately 100,000 individuals. |
| Database Type: (Survey, Registry, Research Study, Program Database, Claims, Administrative Data, and Clinical Databases) | Household survey |
| Database Source/Origin: | Surveys of households. |
| Date or Frequency of Data Collection: | Annually since 1957, but revised every 10–15 years. Sampling and interviewing are continuous throughout the year |
| Longitudinal vs. Cross-sectional Database: | The National Health Interview Survey is a cross-sectional household interview survey. |
| Data Collection Methodology: | Sampled by household – one child and one adult are selected to complete the Sample Adult and Sample Child components of the survey. Sampling methods are redesigned after every census. |
| Sampling Strategy: | Sampling and interviewing are continuous throughout each year. The sampling plan follows a multistage area probability design that permits the representative sampling of households and non-institutional group quarters (e.g., college dormitories). The sampling plan is redesigned after every decennial census. The current sampling plan was implemented in 2006. It has many similarities to the previous sampling plan, which was in place from 1995 to 2005. The first stage of the current sampling plan consists of a sample of 428 primary sampling units (PSU's) drawn from approximately 1,900 geographically defined PSU's that cover the 50 States and the District of Columbia. A PSU consists of a county, a small group of contiguous counties, or a metropolitan statistical area. |
| Unit of Analysis: | Households, Individuals and Geographic Region. |
| Diagnosis Information | |
| Diagnosis Variable Type: (Chronic Condition Status, Principal Diagnosis, Primary Diagnosis, Secondary Diagnosis, Admit/Discharge Diagnosis and Self-Reported Diagnosis) | Self-reported diagnosis information. |
| Diagnosis Codes: (ICD-9, ICD-10, SNOMED) | Self-report diagnosis. |
| Number of Diagnoses Captured: | Self-reported diagnosis information collected on: Hypertension/ high blood pressure, High cholesterol, Coronary heart disease, Angina, Heart attack, Heart condition/ heart disease, Stroke, Emphysema, COPD, Asthma, Ulcer, Cancer or malignancy of any kind/ benign tumors/cysts, Diabetes, Seizure disorder or epilepsy, Sinusitis, Chronic bronchitis, Weak or failing kidneys, bladder or renal problem, Liver condition, Fibromyalgia, lupus, Multiple Sclerosis, Muscular Dystrophy, Osteoporosis or tendinitis, Polio, paralysis, para/quadriplegia, Parkinson’s disease, other tremors, Hernia, Varicose veins, hemorrhoids, Thyroid problems, Grave’s disease, gout, Hearing problems, Depression, anxiety, or an emotional problem, Pain, ache, stiffness in or around a joint, bone injury, Arthritis, Birth defect, intellectual disability/ developmental problem, Senility, Weight problems, Missing limbs, Circulation problems / blood clots, Severe headache or migraine, Stomach or intestinal illness, Pregnant, Vision/ blindness, Teeth loss, Weak immune system (due to leukemia, lymphoma, HIV), Nerve damage/carpal tunnel syndromes, and Hepatitis. |
| Cost, Utilization & Clinical Information | |
| Measures of Cost: (Claims, Out-of-pocket expenses, Self- reported expenditures, and Prescription Drug Costs) | Affordability of prescription medicines, Affordability of doctors, Affordability of dental care, and Affordability of insurance. |
| Measures of Healthcare Utilization: (Number of Visits, Any Procedures/Number of Procedures/Type ofProcedure, Number of Admission/Type ofAdmission, Length of Stay, Hospitalizations, Emergency Department Utilization, etc.) | Emergency room visit/ hospital visit , Asthma action plan/ class on managing asthma, Routine checkup for asthma, Taking insulin. Use hearing aid, Usual place to go when sick, Health care change due to health insurance change, Received home health visits, Received surgery, Received flu/ tetanus/ hepatitis/ HPV shot and Pap smear/ mammogram. |
| Measures of Healthcare Access: | Lack of transportation to health care, Lack of available doctors, Lack of doctors’ offices open at convenient times, Worried about paying medical bills, Health care coverage compared to past year, Skipped medication to save money, and Communicate with a healthcare provider online. |
| Demographic Information: (Sex, Age, Race, Ethnicity, Marital Status, Disability Status, Language, Insurance Type, Educational Attainment). | Age, sex, sexual orientation. |
| Clinical Information: (BMI, Medical Conditions [high blood pressure], Smoker Status, History of Various Conditions, Preventative Health Measures , Activities of Daily Living, Instrumental Activities of Daily Living) | Smoker status, Exercise, Drinker status, Height and Weight. |
| Measures of Socioeconomic Status: (Occupation, Employment Status, Income, Wealth, Place of Residence, Household Size & Composition, geographic location) | Employment status, Business/ industry, Activities at job, Size of business, Paid by the hour or salaried, Paid sick leave, Multiple jobs held, and time at current residence. |
| Site of Service Information: | Site of Service is not collected of the NHIS. |
| Measures of Healthcare Outcomes: (Mortality, Morbidity, Mobility, Functional Status, Quality of Life, Quality Measures, Quality of Care, Readmissions) | Morbidity and Mortality. |
| Strengths, Limitations & Feasibility | |
| Data Strengths: | Includes questions that can be used to analyze demographic and socioeconomic characteristics and health trends. |
| Data Limitations: | Cross-sectional data; it cannot be used study patients over time. Sample sizes are too small to provide accurate state- level statistics. |
| Data Access Restrictions: | NHIS data files are available to download at no charge. All files from 1963–2011 are available online |
| Data Linking Feasibility: (Unique identifiers or sufficient demographics to allow for data linkages) | AHRQ provides a crosswalk to merge the MEPS and NHIS data. Mortality data, Medicare enrollment and claims data, and social security and benefit history data are all linked to NHIS data. The National Immunization Provider Records Check Survey is also linked to NHIS data. |
| Related Grouping Systems: | n/a |
|
References: Centers for Disease Control and Prevention. National Health Interview Survey. 2013. http://www.cdc.gov/nchs/nhis.htm |
|
| National Health and Nutrition Examination Survey | |
|---|---|
| Database Description | |
| White Paper(s): | Data Systems and the Prevalence of Chronic Disease Combinations & Multiple Chronic Conditions and Disparities |
| Sponsorship: | Center for Disease Control and Prevention |
| Description: | The National Health and Nutrition Examination Survey (NHANES) is a program of studies designed to assess the health and nutritional status of adults and children in the United States. The survey is unique in that it combines interviews and physical examinations. Findings from this survey are used to determine prevalence ofmajor diseases and risk factors for diseases. |
| Database: (Scope, Size, Setting, Population, Age Range) | National; 5,000 Surveys conducted annually. |
| Database Type: (Survey, Registry, Research Study, Program Database, Claims, Administrative Data, and Clinical Databases) | Survey and Physical Examination |
| Database Source/Origin: | Health interviews are conducted in respondents’ homes. Health measurements are performed in specially- designed and equipped mobile centers, which travel to locations throughout the country. The study team consists of a physician, medical and health technicians, as well as dietary and health interviewers. |
| Date or Frequency of Data Collection: | As of 1999, NHANES has been conducted on an annual basis. |
| Longitudinal vs. Cross-sectional Database: | Cross-sectional Survey |
| Data Collection Methodology: | NHANES includes clinical examinations, selected medical and laboratory tests, and self-reported data. Medical examinations and laboratory tests follow very specific protocols and are as standard as possible to ensure comparability across sites and providers. Beginning in 1999, NHANES became a continuous, annual survey. Data are collected every year from a representative sample of the civilian non-institutionalized U.S. population, newborns and older, by in-home personal interviews and physical examinations in the mobile examination centers. |
| Sampling Strategy: | The sample design is a complex, multistage, clustered design using unequal probabilities of selection. Low- income persons, adolescents 12-19 years of age, persons 60 years of age and over, African Americans, and persons of Mexican origin are oversampled. The sample is not designed to provide nationally representative estimates for the population of U.S Hispanics. |
| Unit of Analysis: | Respondent/Interviewee |
| Diagnosis Information | |
| Diagnosis Variable Type: (Chronic Condition Status, Principal Diagnosis, Primary Diagnosis, Secondary Diagnosis, Admit/Discharge Diagnosis and Self-Reported Diagnosis) | Self-Reported Conditions |
| Diagnosis Codes: (ICD-9, ICD-10, SNOMED) | Self-Reported Conditions |
| Number of Diagnoses Captured: | NHANES primarily studies nine categories of conditions: Obesity, Cardiovascular Health, Oral Health, Arthritis/Body Pain, Bone Density/Osteoporosis, Pulmonary Function, Endocrine Health, Renal Disease, and Allergy Inflammation. |
| Cost, Utilization & Clinical Information | |
| Measures of Cost: (Claims, Out-of-pocket expenses, Self- reported expenditures, and Prescription Drug Costs) | NHANES does not capture information on cost. |
| Measures of Healthcare Utilization: (Number of Visits, Any Procedures/Number of Procedures/Type of Procedure, Number of Admission/Type of Admission, Length of Stay, Hospitalizations, Emergency Department Utilization, etc.) |
Hospital Utilization/Stays ED Utilization |
| Measures of Healthcare Access: | NHANES includes specific questions on healthcare access. |
| Demographic Information: (Sex, Age, Race, Ethnicity, Marital Status,Disability Status, Language, Insurance Type, Educational Attainment). | Educational Attainment, Marital Status, Language, Race/Ethnicity, including subgroups and Health Insurance Status. |
| Clinical Information: (BMI, Medical Conditions [high blood pressure], Smoker Status, History of Various Conditions, Preventative Health Measures , Activities of Daily Living, Instrumental Activities of Daily Living) | Health Risk Behaviors, Health Risk Exposure Data, Weight History, Oral Health History, other clinical metrics are obtained during the interview by clinicians (i.e. blood pressure). |
| Measures of Socioeconomic Status: (Occupation, Employment Status, Income,Wealth, Place of Residence, Household Size & Composition, geographic location) | Veteran Status, Occupation, Employment Status and Income. |
| Site of Service Information: | For each condition, NHANES asks patients if they received care at a certain type of facility (ED, doctor’s office, etc.). |
| Measures of Healthcare Outcomes: (Mortality, Morbidity, Mobility, Functional Status, Quality of Life, Quality Measures, Quality of Care, Readmissions) |
Self-reported Health Status Self-reported Physical Functioning |
| Strengths, Limitations & Feasibility | |
| Data Strengths: | Estimates for previously undiagnosed conditions are produced from NHANES. |
| Data Limitations: | A major limitation of NHANES is that it is not geographically representative of the U.S. The sample selected to be demographically representative, but because two teams can only visit a total of 16 sites a year, it is impossible to achieve a good geographic spread. NHANES may not be optimal for detecting changes over time because one doesn’t know if the changes observed are due to geographic irregularities of the survey. |
| Data Access Restrictions: | Certain public use data files are open to the file. Many survey data elements are not available for public use. |
| Data Linking Feasibility: (Unique identifiers or sufficient demographics to allow for data linkages) | NHANES data have been linked with multiple years of Social Security Administrative Data, CMS Medicare enrollment and claims files include Part D data, and the National Death Index. |
| Related Grouping Systems: | n/a |
|
References: Centers for Disease Control and Prevention. National Health and Nutrition Examination Survey (NHANES). 2013. http://www.cdc.gov/nchs/nhanes.htm |
|
Centers for Medicare & Medicaid Services Datasets
| CMS Chronic Conditions Warehouse | |
|---|---|
References: Chronic Conditions Data Warehouse. 2013. https://www.ccwdata.org/web/guest/home | |
| Database Description | |
| White Paper(s): | Data Systems and the Prevalence of Chronic Disease Combinations |
| Sponsorship: | Centers for Medicare & Medicaid Services |
| Description: | The Chronic Condition Data Warehouse (CCW) is a research database designed to make Medicare, Medicaid, Assessments, and Part D Prescription Drug Event data more readily available to support research designed to improve the quality of care and reduce costs and utilization for chronic disease patients. Data is available across beneficiaries’ continuum of care. |
| Database: (Scope, Size, Setting, Population, Age Range) | National-Population-specific; All Medicare patients. |
| Database Type: (Survey, Registry, Research Study, Program Database, Claims, Administrative Data, and Clinical Databases) | The CMS Chronic Condition Warehouse is an amalgamation of linked datasets, including Medicare, Medicaid, and Part D Claims and Assessment data. |
| Database Source/Origin: | CCW contains the following 100% Medicare files for years 1999–2010:
100% Medicaid files for years 1999–2008 and 2009/partial states available. 100% Part D Prescription Drug Event data for years 2006–2010
|
| Date or Frequency of Data Collection: | Ongoing; Data from 1999–2010. |
| Longitudinal vs. Cross-sectional Database: | Longitudinal |
| Data Collection Methodology: | CCW data are linked by a unique, unidentifiable beneficiary key, which allows researchers to analyze information across the continuum of care. |
| Sampling Strategy: | All Medicare beneficiaries. |
| Unit of Analysis: | Medicare Beneficiary |
| Diagnosis Information | |
| Diagnosis Variable Type: (Chronic Condition Status, Principal Diagnosis, Primary Diagnosis, Secondary Diagnosis, Admit/Discharge Diagnosis and Self-Reported Diagnosis) | CCW has a specific condition algorithm to determine chronic condition categories. For each chronic condition category, specific primary, principal or secondary diagnosis codes are used to “flag” the event. |
| Diagnosis Codes: (ICD-9, ICD-10, SNOMED) | ICD-9, CPT4, HCPCS codes |
| Number of Diagnoses Captured: | Twenty-seven chronic conditions are maintained in the CCW. |
| Cost, Utilization & Clinical Information | |
| Measures of Cost: (Claims, Out-of-pocket expenses, Self- reported expenditures, and Prescription Drug Costs) | Medicare & Medicare Claims; Part D Prescription Drug Costs |
| Measures of Healthcare Utilization: (Number of Visits, Any Procedures/Number of Procedures/Type of Procedure, Number of Admission/Type of Admission, Length of Stay, Hospitalizations, Emergency Department Utilization, etc.) | Number of Claims, Number of Visits, and Type of Procedure. |
| Measures of Healthcare Access: | CCW includes an Access to Care File. |
| Demographic Information: (Sex, Age, Race, Ethnicity, Marital Status, Disability Status, Language, Insurance Type, Educational Attainment). | Sex, Race, Insurance Type, Dual Eligibility Status, Age, preferred language, marital status, etc. |
| Clinical Information: (BMI, Medical Conditions [high blood pressure], Smoker Status, History of Various Conditions, Preventative Health Measures , Activities of Daily Living, Instrumental Activities of Daily Living) | n/a |
| Measures of Socioeconomic Status: (Occupation, Employment Status, Income, Wealth, Place of Residence, Household Size & Composition, geographic location) | Zip code |
| Site of Service Information: | CCW includes information on site of service (hospital, nursing home, etc.) |
| Measures of Healthcare Outcomes: (Mortality, Morbidity, Mobility, Functional Status, Quality of Life, Quality Measures, Quality of Care, Readmissions) | Mortality, morbidity, Mobility, functional status, quality of life, quality measures, quality of care. |
| Strengths, Limitations & Feasibility | |
| Data Strengths: | Links beneficiaries across multiple care settings and representative of all Medicare patients. |
| Data Limitations: | Since claims for most services provided to Medicare beneficiaries in managed care do not reach the claim data files, the CCW Medicare claims should be viewed as providing utilization information primarily for the fee- for-service population. |
| Data Access Restrictions: | CCW data files may be requested for any of the predefined chronic condition cohorts, or users may request a customized cohort(s) specific to research focus areas. |
| Data Linking Feasibility: (Unique identifiers or sufficient demographics to allow for data linkages) | CCW files can be linked together via a single unique identifier for each beneficiary. |
| Related Grouping Systems: | ICD-based grouping systems. |
| CMS Medicare Provider Analysis and Review (MedPAR) File | |
|---|---|
References: CMS MedPAR Hospital Data File. 2013. http://www.healthdatastore.com/cms-medpar-hospital-data-file.aspx# | |
| Database Description | |
| White Paper(s): | Data Systems and the Prevalence of Chronic Disease Combinations |
| Sponsorship: | Centers for Medicare & Medicaid Services |
| Description: | The Medicare Provider Analysis and Review (MEDPAR) File contains data from claims for all services provided to beneficiaries admitted to Medicare certified inpatient hospitals and skilled nursing facilities (SNF). |
| Database: (Scope, Size, Setting, Population, Age Range) | National; representative of Medicare patients; 12 million in-patient visits |
| Database Type: (Survey, Registry, Research Study, Program Database, Claims, Administrative Data, and Clinical Databases) | Medicare Claims |
| Database Source/Origin: | Medicare claims for inpatient visits from over 6,000 hospitals. |
| Date or Frequency of Data Collection: | 1991–2012; updated yearly. |
| Longitudinal vs. Cross-sectional Database: | Longitudinal |
| Data Collection Methodology: | The Centers for Medicare and Medicaid Services (CMS) collects and releases data for all U.S. hospital inpatient stays for Medicare beneficiaries. Each record in the MedPAR file represents an inpatient stay during the calendar year of the file and has information on diagnosis, procedure, charge, payment, provider and patient for the claim. |
| Sampling Strategy: | All Medicare related inpatient hospital stays. |
| Unit of Analysis: | Inpatient Stay |
| Diagnosis Information | |
| Diagnosis Variable Type: (Chronic Condition Status, Principal Diagnosis, Primary Diagnosis, Secondary Diagnosis, Admit/Discharge Diagnosis and Self-Reported Diagnosis) | Principal Diagnosis Admission Diagnosis |
| Diagnosis Codes: (ICD-9, ICD-10, SNOMED) | ICD-9-CM |
| Number of Diagnoses Captured: | Up to 9 diagnoses and 6 surgical procedure codes are captured in the MedPAR file. |
| Cost, Utilization & Clinical Information | |
| Measures of Cost: (Claims, Out-of-pocket expenses, Self- reported expenditures, and Prescription Drug Costs) | Total Charges Total Payments |
| Measures of Healthcare Utilization: (Number of Visits, Any Procedures/Number of Procedures/Type of Procedure, Number of Admission/Type of Admission, Length of Stay, Hospitalizations, Emergency Department Utilization, etc.) | Number of Inpatients Visits Length of Stay |
| Measures of Healthcare Access: | n/a |
| Demographic Information: (Sex, Age, Race, Ethnicity, Marital Status, Disability Status, Language, Insurance Type, Educational Attainment). | Age, Gender and Race. |
| Clinical Information: (BMI, Medical Conditions [high blood pressure], Smoker Status, History of Various Conditions, Preventative Health Measures , Activities of Daily Living, Instrumental Activities of Daily Living) | n/a |
| Measures of Socioeconomic Status: (Occupation, Employment Status, Income, Wealth, Place of Residence, Household Size & Composition, geographic location) | State, Country Zip Code |
| Site of Service Information: | Hospital provider number can be used to identify geographic region. |
| Measures of Healthcare Outcomes: (Mortality, Morbidity, Mobility, Functional Status, Quality of Life, Quality Measures, Quality of Care, Readmissions) | Discharge Status |
| Strengths, Limitations & Feasibility | |
| Data Strengths: | Representative of all Medicare-related hospital inpatient admissions. |
| Data Limitations: | MedPAR data is generally available with one year lag time and covers around one-third of all hospital inpatients; and almost all of its patients are 65 plus. Consequently, some specialties such as Pediatrics and Obstetrics are practically absent. |
| Data Access Restrictions: | Because of data use restrictions, CMS cannot sell access to the raw data, but can provide a wide array of tabulations and descriptive statistics. |
| Data Linking Feasibility: (Unique identifiers or sufficient demographics to allow for data linkages) | n/a |
| Related Grouping Systems: | ICD-based grouping systems. |
| Medicare Health Outcomes Survey | |
|---|---|
References: Medicare Health Outcomes Survey. 2013. http://www.hosonline.org/Content/Default.aspx | |
| Database Description | |
| White Paper(s): | Data Systems and the Prevalence of Chronic Disease Combinations |
| Sponsorship: | Centers for Medicare & Medicaid Services |
| Description: | The Medicare HOS is the first outcomes measure used in Medicare managed care programs. The goal of the Medicare HOS program is to gather valid and reliable health status data in Medicare managed care for use in quality improvement activities, plan accountability, public reporting, and improving health. The Medicare HOS 2.0 contains four major components:
|
| Database: (Scope, Size, Setting, Population, Age Range) | Medicare beneficiaries 18 years or older enrolled in Medicare Advantage Organizations with a minimum of 500 enrollees. |
| Database Type: (Survey, Registry, Research Study, Program Database, Claims, Administrative Data, and Clinical Databases) | Survey |
| Database Source/Origin: | Patient Survey Data |
| Date or Frequency of Data Collection: | Once a year, starting in 1998. |
| Longitudinal vs. Cross-sectional Database: | Longitudinal |
| Data Collection Methodology: | Data is collected from participating Medicare Advantage Organizations (MAOs) with a minimum of 500 enrollees. |
| Sampling Strategy: | Each spring a random sample of Medicare beneficiaries is drawn from each participating MAO, that has a minimum of 500 enrollees and is surveyed (i.e., a survey is administered to a different baseline cohort, or group, each year). Two years later, these same respondents are surveyed again. Effective 2007, the MAO sample size is increased to twelve hundred. |
| Unit of Analysis: | Respondent, MAO’s, etc. |
| Diagnosis Information | |
| Diagnosis Variable Type: (Chronic Condition Status, Principal Diagnosis, Primary Diagnosis, Secondary Diagnosis, Admit/Discharge Diagnosis and Self-Reported Diagnosis) | Self-reported diagnosis |
| Diagnosis Codes: (ICD-9, ICD-10, SNOMED) | Self-reported diagnosis |
| Number of Diagnoses Captured: | Hypertension or high blood pressure, Angina pectoris or coronary artery disease, Congestive heart failure, Myocardial infarction or heart attack, Other heart conditions such as problems with heart valves or the rhythm of heartbeat, Stroke, Emphysema, or asthma, or COPD, Crohn’s disease, ulcerative, colitis, or inflammatory bowel disease, Arthritis of the hip or knee, Arthritis of the hand or wrist, Osteoporosis, Sciatica, Diabetes, high blood sugar, or sugar in the urine, Any cancer other than skin cancer, and Poor eyesight. |
| Cost, Utilization & Clinical Information | |
| Measures of Cost: (Claims, Out-of-pocket expenses, Self- reported expenditures, and Prescription Drug Costs) | n/a |
| Measures of Healthcare Utilization: (Number of Visits, Any Procedures/Number of Procedures/Type of Procedure, Number of Admission/Type of Admission, Length of Stay, Hospitalizations, Emergency Department Utilization, etc.) | Enrollment duration Caregiving for others in household |
| Measures of Healthcare Access: | Difficulty of getting around |
| Demographic Information: (Sex, Age, Race, Ethnicity, Marital Status, Disability Status, Language, Insurance Type, Educational Attainment). | Age, Gender, Marital Status, Race, and Education. |
| Clinical Information: (BMI, Medical Conditions [high blood pressure], Smoker Status, History of Various Conditions, Preventative Health Measures , Activities of Daily Living, Instrumental Activities of Daily Living) | BMI, Depression screen indicator, History of pain, Height History of falls, Comorbid Medical Conditions (Beneficiary reported) |
| Measures of Socioeconomic Status: (Occupation, Employment Status, Income, Wealth, Place of Residence, Household Size & Composition, geographic location) | Annual household income English language skills Household size Place of residence |
| Site of Service Information: | n/a |
| Measures of Healthcare Outcomes: (Mortality, Morbidity, Mobility, Functional Status, Quality of Life, Quality Measures, Quality of Care, Readmissions) | Health Status Activity Level |
| Strengths, Limitations & Feasibility | |
| Data Strengths: | Data can be used to assess the performance of MAOs and to reward high performers. Data can be used by health researchers to advance the state of the science in functional health outcomes measurement. Data can be used by managed care organizations, providers, and quality improvement organizations to monitor and improve health care quality. |
| Data Limitations: | Lacks cost information. Lacks information on chronic conditions besides the ones specifically inquired about. |
| Data Access Restrictions: | Several types of Medicare HOS data files are available for research purposes. Medicare HOS data files are available as public use files, limited data sets, and research identifiable files. |
| Data Linking Feasibility: (Unique identifiers or sufficient demographics to allow for data linkages) | Beneficiaries are identified through their health insurance claims numbers. However, a beneficiary’s HIC number can change through special circumstances. |
| Related Grouping Systems: | n/a |
HMO Research Network Dataset
| HMO Research Network Virtual Data Warehouse | |
|---|---|
References: National Cancer Institute. HMO Research Network. 2013. http://epi.grants.cancer.gov/pharm/pharmacoepi_db/hmorn.html | |
| Database Description | |
| White Paper(s): | Data Systems and the Prevalence of Chronic Disease Combinations & Multiple Chronic Conditions and Disparities. |
| Sponsorship: | HMO Research Network |
| Description: | The HMORN Virtual Data Warehouse is a series of datasets developed from data submitted from 19 healthcare delivery organizations with integrated research practices. The purpose of the HMORN VDW is to provide a means by which to conduct broad spectrum population-based research studies to ultimately improve patient health and transform health care practice. HMORN research includes the following topics: biostatistics, mental health, cancer research, comparative effectiveness research, complementary & alternative medicine, communication & health literacy research, dissemination & implementation, epidemiology, genetic research, disparities research, health informatics, health services, infectious & chronic disease surveillance, patient-centered care, pharmaco-epidemiology, primary & secondary prevention, systems change and organizational behavior. |
| Database: (Scope, Size, Setting, Population, Age Range) | The HMORN VDW is a consortium of 19 healthcare delivery systems that submit claims and EHR data for all patients. |
| Database Type: (Survey, Registry, Research Study, Program Database, Claims, Administrative Data, and Clinical Databases) | Virtual Database - Data is housed at individual HMOs but can be accessed from anywhere. |
| Database Source/Origin: | Administrative Data, Claims Data, & Electronic Health Record Data (which includes clinical data). |
| Date or Frequency of Data Collection: | n/a |
| Longitudinal vs. Cross-sectional Database: | Longitudinal |
| Data Collection Methodology: | Programmers at participating sites transform EHR and claims data elements from local data systems to a VDW standardized set of variable definitions, names, and codes. The common structure allows for programming code developed at one site to be used at other sites to extract and analyze data for a research throughout the network. |
| Sampling Strategy: | All Patients |
| Unit of Analysis: | Patient |
| Diagnosis Information | |
| Diagnosis Variable Type: (Chronic Condition Status, Principal Diagnosis, Primary Diagnosis, Secondary Diagnosis, Admit/Discharge Diagnosis and Self-Reported Diagnosis) | Primary and secondary diagnoses. |
| Diagnosis Codes: (ICD-9, ICD-10, SNOMED) | ICD-9-CM (other: CPT-4 & HCPCS, NGC, CPI) |
| Number of Diagnoses Captured: | n/a |
| Cost, Utilization & Clinical Information | |
| Measures of Cost: (Claims, Out-of-pocket expenses, Self- reported expenditures, and Prescription Drug Costs) | Insurance Claims |
| Measures of Healthcare Utilization: (Number of Visits, Any Procedures/Number of Procedures/Type of Procedure, Number of Admission/Type of Admission, Length of Stay, Hospitalizations, Emergency Department Utilization, etc.) | Inpatient & Outpatient Visits |
| Measures of Healthcare Access: | n/a |
| Demographic Information: (Sex, Age, Race, Ethnicity, Marital Status, Disability Status, Language, Insurance Type, Educational Attainment). | Age, gender, race, ethnicity, insurance type, Hispanic vs. non-Hispanic, Educational Obtainment. |
| Clinical Information: (BMI, Medical Conditions [high blood pressure], Smoker Status, History of Various Conditions, Preventative Health Measures , Activities of Daily Living, Instrumental Activities of Daily Living) | Height, Weight, BMI, blood pressure, Laboratory Results, Tumor Status, Tumor Staging, prescription drug use. |
| Measures of Socioeconomic Status: (Occupation, Employment Status, Income, Wealth, Place of Residence, Household Size & Composition, geographic location) | County, State, Zip, Income |
| Site of Service Information: | Type of encounter, provider type, facility type. |
| Measures of Healthcare Outcomes: (Mortality, Morbidity, Mobility, Functional Status, Quality of Life, Quality Measures, Quality of Care, Readmissions) | Discharge Disposition |
| Strengths, Limitations & Feasibility | |
| Data Strengths: | Data submitted to this warehouse is continuously vetted and cleaned. Data maintained in this warehouse can be analyzed using programs written at any HMO. |
| Data Limitations: | Data is only submitted from health plans in twelve states. |
| Data Access Restrictions: | n/a |
| Data Linking Feasibility: (Unique identifiers or sufficient demographics to allow for data linkages) | Although demographic information is available, a special emphasis of this database is to keep records anonymous. |
| Related Grouping Systems: | All ICD-related grouping systems. |
National Institute on Aging Dataset
| National Health & Aging Trends Study | |
|---|---|
| Database Description | |
| White Paper(s): | Data Systems and the Prevalence of Chronic Disease Combinations & Multiple Chronic Conditions and Disparities. |
| Sponsorship: | National Institute on Aging |
| Description: |
The National Health and Aging Trends Study (NHATS) is a new resource for the scientific study of functioning in later life.The NHATS is being conducted by the Johns Hopkins University Bloomberg School of Public Health, with data collection by Westat, and support from the National Institute on Aging. In design and content, NHATS is intended to foster research that will guide efforts to reduce disability, maximize health and independent functioning, and enhance quality of life at older ages. The NHATS will gather information on a nationally representative sample of Medicare beneficiaries ages 65 and older. In-person interviews will be used to collect detailed information on activities of daily life, living arrangements, economic status and well-being, aspects of early life, and quality of life. Among the specific content areas included are: the general and technological environment of the home, health conditions, work status and participation in valued activities, mobility and use of assistive devices, cognitive functioning, and help provided with daily activities (self-care, household, and medical). Study participants will be re-interviewed every year in order to compile a record of change over time. The content and questions included in NHATS were developed by a multidisciplinary team of researchers from the fields of demography, geriatric medicine, epidemiology, health services research, economics, and gerontology. As the population ages, NHATS will provide the basis for understanding trends in late-life functioning, how these differ for various population subgroups, and the economic and social consequences of aging and disability for individuals, families, and society. |
| Database: (Scope, Size, Setting, Population, Age Range) | National; persons >=65 years old; Adolescents Only (< 20 years old); 2–3 million records a year. |
| Database Type: (Survey, Registry, Research Study, Program Database, Claims, Administrative Data, and Clinical Databases) | Survey |
| Database Source/Origin: | Sample of Medicare beneficiaries |
| Date or Frequency of Data Collection: | Annual (round 1 completed in 2011) |
| Longitudinal vs. Cross-sectional Database: | Longitudinal |
| Data Collection Methodology: | Interview |
| Sampling Strategy: | Sample of over 8,000 Medicare beneficiaries ages 65 and older living in the contiguous U.S. Age-stratified so that persons are selected from 5 year age groups between the ages of 65 and 90, and from among persons age 90 and older. Oversample of persons at older age groups and persons whose race is listed as Black on the CMS enrollment file. Replenishment of the sample to maintain the ability to represent the older Medicare population is planned at regular intervals. |
| Unit of Analysis: | Patient |
| Diagnosis Information | |
| Diagnosis Variable Type: (Chronic Condition Status, Principal Diagnosis, Primary Diagnosis, Secondary Diagnosis, Admit/Discharge Diagnosis and Self-Reported Diagnosis) | Number of Chronic Conditions (based on a list of 25 possible chronic condition indicators) Primary and Secondary Diagnoses Admission and Discharge Status |
| Diagnosis Codes: (ICD-9, ICD-10, SNOMED) | None (self-report by patient) |
| Number of Diagnoses Captured: | 10 basic diagnoses (heart attack, heart disease, high blood pressure, arthritis, osteoporosis, diabetes, lung disease, stroke, dementia, cancer); more detailed questions are asked about each one if interviewee reports having or having had one or more of these illnesses. Additional questionnaires ask about cognitive status, mobility, sensory and physical impairments, and ACS disability questions |
| Cost, Utilization & Clinical Information | |
| Measures of Cost: (Claims, Out-of-pocket expenses, Self- reported expenditures, and Prescription Drug Costs) | Out-of-pocket cost of home environment modifications |
| Measures of Healthcare Utilization: (Number of Visits, Any Procedures/Number of Procedures/Type of Procedure, Number of Admission/Type of Admission, Length of Stay, Hospitalizations, Emergency Department Utilization, etc.) | Hospital stays/surgery, use of a medical doctor |
| Measures of Healthcare Access: | Measures of ability to handle medical care activities by oneself, whether patient has a regular doctor |
| Demographic Information: (Sex, Age, Race, Ethnicity, Marital Status, Disability Status, Language, Insurance Type, Educational Attainment). | Sex, Age, Race, Ethnicity, Marital Status, Disability Status, Language, insurance, education |
| Clinical Information: (BMI, Medical Conditions [high blood pressure], Smoker Status, History of Various Conditions, Preventative Health Measures , Activities of Daily Living, Instrumental Activities of Daily Living) | Various indicators of physical, social, sensory and cognitive functioning |
| Measures of Socioeconomic Status: (Occupation, Employment Status, Income, Wealth, Place of Residence, Household Size & Composition, geographic location) | Income, assets, housing, car ownership, labor force participation, helpers |
| Site of Service Information: | |
| Measures of Healthcare Outcomes: (Mortality, Morbidity, Mobility, Functional Status, Quality of Life, Quality Measures, Quality of Care, Readmissions) | Mortality (year to year), mobility, ability to complete activities of daily living, functional status |
| Strengths, Limitations & Feasibility | |
| Data Strengths: | Survey, longitudinal |
| Data Limitations: | Small sample size (8,000), little information about rarer conditions |
| Data Access Restrictions: | Users must register before downloading the data. Registration is instant and free online. |
| Data Linking Feasibility: (Unique identifiers or sufficient demographics to allow for data linkages) | Does not appear to be linkable to Medicare file. |
| Related Grouping Systems: | N/A |
|
References: Full bibliography available at http://www.nhats.org/scripts/biblioRep.htm |
|
Utah Department of Health Dataset
| Utah All Payer Claims Database | |
|---|---|
References: Office of Health Care Statistics Utah Health Data Committee. The Utah All Payer Claims Database (APCD). 2013. http://health.utah.gov/hda/apd/ | |
| Database Description | |
| White Paper(s): | Data Systems and the Prevalence of Chronic Disease Combinations & Multiple Chronic Conditions and Disparities. |
| Sponsorship: | Office of Health Care Statistics; Utah Health Data Committee; Utah Department of Health |
| Description: | The Utah All Payer Claims Database (APCD) became the fifth operating APCD in the nation on September 13th, 2009 with the receipt of the very first data submissions. Participating plans submit enrollment, medical, and pharmacy files starting from 1/1/2007 until they are current. As of 2010, there are 11 plans in full production; that is, they have submitted all required historic data and are reporting new data on determined schedule |
| Database: (Scope, Size, Setting, Population, Age Range) | State of Utah; all-payer claims data. |
| Database Type: (Survey, Registry, Research Study, Program Database, Claims, Administrative Data, and Clinical Databases) | Claims and administrative enrollment files. All payer claims database. |
| Database Source/Origin: | Medicaid Claims, CHIP, PPO’s and HMO’s in Colorado, Medicare claims are pending inclusion due to cost/infrastructure. |
| Date or Frequency of Data Collection: | Inpatient Hospital Discharge Data (1992–2010) Ambulatory Surgery Data (1996–2009) Emergency Department Data (1996–2010) |
| Longitudinal vs. Cross-sectional Database: | Longitudinal |
| Data Collection Methodology: | Health insurance carriers are required to submit health insurance files. |
| Sampling Strategy: | All patients receiving and paying for healthcare services in the State of Utah. |
| Unit of Analysis: | Patient |
| Diagnosis Information | |
| Diagnosis Variable Type: (Chronic Condition Status, Principal Diagnosis, Primary Diagnosis, Secondary Diagnosis, Admit/Discharge Diagnosis and Self-Reported Diagnosis) | Principal Diagnosis Secondary Diagnosis |
| Diagnosis Codes: (ICD-9, ICD-10, SNOMED) | ICD-9 or ICD-10 |
| Number of Diagnoses Captured: | Up to nine diagnoses are captured for each patient. |
| Cost, Utilization & Clinical Information | |
| Measures of Cost: (Claims, Out-of-pocket expenses, Self- reported expenditures, and Prescription Drug Costs) | Total Charges, Facility Charges, and Professional Charges |
| Measures of Healthcare Utilization: (Number of Visits, Any Procedures/Number of Procedures/Type of Procedure, Number of Admission/Type of Admission, Length of Stay, Hospitalizations, Emergency Department Utilization, etc.) | Length of Stay Discharges Type of Procure Admissions/Hospitalizations |
| Measures of Healthcare Access: | Yes, but specific measures not reported. |
| Demographic Information: (Sex, Age, Race, Ethnicity, Marital Status, Disability Status, Language, Insurance Type, Educational Attainment). | Age, Gender, Marital Status, and Race/Ethnicity. |
| Clinical Information: (BMI, Medical Conditions [high blood pressure], Smoker Status, History of Various Conditions, Preventative Health Measures , Activities of Daily Living, Instrumental Activities of Daily Living) | Yes, extensive clinical data from EHRs. |
| Measures of Socioeconomic Status: (Occupation, Employment Status, Income, Wealth, Place of Residence, Household Size & Composition, geographic location) | Place of Residence |
| Site of Service Information: | Zip Code, Residential County |
| Measures of Healthcare Outcomes: (Mortality, Morbidity, Mobility, Functional Status, Quality of Life, Quality Measures, Quality of Care, Readmissions) | Discharge Status Patient Severity Subclass Values Patient Risk of Mortality Values |
| Strengths, Limitations & Feasibility | |
| Data Strengths: | Large patient sample size; represents all types of payment sources. |
| Data Limitations: | Only representative of the State of Utah; still in development and missing claims data for some periods of time. |
| Data Access Restrictions: | Some files are publically available. However, more advanced files for health care cost, quality and access need to be purchased after IRB and HDC consent is achieved. |
| Data Linking Feasibility: (Unique identifiers or sufficient demographics to allow for data linkages) | Patient and Physician Identifiers. Data is very easy to link; there are a number of personal identifiers. |
| Related Grouping Systems: | All ICD-related grouping systems. |
State of Colorado Dataset
| Colorado All Payer Claims Database | |
|---|---|
| Database Description | |
| White Paper(s): | Data Systems and the Prevalence of Chronic Disease Combinations & Multiple Chronic Conditions and Disparities. |
| Sponsorship: | State of Colorado, Colorado Health Foundation, The Colorado Trust, Caring for Colorado Foundation, Rose Community Foundation and Kaiser Permanente Community Benefit Program; Center for Improving Value in Health Care (CIVHC). |
| Description: | The APCD is a secure database that includes claims data from commercial health plans, Medicare and Medicaid. Created by legislation in 2010 and administered by the Center for Improving Value in Health Care (CIVHC), the APCD is the only comprehensive source of health care claims data from public and private payers in Colorado. |
| Database: (Scope, Size, Setting, Population, Age Range) | State All Payer Database (Commercial carriers, Medicaid, Medicare, Self-funded plans and small group). By 2014, the APCD will have collected claims data for 90% of Colorado’s 4.2 million insured. |
| Database Type: (Survey, Registry, Research Study, Program Database, Claims, Administrative Data, and Clinical Databases) | All Payer Claims Database |
| Database Source/Origin: | All claims: commercial carriers, Medicaid, Medicare, self-funded plans and small group plans. |
| Date or Frequency of Data Collection: | 2008–2011; update regularly |
| Longitudinal vs. Cross-sectional Database: | Longitudinal |
| Data Collection Methodology: | Health insurance carriers are required to submit health insurance files. |
| Sampling Strategy: | Information is collected on all Colorado healthcare expenditures. |
| Unit of Analysis: | Patient |
| Diagnosis Information | |
| Diagnosis Variable Type: (Chronic Condition Status, Principal Diagnosis, Primary Diagnosis, Secondary Diagnosis, Admit/Discharge Diagnosis and Self-Reported Diagnosis) |
Admitting Diagnosis Principal Diagnosis 12 “Other Diagnosis” Categories |
| Diagnosis Codes: (ICD-9, ICD-10, SNOMED) | ICD-9 |
| Number of Diagnoses Captured: | n/a |
| Cost, Utilization & Clinical Information | |
| Measures of Cost: (Claims, Out-of-pocket expenses, Self- reported expenditures, and Prescription Drug Costs) |
Total Cost Inpatient Facility Cost Outpatient Facility Cost (including ER cost) Profession Cost Drug Cost |
| Measures of Healthcare Utilization: (Number of Visits, Any Procedures/Number of Procedures/Type of Procedure, Number of Admission/Type of Admission, Length of Stay, Hospitalizations, Emergency Department Utilization, etc.) |
Hospital Admissions Type of Service (ortho vs. pediatric) Readmissions |
| Measures of Healthcare Access: | Provider Density Variable |
| Demographic Information: (Sex, Age, Race, Ethnicity, Marital Status, Disability Status, Language, Insurance Type, Educational Attainment). |
Sex Gender Age Insurance Status |
| Clinical Information: (BMI, Medical Conditions [high blood pressure], Smoker Status, History of Various Conditions, Preventative Health Measures , Activities of Daily Living, Instrumental Activities of Daily Living) | Yes, extensive clinical data from EHRs. |
| Measures of Socioeconomic Status: (Occupation, Employment Status, Income, Wealth, Place of Residence, Household Size & Composition, geographic location) | n/a |
| Site of Service Information: | Zip Code, County, Type of Service (inpatient vs. outpatient). |
| Measures of Healthcare Outcomes: (Mortality, Morbidity, Mobility, Functional Status, Quality of Life, Quality Measures, Quality of Care, Readmissions) |
Discharge Status Readmissions |
| Strengths, Limitations & Feasibility | |
| Data Strengths: | Large patient sample size; represents all types of payment sources. |
| Data Limitations: | Only representative of the State of Colorado; still in development and missing claims data for some periods of time. |
| Data Access Restrictions: | Data is publically available. |
| Data Linking Feasibility: (Unique identifiers or sufficient demographics to allow for data linkages) | Social Security Number, Plan Number, Employee Number, Provider Number. Information is grouped by zip code or region to protect personal health information. |
| Related Grouping Systems: | All ICD-related grouping systems. |
|
References: Colorado All-Payer Claims Database. 2013. http://www.colorado.gov/cs/Satellite/HCPF/HCPF/1249996141729 |
|
University of Michigan Dataset
| Health & Retirement Study | |
|---|---|
| Database Description | |
| White Paper(s): | Data Systems and the Prevalence of Chronic Disease Combinations & Multiple Chronic Conditions and Disparities. |
| Sponsorship: | University of Michigan |
| Description: | The University of Michigan Health and Retirement Study (HRS) is a longitudinal panel study that surveys a representative sample of more than 27,000 Americans over the age of 50 every two years. This study is supported by the National Institute on Aging and the Social Security Administration and is designed to examine changes in labor force participation and the health transitions that individuals experience at the end of their working lives and into the years that follow. It is the leading resource for data on combined health and economic circumstance of Americans over the age of 50. |
| Database: (Scope, Size, Setting, Population, Age Range) | The HRS study surveys more than 27,000 Americans over the age of 50 who represent the Nation’s diversity of economic conditions, racial and ethnic backgrounds, health, marital histories and family compositions, occupations and employment histories, living arrangements, and other aspects of life. As individuals drop out of the sample, they are replaced by new participants in their 50’s; it is nationally representative of the U.S. population over age 50. |
| Database Type: (Survey, Registry, Research Study, Program Database, Claims, Administrative Data, and Clinical Databases) | Research study and associated database. |
| Database Source/Origin: | Participant Interviews |
| Date or Frequency of Data Collection: | Interviews are conducted every two years. |
| Longitudinal vs. Cross-sectional Database: | This is a longitudinal panel survey that following individuals over multiple years. |
| Data Collection Methodology: | The majority of interviews are done by telephone, although exceptions are made when respondents have health limitations that would make an hour-long session on the telephone difficult of impossible. The preferred mode of data collection is face-to-face for the first wave of data collect, followed by subsequent waves of data collection conducted over the phone. |
| Sampling Strategy: | HRS uses a national area probability sample of U.S. households with supplemental oversamples of Blacks, Hispanics and residents of the state of Florida. Participation in this study/survey is optional, but there are incentives. |
| Unit of Analysis: | Individual |
| Diagnosis Information | |
| Diagnosis Variable Type: (Chronic Condition Status, Principal Diagnosis, Primary Diagnosis, Secondary Diagnosis, Admit/Discharge Diagnosis and Self-Reported Diagnosis) | Self-reported Diagnosis |
| Diagnosis Codes: (ICD-9, ICD-10, SNOMED) | Self-reported Diagnosis |
| Number of Diagnoses Captured: | n/a |
| Cost, Utilization & Clinical Information | |
| Measures of Cost: (Claims, Out-of-pocket expenses, Self- reported expenditures, and Prescription Drug Costs) | Out-of-pocket expenditures |
| Measures of Healthcare Utilization: (Number of Visits, Any Procedures/Number of Procedures/Type of Procedure, Number of Admission/Type of Admission, Length of Stay, Hospitalizations, Emergency Department Utilization, etc.) | Health Service Use by Type (i.e. Hospital, Nursing Home, etc.), Number of visits, etc. |
| Measures of Healthcare Access: | n/a |
| Demographic Information: (Sex, Age, Race, Ethnicity, Marital Status, Disability Status, Language, Insurance Type, Educational Attainment). | Age, Educational Attainment, Disability Status, Race, Ethnicity, Language, Sex, and Marital Status. |
| Clinical Information: (BMI, Medical Conditions [high blood pressure], Smoker Status, History of Various Conditions, Preventative Health Measures , Activities of Daily Living, Instrumental Activities of Daily Living) | Disease history, Medicare Use, Physical Activity, Height, Weight, Measurements of Lung Function, Blood Pressure, Grip Strength, and Walking Speed. |
| Measures of Socioeconomic Status: (Occupation, Employment Status, Income, Wealth, Place of Residence, Household Size & Composition, geographic location) | Occupation, Employment Status, Income |
| Site of Service Information: | Location of Health Service Type |
| Measures of Healthcare Outcomes: (Mortality, Morbidity, Mobility, Functional Status, Quality of Life, Quality Measures, Quality of Care, Readmissions) | Self-reported health status and measure of functional status. |
| Strengths, Limitations & Feasibility | |
| Data Strengths: | There are multiple years of data available (longitudinal data). Comprehensive documentation is available for all respondents across a variety of key policy issues. There is a low sample attrition rate. |
| Data Limitations: | Limited granularity in diagnosis coding, unless linked with Medicare claims data. |
| Data Access Restrictions: | Data are available to the public at no cost. Detailed race/ethnicity data are available on a restricted basis. |
| Data Linking Feasibility: (Unique identifiers or sufficient demographics to allow for data linkages) | Respondent information can be linked to social security data, Medicare claims data and supplemental employer surveys. |
| Related Grouping Systems: | n/a |
|
References: National Institute on Aging, National Institutes of Health, U.S. Department of Health and Human Services. Growing Older in America: The Health & Retirement Study. 2007. NIH Publication No. 07-5757 |
|
Appendix C – Clinical Classification Systems (Grouper) Review
The Clinical Classification Systems Review provides an overview of fourteen systems for organizing and aggregating diagnosis codes into different disease categories, and an assessment of each grouper system’s feasibility for disease complexity research.
Agency for Healthcare Research and Quality Grouper System
| Clinical Classifications System (CCS) | |
|---|---|
| Sponsorship: | Agency for Healthcare Research & Quality |
| Description: |
AHRQ’s Clinical Classifications Software (CCS) is a system that clusters patient diagnoses and procedures into a number of clinically meaningful categories for analytic purposes. The CCS consists of two related classifications systems: 1) Single-level CCS, which is used to rank diagnoses and procedures and for risk adjustment, 2) Multi-level CCS, which is used to evaluate large groups of condition and procedures.1 |
| Purpose/Use: | The CCS system was created to allow health plans, policy makers, and researchers to understand patterns of diagnoses and procedures in terms of cost, utilization and outcomes. |
| Coding Family: | International Classification of Diseases, Ninth Revision, Clinical Modification (ICD-9-CM) |
| Grouping Methodology: |
The single-level CCS system aggregates over 14,000 ICD-9- CM codes into 285 mutually exclusive categories. The majority of these categories are clinically homogenous. However, some heterogeneous categories are needed to combine several less common individual conditions within a body system.1 The multi-level CCS system aggregates single-level CCS groupings and ICD-9 codes into a hierarchical structure to create broader clinical categories (i.e. infectious disease, hypertension, etc.).This hierarchical structure has 18 categories, each with 4 levels of granularity.1 |
| Level of Diagnosis Aggregation: | ICD-9-CM codes are aggregated into 285 mutually exclusive categories. |
| Number of Codes Included: | 14572 |
| Number of Codes Excluded: | None |
| Methodological Considerations: | The CCS creates diagnosis groupings that are clinically homogenous. As it includes all ICD-9-CM codes, it is a more comprehensive grouping system compared to other grouping methodologies. |
| Related Data Sources: | Healthcare Cost and Utilization Project Data & claims data |
| Used in Disease Complexity Research: | Yes2 |
|
References: 1 Elixhauser A, Steiner C, Palmer L. Clinical Classifications Software (CCS), 2013. U.S. Agency for Healthcare Research and Quality. Available: http://www.hcup-us.ahrq.gov/. 2 Yu W, Ravelo A, Wagner TH, et al. Prevalence and costs of chronic conditions in the VA health care system. Med Care Res Rev. 2003; 60(3 Suppl):1462-167S. |
|
Axiomedics Research, Inc. Grouper System
| Dyani Diagnosis Grouper | |
|---|---|
| Sponsorship: | Axiomedics Research, Inc. |
| Description: | The Dyani Diagnosis Grouper is a classification system that groups ICD-9 codes into a small set of clinically and financially homogenous categories with no appreciable loss of clinical specificity. This grouping system uses medical transaction data from the span of a worker’s compensation claim history.1 |
| Purpose/Use: | The Dyani Diagnosis Grouper is used to perform case mix adjustment for the workers’ compensation market. |
| Coding Family: | International Classification of Diseases, Ninth Revision (ICD- 9) |
| Grouping Methodology: |
The Dyani Diagnosis Grouper uses a proprietary algorithm to identify unique ICD-9 codes (primary, secondary and tertiary diagnoses) in medical transaction data and rank them according to incidence, timing, costs and services. There are three guiding principles to this algorithm: 1. A focus on ICD-9 codes that are specific. 2. Assigning claims to one of a manageable number of diagnosis categories that are both clinically and financially homogenous. 3. Not using clinical treatment decisions (such as the use of surgery) to differentiate among diagnosis categories. The Dyani Diagnosis Grouper crosswalks primary diagnosis codes to a specific diagnosis category, developed specifically for workers’ compensation data. This process groups thousands of ICD-9 codes into several hundred workers’ compensation diagnosis categories.2 In this grouping system, ICD-9 codes are also assigned to five different criteria: major diagnostic categories, minor diagnostic categories, body systems, anatomy (location) and detail (anything diagnosis code codifies as pertinent additional information). |
| Level of Diagnosis Aggregation: | Diagnosis codes can be grouped into 200-300 categories depending on the axis (criteria) being examined. |
| Number of Codes Included: | Proprietary - Not Available |
| Number of Codes Excluded: | Proprietary - Not Available |
| Methodological Considerations: | The Dyani Diagnosis Grouper is sensitive to differences between occupational injuries. It is the only grouping system available for the workers’ compensation market and was not originally designed for group health plans. New ICD-9 codes haven’t been added to this system since 2010, but could be at the request of the owner. |
| Related Data Sources: | Claims data |
| Used in Disease Complexity Research: | No |
|
References: 1 Axiomedics Research Inc. Dyani Diagnosis Grouper. 2013. http://www.axiomedics.com/grouper.htm 2 Axiomedics Research Inc. PUMA Provider Utilization Management and Analysis. 2013. http://science-mom.com/axiomedicsresearch.com/images/puma%20overview%202012.pdf |
|
Centers for Medicare & Medicaid Services Grouper Systems
| Hierarchical Condition Categories (HCC) | |
|---|---|
References: 1 Pope GC, Kautter J, Ellis RP, et al. Risk Adjustment of Medicare Capitation Payments Using the CMS-HCC Model. Health Care Financ Rev. 2004;25(4):119–141. | |
| Sponsorship: | Centers for Medicare & Medicaid Services |
| Description: | The CMS HCC model was implemented in 2004 to adjust Medicare capitation payments to private health care plans for the health expenditure risk of their enrollees.1 CMS uses this model to risk adjust payments to health plans that participate in the Medicare Advantage program.2 This model uses enrollees’ demographics and medical conditions grouped into 70 categories to predict costliness. |
| Purpose/Use: | To predict costliness of health plan enrollees. |
| Coding Family: | International Classification of Diseases, Ninth Revision, Clinical Modification (ICD-9-CM) |
| Grouping Methodology: | The HCC system begins by classifying over 14,000 ICD-9-CM diagnosis codes to 805 diagnostic cost groups (DCGs). Each diagnostic group represents a well-specified medical condition. Diagnostic groups are further aggregated into 189 condition categories. Condition categories represent a broad set of diseases that are related clinically and in terms of cost. Hierarchies are then imposed among condition categories, so that a patient is coded for only the most severe manifestation they have among related diseases. Out of 189 HCCs created, 70 are used in the CMS HCC model because they have been shown to strongly predict Part A and Part B medical expenditures.3 Approximately 3,000 ICD-9 codes are used in the final HCC model. This methodology results in three hierarchical levels of coding. |
| Level of Diagnosis Aggregation: | ICD-9 codes are aggregated into 70 CMS-HCCs. |
| Number of Codes Included: | 2,916 (for the 70 HCCs used in the CMS HCC model) |
| Number of Codes Excluded: | 11,651 (for the 70 HCCs used in the CMS HCC model) |
| Methodological Considerations: | The HCC model performs much better at predicting beneficiaries’ Medicare expenses relative to models based only on demographic characteristics. It has been shown to explain approximately 11 percent of the variation in beneficiaries’ costliness.2 However, the HCC model does not eliminate systematic prediction inaccuracies. The model is believed to leave approximately half or more of predictable variation unexplained. Further, for all enrollees with a given health condition, the HCC model adjusts payments by the same rate, which does not account for differences in severity. Additionally, it is calibrated using Medicare FFS data and must be re-calibrated if it were to be applied to other data sources.2 |
| Related Data Sources: | CMS Claims Data |
| Used in Disease Complexity Research: | Yes4 |
| Chronic Conditions Data Warehouse Algorithm | |
|---|---|
References: 1 Buccaneer - Computer Systems & Services, Inc. Chronic Condition Data Warehouse: Medicare Administrative Data User Guide. Version 2.0. 2013. http://www.ccwdata.org/cs/groups/public/documents/document/ccw_userguide... 2 Centers for Medicare and Medicaid Services. Chronic Conditions among Medicare Beneficiaries, Chartbook, 2012 Edition. Baltimore, MD.2012. 3 Schneider KM, O’Donnell BE & Dean D. Prevalence and Multiple Chronic Conditions in the United States Medicare Population. Health and Quality of Life Outcomes. 2009; 7(82):1–11 | |
| Sponsorship: | Centers for Medicare & Medicaid Services |
| Description: | Under the Medicare Prescription Drug, Improvement and Modernization Act of 2003, CMS developed the Chronic Conditions Data Warehouse and corresponding CCW algorithm to support researchers in studying chronic illness in the Medicare population in the United States.1,2 |
| Purpose/Use: | To classify beneficiaries accordingly to one of 27 chronic condition categories for chronic conditions research. |
| Coding Family: | International Classification of Diseases, Ninth Revision (ICD- 9) |
| Grouping Methodology: | The CCW algorithm assigns diagnosis codes to one of 27 pre- defined chronic conditions categories using a set of specific criteria: 1) ICD-9, CPT4 or HCPCS codes. 2) Claim types and counts. 3) Dates of service. Therefore, each chronic condition category is constructed based on diagnosis codes, but also on a reference period and the number of claims submitted for an individual.1 |
| Level of Diagnosis Aggregation: | ICD-9 codes are aggregated into 27 chronic condition categories. |
| Number of Codes Included: | 581 |
| Number of Codes Excluded: | 13986 |
| Methodological Considerations: | Chronic condition categories in the CCW algorithm are designed to examine utilization patterns, which only serve as a proxy for identifying whether any given individual is receiving treatment for one of the actual conditions of interest. Chronic condition categories were also designed to be broad and more encompassing, rather than limiting. Therefore, researchers are expected to refine condition category specifications to fit particular research needs. As currently defined, the CCW condition categories are not necessarily designed to allow researchers to calculate straight population estimates without refinements.1 |
| Related Data Sources: | CMS Claims Data |
| Used in Disease Complexity Research: | Yes3 |
| Diagnosis Related Group (DRG) | |
|---|---|
References: 1 Baker JJ. Medicare payment system for hospital inpatients: diagnosis-related groups. J Health Care Finance.2002;28(3):1–13. 2 Medpac. How Medicare pays for services: an overview. Report to Congress: Medicare Payment Policy. 2002. http://www.medpac.gov/publications/congressional_reports/mar02_ch1.pdf 3 Wynn BO, Beckett MK, Hilborne LH, Scott M, & Bahney B. Evaluation of Severity-Adjusted DRG Systems. 2007. WR-434-CMS. Prepared for the Centers for Medicare and Medicaid Services. 4 Hochlehnert, A et al. Psychiatric comorbidity in cardiovascular inpatients: Costs, net gain, and length of hospitalization. Journal of Psychosomatic Research. 2011; (70)2:135–139. | |
| Sponsorship: | Centers for Medicare & Medicaid Services & Yale School of Medicine, Division of Health Services Administration |
| Description: | The Diagnosis Related Groups (DRGs) system provides a means by which to group patients according to diagnosis and healthcare resource use.1 |
| Purpose/Use: | Under the inpatient prospective payment system, diagnoses are categorized into DRGs. Each DRG is then assigned a payment weight, based on the average resources used to treat Medicare beneficiaries in that category. DRGs have also been used for risk adjustment, to study physician behavior and as a measure of healthcare quality. |
| Coding Family: | International Classification of Diseases, Ninth Revision (ICD- 9) |
| Grouping Methodology: | The DRG system is comprised of 538 categories. Patients are assigned to a DRG based upon principal diagnosis (ICD-9 codes), procedural codes, age, sex, discharge status, and the presence of comorbidities (up to 8 secondary diagnosis codes). These categories are designed to group patients together who are similar in terms of clinical conditions and who are expected to require similar amounts of hospital resources.2 |
| Level of Diagnosis Aggregation: | The DRG system groups patients into one of 538 categories. |
| Number of Codes Included: | Not specified |
| Number of Codes Excluded: | Not specified |
| Methodological Considerations: | Within each diagnostic group are patients with similar pathology and treatment costs, which allows for a matching between services provided and hospital resources expended. However, evidence suggests that there is significant cost variation within individual DRGs.3 |
| Related Data Sources: | Claims data |
| Used in Disease Complexity Research: | Yes4 |
Health Level Seven International Grouper System
| Major Diagnostic Categories (MDC) | |
|---|---|
| Sponsorship: | Health Level Seven International |
| Description: | MDCs are used to group diagnoses into 25 broad categories according to a single organ system or etiology. To some degree, these categories have also been shown to be associated with some medical specialties ( e.g., ENT). |
| Purpose/Use: | MDCs have been used to group diagnoses into categories for a variety of different types of research. However, this system was originally created to test whether DRGs were clinically coherent. Since then, MDCs have been used to look at healthcare utilization and costs related to diagnoses from a broad perspective. |
| Coding Family: | International Classification of Diseases, Ninth Revision (ICD- 9). DRG and CCS condition categories can also be mapped to MDCs. |
| Grouping Methodology: | MDCs are formed by dividing all possible principal diagnosis codes into 25 mutually exclusive diagnosis categories, which correspond to a single organ system or etiology. Separate mapping systems are available to group ICD-9 codes, DRGs and CCS group into major diagnostic categories. MDC1 through MDC23 are grouped strictly according to principal diagnosis. Patients with at least two significant trauma diagnosis codes are grouped under MDC 24. Patients with a principal diagnosis of HIV infection of principal diagnosis of a significant HIV-related condition and a secondary diagnosis of HIV are grouped into MDC 25.1 |
| Level of Diagnosis Aggregation: | Diagnosis codes are grouped in 25 categories. |
| Number of Codes Included: | Not specified |
| Number of Codes Excluded: | Not specified |
| Methodological Considerations: |
This grouping system provides researchers with a quick and efficient mechanism to group diagnosis codes for the purpose of drawing general conclusions about different major diagnostic groups. This grouping system lacks granularity to study specific diagnoses that have aggregated up into larger major diagnostic categories. |
| Related Data Sources: | Claims data, DRG & CCS groups (mapping) |
| Used in Disease Complexity Research: | Yes2 |
|
References: 1 Utah Department of Health. Major Diagnostic Categories. 2013. http://health.utah.gov/opha/IBIShelp/codes/MDC.htm 2 Kuwabara K et al. The association of the number of comorbidities and complications with length of stay, hospital mortality and LOS high outlier, based on administrative data. Environ Health Prev Med.2008;13(3):130–7. |
|
Johns Hopkins University Grouper Systems
| Adjusted Clinical Groups Case-Mix System (ACG) | |
|---|---|
References: 1 The Johns Hopkins ACG System. State of the Art Technology and a Tradition of Excellence in One Integrate Solution (2013). http://www.acg.jhsph.org/index.php?option=com_content&view=article&id=46... 2 Adams EK, Bronstein JM, & Raskind-Hood. Adjusted Clinical Groups: Predictive Accuracy for Medicaid Enrollees in Three States. Health Care Financ Rev. 2002;24:43–61 3 Garcia-Olmos L, Salvador CH, Alberquilla A, et al. Comorbidity in patients with chronic diseases in general practice. Plus One. 2012; 7(2):e32141 | |
| Sponsorship: | Johns Hopkins University |
| Description: | The Johns Hopkins ACG grouping system uses a “person- focused” approach to capturing the multidimensional nature of a patient’s health over time. The system uses diagnosis and/or pharmaceutical codes from insurance claims or medical records to examine constellations of morbidities, rather than individual conditions. This method of measuring morbidity is used to evaluate performance, forecast utilization and set payment rates for over 300 health plans and provider organizations.1 The ACG system is clinically-focused and was primarily designed for research purposes. |
| Purpose/Use: | The ACG system measures morbidity burden based on disease patterns, age and gender. It is used to adjust for patient case- mix. |
| Coding Family: | ICD-9-CM, ICD-9, ICD-10-CM, NDC, ATC, READ, CPT, & HCPCS |
| Grouping Methodology: | Diagnosis codes are first grouped into 32 Aggregated Diagnosis Groups (ADGs) that are similar in terms of disease severity and the likelihood of persistence of the disease over time (utilization). The ACG system then groups individual patients into one of 102 discrete categories based on their ADGs, age and sex. Patients grouped into these categories are known to experience similar morbidity and healthcare utilization over a 1 year period of time.1 The ACG system is longitudinal in nature and relies on diagnosis codes from a look-back period. This methodology results in two hierarchical levels of coding. |
| Level of Diagnosis Aggregation: | Diagnosis codes are grouped into 102 discrete categories. |
| Number of Codes Included: | Proprietary - Not Available |
| Number of Codes Excluded: | Proprietary - Not Available |
| Methodological Considerations: | Evidence suggests that the ACG grouping system outperforms traditional age and sex adjustment, which is the traditional risk-adjustment mechanism used by many health insurance providers. The ACG system uses all available data, is stable over time, avoids basing complexity on specific procedures or hospitalizations, has strong predictive power, can describe the health status of population across a spectrum of disease conditions, and can represent clinical complexity more than summing codes.1 However, higher and unpredictable expenses of short-term beneficiaries (< 6 m) are known to moderate the predictive power of the ACG system in certain populations.2 This is true for States, such as Mississippi, that have large patient populations who are poor, underemployed and have severe health problems. |
| Related Data Sources: | Claims data |
| Used in Disease Complexity Research: | Yes3 |
| Aggregated Diagnosis Groups (ADGs) | |
|---|---|
References: 1 The Johns Hopkins ACG System. State of the Art Technology and a Tradition of Excellence in One Integrate Solution (2013). http://www.acg.jhsph.org/index.php?option=com_content&view=article&id=46... 2 Austin PC. Using the John’s Hopkins Aggregated Diagnosis Groups (ADGs) to predict mortality in a general adult population cohort in Ontario, Canada. Medical Care. 2011; 49(10): 932–939. 3 Austin PC, Shar BR, Newman A, & Anderson GM. Using the Johns Hopkins Aggregated Diagnosis Groups (ADGs) to predict 1-year mortality in population-based cohorts of patients with diabetes in Ontario, Canada. Diabet Med. 2012; 29(9):1134–1141. 4 Starfield B & Kinder K. Multimorbidity and its measurement. Health Policy. 2011; 103(1):3–8. | |
| Sponsorship: | Johns Hopkins University |
| Description: | The ADG system, formerly known as the Ambulatory Diagnostic Groups, is part of the Johns Hopkins ACG case- mix system. However, it has also been used independently to group diagnosis codes. |
| Purpose/Use: | The ADG system is a component of the Johns Hopkins ACG system and is used to group diagnosis codes into 32 categories that are similar in terms of disease severity and resource utilization.1 Separate for the ACG system, the ADG system has also been used to predict mortality in general adult populations.2 |
| Coding Family: | ICD-9, ICD-9-CM, ICD-10 |
| Grouping Methodology: | The ADG system groups all ICD-9, ICD-9-CM, and ICD- 10CA diagnosis code assigned to a patient into one of 32 different categories based on the following clinical and expected utilization criteria: 1. Duration of the conditions (acute, recurrent, or chronic). 2. Severity of the condition ( e.g., minor and stable versus major and unstable). 3. Diagnostic certainty (symptoms focusing on diagnostic evaluation versus documented diseases focusing on treatment services). 4. Etiology of the condition (infectious, injury, or other). 5. Specialty care involvement (medical, surgical, obstetric, hematology, etc.).1 |
| Level of Diagnosis Aggregation: | Diagnosis codes are grouped into 32 discrete categories. |
| Number of Codes Included: | Proprietary - Not Available |
| Number of Codes Excluded: | Proprietary - Not Available |
| Methodological Considerations: | Evidence suggests that the ADG system can be used to accurately predict one year mortality in general and specialty populations.1,2 However, it is most often used to group diagnosis codes in the first aggregation step of the Adjusted Clinical Groups Case-Mix System. |
| Related Data Sources: | Claims data |
| Used in Disease Complexity Research: | Yes4 |
Thomson Medstat Medical Episode Grouper System
| Thomson Medstat Medical Episode Grouper | |
|---|---|
References: 1 Thomson - Medstat. Medstat Disease Staging Software Version 5.24. http://www.hcup-us.ahrq.gov/db/nation/nis/DiseaseStagingV5_25ReferenceGu... 2 Black L, Runken MC, Eaddy M, et al. Chronic Disease Prevalence and Burden in Elderly Men: An Analysis of Medicare Medical Claims Data. J Health Care Finance. 2007; 33(4):68–78. | |
| Sponsorship: | Thomson Medstat Inc. |
| Description: | The Thomson Medstata Medical Episode Grouper (MEG) is a grouping system that creates clinically homogenous and meaningful units (episodes) for analysis using inpatient, outpatient and pharmaceutical claims data. MEG allows for the analysis of a particular patient’s complete episode of care for a single illness or condition. |
| Purpose/Use: | MEG can be used to express a patient’s severity of illness at the time of hospitalization, to adjust for case-mix, or as a measure of a patient’s healthcare outcome. |
| Coding Family: | ICD-9 & ICD-10 |
| Grouping Methodology: | Using professional claims, facility claims, inpatient admission records, and pharmacy claims, The Thomson Medstat MEG categorizes diagnosis codes into 550 disease conditions. These disease conditions are then staged (stratified) using the Thomson Medstat Disease Staging Criteria. This set of criteria defines levels of biological severity for specific medical diseases, where severity is defined as the risk of organ failure or death. The following stages are as follows:
Lastly, the MEG groups claims into episodes according to disease condition and relative time between services to create an aggregate episode file. This methodology results in one hierarchical level of coding. |
| Level of Diagnosis Aggregation: | Diagnosis codes are grouped into 550 disease conditions |
| Number of Codes Included: | Proprietary - Not Available |
| Number of Codes Excluded: | Proprietary - Not Available |
| Methodological Considerations: | The Thomson Medstat Episode Grouper is a clinically focused grouping system that is used by a number of health systems, health plans and provider organizations to conduct health services research on large databases. |
| Related Data Sources: | Claims data |
| Used in Disease Complexity Research: | Yes2 |
University of California, San Diego Grouper System
| Chronic Illness and Disability Payment System (CDPS) | |
|---|---|
References: 1 Kronick RG, Gilmer T, Dreyfus T, et al. Improving Health-Based Payment for Medicaid Beneficiaries: CDPS. Healthcare Financing Review, 2000;21(3):29–64 2 Kronick RG, Bella M, Gilmer TP, et al. The Faces of Medicaid II: Recognizing the Care Needs of People with Multiple Chronic Conditions. Center for Healthcare Strategies, Inc., October 2007. | |
| Sponsorship: | University of California, San Diego |
| Description: | The Chronic Illness and Disability Payment System (CDPS) is tool used to summarize diagnosis codes that are reported on health care claims, and is primarily used by Medicaid programs to make health-based capitated payments for Temporary Assistance to Needy Families (TANF) and disabled Medicaid beneficiaries.1 |
| Purpose/Use: | CDPS is a tool used by Medicaid programs to adjust payments to health plans based on the health status of enrollees. |
| Coding Family: | International Classification of Diseases, Ninth Revision, Clinical Modification (ICD-9-CM) |
| Grouping Methodology: | CDPS groups ICD-9-CM into 20 major categories of diagnoses, which correspond to individual body systems or specific diagnoses, such as cardiovascular disease or diabetes. The CDPS further divides these 20 categories into several subcategories based on the degree of increase expenditure associated with specific diagnoses ( e.g., High-cost, medium- cost, and low-cost). |
| Level of Diagnosis Aggregation: | 20 categories of diagnoses that correspond to body systems or diagnoses. |
| Number of Codes Included: | 11603 |
| Number of Codes Excluded: | 2969 |
| Methodological Considerations: | CDPS was originally designed as a payment tool. It was not designed as a tool for diagnostic profiling because it excludes a number of diagnoses that are ill-defined (e.g., diagnoses the clinicians may disagree about due to the presentation of the patient). The CPDS system does not analyze laboratory or radiology claims because these sources are considered to contain “rule-out” diagnoses. |
| Related Data Sources: | CMS Claims data (Medicaid) |
| Used in Disease Complexity Research: | Yes2 |
World Health Organization Grouper System
| International Shortlist for Hospital Morbidity Tabulation (ISHMT) | |
|---|---|
References: 1 OECD Health Data 2012 – Definitions, Sources and Methods. International Shortlist for Hospital Morbidity Tabulation (ISHMT). http://apps.who.int/classifications/apps/icd/implementation/hospitaldischarge.htm 2 Wong A, Boshuizen HC, Schellevis FG, et al. Longitudinal Administrative Data Can Be Used to Examine Multimorbidity, provided false discoveries are controlled for. J Clin Epidemiol. 201; 64(10)1109–17. | |
| Sponsorship: | World Health Organization |
| Description: | The Hospital Data Project (HDP) of the European Union Health Monitoring Programme convened an Expert Group to create a “shortlist” of clinical conditions that could be monitored across countries based on the special tabulation list for morbidity published in ICD-10 volume one. The special tabulation list grouped diagnosis codes into 298 categories, so that these categories could be compared across hospitals world-wide. However, this list was regarded to be extensive and difficult to use for analytical purposes. Therefore, the International Shortlist for Hospital Morbidity Tabulation (ISHMT) was created and represents a subset (130) of the original 298 categories. |
| Purpose/Use: | The purpose of the ISHMT is to provide a means by which to compare hospital morbidity statistics across hospitals world- wide in a manner that maximizes statistical comparability and efficiency.1 |
| Coding Family: | ICD-9 & ICD-10 |
| Grouping Methodology: | Select diagnoses codes are grouped into one of 130 ISHMT categories. The 130 categories are comprised of:
This grouping system is hierarchical and can be collapsed into ICD-10 chapters. |
| Level of Diagnosis Aggregation: | Diagnoses are grouped into 130 categories. |
| Number of Codes Included: | Not specified |
| Number of Codes Excluded: | Not specified |
| Methodological Considerations: | This grouping system provides a means by which to compare hospital morbidity statistics across hospitals world-wide in a manner that maximizes statistical comparability. However, this grouping system represents only a subset of the clinical conditions that were identified based upon expert consensus. In addition, differences in diagnostic cultures and coding practices among countries are a general limitation of this grouping system. |
| Related Data Sources: | Claims data |
| Used in Disease Complexity Research: | Yes2 |
3M Health Information Systems Grouper Systems
| All Patient Refined Diagnosis Related Group (APR-DRG) | |
|---|---|
References: 1 3M Health Information Systems. All Patient Refined Diagnosis Related Groups (APR-DRGs) Methodology Overview (2003). http://www.hcup-us.ahrq.gov/db/nation/nis/APR-DRGsV20MethodologyOverview... 2 Lyon L. An Overview of the 3M All Patient Refined Diagnostic Related Groups. 2012. Power Point Presentation. 3 Shen Y. Applying the 3M All Patient Refined Diagnosis Related Groups Grouper to Measure Inpatient Severity in the VA. Medical Care.2003;41(6):103–110. 4 Lavernia CJ, Laoruengthana A, Contreras JS, and Rossi MD. All-Patient Refined Diagnosis-Related Groups in primary arthroplasty. J Arthroplasty. 2009;24(6 Suppl):19–23. | |
| Sponsorship: | 3M Health Information Systems |
| Description: | The All Patient Refined DRG is a hybrid classification system based upon basic DRGs and All Patient DRGs. It is more representative of non-Medicare populations, such as pediatric patients, than basic DRGs and contains severity of illness and risk of mortality subclasses. APR-DRGs are based on the principle that severity of illness and risk of mortality are dependent on a patient’s underlying health condition (base APR DRG) and that high severity of illness and risk of mortality are characterized by multiple serious diseases and the interaction of those diseases.1 |
| Purpose/Use: | APR-DRGs are used to severity and risk adjust data for a variety of applications including, quality measurement, payment determinations, case mix adjustments, etc. It is currently being used by CMS for severity adjusting all of Medicare’s hospital discharges. |
| Coding Family: | ICD-9 & ICD-10 |
| Grouping Methodology: | Diagnosis codes are first grouped into 25 mutually exclusive major diagnostic categories. Diagnosis are then divided into 316 bases APR DRG categories (two of which are error DRGs) in a manner that develops clinically similar patient groups with similar resource intensity. Base APR DRGs are then subdivided into either 1,256 severity of illness subclasses (1. Minor, 2. Moderate, 3. Major, 4. Extreme) or 1,256 risk of mortality subclasses (1. Minor, 2. Moderate, 3. Major, 4. Extreme).2 This methodology results in three hierarchical levels of coding. |
| Level of Diagnosis Aggregation: | Diagnoses are grouped into 314 base categories and 1256 subclasses. |
| Number of Codes Included: | Proprietary – Not Available |
| Number of Codes Excluded: | Proprietary – Not Available |
| Methodological Considerations: | Evidence suggests that APR-DRGs are strong predictors of resource use. They have been found to have strong performance in terms of R2 in predicting length of stay for hip fracture and pneumonia patients, in particular. APR-DRGS also provide a method to identify utilization patterns and evaluate resource utilization and outcomes among the VA patient population.3 |
| Related Data Sources: | CMS Claims data |
| Used in Disease Complexity Research: | Yes3 |
| Medicare Severity Diagnosis Related Grouper (MS-DRG) | |
|---|---|
References: 1 Wynn BO & Scott M. Evaluation of Severity-Adjusted DRG Systems. Addendum to the Interim Report.2007.WR434/1-CMS. Prepared for the Centers for Medicare and Medicaid Services. 2 Abbey DC. Prospective Payment Systems. Healthcare Payment Systems.2012.ISB-978-1-4398-7301-4 3 McNutt, R et al. Change in MS-DRG assignment and hospital reimbursement as a result of Centers for Medicare & Medicaid changes in payment for hospital-acquired conditions: Is it coding or quality? Quality Management in Health Care. 2010; (19)1:17–24. | |
| Sponsorship: | 3M Health Information Systems |
| Description: | The Medicare Severity Diagnosis Related Groups (MS-DRGs) are payment groups designed for the Medicare population. Patients who have similar clinical characteristics and similar costs are assigned to an MS-DRG. MS-DRGs are linked to a fixed payment amount based on the average cost of patients in the group. Patients can be assigned to an MS-DRG based on their diagnosis, surgical procedures, age and other administrative information. MS-DRGs also recognize severity of illness and resource use, and are based on patient complexity. |
| Purpose/Use: | MS-DRGs are used by payers, such as CMS to group inpatient services into a global payment amount for hospital stays, based in part on a patient’s diagnosis at discharge. |
| Coding Family: | ICD-9, ICD-10 |
| Grouping Methodology: | The MS-DRG system builds on the basic DRG system. The system utilizes CMS-DRGs as the foundation for its grouping logic. The logic collapses any paired DRGs (distinguished by the presence of absence of complications or comorbidities (CCs) and/or age) into base DRGs and then splits the base DRGs into CC-severity levels. The general structure of the MS-DRG logic establishes three severity levels for each base DRG: with MCC, with CC, and without CC. In total, diagnoses are grouped into 745 categories.1 This methodology results in two hierarchical levels of coding. |
| Level of Diagnosis Aggregation: | Diagnoses are grouped under 745 categories. |
| Number of Codes Included: | Proprietary - Not Available |
| Number of Codes Excluded: | Proprietary - Not Available |
| Methodological Considerations: | MS-DRGs have been shown to improve the explanation of cost variation by 9.1 over basic DRGs1 and were developed and refined over a span of years to address the elderly Medicare population. However, this system is also used for neonatal, pediatric and young adult populations, which are very different than most Medicare patients.2 |
| Related Data Sources: | CMS Claims Data |
| Used in Disease Complexity Research: | No. DRGs are sometimes used in Disease Complexity Research, MS-DRGs are used for reimbursement purposes and research around changes in reimbursement payments.3 |
| Clinical Risk Groups (CRGs) | |
|---|---|
References: 1 3M Health Information Systems. 3M Clinical Risk Groups: Measuring Risk, Managing Care.2011. http://multimedia.3m.com/mws/mediawebserver?mwsId=66666UuZjcFSLXTtOxf_oX... 2 3M Health Information Systems. 3M Clinical Risk Groups: Frequently Asked Questions.2011. 3 Hughes JS, Averill RF, Eisenhandler J, et al. Clinical Risk Groups (CRGs): A Clinical System for Risk-Adjusted Capitation-Based Payment and Health Care Management. Medical Care. 2004; 42(1):81–90. 4 Berglund, A et al. Comorbidity, treatment and mortality: A population based cohort study of prostate cancer is PCBaSe Sweden. The Journal of Urology. 2011; (185)3:833–40. | |
| Sponsorship: | 3M Health Information Systems & National Association of Children’s Hospitals and Related Institutions |
| Description: | The CRG is a classification system that groups all types of patients into single mutually exclusive risk groups based on historical clinical and demographic data to accurately predict healthcare resource use. The underlying clinical principle of this system is that an individual’s severity of illness is highly dependent on the number and severity of the individual’s underlying chronic diagnoses. This classification systems links the clinical and financial aspects of healthcare.1 |
| Purpose/Use: | The CRG is a claims-based classification system used in risk adjustment and to measure a population’s burden of illness. |
| Coding Family: | International Classification of Diseases, Ninth Revision, Clinical Modification (ICD-9-CM) |
| Grouping Methodology: | Creating CRGs is a four-step process: 1. Diagnosis codes are grouped into 37 major diagnostic categories, while procedure codes are grouped into 639 procedure categories. Major diagnostic categories are based on a single organ system of clinical categories. 2. Chronic illnesses are identified and are specified according to their severity. 3. Each patient is assigned to one of 272 mutually exclusive, clinically defined base 3M CRGs according to the combination of primary chronic diseases that are present. Each base 3M CRG is assigned to one of nine hierarchical health status, ranging from catastrophic to healthy, and is then subdivided into discrete severity subclasses based on the severity of chronic diseases. The combination of base 3M CRGs and severity levels results in a total of 1,080 unique clinical groups. 4. The 3M CRGs can be consolidated into three tiers of aggregated 3M CRGs.2 |
| Level of Diagnosis Aggregation: | Diagnosis codes are grouped into 272 clinically-based categories. After the severity scale is applied, diagnosis codes are grouped into 1,080 discrete groups. |
| Number of Codes Included: | Proprietary - Not Available |
| Number of Codes Excluded: | Proprietary - Not Available |
| Methodological Considerations: | 3M CRGs are clinically-based, rather than based on a regression risk-adjustment model, which allows providers to link the clinical and financial aspects of healthcare.1 Depending on the level of granularity desired, CRGs can be aggregated to predefined or user-defined aggregated CRG groups that maintain clinical significance and severity. CRGs are also able to take into account the effect of specific interactions between chronic conditions in addition to the interaction of higher and lower levels of severity among conditions.3 |
| Related Data Sources: | Claims data |
| Used in Disease Complexity Research: | Yes4 |
Appendix D – Technical Advisory Group Members
The Technical Advisory Group (TAG) included experts from several federal HHS agencies who consulted about the content and design of the study. TAG members participated in an initial in-person meeting in December 2012 and provided feedback on the original literature review to determine additional databases, grouping systems, and methods for studying MCC in disparities populations. TAG members then participated in a second meeting by teleconference in May 2013 to review and provide feedback on the first draft of the White Paper.
| Technical Advisory Group Members | |
|---|---|
| David Bott, PhD Editor-in-Chief, Medicare & Medicaid Research Review Centers for Medicare & Medicaid Services Baltimore, MD (410) 786 – 0249 | Sharon Donovan Director, Program Alignment Group, Medicare- Medicaid Coordination Office Centers for Medicare & Medicaid Services Baltimore, MD (443) 380-5228 |
| Richard Goodman, MD, JD, MPH Senior Medical Advisor Office of the Assistant Secretary for Health Atlanta, GA (770) 488-5613 | Kevin Larsen, MD Medical Director, Meaningful Use Office of the National Coordinator of Health Information Technology Washington, DC (202) 205 – 4528 |
| Ernest Moy, MD, MPH Medical Officer, Center for Quality Improvement and Patient Safety Agency for Healthcare Research and Quality Rockville, MD (301) 427-1329 | Ric Ricciardi, Ph.D, NP Health Scientist, Center for Primary Care, Prevention, and Clinical Partnerships Agency for Healthcare Research & Quality Rockville, MD Richard.Ricciardi@ahrq.hhs.gov (301) 427-1578 |
| Marcel Salive, MD, MPH Medical Officer, Division of Geriatrics and Clinical Gerontology National Institute on Aging Bethesda, MD (301) 496 -6761 | Jesse James, MD, MBA Senior Medical Officer, Meaningful Use Office of the National Coordinator for HealthIT Phone: (202) 260-2068 |
Appendix E – Key Informants
Below is the list of key informants and their affiliations. Key informants were identified by the ASPE Project Officers and the Technical Advisory Group (TAG). Key informant interviews were conducted by telephone to provide the Project Team with in-depth expertise on topics covered in the White Paper. Findings from the Key Informant Interviews have been incorporated throughout the White Paper.
| Key Informants | |
|---|---|
| Richard Averill, MS Senior Vice President of Clinical and Economic Research 3M Health Information Systems, Inc. | Allen Fremont, MD, PhD Natural Scientist Rand Corporation |
| Norbert Goldfied, MD Medical Director 3M Health Information Systems, Inc. | Mary Goldstein, MD, MS Professor of Medicine and of Health Research and Policy VA Palo Alto Health Care System |
| Linda Magno, MA Director, Medicare Demonstration Group Centers for Medicare & Medicaid Services | Sally Okun, RN, MMHS Vice President of Advocacy, Policy & Patient Safety PatientsLikeMe |
| Yaffa Rubinstein, PhD Program Director, Officer of Rare Diseases National Institutes of Health | Jean Yoon, PhD Health Economist, Health Economics Resource Center (HERC) VA Palo Alto Healthcare System |