
This brief summarizes data released by the Census Bureau on the research supplemental poverty measure. Cited statistics include poverty rates from 2009-2012 using both the official poverty measure and the supplemental poverty measure; the anti-poverty effectiveness of select social safety net programs for all persons and children 0-17; changes in poverty between 2009 and 2012 by age, race and ethnicity, family type, region, and residence; and changes in the SPM rate from 2009 to 2012 for selected demographic characteristics. The data are based on information collected in the 2013 and earlier Current Population Survey Annual Social and Economic Supplements (CPS ASEC) conducted by the Census Bureau.
The Census Bureau has released data on the research supplemental poverty measure (SPM) indicating that 16.0 percent of the U.S. population in 2012 was poor, representing 49.7 million individuals. This compares to 15.1 percent of the U.S. population, or 47.0 million individuals, under the official measure.[1] Both the official poverty rate and the SPM poverty rate remained statistically unchanged from 2011 to 2012.
The SPM adds greater refinement and thus differs from the official measure in both the measurement of needs (or thresholds used to define the poverty level) and resources available to meet those needs. In particular, the SPM accounts for the ways that the social safety net helps families by counting non-cash benefits and tax credits as income. The official poverty measure counts only cash benefits and other cash income.
Between 2009 and 2012, the percentage of the U.S. population that was poor using the SPM increased from 15.3 percent to 16.0 percent. This increase followed a similar trend as the official poverty measure, which increased from 14.3 percent to 15.1 percent over the same time period.
Figure 1. Poverty Rates from 2009-2012
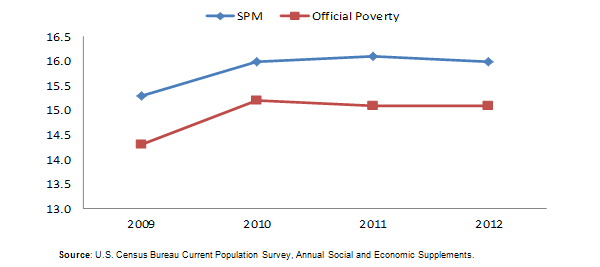
| 2009 | 2010 | 2011 | 2012 | ||||
| SPM | 15.3 | 16.0 | 16.1 | 16.0 | |||
| Official Poverty | 14.3 | 15.2 | 15.1 | 15.1 | |||
Source: U.S. Census Bureau Current Population Survey, Annual Social and Economic Supplements.
With the SPM, it is possible to show the effects that social safety net programs had on the poverty rate in 2009 and 2012, holding all else the same and assuming no behavioral changes. Poverty rate reductions for social safety net programs that are included only in the supplemental measure and not in the official measure are shown for the total population and for all children under the age of 18.
Figure 2. Anti-Poverty Effectiveness of Select Social Safety Net Programs, 2009 and 2012
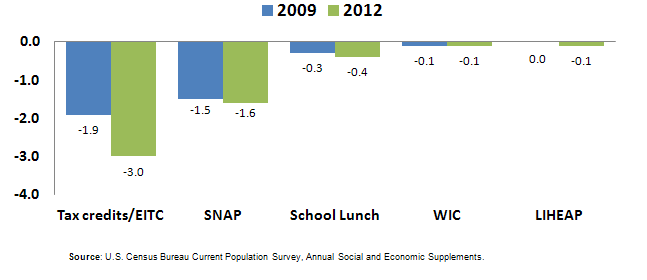
| 2009 | 2012 | ||||||
| Tax credits/EITC | -1.9 | -3.0 | |||||
| SNAP | -1.5 | -1.6 | |||||
| School Lunch | -0.3 | -0.4 | |||||
| WIC | -0.1 | -0.1 | |||||
| LIHEAP | 0.0 | -0.1 | |||||
Source: U.S. Census Bureau Current Population Survey, Annual Social and Economic Supplements.
Figure 3. Children Ages 0-17: Anti-Poverty Effectiveness of Select Social Safety Net Programs, 2009 and 2012
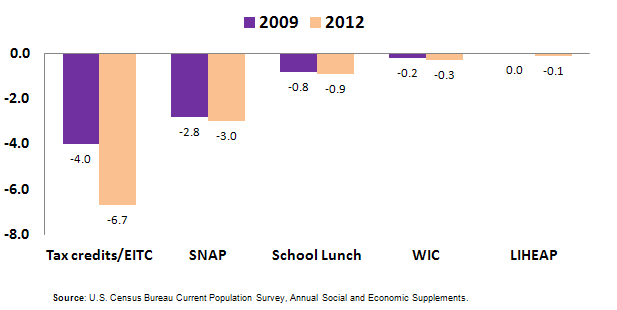
| 2009 | 2012 | ||||||||
| Tax credits/EITC | -4.0 | -6.7 | |||||||
| SNAP | -2.8 | -3.0 | |||||||
| School Lunch | -0.8 | -0.9 | |||||||
| WIC | -0.2 | -0.3 | |||||||
| LIHEAP | 0.0 | -0.1 | |||||||
Source: U.S. Census Bureau Current Population Survey, Annual Social and Economic Supplements.
- Refundable tax credits, such as the Earned Income Tax Credit (EITC), and Supplemental Nutrition Assistance Program (SNAP) benefits show the largest poverty reduction effects of the social safety net programs included in the SPM but not included in the official poverty measure. In 2012, family receipt of refundable tax credits (alone) reduced the poverty rate for all persons by 3.0 percentage points and receipt of SNAP benefits (alone) reduced the poverty rate for all persons by 1.6 percentage points.
- The School Lunch program, the Women, Infants, and Children (WIC) program, and the Low Income Home Energy Assistance Program (LIHEAP) also reduced poverty levels in 2012 but to a comparatively less degree than refundable tax credits and SNAP.
- Poverty reductions associated with social safety net programs that are included only in the supplemental measure and not in the official measure were even greater for children than for all persons. In 2012, refundable tax credits (alone) reduced the child poverty rate by 6.7 percentage points and SNAP benefits (alone) reduced the child poverty rate by 3.0 percentage points.
- Including the value of School Lunch (alone) reduced poverty for children by 0.9 percentage points. The poverty reduction effects for the WIC program (alone) and LIHEAP (alone) were much smaller.
- For refundable tax credits, SNAP, and School Lunch, poverty reductions were greater in 2012 than in 2009 for all persons as well as for children. Note that the 2009 poverty reductions associated with refundable tax credits include only the effect of the EITC, while the 2012 poverty reductions include the refundable portion of the child tax credit in addition to the EITC. This difference likely accounts for some portion of the change in the effect of tax credits between 2009 and 2012.
Change in Poverty by Age
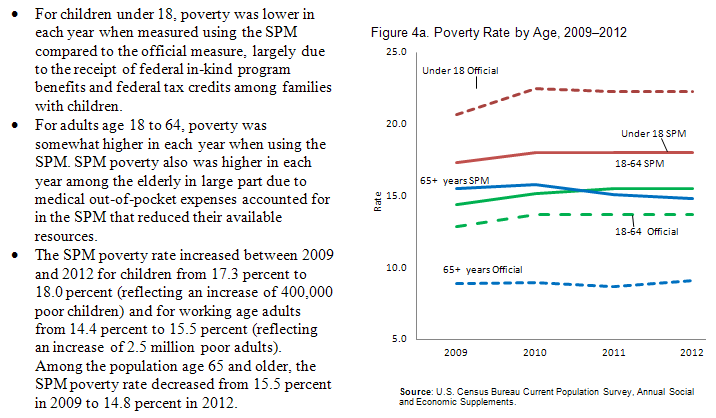
| Figure 4a. Poverty Rate by Age, 2009-2012 | ||||||
| 2009 | 2010 | 2011 | 2012 | |||
| Under 18 SPM | 17.3 | 18.0 | 18.0 | 18.0 | ||
| 18-64 years SPM | 14.4 | 15.2 | 15.5 | 15.5 | ||
| 65+ years SPM | 15.5 | 15.8 | 15.1 | 14.8 | ||
| Under 18 Official Poverty | 20.7 | 22.5 | 22.3 | 22.3 | ||
| 18-64 years Official Poverty | 12.9 | 13.7 | 13.7 | 13.7 | ||
| 65+ years Official Poverty | 8.9 | 9.0 | 8.7 | 9.1 | ||
Source: U.S. Census Bureau Current Population Survey, Annual Social and Economic Supplements.
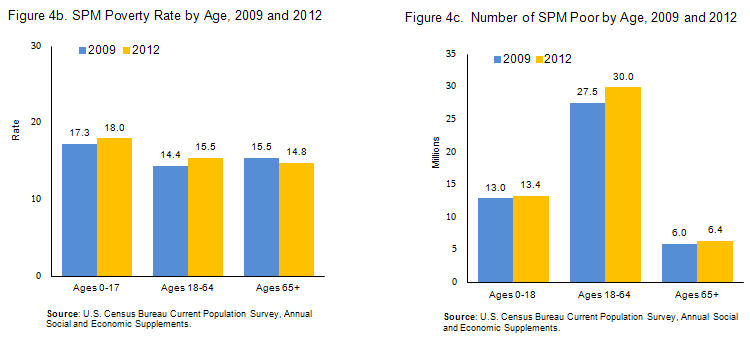
| Figure 4b. SPM Poverty Rate by Age, 2009 and 2012 | ||||||||
| Ages 0-17 | Ages 18-64 | Ages 65+ | ||||||
| 2009 | 17.3 | 14.4 | 15.5 | |||||
| 2012 | 18.0 | 15.5 | 14.8 | |||||
| Figure 4c. Number of SPM Poor by Age (in millions), 2009 and 2012 | ||||||||
| Ages 0-18 | Ages 18-64 | Ages 65+ | ||||||
| 2009 | 13.0 | 27.5 | 6.0 | |||||
| 2012 | 13.4 | 30.0 | 6.4 | |||||
Source: U.S. Census Bureau Current Population Survey, Annual Social and Economic Supplements.
Change in Poverty by Race and Ethnicity
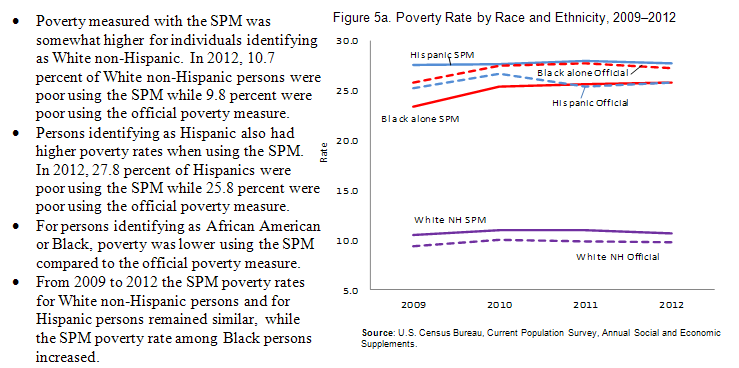
| Figure 5a. Poverty Rate by Race and Ethnicity, 2009-2012 | ||||||||
| White,not Hispanic, Official Poverty | Black alone, Official Poverty | Hispanic, Official Poverty | White , not Hispanic, SPM | Black alone, SPM | Hispanic, SPM | |||
| 2009 | 9.4 | 25.8 | 25.3 | 10.5 | 23.4 | 27.6 | ||
| 2010 | 10.0 | 27.5 | 26.7 | 11.0 | 25.4 | 27.7 | ||
| 2011 | 9.9 | 27.8 | 25.4 | 11.0 | 25.7 | 28.0 | ||
| 2012 | 9.8 | 27.3 | 25.8 | 10.7 | 25.8 | 27.8 | ||
Source: U.S. Census Bureau Current Population Survey, Annual Social and Economic Supplements.
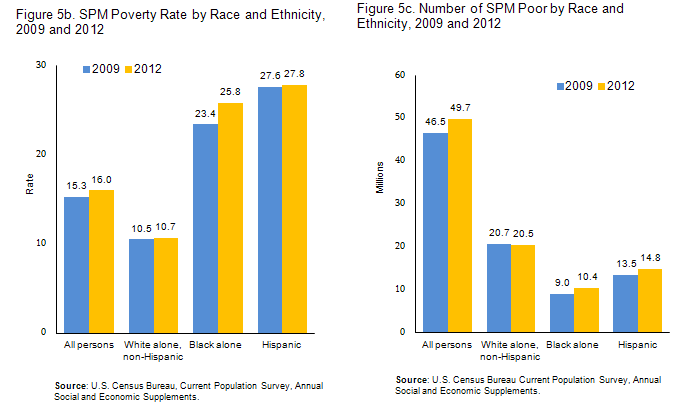
| Figure 5b. SPM Poverty Rate by Race and Ethnicity, 2009 and 2012 | ||||||||
| White alone, non-Hispanic |
Black alone | Hispanic | ||||||
| 2009 | 10.5 | 23.4 | 27.6 | |||||
| 2012 | 10.7 | 25.8 | 27.8 | |||||

|
||||||||
| Figure 5c. Number in SPM Poverty by Race and Ethnicity, 2009 and 2012 (in millions) | ||||||||
| White alone, non-Hispanic |
Black alone | Hispanic | ||||||
| 2009 | 20.7 | 9.0 | 13.5 | |||||
| 2012 | 20.5 | 10.4 | 14.8 | |||||
Source: U.S. Census Bureau Current Population Survey, Annual Social and Economic Supplements.
Change in Poverty by Family Type
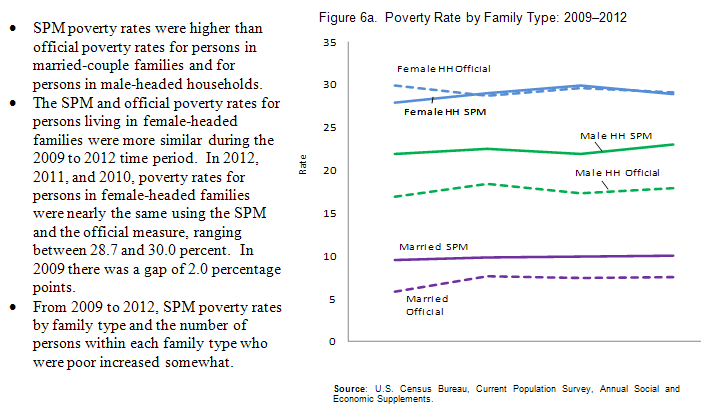
| Figure 6a. Poverty Rate by Family Type, 2009-2012 | |||||||
| Married Official Poverty |
Female HH Official Poverty | Male HH Official Poverty | Married SPM | Female HH SPM | Male HH SPM | ||
| 2009 | 5.8 | 29.9 | 16.9 | 9.5 | 27.9 | 21.9 | |
| 2010 | 7.6 | 28.7 | 18.4 | 9.8 | 29.0 | 22.5 | |
| 2011 | 7.4 | 29.6 | 17.3 | 9.9 | 29.9 | 21.9 | |
| 2012 | 7.5 | 29.1 | 17.9 | 10.0 | 28.9 | 23.1 | |
Source: U.S. Census Bureau Current Population Survey, Annual Social and Economic Supplements

| Figure 6b. SPM Poverty Rate by Family Type, 2009 and 2012 | |||||||||
| Married family | Female-headed family | Male-headed family | |||||||
| 2009 | 9.5 | 27.9 | 21.9 | ||||||
| 2012 | 10.0 | 28.9 | 23.1 | ||||||
|
|
|||||||||
| Figure 6c. Number in SPM Poverty by Family Type, 2009 and 2012 (in millions) | |||||||||
| Married family | Female-headed family | Male-headed family | |||||||
| 2009 | 17.7 | 16.9 | 7.0 | ||||||
| 2012 | 18.7 | 18.1 | 7.8 | ||||||
Source: U.S. Census Bureau Current Population Survey, Annual Social and Economic Supplements.
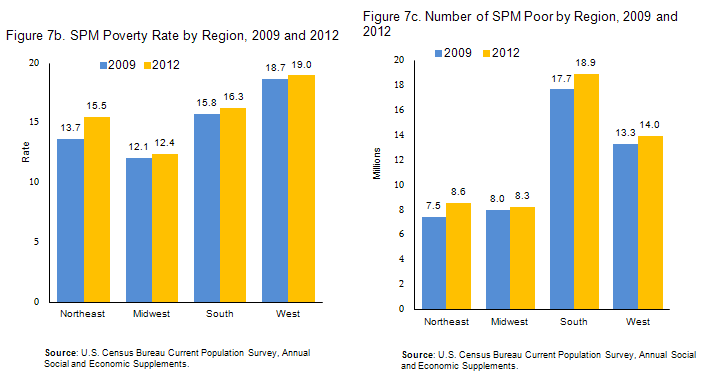
Change in Poverty by Region+

| Figure 7a. Poverty Rate by Region, 2009 and 2012 | ||||||||
| Northeast SPM | Midwest SPM | South SPM | West SPM | Northeast Official Poverty | Midwest Official Poverty | South Official Poverty | West Official Poverty | |
| 2009 | 13.7 | 12.1 | 15.8 | 18.7 | 12.2 | 13.3 | 15.7 | 14.8 |
| 2012 | 15.5 | 12.4 | 16.3 | 19.0 | 13.7 | 13.5 | 16.6 | 15.2 |
Source: U.S. Census Bureau Current Population Survey, Annual Social and Economic Supplements.
+ The South includes AL, AR, DE, DC, FL, GA, KY, LA, MD, MS, NC, OK, SC, TN, TX, VA, and WV. The Midwest includes IL, IN, IA, KS, MI, MN, MO, NE, ND, OH, SD, and WI.
The Northeast includes CT, ME, MA, NH, NJ, NY, PA, RI, and VT. The West includes AK, AZ, CA, CO, HA, ID, MT, NV, NM, OR, UT, WA, and WY.
| Figure 7b. SPM Poverty Rate by Region, 2009 and 2012 | |||||||||
| Northeast | Midwest | South | West | ||||||
| 2009 | 13.7 | 12.1 | 15.8 | 18.7 | |||||
| 2012 | 15.5 | 12.4 | 16.3 | 19.0 | |||||
|
|
|||||||||
| Figure 7c. Number in SPM Poverty by Region, 2009 and 2012 (in millions) | |||||||||
| Northeast | Midwest | South | West | ||||||
| 2009 | 7.5 | 8.0 | 17.7 | 13.3 | |||||
| 2012 | 8.6 | 8.3 | 18.9 | 14.0 | |||||
Source: U.S. Census Bureau Current Population Survey, Annual Social and Economic Supplements.
Change in Poverty by Residence
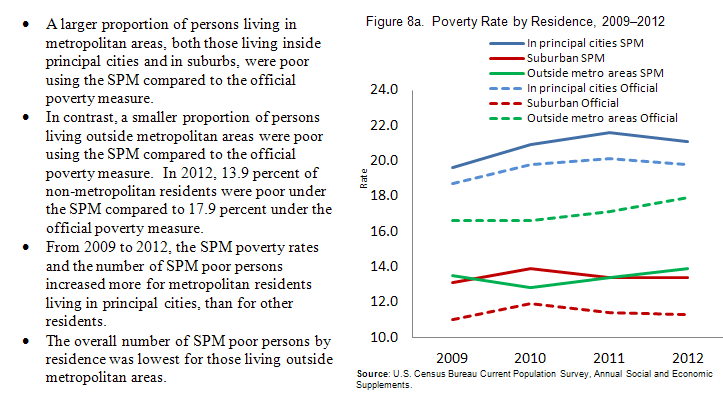
| Figure 8a. Poverty Rate by Residence, 2009–2012 | ||||||||
| In principal cities Official | Suburban Official | Outside metro areas Official | In principal cities SPM | Suburban SPM | Outside metro areas SPM | |||
| 2009 | 18.7 | 11.0 | 16.6 | 19.6 | 13.1 | 13.5 | ||
| 2010 | 19.8 | 11.9 | 16.6 | 20.9 | 13.9 | 12.8 | ||
| 2011 | 20.1 | 11.4 | 17.1 | 21.6 | 13.4 | 13.4 | ||
| 2012 | 19.8 | 11.3 | 17.9 | 21.1 | 13.4 | 13.9 | ||
Source: U.S. Census Bureau Current Population Survey, Annual Social and Economic Supplements.

| Figure 8b. SPM Poverty Rate by Residence, 2009 and 2012 | ||||||||
| In principal cities | Suburban | Outside metro area | ||||||
| 2009 | 19.6 | 13.1 | 13.5 | |||||
| 2012 | 21.1 | 13.4 | 13.9 | |||||
| Figure 8c. Number of SPM Poor by Residence, 2009 and 2012 (in millions) | ||||||||
| In principal cities | Suburban | Outside metro area | ||||||
| 2009 | 19.2 | 20.8 | 6.5 | |||||
| 2012 | 21.4 | 21.7 | 6.7 | |||||
Source: U.S. Census Bureau Current Population Survey, Annual Social and Economic Supplements.
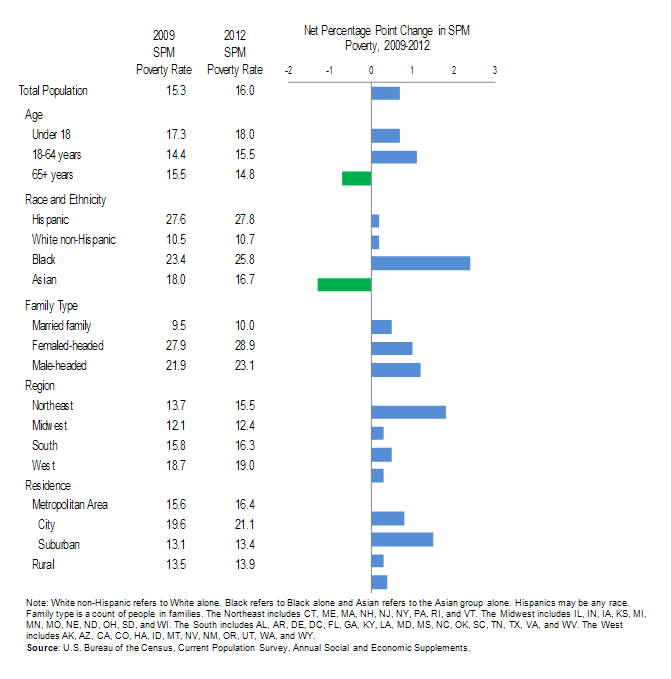
From 2009 to 2012 the Supplemental Poverty Rate increased by 0.7 percentage points for all persons. The SPM poverty rate increased somewhat more for adults ages 18-64, African American or Black persons, persons in female-headed and male-headed families, residents in the Northeast, and those living in cities. The SPM poverty rate decreased from 2009 to 2012 for adults ages 65 and older and for Asians.
Table 1.Supplemental Poverty Rates for Selected Demographics, 2009 and 2012
|
Table 1.Supplemental Poverty Rates for Selected Demographics, 2009 and 2012 |
||||
|
2009 SPM Poverty Rate |
2012 SPM Poverty Rate |
Difference |
||
|
Total Population |
15.3 |
16.0 |
0.7 |
|
|
Age |
||||
|
Under 18 |
17.3 |
18.0 |
0.7 |
|
|
18-64 years |
14.4 |
15.5 |
1.1 |
|
|
65+ years |
15.5 |
14.8 |
-0.7 |
|
|
Race and Ethnicity |
||||
|
Hispanic |
27.6 |
27.8 |
0.2 |
|
|
White non-Hispanic |
10.5 |
10.7 |
0.2 |
|
|
Black |
23.4 |
25.8 |
2.4 |
|
|
Asian |
18.0 |
16.7 |
-1.3 |
|
|
Family Type |
||||
|
Married family |
9.5 |
10.0 |
0.5 |
|
|
Femaled-headed |
27.9 |
28.9 |
1.0 |
|
|
Male-headed |
21.9 |
23.1 |
1.2 |
|
|
Region |
||||
|
Northeast |
13.7 |
15.5 |
1.8 |
|
|
Midwest |
12.1 |
12.4 |
0.3 |
|
|
South |
15.8 |
16.3 |
0.5 |
|
|
West |
18.7 |
19.0 |
0.3 |
|
|
Residence |
||||
|
Metropolitan Area |
15.6 |
16.4 |
0.8 |
|
|
City |
19.6 |
21.1 |
1.5 |
|
|
Suburban |
13.1 |
13.4 |
0.3 |
|
|
Rural |
13.5 |
13.9 |
0.4 |
|
Source: U.S. Census Bureau Current Population Survey, Annual Social and Economic Supplements.
APPENDIX
The SPM makes changes to how income is measured. Compared to the official measure, where only gross before-tax income is included, the SPM:
- Counts the value of federal in-kind benefits that are available to satisfy basic food, clothing, shelter, and utility (FCSU) needs, including nutritional assistance from the Supplemental Nutrition Assistance Program (SNAP) and school meals.
- Subtracts income and payroll taxes paid and adds refundable tax credits received.
- Subtracts from income other necessary expenses such as the cost of child care, other work expenses, child support payments, and out-of-pocket medical expenditures.
The SPM makes changes to the poverty thresholds. Compared to the official poverty threshold, which is set at three times the cost of the minimum food diet in 1963 and updated annually for inflation using the Consumer Price Index (all items), the SPM poverty threshold incorporates the following changes:
- The SPM poverty threshold is the 33rd percentile of out-of-pocket FCSU expenditures of consumer units with two children multiplied by 1.2.
- The SPM threshold varies based on the shelter and utility expenses of three groups: home owners with mortgages, home owners without mortgages, and renters.
- The SPM threshold is adjusted for geographic differences in housing costs to account for regional cost of living differences.
- The SPM uses the five-year moving average of FCSU expenditures to account for inflation.
The Census Bureau continues to release the official measure, which is not being replaced by the SPM. The new SPM thresholds are not intended to assess eligibility for government programs. The SPM is an additional macroeconomic statistic providing further understanding of economic conditions and trends.