
ASPE ISSUE BRIEF
Introduction
Certain health care providers, especially oncologists and anesthesiologists, purchase drugs that they administer to patients as a component of their practices. These drugs include sterile injectable drugs and some drugs used in conjunction with certain durable medical equipment, such as nebulizers. Unlike the many other medical supplies that providers routinely buy in the private market, insurers often separately reimburse providers for the cost of these drugs, rather than expecting providers to cover these costs as part of their global reimbursement. The prices of the drugs themselves, however, are not subject to price regulation under Medicare, and the prices paid by providers to suppliers for these products do not depend on the type of insurance a patient has.
Medicare Part B Reimbursement of Drugs prior to the Medicare Modernization Act
The Medicare Part B drug payment system is used by Medicare to reimburse health care providers for the average costs of the drugs they administer when providing outpatient services to Medicare beneficiaries. Reimbursement to individual providers is based on a formula computed from national sales data, not on the price paid by a specific provider. This reimbursement formula has changed over time. Following enactment of the Balanced Budget Act of 1997, the Health Care Financing Administration, now the Centers for Medicare and Medicaid Services (CMS), required Medicare carriers, which process Medicare claims, to base their reimbursement for a covered drug on its average wholesale price (AWP) as published in RED BOOKTM or similar drug pricing publications used by the pharmaceutical industry. Specifically, for covered drugs available only from a brand source, reimbursement was calculated as 95 percent of the drug's AWP. For covered drugs available from brand and generic sources, reimbursement was the lesser amount of 95 percent of the median AWP for generic sources or 95 percent of the AWP for the brand source.1
Beginning in 1997, several organizations, including the U.S. Department of Health and Human Services (HHS) Office of Inspector General,2, 3, 4, 5 the Medicare Payment Advisory Commission (MedPAC), 6 the U.S. Government Accountability Office, 7 and the Congressional Research Service,8 identified two main problems with this reimbursement system. First, the Balanced Budget Act of 1997 did not define AWP, and most analysts found that the figures used were inflated relative to actual prices paid, lacked uniform reporting criteria, and could not be verified. The lack of standardization also resulted in local Medicare carriers using different AWPs for the same drug code, even though the drug payment system was a national formula that did not provide for differential reimbursement based on geography. Second, because of rebates and other discounts, the published AWPs used by Medicare carriers to calculate reimbursement were substantially higher than the actual acquisition prices available to providers who billed for these drugs. While Medicare paid 95 percent of the AWP, most of these drugs were available to providers for 66 percent to 87 percent of the AWP, with some drugs available for considerably less. 6 As a result, Medicare paid providers roughly a billion dollars more than acquisition costs annually for Part B drugs, and Medicare beneficiaries, who were responsible for a 20 percent copayment, paid hundreds of millions of dollars more annually than if payment rates reflected actual acquisition costs. 2, 3
Medicare Part B Reimbursement of Drugs under the Medicare Modernization Act
The Medicare Prescription Drug, Improvement, and Modernization Act of 2003 (MMA) intended to reduce overpayments for drugs administered in physician offices and hospital outpatient settings by basing the reimbursement formula on a more readily verifiable and market-based price measure. The reimbursement changes, which took full effect in January 2005, tied reimbursement more closely to health care providers' acquisition costs by paying for a drug's average sales price (ASP) plus a 6 percent margin to cover overhead costs for drugs administered in physician offices9 or plus an annually updated margin (currently 6 percent) for separately payable drugs administered in hospital outpatient settings.10
By law, a drug's ASP is defined as the volume-weighted average manufacturer sales price net of all rebates, discounts, and other price concessions to U.S. purchasers, excluding sales that are exempt from Medicaid "best price" calculations and sales to other federal purchasers.11 Manufacturers are required to provide CMS with the quarterly sales price and volume of sales for each covered drug by National Drug Code (NDC) within 30 days of the end of the quarter. Because multiple manufacturers may produce the same drug, CMS crosswalks NDCs for the same drug using the Healthcare Common Procedure Coding System (HCPCS). CMS then calculates a volume-weighted ASP for each HCPCS code, which becomes the basis for the reimbursement rate for the following quarter. Given the time needed to submit and process sales data, the current reimbursement rate always reflects a drug's ASP from two quarters prior. Figure 1 shows the timeline for establishing Medicare Part B reimbursement rates.
Following the MMA change, most private payers adopted the Medicare Part B drug payment system. Since providers do not buy drugs separately for differently insured patients, the Medicare database of ASPs was the basis for private payer reimbursements, although some private payers paid higher or lower surcharges (compared to the 6 percent) than Medicare paid.12, 13 More recently, however, one of the nation's largest private payers eliminated this payment mechanism altogether and began bundling payments for a total course of chemotherapy, with the goal of separating oncologist' income from their drug selection. 14 Under this payment arrangement, chemotherapy drugs are treated like all other medical supplies and products - the provider receives no special reimbursement for their cost.
Figure 1. Timeline for Setting of Medicare Part B Reimbursement Rates

Direct Impacts of the Medicare Modernization Act
Following the MMA changes to the Medicare Part B drug payment system, MedPAC issued two Congressionally-mandated reports, which found that health care providers could still purchase most covered drugs at prices below the Medicare Part B reimbursement rate.15, 16
As had been expected, the change in the Medicare Part B drug payment system had immediate impacts on the revenues of the affected providers. There is also some evidence that physicians changed their prescribing patterns in response to the lower reimbursement rates, either by providing more services or by substituting more profitable services for less profitable ones. MedPAC studied how physician specialties responded to the MMA reimbursement
change. 15, 16 Overall, MedPAC found, oncologists and rheumatologists responded to the payment change by providing more services, urologists provided fewer services, and infectious disease specialists shifted some services back to hospital settings where drugs are typically purchased by the hospital. A more recent study found that the percentage of lung cancer patients who received chemotherapy within one month of diagnosis increased by 2.4 percentage points shortly after the January 2005 payment change.17
We reviewed stock analyst reports and assessments by the drug manufacturers at the time of the MMA change. None of the reports at the time anticipated any effect of the reimbursement mechanism change on the prices paid to manufacturers.
Drug Price Variation subsequent to the Medicare Modernization Act
The MMA reimbursement change did not alter the process through which providers negotiated with drug manufacturers over the price of drugs and would not be expected to have any effect on price volatility. Medicare Part B reimbursement rates do not establish future prices - they are based on prices previously obtained in the market. Thus, shortages (or surpluses) of a given drug will lead to price increases (or decreases), just as had been the case before the MMA. As had been the case under the prior reimbursement mechanism, the two-quarter delay in updating reimbursement rates means that when the market price of a drug rises, reimbursement rates lag prices; conversely, when the market price of a drug falls, reimbursement rates exceed prices. Over the period since the MMA, drug prices have generally fallen,18 so that reimbursement rates, based on lagged prices, have generally been more than 6 percent above the prevailing ASP. However, some analysts have suggested that if providers are more sensitive to losses than to gains, manufacturers may be reluctant to raise drug prices by more than 6 percent within a quarter since providers might face losses on purchases during the period before Medicare updates the reimbursement rate to reflect a higher ASP.
To examine the possibility that Medicare Part B reimbursement rules lead to low price volatility and discourage price increases above 6 percent, we analyzed quarterly ASPs and Medicare Part B reimbursement rates for covered drugs from 2005 to 2013 using ASP Drug Pricing Files and Part B National Summary Data Files provided by CMS.19 For each HCPCS code (n = 735), we calculated the percentage change in ASP from the previous quarter and determined how frequently ASP changed by various specified magnitudes (e.g., 6 percent). We also calculated the coefficient of variation of the quarterly ASPs per HCPCS code to standardize how much a single drug's ASP varied over time and then compared the degree of variation over time across all Part B drugs. The coefficient of variation is the ratio of the standard deviation to the mean.
The empirical results provide strong evidence against the claim that manufacturers do not raise drug prices by more than 6 percent within a quarter. ASPs for nearly three-quarters (73 percent) of HCPCS codes increased by more than 6 percent from the previous quarter at least once between 2005 and 2013. Table 1 reports the distribution of how frequently ASP increased by more than 6 percent from the previous quarter.
Table 1. Distribution of How Frequently Quarterly ASP Increased by More Than 6 Percent per HCPCS Code
| Percentage of Quarters in which ASP Increased by More Than 6 Percent |
Number of HCPCS Codes |
Percentage of HCPCS Codes |
|---|---|---|
| None | 202 | 27.5% |
| 0% to 5% | 45 | 6.1% |
| 5% to 10% | 77 | 10.5% |
| 10% to 15% | 104 | 14.1% |
| 15% to 20% | 56 | 7.6% |
| 20% to 25% | 97 | 13.2% |
| 25% to 30% | 47 | 6.4% |
| 30% to 35% | 51 | 6.9% |
| More than 35% | 56 | 7.6% |
| Total | 735 | 100% |
Increases in ASP of this magnitude are not uncommon. On average, a HCPCS code experienced a greater than 6 percent increase in ASP during 15 percent of all quarters, with many HCPCS codes experiencing increases of this magnitude more often. Moreover, this analysis underestimates how often individual manufacturers raised drug prices by more than 6 percent since ASP averages different manufactures' prices for the same drug. Figure 2 graphs how frequently quarterly ASP changed by various magnitudes ranging from decreases of more than 20 percent to increases of more than 20 percent. The graph shows a declining distribution of progressively larger changes in quarterly ASP with no concentration at 6 percent.
Figure 2. Frequency and Magnitude of Changes in Quarterly ASP
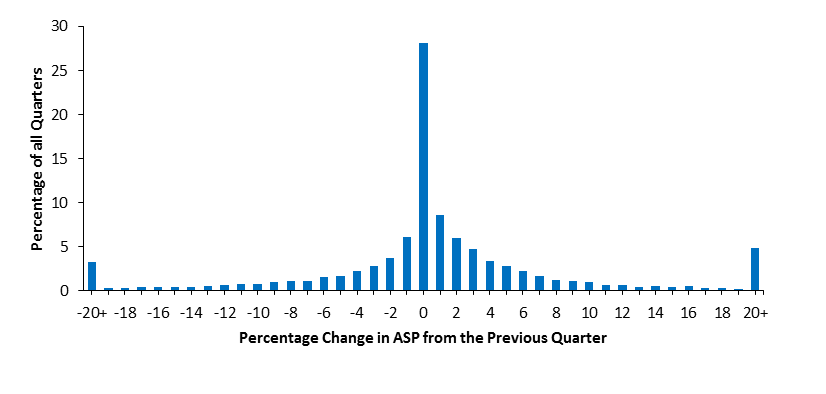
| Percentage Change in ASP from the Previous Quarter | Percentage of All Quarters |
| -20+ | 3.28 |
| -19 | 0.32 |
| -18 | 0.30 |
| -17 | 0.39 |
| -16 | 0.39 |
| -15 | 0.39 |
| -14 | 0.46 |
| -13 | 0.57 |
| -12 | 0.62 |
| -11 | 0.82 |
| -10 | 0.73 |
| -9 | 1.06 |
| -8 | 1.14 |
| -7 | 1.07 |
| -6 | 1.63 |
| -5 | 1.72 |
| -4 | 2.28 |
| -3 | 2.78 |
| -2 | 3.70 |
| -1 | 6.07 |
| 0 | 28.16 |
| 1 | 8.59 |
| 2 | 6.03 |
| 3 | 4.78 |
| 4 | 3.41 |
| 5 | 2.78 |
| 6 | 2.24 |
| 7 | 1.68 |
| 8 | 1.23 |
| 9 | 1.14 |
| 10 | 1.05 |
| 11 | 0.68 |
| 12 | 0.66 |
| 13 | 0.46 |
| 14 | 0.54 |
| 15 | 0.47 |
| 16 | 0.51 |
| 17 | 0.36 |
| 18 | 0.35 |
| 19 | 0.24 |
| 20+ | 4.90 |
Overall, the quarterly ASPs for many drugs experienced considerable variation between 2005 and 2012. The average coefficient of variation of quarterly ASPs per HCPCS code was 0.22, with a range between 0 and 1.9. Table 2 reports the distribution of the coefficient of variation of the quarterly ASPs per HCPCS code.
Table 2. Distribution of the Coefficient of Variation of Quarterly ASPs per HCPCS Code
| Coefficient of Variation of Quarterly ASPs per HCPCS Code |
Number of HCPCS Codes |
Percentage of HCPCS Codes |
|---|---|---|
| Zero | 27 | 3.7% |
| 0.0 to 0.1 | 264 | 36.0% |
| 0.1 to 0.2 | 159 | 21.6% |
| 0.2 to 0.3 | 105 | 14.3% |
| 0.3 to 0.4 | 61 | 8.3% |
| 0.4 to 0.5 | 40 | 5.4% |
| 0.5 to 0.6 | 28 | 3.8% |
| 0.6 to 0.7 | 13 | 1.8% |
| 0.7 to 0.8 | 9 | 1.2% |
| 0.8 to 0.9 | 4 | 0.5% |
| 0.9 to 1.0 | 10 | 1.4% |
| More than 1.0 | 15 | 2.0% |
| Total | 735 | 100% |
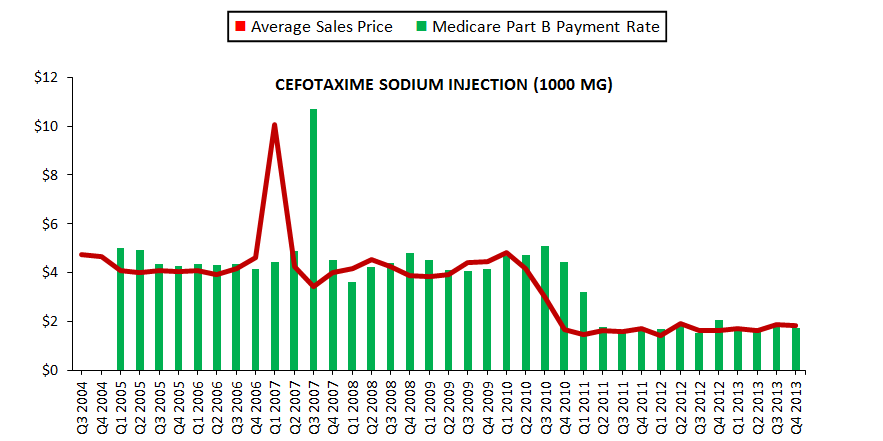
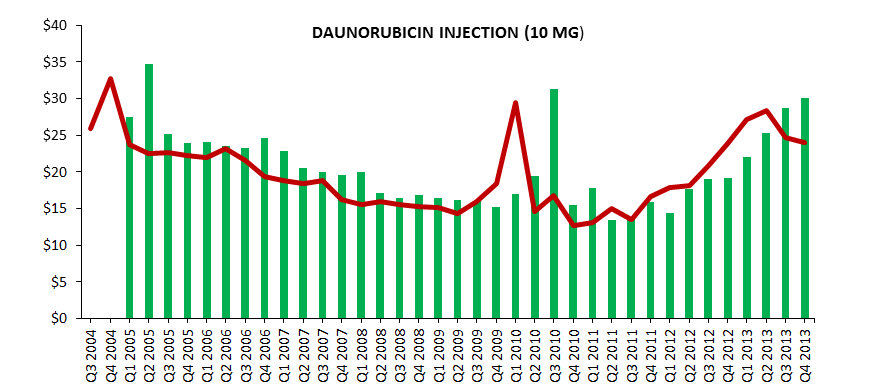
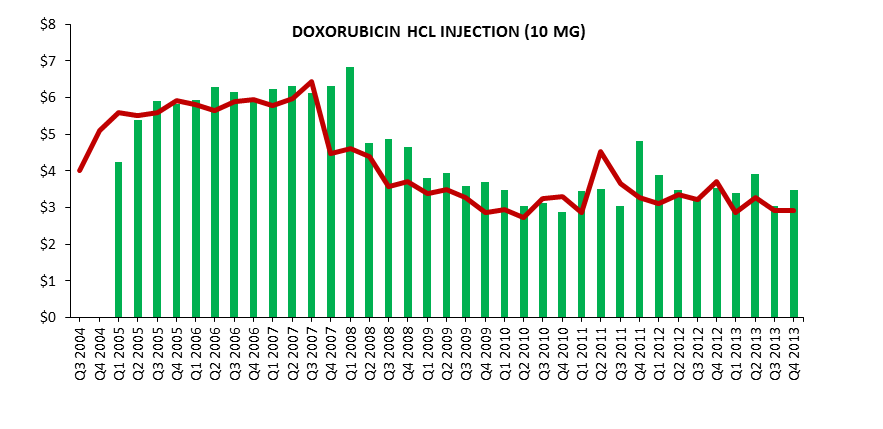
Figure 3 graphs the quarterly ASPs and Medicare Part B reimbursement rates for three selected drugs to illustrate the variation in ASP.
Figure 3. Average Sales Prices and Medicare Part B Reimbursement Rates for Selected Drugs
| HCPCS Code | Drug | Dosage | Series | Q3 2004 | Q4 2004 | Q1 2005 | Q2 2005 | Q3 2005 | Q4 2005 | Q1 2006 | Q2 2006 | Q3 2006 | Q4 2006 | Q1 2007 | Q2 2007 | Q3 2007 | Q4 2007 | Q1 2008 | Q2 2008 | Q3 2008 | Q4 2008 | Q1 2009 |
| J0698 | Cefotaxime Sodium Injection | 1000 MG | Average Sales Price | 4.74 | 4.66 | 4.10 | 4.03 | 4.10 | 4.07 | 4.10 | 3.93 | 4.18 | 4.61 | 10.08 | 4.27 | 3.42 | 3.99 | 4.16 | 4.54 | 4.28 | 3.89 | 3.84 |
| J0698 | Cefotaxime Sodium Injection | 1000 MG | Medicare Part B Payment Rate | 5.02 | 4.94 | 4.35 | 4.27 | 4.35 | 4.32 | 4.35 | 4.16 | 4.43 | 4.88 | 10.68 | 4.53 | 3.63 | 4.23 | 4.41 | 4.81 | 4.53 | ||
| J9000 | Doxorubicin HCl Injection | 10 MG | Average Sales Price | 4.01 | 5.09 | 5.58 | 5.50 | 5.59 | 5.93 | 5.80 | 5.66 | 5.88 | 5.95 | 5.78 | 5.97 | 6.45 | 4.48 | 4.60 | 4.39 | 3.58 | 3.72 | 3.38 |
| J9000 | Doxorubicin HCl Injection | 10 MG | Medicare Part B Payment Rate | 4.26 | 5.39 | 5.92 | 5.84 | 5.93 | 6.29 | 6.15 | 6.00 | 6.24 | 6.31 | 6.12 | 6.32 | 6.83 | 4.75 | 4.88 | 4.66 | 3.79 | ||
| J9150 | Daunorubicin Injection | 10 MG | Average Sales Price | 25.87 | 32.68 | 23.73 | 22.54 | 22.69 | 22.25 | 21.94 | 23.17 | 21.49 | 19.31 | 18.81 | 18.41 | 18.82 | 16.17 | 15.52 | 15.94 | 15.57 | 15.22 | 15.16 |
| J9150 | Daunorubicin Injection | 10 MG | Medicare Part B Payment Rate | 27.43 | 34.64 | 25.15 | 23.90 | 24.05 | 23.59 | 23.26 | 24.56 | 22.78 | 20.47 | 19.94 | 19.52 | 19.95 | 17.14 | 16.45 | 16.90 | 16.50 |
| HCPCS Code | Drug | Dosage | Series | Q2 2009 | Q3 2009 | Q4 2009 | Q1 2010 | Q2 2010 | Q3 2010 | Q4 2010 | Q1 2011 | Q2 2011 | Q3 2011 | Q4 2011 | Q1 2012 | Q2 2012 | Q3 2012 | Q4 2012 | Q1 2013 | Q2 2013 | Q3 2013 | Q4 2013 |
| J0698 | Cefotaxime Sodium Injection | 1000 MG | Average Sales Price | 3.91 | 4.43 | 4.48 | 4.81 | 4.18 | 3.04 | 1.68 | 1.48 | 1.64 | 1.61 | 1.74 | 1.43 | 1.95 | 1.66 | 1.66 | 1.74 | 1.65 | 1.90 | 1.84 |
| J0698 | Cefotaxime Sodium Injection | 1000 MG | Medicare Part B Payment Rate | 4.12 | 4.08 | 4.15 | 4.69 | 4.75 | 5.10 | 4.44 | 3.23 | 1.78 | 1.57 | 1.74 | 1.71 | 1.84 | 1.52 | 2.06 | 1.76 | 1.76 | 1.85 | 1.75 |
| J9000 | Doxorubicin HCl Injection | 10 MG | Average Sales Price | 3.48 | 3.28 | 2.87 | 2.95 | 2.72 | 3.25 | 3.30 | 2.86 | 4.53 | 3.66 | 3.28 | 3.10 | 3.35 | 3.21 | 3.70 | 2.88 | 3.28 | 2.93 | 2.92 |
| J9000 | Doxorubicin HCl Injection | 10 MG | Medicare Part B Payment Rate | 3.95 | 3.58 | 3.69 | 3.48 | 3.04 | 3.12 | 2.88 | 3.45 | 3.50 | 3.03 | 4.81 | 3.88 | 3.48 | 3.29 | 3.55 | 3.41 | 3.92 | 3.05 | 3.47 |
| J9150 | Daunorubicin Injection | 10 MG | Average Sales Price | 14.38 | 16.01 | 18.35 | 29.51 | 14.62 | 16.76 | 12.66 | 13.08 | 15.00 | 13.53 | 16.64 | 17.89 | 18.10 | 20.80 | 23.82 | 27.11 | 28.32 | 24.64 | 24.01 |
| J9150 | Daunorubicin Injection | 10 MG | Medicare Part B Payment Rate | 16.14 | 16.07 | 15.24 | 16.97 | 19.46 | 31.28 | 15.50 | 17.76 | 13.42 | 13.86 | 15.90 | 14.34 | 17.64 | 18.96 | 19.19 | 22.05 | 25.25 | 28.73 | 30.02 |
Other Factors Affecting Drug Prices
Another, and much larger, impact on the Medicare Part B reimbursement received by health care providers has been the shift from branded drugs to generic drugs. For example, between 2002 and 2013, while the overall market for sterile injectable drugs increased by 39 percent, the number of units sold by generic drug manufacturers increased by 57 percent.20 This increase in sales volume has been accompanied by an even greater increase in sales revenue. According to IMS Health sales data, the total sales revenue for generic sterile injectable products grew from $2.0 billion in 2002 to $7.8 billion in 2013, a 200 percent increase in real dollars after deflating prices with the CPI-U. The shift from branded drugs to generic drugs has also affected other dosage forms covered by Medicare Part B.21, 22
This shift had very large effects on both total reimbursements and on the dollar value of the 6 percent margin received by providers, since providers would often have been receiving reimbursements based on the branded drug price while acquiring generic drugs. 22
Conclusion
In response to widespread manipulation and overpayments associated with the previous AWP-based Medicare Part B drug payment system, the MMA tied reimbursement more closely to health care providers' acquisition costs by paying for a drug's market price. Under this acquisition process, Medicare has no price-setting power reimbursement rates lag rather than lead market prices. Empirical analysis of quarterly ASPs and reimbursement rates for covered drugs shows that market prices vary considerably over time and occasionally experience sharp spikes. In general, however, previous studies have found that most providers could still purchase most covered drugs at or below the reimbursement rate.
Endnotes
1 42 C.F.R. § 405.517.
2 U.S. Department of Health and Human Services, Office of Inspector General, Excessive Medicare Payments for Prescription Drugs, Pub. No. OEI-03-97-00290, 1997.
3 U.S. Department of Health and Human Services, Office of Inspector General, Medicare Reimbursement of Prescription Drugs, Pub. No. OEI-03-00-00310, 2001.
4 U.S. Department of Health and Human Services, Office of Inspector General, Excessive Medicare Reimbursement for Albuterol, Pub. No. OEI-03-01-00410, 2002.
5 U.S. Department of Health and Human Services, Office of Inspector General, Excessive Medicare Reimbursement for Iipratropium Bromide, Pub. No. OEI-03-01-00411, 2002.
6 Medicare Payment Advisory Commission, Chapter 9: Medicare Payments for Outpatient Drugs under Part B, Report to the Congress: Variation and Innovation in Medicare, 2003.
7 U.S. Government Accountability Office, Medicare: Payments for Covered Outpatient Drugs Exceed Providers' Cost, Pub. No. GAO-01-1118, 2001.
8 Congressional Research Service, Medicare: Payments for Covered Prescription Drugs, Pub. No. RL31419, 2002.
9 42 C.F.R. § 405 as amended.
10 42 C.F.R. § 419 as amended. Separately payable drugs are those that are not packaged within an ambulatory payment classification group because their average cost per day of treatment exceeds $80. The Medicare Hospital Outpatient Prospective Payment System (OPPS) has typically reimbursed these drugs at ASP plus a 4 to 6 percent margin.
11 42 U.S.C. § 1395w-3a(c).
12 Mullen P, The Arrival of Average Sales Price," Biotechnology Healthcare 4:48-53, 2007.
13 Arkansas BlueCross and BlueShield, Provider's News: March 2005. Available at: http://www.arkansasbluecross.com/doclib/publications/march_2005.pdf.
14 Appleby J, "A New Way To Pay For Chemotherapy: Major Insurer Would Pay Oncologists A Set Fee For Certain Cancers," Kaiser Health News: October 20, 2010. Available at: http://www.kaiserhealthnews.org/stories/2010/october/20/chemotherapy.aspx.
15 Medicare Payment Advisory Commission, Report to the Congress: Effects of Medicare Payment Changes on Oncology Services, 2006.
16 Medicare Payment Advisory Commission, Report to the Congress: Impact of Changes in Medicare Payments for Part B Drugs, 2007.
17 Jacobson M, Earle CC, Price M, and Newhouse JP, How Medicare's Payment Cuts for Cancer Chemotherapy Drugs Changed Patterns of Treatment, Health Affairs 29(7): 1394-1402, 2010.
18 U.S. Department of Health and Human Services, Office of the Assistant Secretary for Planning and Evaluation, Economic Analysis of the Causes of Drug Shortages, 2011.
19 We cannot directly test whether the MMA reduced price volatility because data prior to 2005 are not available.
20 IMS Health, IMS National Sales Perspective™, Data extracted May 2014.
21 IMS Institute for Healthcare Informatics, Medicine Use and Shifting Costs of Healthcare: A Review of the Use of Medicines in the U.S. in 2013, 2014.
22 U.S. Department of Health and Human Services, Office of Inspector General, Medicare Payments for Newly Available Generic Drugs, Pub. No. OEI-03-09-00510, 2011.