
This brief analyzes and summarizes the poverty rates for various populations in the United States. Cited statistics include changes in the poverty rate and number of children in poverty by age, race and ethnicity, and family type. The data are based on information collected in the 2014 and earlier Current Population Survey Annual Social and Economic Supplements (CPS ASEC) conducted by the Census Bureau.
- The Census Bureau today released data indicating that the overall poverty rate in 2013 was 14.5 percent – a decrease from 15.0 percent in 2012. This change was the first decrease since 2006. This represents 45.3 million people living in poverty in 2013. Persons are considered poor if they have family incomes below the poverty threshold. The poverty threshold for a family of four was $23,834 in 2013.1
- Median household income was $51,939 in 2013, which is not statistically different from the 2012 median. For each year between 2007 and 2011 median household income decreased. From 2011 to 2013, median household income remained unchanged.
- The total number of children in poverty in 2013 was 14.7 million, a decrease from 16.1 million in 2012. The child poverty rate was 19.9 percent, a decrease from the 2012 rate of 21.8 percent. The change in the child poverty rate represented the first decrease from the previous year since 2000.
- For African-American children, the poverty rate reported today was 36.9 percent for 2013. The rate for Hispanic children was 30.4 percent. For non-Hispanic, White children the rate was 10.7 percent.
- Related children living in female-headed families with no spouse present had a poverty rate of 45.8 percent, over four times the rate of children in married-couple families (9.5 percent).
- The poverty rate for people age 65 and over was 9.5 percent, which is statistically unchanged from 2012. There were 4.2 million people age 65 and over living in poverty in 2013, which is a statistically significant increase from 3.9 million in 2012.
- In 2013, 6.3 percent of all people, or 19.9 million people, lived in deep poverty (had income below one-half the poverty threshold, or $11,917 for a family of four).
- These figures reflect money income only and do not reflect in-kind public supports or tax credits. More detailed data incorporating these and other noncash benefits and how they affect measures of poverty will be available in late October.
1 The Census Bureau measures poverty by comparing total family money income (before taxes and tax credits and excluding non-cash benefits) to dollar value thresholds that vary by family size and composition.
"The following charts summarize key points about the poverty data released today
- Poverty Rate of All Persons: 2000 to 2013
- Poverty Rate of Children under 18: 2000 to 2013
- All Persons and Children below 50% of Poverty: 2000 to 2013
- Poverty Rate of All Persons by Age: 2000 to 2013
- Child Poverty by Race and Ethnicity: 2000 to 2013
- Child Poverty by Family Structure: 2000 to 2013
- Poverty Rate of All Persons by Race and Ethnicity: 1979 to 2013
Poverty Rate of All Persons
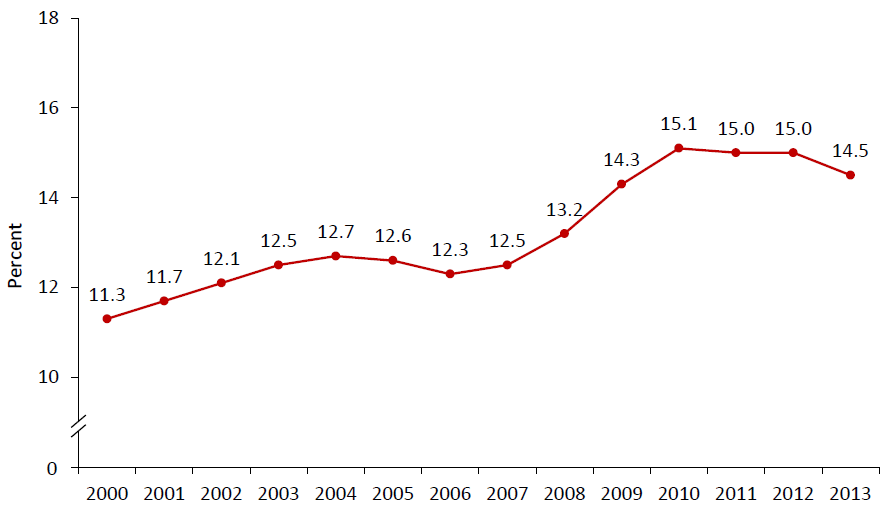
OVERALL POVERTY
- For calendar year 2013, the official overall poverty rate was 14.5 percent.
- This is a decrease from 15.0 percent in 2012.
- In 2013, the total number of people in poverty was 45.3 million, statistically unchanged from 2012.
- The poverty rate in 2013 was 3.2 percentage points higher than in 2000.
Poverty Rate of Children under 18
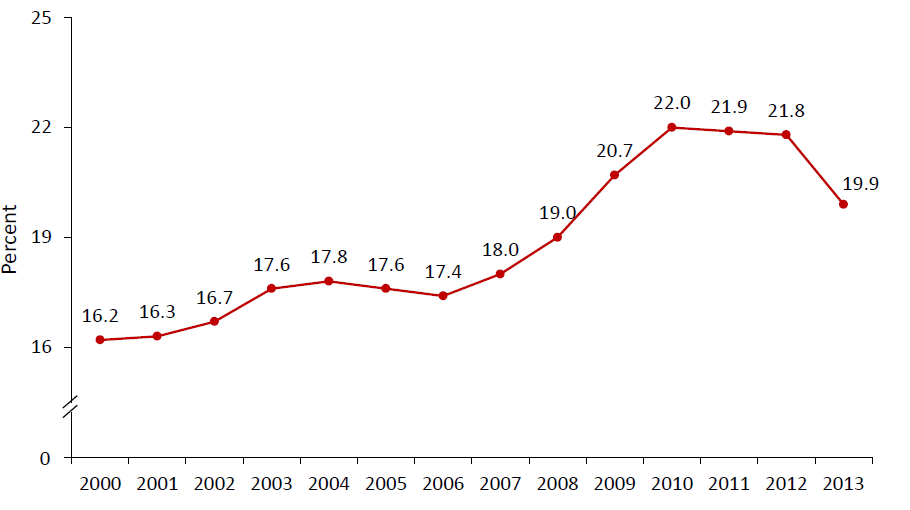
CHILD POVERTY – ALL CHILDREN
- For calendar year 2013 the percentage of children (persons under 18) in poverty was 19.9 percent.
- This rate is a decrease from 21.8 percent in 2012.
- The total number of children in poverty in 2013 was 14.7 million, a decrease from 16.1 million in 2012.
- The child poverty rate in 2013 was 3.7 percentage points higher than in 2000.
All Persons and Children below 50% of Poverty
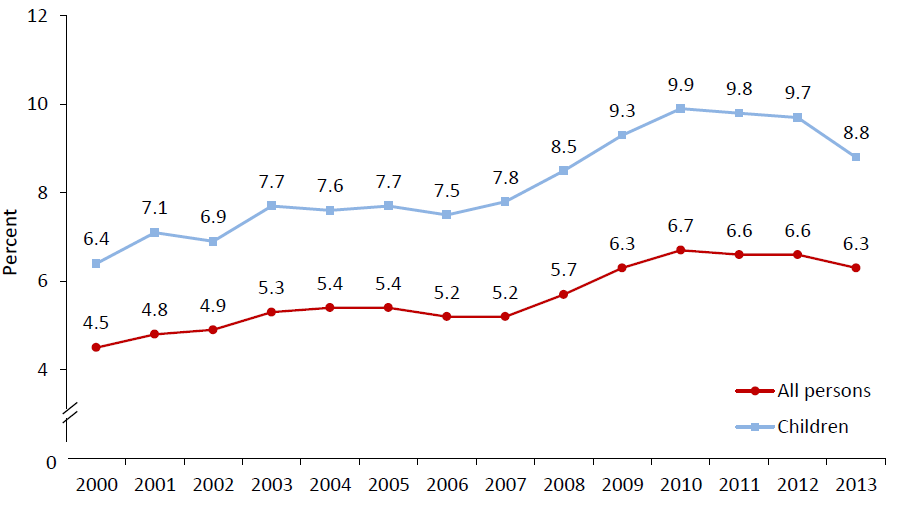 DEEP POVERTY
- In 2013, 6.3 percent of all people, or 19.9 million people, had incomes below one-half of the poverty threshold. In 2013, 50 percent of the poverty threshold for a family of four was $11,917.
- These 19.9 million people with incomes below one-half of the poverty threshold represent more than two-fifths (43.8 percent) of those living in poverty in 2013.
- In 2013, 6.5 million children under 18 or 8.8 percent of all children were living in deep poverty.
Poverty Rate of All Persons by Age
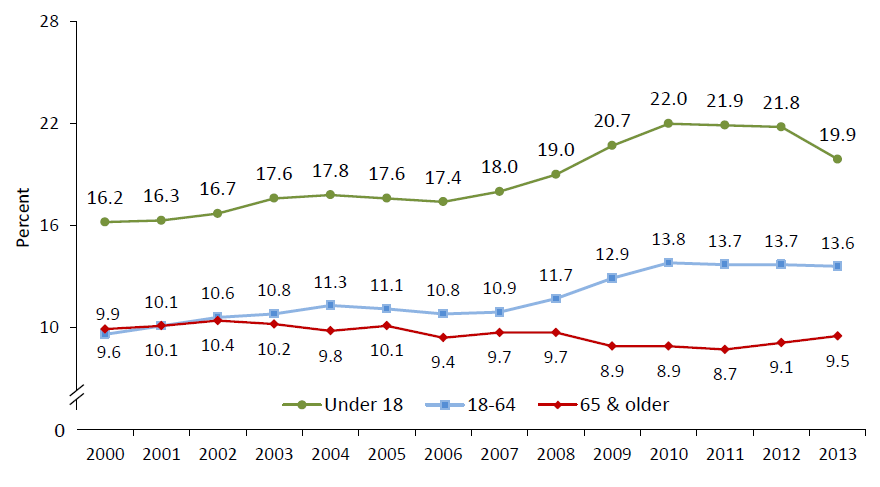
- In 2013, the poverty rate among adults 65 and older was 9.5 percent, which is statistically unchanged from the rate in 2012. There were 4.2 million people age 65 and older living in poverty in 2013, which is a statistically significant increase from 3.9 million in 2012.
- The poverty rate among adults between the ages of 18 and 64 was 13.6 percent in 2013, unchanged from 2012.
- In 2013, children under the age of 18 had a poverty rate of 19.9 percent, a decrease from 21.8 percent in 2012.
- In 2013, the poverty rate among adults ages 18 to 64 was 4.1 percentage points higher than for adults 65 and older, while these groups had the same poverty rate of 10.1 percent in 2001.
- In 2013, poverty rates for the under 18 and 18 to 64 age groups have increased 3.7 and 4.0 percentage points, respectively, since 2000. The poverty rate for those 65 and older is statistically unchanged from the rate in 2000.
Child Poverty by Race and Ethnicity
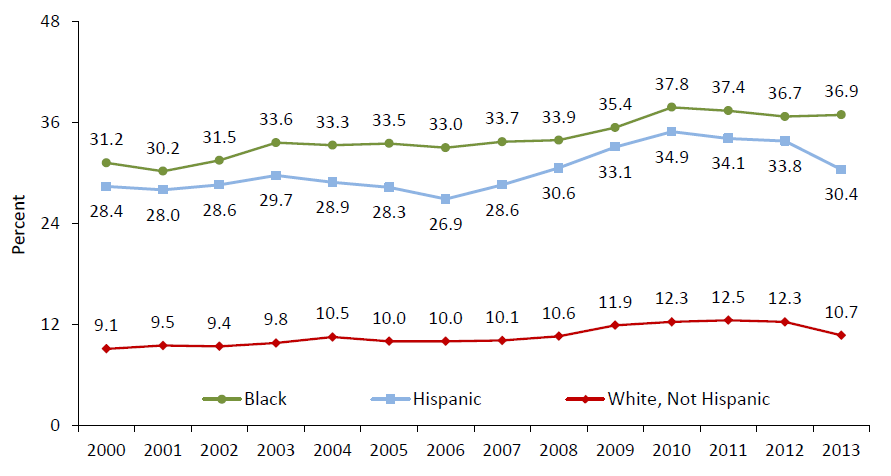
Note: Hispanic includes children of all races. White, Not Hispanic does not include any Hispanic children and starting in 2002 excludes White, Not Hispanic children reporting multiple race categories. Black or African-American includes Hispanic children and starting in 2002 includes Black or African-American children reporting multiple race categories.
- For African-American children, the poverty rate in 2013 was 36.9 percent. The poverty rate for African-American children in 2013 was 5.4 percentage points higher than a decade earlier in 2002.
- For Hispanic children, the poverty rate in 2013 was 30.4 percent, a decrease from 33.8 percent in 2012. The poverty rate for Hispanic children in 2013 was 3.5 percentage points higher than the recent low in 2006.
- For non-Hispanic White children, the poverty rate was 10.7 percent in 2013. The poverty rate for non-Hispanic White children in 2013 was 1.6 percentage points higher than the recent low in 2000.
Child Poverty by Family Structure
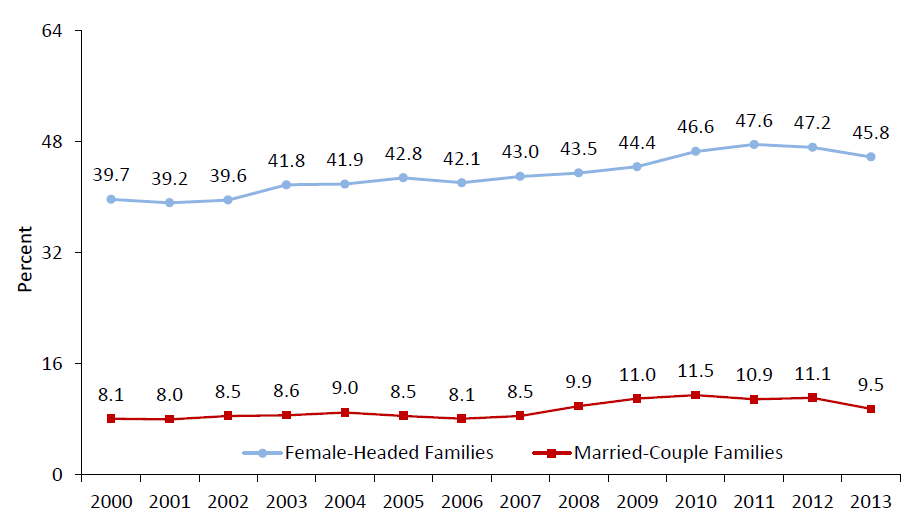
- In 2013, the poverty rate for children in married-couple families was 9.5 percent, down from 11.1 percent in 2012.
- The poverty rate among children in female-headed families with no spouse present was 45.8 percent in 2013, a decrease from 47.2 percent in 2012.
- Children living in female-headed families with no spouse present had a poverty rate over four times that of children in married-couple families in 2013 (45.8 percent compared to 9.5 percent).
Poverty Rate of All Persons by Race and Ethnicity
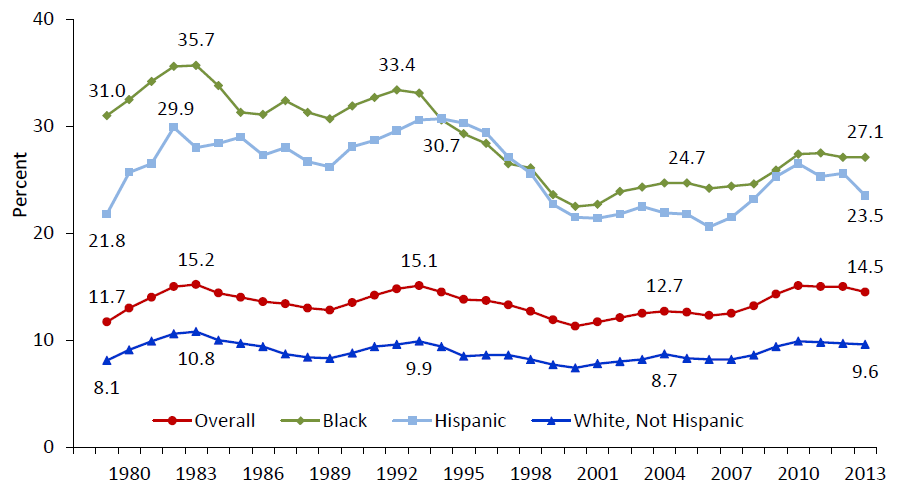
Note: Hispanic includes persons of all races. White, Not Hispanic does not include any Hispanic persons, and starting in 2002 excludes White, Not Hispanic persons reporting multiple race categories. Black or African-American includes Hispanic persons and starting in 2002 includes Black or African-American persons reporting multiple race categories.
HISTORICAL POVERTY RATES
- The percentage of all persons living in poverty in 2013, 14.5 percent, was lower than the past peak rates of 15.2 percent in 1983, 15.1 percent in 1993, and 15.1 percent in 2010.
- In calendar year 2013, the poverty rate for all African-American persons was 27.1 percent. This is unchanged from 2012, and it is below the recent peak poverty rate of 33.4 percent in 1992.
- In calendar year 2013, the poverty rate for all Hispanic persons was 23.5 percent. This is a decrease from 25.6 percent in 2012 and below the peak poverty rate of 30.7 percent in 1994.