
Marla McDaniel, Margaret Simms, William Monson, and Karina Fortuny
This brief, part of a series on disconnected low-income men, summarizes selected data from published reports on incarceration in the United States. Low-income men are defined as those age 18 to 44 who live in families with incomes below twice the federal poverty level (FPL)1 and do not have four-year college degrees. Other briefs in the series examine low-income men’s demographic profiles, education, employment, and health.
We present data on imprisonment, one component of criminal justice system involvement, highlighting stark disparities by race, education, and place. The statistics on criminal offenses and incarceration cited reflect changes in federal and state crime policies over the past few decades, especially those related to drug offenses. These policies have led to mass incarceration—that is, the imprisonment of comparatively and historically high proportions of the population that cannot be accounted for by changes in crime rates. The US Department of Justice is reviewing laws and agency enforcement policies that may have had a disparate impact on African Americans and Hispanics, both in terms of incarceration and the collateral damage to their families and communities.2 Some of these impacts are summarized in this brief.
Young men of color are a particular focus because of their high rates of incarceration. While they are highly concentrated in poor neighborhoods, especially in urban areas, most available data are at the state and national level. Therefore, we mainly focus on state and national data that provide the most extensive documentation of the racial and ethnic aspects of incarceration. Since the criminal justice data generally do not include income of the prisoners’ families, we are unable to identify the proportion of incarcerated men who are low income. To the extent that prisoners are separated from mainstream society, however, the men in focus are disconnected and afterward face challenges reconnecting to the mainstream.
In addition to incarceration rates, we include state data on voting restrictions related to incarceration, a form of disconnection through civil disenfranchisement. We highlight examples of the economic impact of incarceration on individual communities and society as a whole. We consider both the costs of incarceration and the related family and community costs generated by that incarceration.
"Racial Differences in Incarceration Rates
According to a 2012 Bureau of Justice Statistics bulletin on state and federal prisoners, African American and Hispanic men are incarcerated at higher rates nationally than white men (Carson and Sabol 2012).3 Among all US male residents in 2011, 932 men per 100,000 were imprisoned.4 When broken out by race and ethnicity, striking differences appear: incarceration rates for African American men are over six times higher than rates for white men and nearly two and a half times higher than rates for Hispanic men (figure 1).
Figure 1. 2011 US Male Incarceration Rates by Race and Ethnicity
Source: E. Ann Carson and William J. Sabol, “Prisoners in 2011,” NCJ 239808 (Washington, DC: US Department of Justice, Office of Justice Programs, Bureau of Justice Statistics, 2012).
Note: African American refers to non-Hispanic African American or black and includes those who identified themselves as black or African American only. White refers to non-Hispanic white and includes those who identified themselves as white only. People of Hispanic origin may be of any race.
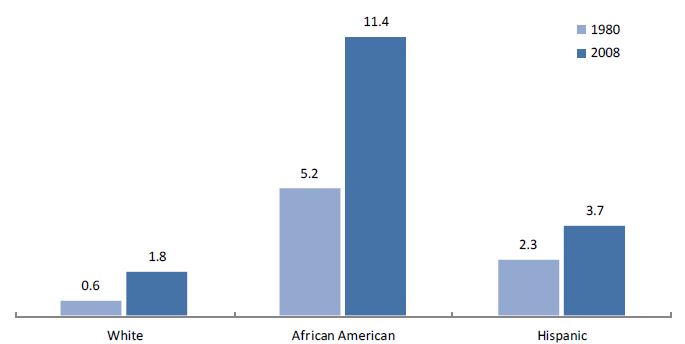
Figure 2. Percentage of Men Age 20–34 in Prison by Race and Ethnicity, 1980 and 2008
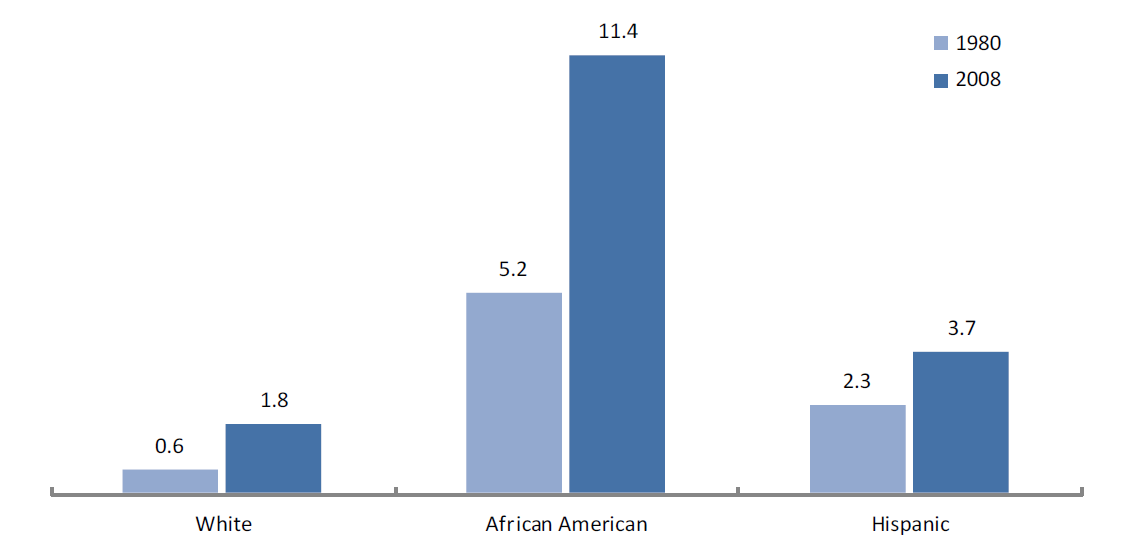
Source: Pew Charitable Trusts, “Collateral Costs: Incarceration’s Effect on Economic Mobility” (Washington, DC: Pew Charitable Trusts, 2010).
Note: African American refers to non-Hispanic African American or black and includes those who identified themselves as black or African American only. White refers to non-Hispanic white and includes those who identified themselves as white only. People of Hispanic origin may be of any race
Most men in prison in 2011 were between 30 and 34 years old, according to the 2012 Bureau of Justice Statistics report. In that age range, 1,115 white men were imprisoned per 100,000 men in the population. Rates were higher among African American and Hispanic men, at 7,517 and 2,762, respectively, per 100,000. Although the racial differences in prison rates among men age 30–34 are quite pronounced, the racial disparities are highest among young men between the ages of 18 and 19:5
- African American men age 18–19 are 9.3 times more likely than white men of the same age to be imprisoned.
Hispanic men age 18–19 are 3.5 times more likely than white men of the same age to be imprisoned (Carson and Sabol 2012).
In addition to racial and ethnic differences in incarceration rates, criminal offenses vary by race and ethnicity (Carson and Sabol 2012). In 2010, white men were more likely than African Americans and Hispanics to be imprisoned for property-related crimes (24 percent compared with 15 and 14 percent, respectively). African American men were more likely to be imprisoned for drug offenses. Twenty-one percent of the African American prison population was incarcerated on drug offenses compared with 15 percent of the white prison population. Hispanics were slightly more likely than whites to be incarcerated for drug offenses (17 percent).
The Male Prison Population Has Grown
A 2010 Pew Charitable Trusts report provides additional dimensions to the Bureau of Justice Statistics incarceration data. It focuses on incarceration’s negative long-term effects on former prisoners’ economic mobility and its consequences on families and children. The Pew report highlights the dramatic rise in incarceration rates from 1980 to 2008, especially among African American men and men without high school diplomas. Nationally, the number of men age 20–34 in prison during that time increased 1.2 percentage points among white men and 1.4 percentage points among Hispanic men, compared with 6.2 percentage points among African American men (figure 2).
Figure 3. Lifetime Likelihood of Incarceration among Men Born in 1974 versus 2001 by Race and Ethnicity
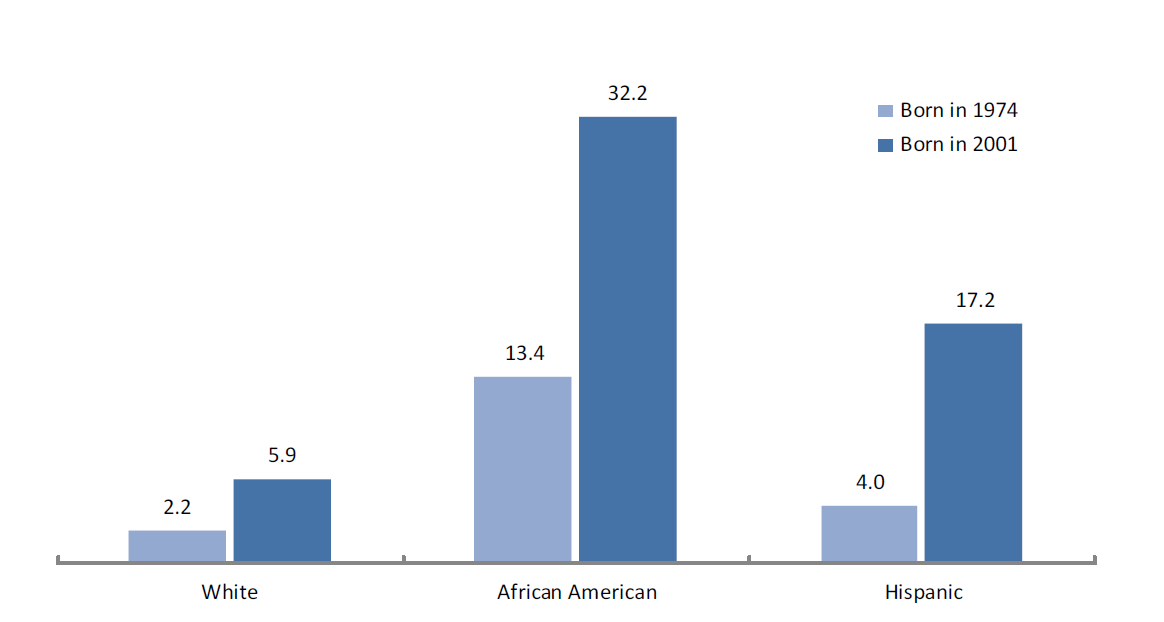
Source: Thomas Bonczar, “Prevalence of Imprisonment in the US Population, 1974–2001,” NCJ 197976 (Washington, DC: US Department of Justice, Office of Justice Programs, Bureau of Justice Statistics, 2003).
Note: African American refers to non-Hispanic African American or black and includes those who identified themselves as black or African American only. White refers to non-Hispanic white and includes those who identified themselves as white only. People of Hispanic origin may be of any race.
Among high school dropouts, incarceration rates increased precipitously, especially among African Americans:
- In 1980, 2.4 percent of white male dropouts were incarcerated, compared with 10.6 percent of African American male dropouts and 3.2 percent of Hispanic male dropouts.
- By 2008, the percentages had increased to 12 percent of white male dropouts, 37.1 percent of African American men, and 7 percent of Hispanic men of any race (Pew Charitable Trusts 2010).
Despite the overall growth in prison rates, national statistics show a declining rate in the total proportion of prisoners who are African American, which fell from 46 percent in 2000 to 39 percent in 2010 (Guerino, Harrison, and Sabol 2011).
Lifetime likelihood of imprisonment has increased
Another way to measure incarceration trends is to examine the likelihood that a man will enter prison at some point in his lifetime. In a special report from the Bureau of Justice Statistics, Thomas Bonczar (2003) finds that white,
African American, and Hispanic men born in 2001 are significantly more likely to spend some time in prison than
white, African American, or Hispanic men born in 1974 (figure 3).6 According to the report, if present trends continue, the lifetime likelihood of going to prison for men born in 2001 will be triple the likelihood of those born in
1974 (11.3 versus 3.6 percent). These data demonstrate that future generations of men, particularly men of color, are statistically more likely than past generations of men to spend time in prison at some point in their lives. Evidence further suggests that future generations of children are more likely to have an incarcerated parent. According to the Pew Charitable Trusts, the share of children under 18 with an incarcerated parent rose from 0.8 percent in 1980 to 3.6 percent in 2008. In 2008, 11.4 per-cent of African American children had a parent in prison, compared with 3.5 percent of Hispanic children and 1.8 percent of white children (Pew Charitable Trusts 2010).
Prisoners of Color Are More Likely to Be Disenfranchised
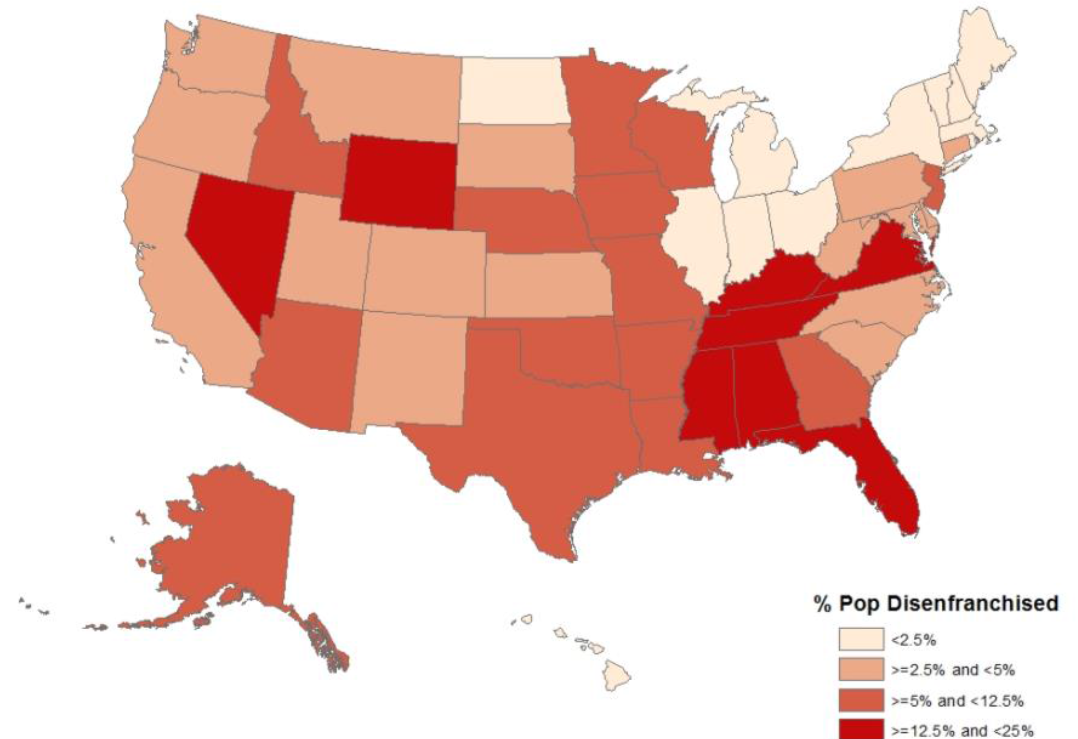
“Felon disenfranchisement,” as defined by The Sentenc-ing Project, are laws that restrict inpiduals with felony convictions from voting.7 States set their own laws, so the extent that inpiduals with felony-level crimes are disenfranchised by this definition varies by state. Data from The Sentencing Project capture racial disparities in incarceration rates and felony disenfranchisement rates (number of people incarcerated for a felony of-fense as a percentage of the voting-age population) by state.8 All but two states (Maine and Vermont) restrict inmates from voting. However, states vary by how much they also restrict parolees, probationers, and ex-felons from voting. Among four of the more populous states—California, Illinois, New York, and Pennsylvania—Illinois and Pennsylvania restrict only inmates from voting, while California and New York restrict both in-mates and parolees (Uggen, Shannon, and Manza 2012). The strictest policies forbidding ex-felons from voting in 2010, as well as those incarcerated and those on probation or parole, are found in 11 states, including Florida, Kentucky, Tennessee, and Virginia (figure 4).9
Figure 4. Share of Adult Population Experiencing Felony Disenfranchisement by State, 2010
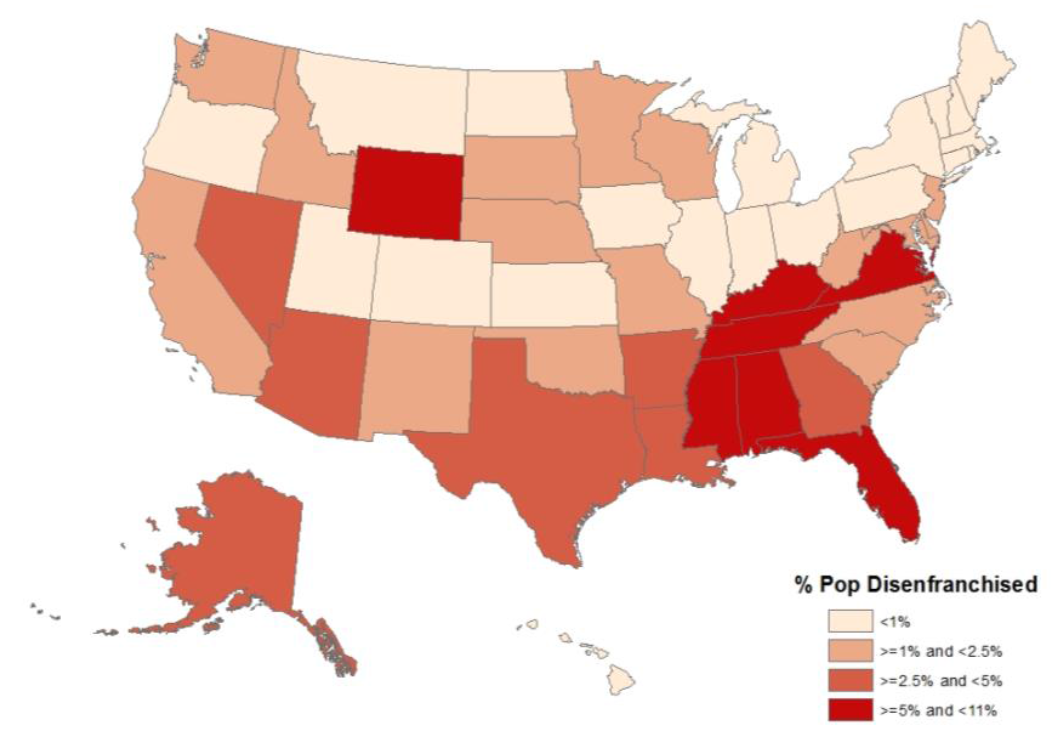
Source: Authors’ calculations based on Christopher Uggen, Sarah Shannon, and Jeff Manza, State-Level Estimates of Felon Disenfranchisement in the United States, 2010 (Washington, DC: The Sentencing Project, 2012).
Incarceration and felony disenfranchisement rates vary widely by state
Nationally, African Americans have higher felony disenfran-chisement rates10 than whites, partly because of the higher proportion of African Americans in prison (figure 5). That is, since a higher proportion of African Americans is incar-cerated, a higher proportion of all voting-age African Amer-icans in a state is at risk of felony disenfranchisement. For every white adult incarcerated (in jail or prison) in 2010, there were 5.6 African American prisoners and 1.8 Hispanic prisoners. Similarly, the national felony disenfranchisement rate was 3 percent for all voting-age adults but more than twice as high for all African American voting-age adults (8 percent) (Uggen et al. 2012).
Figure 5. Share of African American Population Experiencing Felony Disenfranchisement by State, 2010
Source: Authors’ calculations based on Christopher Uggen, Sarah, Shannon, and Jeff Manza, State-Level Estimates of Felon Disenfranchisement in the United States, 2010 (Washington, DC: The Sentencing Project, 2012).
Note: African American refers to non-Hispanic African American or black and includes those who identified themselves as black or African American only.
- Among the more populous states, New York had the highest African American–to-white prisoner incarcera-tion ratio of 9.4 to 1, followed by Pennsylvania andIllinois at 9.2 and 9.1 to 1, respectively. For Hispanic prisoners, the same three states led and Pennsylvania had the highest Hispanic-to-white ratio at 5.6 to 1.
- The felony disenfranchisement rate for all voting-age African Americans in New York was 2.1 percent, com-pared with 0.7 percent for New York’s total voting-age population. Felony disenfranchisement among voting-age African Americans is similar in Pennsylvania and Illinois at 2.5 and 2.0 percent, respectively, compared with 0.6 and 0.5 percent, respectively, for the states’ total voting-age population.
As described earlier, felony disenfranchisement rates are highest in states with the strictest policies restricting ex-felons from voting.
- Among the 11 states with the strictest policies, the proportion of the voting-age population that is disen-franchised is quite high. Florida, Kentucky, Virginia, and Tennessee have the highest African American felo-ny disenfranchisement rates. Florida’s rate among vot-ing-age African Americans is 23 percent, while Ken-tucky’s is 22 percent, Virginia’s is 20 percent, and Ten-nessee’s is 19 percent. In each of these four states, the overall felony disenfranchisement rate of voting-age adults is also high at 10.4, 7.4, 7.3, and 7.1 percent, respectively.
High Imprisonment Rates Take a Toll on Communities
Figure 6. Incarceration Costs by Zip Code, Houston, 2008
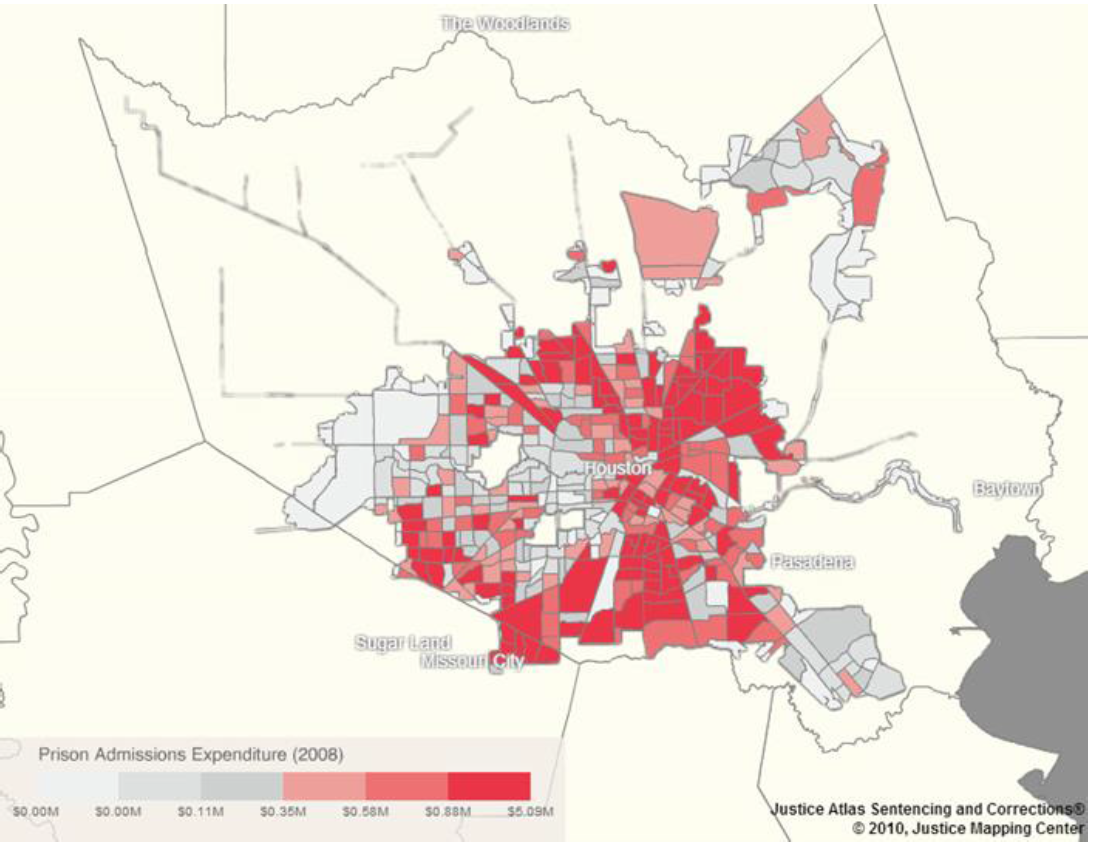
Source: Justice Mapping Center.
Urban communities face both civic costs and significant economic costs because of their members’ felony disenfran-chisement. The prison population comes disproportionately from poorer neighborhoods;11 as a result, some poor neigh-borhoods have what researchers call “million-dollar blocks,” referring to the amount of money the government spends annually incarcerating individuals. Moreover, the families in these communities lose the economic and social support of those who have been incarcerated.12
The Justice Mapping Center used prisoners’ pre-incarceration residential information to create a visual representation of these million-dollar blocks in several metropolitan areas. Figures 6 and 7 show Houston and New York City as examples of two cities in different regions of the country. In both, Hispanics are the largest share of low-income men; in Houston, they are the majority. The maps display state costs to send their residents to prison in 2008 by zip code. The most expensive zip codes are concen-trated in certain sections of each city. In almost all these neighborhoods, about half the households have annual in-comes less than $25,000 and almost all households are nonwhite or Hispanic. The cost of imprisonment and asso-ciated expenditures in these areas can be as high as $28.6 million, according to the Justice Mapping Center.
Figure 7. Incarceration Costs by Zip Code, New York City, 2008
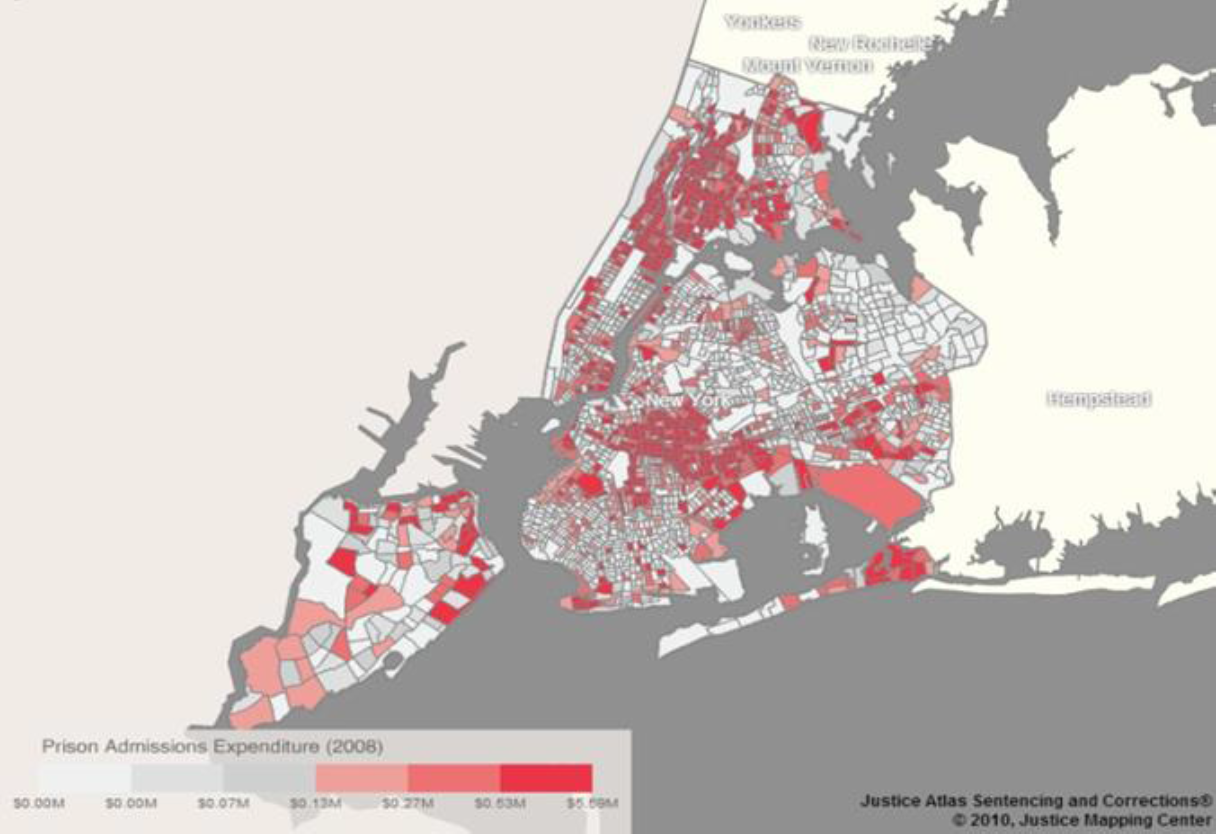
Source: Justice Mapping Center.
The costs detailed above, though notable, skim the sur-face of the true cost of imprisonment. Not included in these estimates are the opportunity costs in lost wages or human capital development, the future economic burden from a felony record, and the economic echo effect on the prison-er’s children, including the more difficult to quantify mental and societal burdens placed on families and communities.
Conclusion
Statistics on prisoners do not allow us to determine how disproportionately low-income men are imprisoned, but data on imprisonment by race and ethnicity provide a stark picture of the extent of disparities. Since African American and Hispanic men are more likely to be low income, this perspective gives some sense of the impact of being low income on encounters with the most punitive part of the criminal justice system: incarceration (McDaniel et al. 2013). Data presented here show increasing life chances for young men in these groups to be imprisoned—differentials that continue earlier trends by race.
Imprisonment also affects whether these men are able to participate fully in civic life after returning to society. In addition, the highly variable state-disenfranchisement rates in the United States show how geography can shape the lives of low-income men in this domain. It also affects the communities in which the prisoners live and society at large. Men of color, men without high school degrees, and men living in states with strict felony disenfranchisement laws are most affected by the criminal justice system.
Notes
- In 2010, the year for the data estimates, the federal poverty threshold was $11,344 for a single adult and $17,552 for a family of three with one child. Twice the poverty level was $22,688 for a single adult and $35,104 for a family of three (http://www.census.gov/hhes/www/poverty/data/threshld/).
- See “Mass Incarceration,” Christopher Wildeman, Oxford Bibliographies, accessed September 25, 2013, http://www.oxfordbibliographies.com/view/document/obo-9780195396607/obo-... Raphael and Stoll (2013); and US Department of Justice (2013). In a speech to the American Bar Association on August 12, 2013, Attorney General Eric Holder made reference to the Justice Department review and the reasons for it.
- African American refers to non-Hispanic African American or black and includes those who identified themselves as black or African American only. White refers to non-Hispanic white and includes those who identified themselves as white only. People of Hispanic origin may be of any race. Respondents who identified as other or two or more races are grouped under “Other non-Hispanic.”
- The imprisonment rate is the number of prisoners under state or federal jurisdiction with a sentence of longer than a year per 100,000 US residents (Carson and Sabol 2012).
- The Bureau of Justice Statistics reports numbers for age 18–19 and then in five-year increments (e.g., 20–24, 25–29, 30–34) until age 64, with a last category for age 65 and older.
- Bonczar (2003) analyzed data between 1974 and 2001. Comparable data to estimate first incarceration rates were not available before 1974.
- See Chung (2013). Disenfranchisement is not the only collat-eral consequence of incarceration; denial of welfare and housing benefits, and the fracturing of families and communities also result. For more on these consequences, see Mauer and Chesney-Lind (2002).
- http://www.sentencingproject.org/map/map.cfm#map, The Sentencing Project, accessed August 2012.
- See Uggen and colleagues (2012) for list of states. Some states do allow individuals to petition for restoration of voting rights, but these petitions do not change the pattern significantly. Virginia requires a five-year waiting period for violent crimes and some drug offenses before an ex-felon can petition for restoration of voting rights. As of July 1, 2013, the state will no longer require a two-year waiting period for nonviolent crimes (Chung 2013).
- Data on felon disenfranchisement include all prisoners, male and female.
- Pettit and Western (2004) document differences by education and race. See also the Justice Mapping Center (http://www.justicemapping.org/home/) and the Justice Atlas (http://www.justiceatlas.org/).
- Johnson (2009) documents the consequences for children of incarcerated parents.
References
Bonczar, Thomas. 2003. “Prevalence of Imprisonment in the US Population, 1974-2001.” NCJ 197976. Washington, DC: US De-partment of Justice, Office of Justice Programs, Bureau of Justice Statistics.
Carson, E. Ann, and William J. Sabol. 2012. “Prisoners in 2011.” NCJ 239808. Washington, DC: US Department of Justice, Office of Justice Programs, Bureau of Justice Statistics.
Chung, June. 2013. “Felony Disenfranchisement: A Primer.” Washington, DC: The Sentencing Project. http://www.sentencingproject.org/doc/publications/fd_Felony%20Disenfranc....
Guerino, Paul, Paige M. Harrison, and William J. Sabol. 2011. “Prisoners in 2010.” NCJ 236096. Washington, DC: US Depart-ment of Justice, Office of Justice Programs, Bureau of Justice Statistics.
Johnson, Rucker C. 2009. “Ever-Increasing Levels of Parental Incarceration and the Consequences for Children,” In Do Pris-ons Make Us Safer? The Benefits and Costs of the Prison Boom, edited by Steven Raphael and Michael Stoll (177–206). New York: Russell Sage Foundation.
Mauer, Marc, and Meda Chesney-Lind. 2002. Invisible Punish-ment: The Collateral Consequences of Mass Imprisonment. New York: The New Press.
McDaniel, Marla Margaret Simms, Karina Fortuny, and William Monson. 2013. “A Demographic Snapshot of Disconnected Low-Income Men.” Race, Place, and Poverty Symposium Issue Brief 1. Washington, DC: The Urban Institute.
Pettit, Becky, and Bruce Western. 2004. “Mass Imprisonment and the Life Course: Race and Class Inequality in US Incarceration.” American Sociological Review 69 (April): 151–69.
Pew Charitable Trusts, The. 2010. “Collateral Costs: Incarcera-tion’s Effect on Economic Mobility.” Washington, DC: Pew Charitable Trusts.
Raphael, Steven, and Michael A. Stoll. 2013. Why Are So Many Americans in Prison? New York: Russell Sage Foundation.
Uggen, Christopher, Sarah Shannon, and Jeff Manza. 2012. State-Level Estimates of Felon Disenfranchisement in the United States, 2010. Washington, DC: The Sentencing Project.
US Department of Justice. 2013. Smart on Crime: Reforming the Criminal Justice System for the 21st Century. Washington, DC: US Department of Justice. http://www.justice.gov/ag/smart-on-crime.pdf.
About the Series
A large number of US men of prime working age are neither gainfully employed nor pursuing education or other training, suggesting a potentially significant disconnection from mainstream economic and social life. The Urban Institute, funded by the Office of the Assistant Secretary for Planning and Evaluation, US Department of Health and Human Services, convened the Race, Place, and Poverty symposium to better understand the experiences of men who were disengaged or at high risk of disengagement from mainstream economic and social systems. The symposium explored the state of knowledge on discon-nected low-income men and discussed effective strategies for improving their well-being.
The five briefs in this series on disconnected low-income men summarize the symposium, provide a geographic and demographic snapshot of low-income men, and examine their education, employment, health, and heightened risk of incarceration and disenfranchisement. A related background paper prepared for the symposium features key themes from ethnographic and other qualitative research.
Acknowledgments
We would like to extend a special thank you to the HHS staff for their commitment to this project and for making this work possible; in particular, we acknowledge the federal project officers, Annette Waters and Kimberly Clum. We are also grateful to Kendall Swenson for his work with the data and to Erica Meade for her contributions.
We thank Vivian Gadsden, Waldo Johnson, and Thomas LaVeist for serving as consultants on the project and for their invaluable contributions to this report series and the symposium. We also gratefully acknowledge key advisor Jocelyn Fon-taine and other Urban Institute colleagues Gregory Acs, Bob Lerman, and Elizabeth Peters for their assistance and feedback. Finally, we give special thanks to the researchers and social service providers from across the country who participated in the symposium, and whose knowledge about low-income men enriched this work.