
TASK ORDER NO. HHSP23337007T
CONTRACT NO. HHSP23320095634WC
Submitted to:
Hui-Hsing Wong
Amber Jessup
U.S. Department of Health and Human Services
Assistant Secretary of Planning and Evaluation (ASPE)
200 Independence Avenue, SW
Washington, DC 20201
Submitted by:
Aylin Sertkaya
Anna Birkenbach
Ayesha Berlind
John Eyraud
Eastern Research Group, Inc.
110 Hartwell Avenue
Lexington,
MA 02421
www.erg.com
Pharmaceutical companies conduct clinical trials for many reasons. The most obvious goal of clinical trials is to demonstrate safety and efficacy to gain Food and Drug Administration (FDA) approval. FDA provides guidance to developers about what constitutes acceptable clinical trials and appropriate outcomes. Improving the drug development process, especially by conducting better (meaning providing more information on safety or efficacy) and faster clinical trials, can foster innovation in medical product development.
The primary purposes of this study: 1) to better understand sponsors' strategies in the design and execution of clinical trials, 2) to identify factors that may delay, hinder, or lead to unsuccessfully completed trials, and 3) to develop an operational model of clinical trial decision-making to enable examination of what-if scenarios by end-users.
This study models the decision-making process for a drug sponsor as a stylized decision tree that looks at the process for formulating a clinical trial from the point of view of an expected-revenue-maximizing sponsor in the face of uncertainty (or risk). The simplified clinical decision-making model incorporates the following considerations:
- Therapeutic area
- Potential market size/revenues for the drug
- Clinical stage
- Success probabilities by clinical stage
In addition to identifying the costs of the clinical trials, the following barrier mitigation strategies were analyzed:
- Use of electronic health records (EHR)
- Looser trial enrollment restrictions
- Simplified clinical trial protocols and reduced amendments
- Reduced source data verification (SDV)
- Wider use of mobile technologies, including electronic data capture (EDC)
- Use of lower-cost facilities or at-home testing
- Priority Review/Priority Review vouchers
- Improvements in FDA review process efficiency and more frequent and timely interactions with FDA
Overall, the therapeutic area with the highest clinical research burden across all phases is respiratory system ($115.3 million) followed by pain and anesthesia ($105.4 million) and oncology ($78.6 million) trials. Use of lower-cost facilities/in-home testing and wider use of mobile technologies appear to be most effective in reducing costs across therapeutic areas and trial phases. Use of lower-cost facilities and/or in-home testing can reduce per-trial costs by up to $0.8 million (16 percent) in Phase 1, $4.3 million (22 percent) in Phase 2, and $9.1 million (17 percent) in Phase 3, depending on therapeutic area.
"Acknowledgments
We gratefully acknowledge Hui-Hsing Wong (ASPE) and Amber Jessup (ASPE) for their leadership, guidance, and input throughout this study. We also would like to thank Patrick Archdeacon (FDA) and Trini Beleche (FDA) for their insightful comments and advice. Medidata Solutions provided the data for the analysis of clinical trial costs. We would like to thank Lori Shields, Frank Cattie, Rafael Campo, and Joshua Hartman at Medidata Solutions for accommodating our data requests and answering our questions.
We also would like to acknowledge the contributions of our subject matter experts, Michael Silverman, Sheldon Brookman, and David Bristol (independent consultants to ERG) to formulating our interview questions and the clinical trial decision-making parameters.
Many people involved in clinical research, including pharmaceutical/biopharmaceutical company representatives, CRO personnel, and industry experts, provided valuable information for the study. We are grateful to all of them for sharing their expertise and experiences with us.
DISCLAIMER
This report was prepared by ERG, under contract to the Assistant Secretary for Planning and Evaluation. The findings and conclusions of this report are those of the author(s) and do not necessarily represent the views of ASPE, FDA or HHS
List of Acronyms
Acronym Meaning
Executive Summary
E.1 Clinical Trial Decision-making Model
- Therapeutic area,
- Potential market size/revenues for the drug, and
- Clinical stage (Phase 1, Phase 2, Phase 3, and Phase 4) costs that are dependent on a variety of factors, including but not limited to:
- Physician and nursing (RN) costs;
- Number of patients needed for the desired statistical precision;
- Number of Institutional Review Boards (IRBs) involved;
- Number of investigator sites;
- Cost of clinical data collection, management, and analysis; and
- Cost of clinical procedures.
- Success probabilities by clinical stage
The decision tree adapted from Damodaran (2007) specifies the phases (1 through 4), the development revenue/cost at each phase, success/failure probability for each phase, and the marginal returns associated with each step. Since it takes time to go through the different phases of development, there is a time value effect that is built into the expected returns computation. In the model, we compute the expected net present value at the decision point by working backwards through the tree.
E.2 Analysis of Costs
The model uses detailed cost information made available by Medidata Solutions, a global provider of cloud-based solutions for clinical research in life sciences. The cost information is specific to the U.S. and presented by therapeutic area and clinical trial phase. Key findings with respect to costs include the following:
- Overall, the therapeutic area with the highest average per-study costs across Phases 1, 2 and 3 is pain and anesthesia ($71.3 million) followed by ophthalmology ($49.9 million) and antiinfective ($41.3 million) trials. Conversely, trials in dermatology, endocrinology, and gastroenterology have the lowest overall costs across the same three phases.
- Average per-study costs across all therapeutic areas increase as clinical development proceeds from Phase 1 to Phases 2 and 3. Average Phase 4 study costs are equivalent to those of Phase 3 costs but are much more variable across different therapeutic areas than Phase 3 costs.
- Overall, the factors that contribute the most to costs across all trial phases include Clinical Procedure Costs (15 to 22 percent), Administrative Staff Costs (11 to 29 percent), Site Monitoring Costs (nine to 14 percent), Site Retention Costs (nine to 16 percent), and Central Laboratory Costs (four to 12 percent).
E.3 Barriers to Clinical Trials
E.3.1 High Financial Cost
- Studies estimate that it now costs somewhere between $161 million and $2 billion to bring a new drug to market.
- The aging of a larger segment of the population has resulted in a shift to chronic and degenerative disease research and an ensuing increase in development costs. Nonetheless, many companies pursue drugs for chronic diseases to have a large and steady revenue stream. Drugs for shorter-term conditions are less attractive to drug sponsors and their investors because it is less likely that the high costs of development will be recouped through revenues and earn a profit.
E.3.2 Lengthy Timelines
- According to one study, the average length of time from the start of clinical testing to marketing is 90.3 months (7.5 years).
- Longer timelines increase costs and decrease revenues.
- Longer studies are needed to see if any safety issues arise when drugs are taken long-term to manage chronic diseases.
- The “one-off” nature of trial organization protracts trial initiation timeframes.
- The clinical trial business model has not kept pace with potential for efficiency gains through technological advances or centralized coordination.
E.3.3 Difficulties in Recruiting and Retaining Participants
- Patient recruitment requires a substantial investment of time and money.
- Failure to recruit can cause costly delays or trial cancellation, wasting resources.
- There is competition for limited patient pools for certain conditions, such as rare cancers and multiple sclerosis.
- Clinical trial sites are often selected based on the location of investigators rather than patients.
- Knowledge, attitudes, and incentives of potential participants and their physicians hinder participation.
E.3.4 Increasing Competition for Qualified Investigators and Sites
- According to some, there is a shortage of biostatisticians and informaticists across academic medicine, industry, and government; others say researchers exist but are difficult to find, often due to competition. There is more widespread agreement that there is a shortage of investigators who can enroll high-quality patients. There is also competition for qualified sites, especially in popular therapeutic areas.
- The rate of attrition among U.S. investigators is increasing.
- The clinical investigator career track is unattractive to researchers.
- It is difficult for new sites to attract business, as sponsors tend to use clinical research organizations (CROs) they know.
- For specialized areas such as anti-fungals, sponsors may have a very small number of qualified investigators to choose from.
E.3.5 Regulatory and Administrative Barriers
- U.S. regulations pertaining to clinical research could benefit from revisions. They were written at a time when the clinical trials enterprise was smaller and before multicenter trials became common.
- Ethical / Institutional Review Board (IRB) Approval (21 CFR 56)
- There is often a lack of clarity regarding the roles and responsibilities of various oversight bodies and what is expected of investigators.
- If the IRB process results in a request for changes to a trial, investigators may lack the resources to fulfill the request.
- Regulations vary by geographic location.
- Informed Consent (21 CFR 50) – The process of obtaining informed consent from trial participants is lengthy.
- Patient Privacy: U.S. Health Insurance Portability and Accountability Act (HIPAA) (45 CFR Part 160 and Subparts A and E of Part 164) – HIPAA requires patient authorization to use their health information for research. There are severe penalties for violating HIPAA, so IRBs enforce compliance. One result of HIPAA and other privacy laws is that site investigators are reluctant to attempt to contact patients to follow up on major outcomes if the patient drops out. This in turn reduces statistical power.
- Regulations Governing Clinical Trial Conduct – Regulations governing the conduct of clinical trials were devised when trials were smaller and involved fewer sites.
- Regulations Governing Serious Adverse Events (SAEs) Reporting for Investigational New Drugs and Biologics (INDs) (21 CFR 312) – In the past, FDA and investigators in multicenter trials have been flooded with expedited reports of serious adverse events which lack sufficient context from the aggregate data to be interpretable. A new safety reporting regulation (effective March 2011) may remedy this problem, but it is too early to tell.
- Regulations for Multiple Jurisdictions – Local, regional, national, and international regulations/guidances are numerous and not always well harmonized.
- Inadequate Clarity/Consistency/Practicality in FDA Guidance
- Delays can be caused by differing interpretations of regulations by the various parties involved in multicenter trials.
- Guidance is lacking for newer therapeutic areas or classes.
- In disease areas where guidelines are nonexistent, old, or otherwise lacking, sponsors find it difficult to understand FDA expectations before beginning their studies.
- FDA is understaffed and underfunded and the available resources end up being overtaxed.
E.3.6 Drug Sponsor-Imposed Barriers
- Excessive risk-aversion leads to unnecessary steps being taken.
- In multicenter trials, uncertainty and inconsistent enrollment success across sites creates a need to over-enroll and plan trials “defensively.”
- Internal review processes for organizations conducting/sponsoring clinical trials can delay a trial’s start.
- In trying to create a pure scientific experiment (to maximize likelihood of drug approval), sponsors may restrict enrollment using extensive eligibility criteria that may exclude, for example, people on other medications or with comorbidities. These constraints on enrollment make it even more difficult to find a sufficient number of participants and protract the recruiting process.
- Industry sponsors generally do not involve site investigators in the protocol design process, so the required procedures may not be easily integrated into clinical practice at the sites.
- Clinical trial protocols are increasingly complex (with more assessments, exploratory endpoints, biomarkers, biopsies, etc.), increasing the administrative burden of trials.
- More complex Case Report Forms (CRFs) including many data points can significantly increase trial monitoring costs.
- Sponsors unnecessarily collect data that may not even be relevant to the specific study.
- The lack of standardized CRFs and trial procedures across study sites can result in improperly conducted procedures or inadequate data collection at some sites.
- According to a Tufts Center for the Study of Drug Development (CSDD) study, nearly 60 percent of all trial protocols require amendments, a third of which are avoidable.
- Industry-sponsored trials are generally monitored through site visits that take place at intervals defined by standard operating procedures or study-specific monitoring plans. It is common practice to conduct site visits frequently, and source data verification (SDV) is a time-consuming part of these visits.
- Legal advisors have traditionally encouraged sponsors to be conservative in their reporting of unexpected SAEs (at least prior to March 2011, when a new drug safety reporting regulation was implemented).
E.3.7 Disconnect Between Clinical Research and Medical Care
- Community physicians are largely uninvolved in the clinical research process.
- Many healthcare professionals do not receive training in research methods.
E.3.8 Barriers at Academic Institutions
- Sponsors might be compelled to select academic centers as sites due to the presence of key opinion leaders or specific patient populations.
- Ethical and Regulatory Requirements
- Academic institutions can take their responsibility to provide ethical and regulatory oversight to extremes and create excessive barriers to conducting clinical trials.
- One study found that the average number of steps necessary to open a clinical trial at academic centers was over 110, in contrast to fewer than 60 steps at non-academic centers.
- Low Priority of Clinical Research in Academic Institutions
- Many academic medical centers undervalue or fail to incentivize clinical research.
- Fundamental principles of clinical research are not included in academic medical curricula at the graduate or undergraduate level.
- Those studying to be physicians are not adequately trained to interpret clinical trial results, impairing their ability to use such results to inform their clinical care and practice evidence-based medicine. For example, in a survey of 367 residents only 37.4 percent knew how to interpret an adjusted odds ratio from a multivariate regression analysis.
E.3.9 Barriers Related to the Globalization of Clinical Research
- The clinical research footprint is shifting overseas.
- There are a number of factors, including cost savings and shorter timelines, driving this shift and making it cheaper and easier to conduct trials outside the U.S.
- Ethical and scientific concerns may arise when conducting studies in other countries.
- Conducting trials at multiple sites across different countries magnifies the barriers associated with multicenter trials.
E.4 Analysis of Barriers to Clinical Trials
- Use of electronic health records (EHR)
- Looser trial enrollment restrictions
- Simplified clinical trial protocols and reduced amendments
- Reduced source data verification (SDV)
- Wider use of mobile technologies, including electronic data capture (EDC)
- Use of lower-cost facilities or at-home testing
- Priority Review vouchers
- Improvements in FDA review process efficiency and more frequent and timely interactions with FDA
Our analysis suggests that priority review vouchers and improvements in FDA review efficiency can help to shorten timelines, which in turn increase the expected net present value (eNPV) to the drug sponsor. Because these options affect the final stage of clinical research (mainly NDA/BLA approval), heir overall dollar value for a sponsor at the start of clinical research is much lower due to discounting. Therefore, holding everything constant, these options may be less appealing as strategies to stimulate drug development than alternatives which substantially lower costs early on in the clinical research process. Use of lower-cost facilities/in-home testing and wider use of mobile technologies appear to be most effective in reducing costs across therapeutic areas and trial phases. Use of lower-cost facilities and/or inhome testing can reduce per-trial costs by up to $0.8 million (up to 16 percent of cost per study) in Phase 1, $4.3 million (up to 22 percent of cost per study) in Phase 2, and $9.1 million (up to 17 percent of cost per study) in Phase 3, depending on therapeutic area. Wider use of mobile technologies can result in very similar maximum savings; $0.4 million (up to eight percent of cost per study) in Phase 1, $2.4 million (up to 12 percent of cost per study) in Phase 2, $6.1 million (up to 12 percent of cost per study) in Phase 3, and $6.7 million (up to 13 percent of cost per study) in Phase 4. On the other hand, loosening trial enrollment restrictions and reducing SDV efforts have smaller impacts on costs, resulting in maximum savings of less than $0.1 million to $0.2 million per trial, representing approximately one percent of perstudy costs in Phases 2 and 3.
1 Introduction and Background
In calendar year 2012, Food and Drug Administration (FDA) Center for Drug Evaluation and Research (CDER) approved 39 novel new drugs (i.e., new molecular entities (NMEs) and new biological entities (NBEs), including both novel drugs and biologics).1 While 39 approvals marks the highest number of NMEs/NBEs approved since 2004, drug companies are not filing as many applications with FDA for new drug approvals as they have in the past. Over the past 10 years (2003 to 2012), the number of NME/NBE approvals per year has fallen from the previous decade’s average of 30 to 25.7 (see Figure 1). The average yearly number of NME/NBE filings has also fallen slightly over the same time period. A reduction in the drug application pipeline means fewer novel therapies in future years.
Figure 1: New Molecular Entity (NME) and New Biologic Entity (NBE) Filings and Approvals
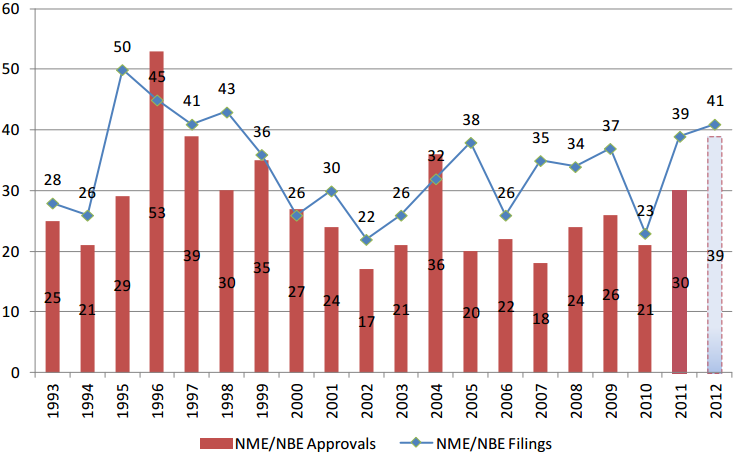
Source: (U.S. Food and Drug Administration, 2013; Jenkins J. K., 2011) Notes: CDER data as of 11/30/2012. Since applications are received and filed throughout a calendar year, the filed applications in a given calendar year do not necessarily correspond to an approval in the same calendar year. Certain filed submissions are within their 60-day filing review period and may not be filed upon completion of the review.
In 2004, to help drive new drug development and increase applications for novel new products, FDA launched its Critical Path Initiative, a strategy to help advance pharmaceutical innovation. Further, in 2011, Secretary Sebelius identified as one of the priority goals of the HHS, “accelerating the process of scientific discovery to patient care,” which includes building a national network of clinical research centers to enable clinical trials of promising compounds.
Developing a new drug is a costly endeavor and the ever-increasing cost of clinical research is often cited as one of the main reasons for the slowdown in FDA application filings. It takes approximately 10 to 15 years to bring a new drug from the laboratory to the pharmacy shelf (English, Lebovitz, & Giffin, 2010). During the initial years of non-clinical testing, the sponsor completes synthesis and purification of the drug and conducts limited animal testing. Approximately one out of one thousand compounds in preclinical testing appears promising enough to induce the sponsor to file an Investigational New Drug (IND) application (Eisenstein, et al., 2004). If the FDA reviews the IND and determines that it is reasonably safe to proceed, the sponsor then initiates the first phase of clinical research.
The clinical drug development stage consists of three phases. In Phase 1, clinical trials using healthy individuals are conducted to determine the drug’s basic properties and safety profile in humans. Typically, the drug remains in this stage for one to two years (DiMasi, Hansen, & Grabowski, 2003). In Phase 2, efficacy trials2 begin as the drug is administered to volunteers of the target population. At the end of Phase 2, the manufacturer meets with FDA officials to discuss the development process, continued human testing, any concerns the FDA may have, and the protocols for Phase 3, which is usually one of the most extensive and expensive parts of drug development. According to one source, mean phase lengths are 21.6 months (1.8 years) for Phase 1, 25.7 months (2.1 years) for Phase 2, and 30.5 months (2.5 years) for Phase 3 (DiMasi, Hansen, & Grabowski, 2003). Once Phase 3 is complete, the manufacturer files a New Drug Application (NDA). The period between completion of Phase 3 and drug approval typically lasts one to two years; including six to 10 months for the NDA review itself (or more if the drug is not approved after the first review). Toward the end of the NDA review stage, FDA and the drug sponsor meet with an advisory committee made of experts to present data and solicit advice on drug safety, effectiveness, and labeling. Once approved, the drug may be marketed in the U.S. with FDAregulated labeling (Lipsky & Sharp, 2001). Sometimes additional studies are conducted following FDA approval, during general use of the drug by medical practitioners. These studies are referred to as Phase 4 studies in this study but are also known as post-marketing studies (Lipsky & Sharp, 2001).
The increasing cost of clinical research has significant implications for public health as it affects drug companies’ willingness to undertake clinical trials. Some researchers (Collier, 2009) argue that the rising clinical trial costs have made the industry as a whole more risk averse and less willing to take chances on novel medicines. Many drug companies are now conducting clinical trials in other countries, such as China and India, where costs can be as much as 60 percent lower. Clinical research centers are also more closely scrutinizing the types of clinical trials they will take on, with the fear that certain projects could put the center in a deficit (Collier, 2009). To increase clinical trial efficiency and reduce costs, companies have been looking at establishing effective surrogate endpoints3—as opposed to clinical endpoints, which take longer and are more difficult to monitor—to assess failures before moving to costly Phase 3 trials. They are also looking for ways to move more rapidly to electronic data capture (EDC). To improve the recruitment process, drug companies are also investigating the use of genetic markers as a way of screening who the product is most likely to be effective with and who is likely to have significant side effects before accepting human subjects into studies.
Clinical trials can be sponsored by a variety of organizations, including industry, government agencies such as the National Institutes of Health (NIH), universities, and clinical research networks. Drug companies conduct clinical trials for a variety of reasons, including demonstrating safety and efficacy for new compounds, expanding the list of indications for previously approved compounds, improving market position by demonstrating superiority to other existing compounds, increasing the amount of safety and efficacy evidence for payer reimbursement, among other things.
This study examines the decision-making process for those clinical trials that are:
- Designed to demonstrate safety and efficacy for new compounds, and
- Sponsored by industry.
The primary objectives of the study are: 1) to better understand sponsors’ strategies in the design and execution of clinical trials, 2) to identify factors that may delay, hinder, or lead to unsuccessfully completed trials, and 3) to develop an operational model of clinical trial decision-making to enable examination of what-if scenarios by end-users.
1 The number represents applications for New Molecular Entities (NMEs) filed under New Drug Applications (NDAs) and therapeutic biologics filed under original Biologic License Applications (BLAs).
2 According to a technical review prepared for the Agency for Healthcare Research and Quality (AHRQ), the distinction between efficacy and effectiveness trials is defined as follows: “Efficacy trials (explanatory trials) determine whether an intervention produces the expected result under ideal circumstances. Effectiveness trials (pragmatic trials) measure the degree of beneficial effect under “real world” clinical settings” (RTI International, 2006).
3 While clinical endpoints are target outcomes that are measured directly (such as deaths), surrogate endpoints are intended to show the effect of the drug on a physiologic process or marker that is strongly correlated with a particular disease. For instance, CD4 cell counts might be used to assess the effectiveness of an antiviral medication in treating patients with human immunodeficiency virus (HIV) (Lipsky & Sharp, 2001).
2 Clinical Trial Decision-making Model
The existing literature on clinical trials primarily discusses the process of performing clinical trials—including statistical design issues and coordination problems among multiple centers and disciplines—and results, but few sources offer insights regarding the decision process of the sponsor (Hammons, Hilman, Kahan, & Neu, 1985). From the perspective of a drug sponsor operating under uncertainty, we postulate that the decision to undertake a clinical trial to demonstrate safety and efficacy is likely influenced by a variety of factors including:
- Potential market size for the drug, which in turn depends on:
- Type of condition(s) (acute versus chronic, severity) the drug would treat;
- Size of the patient population (current and future);
- Number of existing drugs currently on the market that treat the same condition(s) and advances in treatment;
- Existing incentives, such as the Orphan Drug Act, and fast track FDA review that affect how quickly the drug can be brought to market and offer financial incentives;
- Clinical stage (Phase 1, Phase 2, and Phase 3) costs that are dependent on a variety of factors, including but not limited to:
- Patient accrual rates that depend upon selection criteria, the relative ease of screening eligible patients, and physician interest;
- Administrative, physician, registered nurse (RN), and clinical research associate (CRA) capacity (i.e., number of protocols per RN/physician, number of patients per RN/physician);
- Number of patients needed for the desired statistical precision;
- Number of protocols;
- Number of institutional review boards involved;
- Number of investigator sites and their locations;
- Cost of clinical data collection, management, and analysis;
- Technologies for data collection and verification;
- Projected manufacturing costs upon FDA approval which would be influenced by whether the drug is a small molecule or a biologic.
The decision process for pursuing a clinical trial is also likely to vary by type of sponsor. A large established pharmaceutical company with deep pockets may be less risk averse and better positioned to undertake costly clinical trials whereas a small emerging company may find it difficult to allocate funding to clinical research, especially if the trials require a large patient population and multiple sites.
Further, some of the clinical trial pathway formulation decisions, such as which indication within a therapeutic category to target and how to time/sequence the trials, are inextricably linked to business realities. Research objectives coupled with financial circumstances can force a sponsor down a specific clinical trial pathway. For example, large established pharmaceutical companies often try to allocate resources based on the research portfolio and the potential to market the product. In contrast, small companies can be focused on whether they can finance the development and up to what point. Small companies are also often subject to results pressures from their investors, which can lead to inappropriate or “short-cut” development approaches.
The approach adopted in this study looks at the decision process from the point of view of an expected-revenue-maximizing sponsor in the face of uncertainty (or risk). As described in the following sections, the simplified clinical decision-making model incorporates the following considerations:
- Therapeutic area,
- Potential market size/revenues for the drug, and
- Clinical stage (Phase 1, Phase 2, Phase 3, and Phase 4) costs that are dependent on a variety of factors, including but not limited to:
- Physician and RN costs;
- Number of patients needed for the desired statistical precision;
- Number of IRBs involved;
- Number of investigator sites;
- Cost of clinical data collection, management, and analysis; and
- Cost of clinical procedures.
- The following sections describe the data sources used (Section 2.1) in constructing the model, the conceptual framework (Section 2.2), the operational model (Section 2.3), and the model parameters (Section 2.4) in further detail.
2.1 Data Sources
In constructing an operational model of clinical trial decision-making, we compiled information from a variety of sources, including:
- Publically available literature;
- Interviews with experts, FDA personnel, drug sponsors, clinical research organizations (CROs) as well as major academic clinical research centers;
- April 2012 FDA public hearing on the subject of Modernizing the Regulation of Clinical Trials and Approaches to Good Clinical Practice;
- Medidata Solutions databases;
- Medidata Grants Manager® (PICAS® )
- Medidata CRO Contractor® (CROCAS® )
- Medidata Insights™
More information on the above data sources are provided below
2.1.1 Publically Available Literature
Although the literature on the early stages of the pharmaceutical decision-making process is not extensive, there is some research that has characterized the process. We used this information to help define the components of the model. Some examples are the work performed at the Massachusetts Institute of Technology (MIT) Center for Biomedical Innovation and the Clinical Trials Transformation Initiative (CTTI), a public-private partnership organization hosted by Duke University.4
Our literature search targeted several categories of literature: peer-reviewed articles in scientific journals, unpublished papers and presentations, white papers, gray literature, and news stories and occasional pieces appearing in newspapers and magazines or other print media outlets. Our search methodology featured systematic inquiries of the following databases:
- PubMed for peer-reviewed healthcare and biomedical journals;
- Lexis/Nexis academic for mass media and other periodical publications; and
- PAIS, Scopus, Web of Knowledge, and Embase for gray literature.
The search strategies differed for each category of literature and related database, but each query employed search terms in various combinations using logic strings, such as “clinical trial AND cost*,” “barrier* AND clinical trials,” “phase 1 clinical trial* AND cost*,”etc.
4 CTTI comprises more than 60 organizations from across the clinical trial enterprise. Members include representatives of government agencies (the FDA, Centers for Medicare and Medicaid Services, Office of Human Research Protections, National Institutes of Health (NIH), and other national and international governmental bodies), industry representatives (pharmaceutical, biotechnology, device, and clinical research organizations), patient advocacy groups, professional societies, investigator groups, academic institutions, and other interested parties (Clinical Trials Transformation Initiative (CTTI), 2011).
2.1.2 Discussions with Experts, FDA Personnel, Drug Sponsors, Contract Research Organizations (CROs), and Academic Clinical Research Centers
Some of the information needed to characterize the decision process of a drug sponsor came from semi-structured discussions with our team of experts and other industry experts, FDA personnel, drug sponsors, CROs, and primary clinical research centers, including University of Massachusetts, Johns Hopkins University, University of Michigan, and the Mayo Clinic.
As the decision process varies between pharmaceutical and biotechnology companies as well as small and large firms, we interviewed representatives from these sectors and company sizes. We limited the number of interviews involving the same set of questions to fewer than 10. In total, we interviewed representatives from four small pharmaceutical/biotechnology companies; two large pharmaceutical/biotechnology companies; two CROs; and three independent expert consultants in addition to our team of experts. The expertise of those interviewed covered a wide range of therapeutic areas, including arthritis/pain/inflammatory diseases, cardiology, gastroenterology, immunology, metabolic diseases, ophthalmology, oncology, and infectious diseases. Of the six pharmaceutical/biotechnology companies interviewed, three had only a single U.S. office, while the other three had offices in multiple countries, which, in combination, span six continents.
We first emailed potential participants a cover letter explaining the purpose of the study and encouraging participation in our interviews. Almost everyone contacted for the study agreed to be interviewed. Next, we scheduled interviews with those who responded and were willing to participate. Appendix A presents the protocol used in these interviews. In general, the questions asked in each interview were targeted to the background of the interviewee, but most interviewees were asked about all three topic areas (the clinical trials decision-making process, barriers, and costs).
From these interviews, we collected information about how sponsors make the decision to move forward with the development of a new drug, the significance (in the respondents’ opinion and experience) of various cost components and barriers mentioned in the literature, and the types of changes they would advocate to address what they perceive as the most problematic barriers to conducting clinical trials in the U.S. This information helped us refine our model and was also used to more fully characterize the barriers to clinical trials and develop a list of potential barrier mitigation strategies.
In addition to our interviews with industry representatives, we also spoke with individuals involved in CTTI and the MIT Center for Biomedical Innovation (as noted earlier; specifically, the New Drugs Development Paradigm project). These groups are working to enhance the drug development process through joint research with stakeholder groups in the public and private sectors.
2.1.3 Medidata Solutions Databases
We used three proprietary databases on clinical trial costs, which are offered by Medidata Solutions, a global provider of cloud-based solutions for clinical research in life sciences, as part of the broad set of solutions available through the Medidata Clinical Cloud™:
- Medidata Grants Manager® (PICAS® database) – PICAS provides industry-wide negotiated site cost information. It is a database of negotiated investigator grants—it includes more than 250,000 grants and contracts and 27,000 protocols in over 1,400 indications—that provides benchmarked costs typically used for clinical trial budget planning.
- Medidata CRO Contractor® (CROCAS® database) – The CROCAS database contains thousands of negotiated outsourcing contracts. It includes comprehensive data from CRO contracts—detailed across such dimensions as therapeutic area, phase, and geography.
- Medidata Insights™ – Medidata Insights is the turnkey clinical analytics solution that provides advanced visualization of clinical operational performance metrics alongside company and industry benchmarks. The Insights metrics warehouse is comprised of data from more than 7,000 studies gathered seamlessly from over 120 clinical trial sponsors.
We obtained custom aggregate tabulations from Medidata by therapeutic area, phase, and geography (domestic versus international) for the full range of cost elements associated clinical trials (averages as well as variances). Cost components included cost of IRB approvals, cost of protocols, patient recruitment costs, and administrative staff costs among others. Appendix B provides the Medidata data elements and their descriptions.
2.2 Conceptual Framework
The literature review and discussions described above served to inform the conceptual framework for our model. We modeled the clinical trials decision-making process in the form of a decision tree that looks at the decision process from the point of view of an expected-revenue-maximizing sponsor in the face of uncertainty (or risk).
To illustrate our approach to modeling clinical trial decision-making, we consider a highly simplified example adapted from Damodaran (2007)—the analysis of a New Molecular Entity (NME) for treating a hypothetical Indication X that has gone through preclinical testing and is about to enter Phase 1 clinical trials. Then we assume that we are provided with the following information (we explain the sources for this information in Section 2.4 below):
- Phase 1 trial is expected to cost $30 million and to require 100 participants to determine safety and dosage. The trial is expected to last one year and there is a 67 percent likelihood that the drug will successfully complete the first phase.
- Phase 2 involves testing the NME’s effectiveness in treating Indication X on 250 participants over a period of around two years. This phase is expected to cost $45 million and the agent will need to demonstrate a statistically significant impact on a number of clinical endpoints to move on to the next phase. There is only a 41 percent likelihood that the drug will prove successful in treating Indication X.
- In Phase 3, the testing will be expanded to 4,000 patients. The phase will last four years and cost $210 million, and there is a 55 percent likelihood of success.
- Upon completion of Phase 3, the sponsor will need to submit an NDA to FDA paying a user fee of $2 million and there is an 83 percent likelihood of being approved. The NDA submission decision will take one year.
- Given the size of the patient population and average wholesale price for similar drugs, the net revenue stream for the NME, if it is approved, is estimated at $973 million over 15 years.
- The cost of capital for the sponsor is 15 percent.
The decision tree for this NME can now be drawn, specifying the phases, the revenue at each phase, and their respective probabilities (see Figure 2). The decision tree depicted shows the likelihood of success at each phase and the marginal returns associated with each step. Since it takes time to go through the different phases of development, there is a time value effect that needs to be built into the expected returns computation for each path. The figure reflects the time value effect and computes the cumulative present value of returns from each path using the 15 percent cost of capital as the sponsor’s internal rate of discount. When time-discounted costs of conducting trials are subtracted from the present value of the returns, we are left with the net present value (NPV) of each possible outcome (Damodaran, 2007).
Figure 2: Drug Development Decision Tree Depicting Net Present Value (NPV) of Returns at Each Node
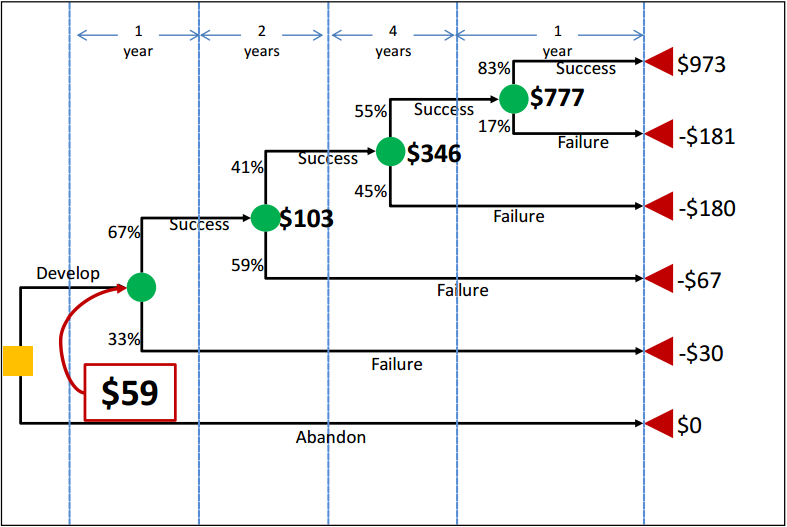
In Figure 2, the yellow square is the root decision node of interest. It is the point at which the revenue-maximizing sponsor is deciding whether or not to pursue development of the drug. The green circles (event/chance nodes) represent the possibility of success or failure at each phase, with the probabilities associated with each possibility appearing to the left of each branch. Finally, the red triangles are the end nodes. To the right of each end node is the NPV of that outcome to the sponsor. For example, if the drug completed all phases and successfully reached the market, the NPV of the cost and revenue streams would be $973 million in this scenario. By contrast, if the sponsor pushed forward with development but the drug failed at some point, the sponsor would incur the costs of the clinical trials without earning any revenues. Therefore, the other outcome nodes represent negative NPVs.
The dollar values appearing in bold next to the green chance nodes are calculated from right to left across the tree by multiplying the NPVs associated with each outcome by the probabilities of that outcome occurring. These dollar values thus represent the expected NPVs (eNPVs). For example, the eNPV at the start of the NDA/BLA review phase is equal to ($973 million × 83 percent) + (-$181 million × 17 percent), or $777 million. The $777 million can then be used to do the same calculation for the chance node at Phase 3, and so forth until the value at the first chance node can be calculated. This number, $59 million in this example, represents the eNPV to the sponsor of moving forward with the development project at the time when the decision is made to continue or abandon the new drug. This value reflects all of the possibilities that can unfold over time clearly depicting the sub-optimal choices that a revenue-maximizing sponsor should reject. The decision tree also characterizes the full range of outcomes, with the worst case scenario being failure in the NDA/BLA review stage to the best case scenario of FDA approval.
Phase 4 post-marketing studies, as described earlier, do not appear in Figure 2 as part of the decision tree because they do not play a role in determining which branch or outcome node a new drug ends up on in the same way that Phase 1, 2, and 3 trials do. In other words, they take place after the drug is approved (if they take place at all), and the consequences of success/failure in Phase 4 are not within the scope of this model. However, Phase 4 costs, if they occur, can be reflected in the values shown in the tree. The cost of these studies would be discounted back to the start of the project (in the same way all of the other costs are) and included in the branch representing successful completion of all prior phases and approval of the new drug. As Phase 4 studies occur post-approval, no costs associated with Phase 4 would be included on the other branches (on which the drug is not approved).
It is possible to examine the specifics of clinical trial formulation decisions in the context of this framework. For example, the availability of biomarkers for Indication X in the above example can decrease clinical trial costs by reducing the need to recruit large pools of patients and possibly reducing trial duration. Similarly, the use of adaptive designs can yield shorter and less expensive clinical studies.5 Both of these approaches can be evaluated with the use of the above framework by parameterizing (1) clinical trial event nodes so that costs associated with those events are scalable, and (2) clinical trial duration.
The model framework is also amenable to accommodate the changing cost of capital evaluations of the sponsor. For example, in the example scenario described above, it is possible that an NME will be approved for a secondary indication as well as a primary indication. If the drug is used to treat multiple conditions, it may be the case that the sales and expected returns will be more stable than they would be if the drug were only approved for a single indication. To reflect this anticipated increase in stability, the drug sponsor may determine that it is more appropriate to use a lower discount rate than otherwise expected.
Furthermore, in the context of the above basic framework, the barriers can be thought of as those factors that contribute to the cost of each event node and/or those that affect the probability of success. For example, a significant group of barriers to clinical trials are administrative. A study at the VanderbiltIngram Cancer Center and affiliated sites found that 17 to 30 major administrative steps were required to achieve approval of a clinical trial (Dilts & Sandler, 2006). All of these barriers result in increasing the cost of clinical trials, hence reducing the eNPV of drug development from the point of view of the drug sponsor. In the above model, alleviation of such barriers could be captured in the form of reduced clinical trial costs and possibly reduced duration.
5 One topic often discussed with adaptive designs is the use of seamless Phase 2/3 studies. Some Phase 2 studies are similar to subsequent Phase 3 studies. The time between Phase 2 and Phase 3 can be decreased by viewing the Phase 2 study as a segment of the Phase 3 study. Even though this reduces the time to submission, it might also decrease the amount of information that can be gained relative to a complete and detailed Phase 2 program. In general, adaptive designs suffer from this criticism.
2.3 Operational Model
Although the decision tree analysis format is invaluable in characterizing a range of clinical trial formulation possibilities, the modeling can become extremely complex as the number of event and decision nodes increases. Thus, while the operational model developed allows the user to enter customized cost scenarios in a certain therapeutic area, it does not allow for changes in the number of decision or event nodes.
We developed the operational model in Microsoft Excel™ for ease of use and sharing, with a user interface coded in Visual Basic. The model is structured such that the user makes all selections through a guided user form, which enables the user to input project-specific values while the underlying worksheets and cost aggregation formula are protected from editing. The interface is designed to allow the user to compare a “custom” scenario, utilizing the values that he has entered in the user form, to a “default” scenario, which draws on average clinical trial costs and other parameters from the literature and data provided by Medidata Solutions (described in greater detail below). The model also allows for a blend of default and custom values as may be desired by the user. Further details on the uses and features of the model can be found in Appendix C.
2.4 Model Parameters
The clinical trial cost/decision-making model described above requires numerous data points, including phase durations, success probabilities, expected revenues, and a discount rate, as well as a full range of itemized costs associated with clinical trials, broken down by phase and therapeutic area. The model uses a real annual discount rate of 15 percent based on input from interviews conducted with drug sponsors as default, and we were able to obtain some of the other data needed from the available clinical research literature. Phase durations were one such parameter. Though they are not differentiated by therapeutic area, DiMasi, Hansen, & Grabowski (2003) provide mean phase lengths of 21.6 months (1.8 years) for Phase 1, 25.7 months (2.1 years) for Phase 2, and 30.5 months (2.5 years) for Phase 3. The NDA/BLA review time, as we are defining it,6 includes the time from first submission of an NDA/BLA to regulatory marketing approval, and comes from DiMasi, Grabowski, & Vernon (2004). Trial phase times generally do not reflect differences between therapeutic areas; however, therapeutic-area-specific NDA/BLA review times were available and used for a select list of therapeutic areas.
Clinical trial success probabilities are available from two recent studies, one conducted by DiMasi and colleagues (Tufts University) in 2010 (DiMasi, Feldman, Seckler, & Wilson, 2010), and another one conducted by BioMedTracker in 2011(Hay, Rosenthal, Thomas, & Craighead, 2011). The two studies, however, provide different success rate estimates—for example, DiMasi, et al. (2010) found an overall success rate of 19 percent, while Hay and colleagues (2011) arrived at nine percent. The differences in the two studies can be attributable to the fact that they were drawing from different pools of data. DiMasi, et al. (2010) collected data on 1,738 drugs that entered Phase 1 between 1993 and 2004 and were developed by the 50 largest pharmaceutical companies. The BioMedTracker study covered 4,275 drugs from biotechnology and pharmaceutical companies of all sizes. The drugs included were in any phase of development between October 2003 and December 2010 (Hay, Rosenthal, Thomas, & Craighead, 2011).
As the BioMedTracker study was more recent and included more drugs and a broader range of companies, we opted to use the success probabilities reported by BioMedTracker in our model. These success probabilities were broken down by clinical trial phase and, for Phase 2 and Phase 3, by therapeutic area as well. For Phase 1, we used 67 percent for all therapeutic areas. For Phases 2 and 3 and the NDA/BLA review phase, we used therapeutic-area-specific percentages where available and general success probabilities (41, 65, and 83 percent, respectively) for therapeutic areas for which no specific probabilities were reported. All probabilities used in the model were for lead indications.
In order to construct the model’s “baseline scenario,” we obtained itemized clinical trial cost data from Medidata Solutions (hereafter “Medidata”), which compiles data from a portfolio of CRO contracts, investigator grants/contracts, and clinical trial protocols. Medidata Grants Manager’s database, PICAS® , and CRO Contractor’s database, CROCAS® , contain numerous data elements derived from actual negotiated contracts, and these resources are widely used by pharmaceutical companies, CROs, and academic researchers to identify prevailing rates for trial planning, budget development, and grant negotiation (Medidata Solutions, 2012). We obtained the number of clinical investigator sites per study/protocol from Medidata Insights™, based on 7,000 study protocols that allows numerous views of study performance metrics on demand, by therapeutic area, study phase, geography and more.
The custom tabulation received from Medidata contained means and variances for a wide range of clinical trial cost elements, including study-level costs (such as IRB approvals and source data verification (SDV) costs), patient-level costs (such as recruitment and clinical procedure costs), and sitelevel costs (such as monitoring and project management). Number of planned patients per site and number of sites per study were also provided. A complete list of these data elements can be found in Appendix B, along with more detailed descriptions of each field, unit specifications, and sources. The data are from 2004 and later and have not been adjusted for inflation by Medidata. As the data points represent averages across this range of time and cannot be assigned specific years, we were unable to adjust them for inflation, which is one of the study limitations.
Medidata provided means and variances of costs by trial phase (Phases 1 through 4), geographic region (U.S., global, and rest of world), and therapeutic area. For the purposes of this analysis, we focused on the data points specific to U.S. trials. The therapeutic areas for which Medidata provided data were: anti-Infective, cardiovascular, central nervous system, dermatology, devices and diagnostics7 , endocrine, gastrointestinal, genitourinary System, hematology, immunomodulation, oncology, ophthalmology, pain and anesthesia, pharmacokinetics8 , and respiratory system. To the extent possible, we attempted to match the success probabilities by therapeutic area (from BioMedTracker) to the therapeutic area categories used by Medidata. Some additional data cleaning steps were performed using the statistical software STATA; these are outlined in Appendix E.
On the revenue side, we used an estimate from a study by DiMasi, Grabowski, & Vernon, (2004), which reports worldwide sales revenues over the product life cycle for new drugs approved in the United States during the period from 1990 to 1994. Figures were available for some specific indications; for the others, we used the reported figure for “All Drugs.” The numbers reported by DiMasi, Grabowski, & Vernon (2004) are NPVs, discounted at 11 percent to the launch year; however, they are in year 2000 dollars. Therefore, we inflated the revenue figures to 2008 dollars (the midpoint between 2004 and 2012, the range covered by the itemized cost data) using the producer price index for commodities in the category “Drugs and Pharmaceuticals” from the Bureau of Labor Statistics (BLS) (series WPU063).
6 From FDA’s perspective, each submission has a set time period (priority or non-priority review) that does not include time between submissions; however that time is included in our definition of the NDA/BLA review phase time for the purposes of this analysis.
7 The “Devices and Diagnostics” category includes any industry-sponsored studies where a device or drug delivery system is being studied instead of a drug. Among the devices included in this category are stents, implants, joint replacements, inhalers, and blood sugar monitoring devices.
8 Pharmacokinetic (PK) studies are often conducted at the discovery or candidate selection stages of a development program. These studies look at the mechanisms of absorption and distribution of a drug candidate as well as the rate at which a drug action begins and the duration of this effect.
3 Analysis of Costs
We worked closely with Medidata to determine the appropriate methodology for aggregating the itemized costs that characterize the overall cost of a clinical trial. To obtain totals for each individual trial within a given phase, we grouped the cost components into per-study costs, per-patient costs, and per-site costs, where:
- Per-study costs is the sum of:
- Data Collection, Management and Analysis Costs (per study);
- Cost Per Institutional Review Board (IRB) Approval × Number of IRB Approvals (per study);
- Cost Per IRB Amendment × Number of IRB Amendments (per study);
- SDV Cost (per data field) × Number of SDV Fields (per study); and
- The total of all per-site costs listed below, multiplied by Number of Sites (per study);
- Per-site costs is the sum of:
- The total of all per-patient costs listed below, multiplied by Number of Planned Patients (per site);
- Site Recruitment Costs (per site);
- Site Retention Costs (per month) × Number of Site Management Months;
- Administrative Staff Costs (per month) × Number of Project Management Months; and
- Site Monitoring Costs (per day) × Number of Site Monitoring Days;
- Per-patient costs is the sum of:
- Patient Recruitment Costs (per patient);
- Patient Retention Costs (per patient);
- Registered Nurse (RN)/Clinical Research Associate (CRA) Costs (per patient);
- Physician Costs (per patient);
- Clinical Procedure Total (per patient); and
- Central Lab Costs (per patient);
To arrive at a best approximation of the cost total for the trial, two additional costs had to be added in: site overhead and all other additional costs not captured in the itemized categories listed above. We first added site overhead as a percentage of the sum of the above per-study costs (roughly 20 to 27 percent of the above per-study costs as estimated by Medidata). 9 According to Medidata, the computed per-study costs plus the 25 percent site overhead only accounts for approximately 70 percent of total trial costs. Still missing from this total are costs for sponsors to run the study and other costs not captured elsewhere. Thus, we estimated an additional cost category, “All Other Costs” as 30 percent of the sum of computed per-study costs and the 25 percent site overhead to ensure accuracy of our totals.
We applied the cost aggregation methodology outlined above to all trials within Phases 1, 2, 3, and 4. In the operational model developed, if the user specifies that the study will include more than one trial per phase, the cost totals for each trial are summed to get an overall total cost for the phase.
Adding the lengths of time associated with each trial within a phase was somewhat more complex, as there are a range of possibilities. One possibility is that all trials within a given phase are completed concurrently, in which case the total length of time for the phase would be equal to the maximum length of time needed to complete any individual trial within that phase. For example, if there were two Phase 2 trials, and one took 1.5 years, while the other took 2 years, the total length of Phase 2 would be 2 years, assuming the trials were completed at the same time. At the other extreme end of the spectrum, the trials within a phase might be completed sequentially with no overlap, in which case the lengths of time specified would need to be summed to arrive at the total phase length. In the previous example, this would mean that the total length of Phase 2 is 1.5 plus 2, or 3.5 years. To take into account both extremes and all possibilities in between, we assumed that the phase length in years across all trials associated with a given phase is the average of these two measures (the maximum trial length specified and the total of all lengths specified). It should be noted that if only one trial is specified for a given phase in the operational model, this average will simply be equal to the length given for that trial.
The operational model discounts the total costs for each phase back to Year 0 (before Phase 1 trials are started) using the real annual discount rate (15 percent for the default scenario). Further, the model assumes that all costs associated with each phase are incurred at the start of the phase; therefore, Phase 1 costs are not discounted, Phase 2 costs are discounted over the length of Phase 1, Phase 3 costs are discounted over the combined lengths of Phases 1 and 2, and so forth.
While we apply discounting to trial costs in the operational model, the analysis presented below is based on raw (i.e., un-discounted) cost figures. Further, we exclude Devices & Diagnostics as well as Pharmacokinetics categories from the analysis below as these are not within the scope of this study.10
9 Site overhead is not always applied to all costs in a negotiated clinical investigator contract by the clinical site. In some cases, the site may negotiate overhead only on certain portions of the contract such as clinical procedures. Thus, 25 percent of total per-study costs is likely to be an overestimate of actual overhead costs per study.
10 Because the data were available for both categories, we left them in the operational model.
3.1 Costs by Therapeutic Area
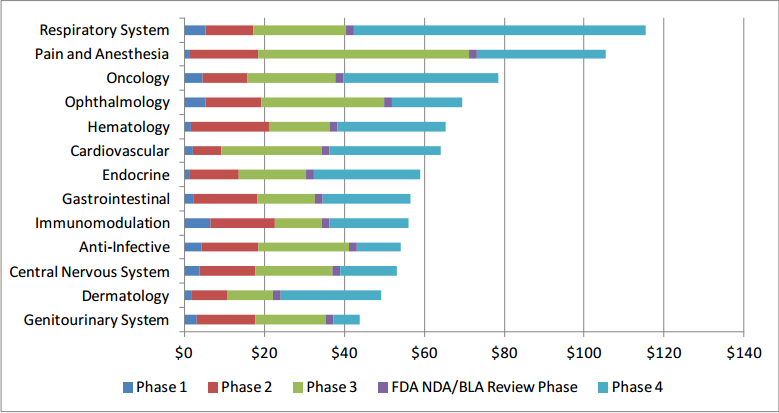
Table 1 presents the total costs for each of the therapeutic areas included in our model by clinical trial phase (assuming one trial per phase and not inclusive of failures). From the table, immunomodulation per-study costs ($6.6 million) are the highest in Phase 1 with costs of studies in ophthalmology ($5.3 million) and respiratory system ($5.2 million) ranking second and third, respectively. In Phase 2, hematology trial costs ($19.6 million) rank first, followed by pain and anesthesia ($17.0 million) and immunomodulation ($16.0 million). The most costly Phase 3 studies are in pain and anesthesia ($52.9 million) with studies in ophthalmology ($30.7 million) and cardiovascular ($25.2) area ranking second and third, respectively. In Phase 4, respiratory system trial costs ($72.9 million) rank first, followed by oncology ($38.9 million) and pain and anesthesia ($32.1 million) study costs. Overall, the therapeutic area with the highest clinical research burden across all phases is respiratory system ($115.3 million) followed by pain and anesthesia ($105.4 million) and oncology ($78.6 million) trials (see Figure 3). On the other hand, trials in central nervous system, dermatology, and genitourinary system tend to cost the least overall.
Table 1: Total Per-Study Costs (in $ Millions), by Phase and Therapeutic Area [a] [b]
| Therapeutic Area | Phase 1 | Phase 2 | Phase 3 | Phase 1, 2, & 3 Subtotal [d] | FDA NDA/BLA Review Phase [c] | Phase 4 | Total [d] |
|---|---|---|---|---|---|---|---|
| Anti-Infective | $4.2 (5) | $14.2 (6) | $22.8 (5) | $41.2 (3) | $2.0 | $11.0 (12) | $54.2 (10) |
| Cardiovascular | $2.2 (9) | $7.0 (13) | $25.2 (3) | $34.4 (10) | $2.0 | $27.8 (4) | $64.1 (6) |
| Central Nervous System | $3.9 (6) | $13.9 (7) | $19.2 (7) | $37.0 (6) | $2.0 | $14.1 (11) | $53.1 (11) |
| Dermatology | $1.8 (10) | $8.9 (12) | $11.5 (13) | $22.2 (13) | $2.0 | $25.2 (7) | $49.3 (12) |
| Endocrine | $1.4 (12) | $12.1 (10) | $17.0 (9) | $30.5 (12) | $2.0 | $26.7 (6) | $59.1 (7) |
| Gastrointestinal | $2.4 (8) | $15.8 (4) | $14.5 (11) | $32.7 (11) | $2.0 | $21.8 (8) | $56.4 (8) |
| Genitourinary System | $3.1 (7) | $14.6 (5) | $17.5 (8) | $35.2 (8) | $2.0 | $6.8 (13) | $44.0 (13) |
| Hematology | $1.7 (11) | $19.6 (1) | $15.0 (10) | $36.3 (7) | $2.0 | $27.0 (5) | $65.2 (5) |
| Immunomodulation | $6.6 (1) | $16.0 (3) | $11.9 (12) | $34.5 (9) | $2.0 | $19.8 (9) | $56.2 (9) |
| Oncology | $4.5 (4) | $11.2 (11) | $22.1 (6) | $37.8 (5) | $2.0 | $38.9 (2) | $78.6 (3) |
| Ophthalmology | $5.3 (2) | $13.8 (8) | $30.7 (2) | $49.8 (2) | $2.0 | $17.6 (10) | $69.4 (4) |
| Pain and Anesthesia | $1.4 (13) | $17.0 (2) | $52.9 (1) | $71.3 (1) | $2.0 | $32.1 (3) | $105.4 (2) |
| Respiratory System | $5.2 (3) | $12.2 (9) | $23.1 (4) | $40.5 (4) | $2.0 | $72.9 (1) | $115.3 (1) |
[a] The numbers in parentheses represent the rank in descending order.
[b] The cost for each phase assumes that a single trial (i.e., study) is conducted.
[c] The category represents the New Drug Application (NDA)/Biologic License Application (BLA) filing fee for an application requiring clinical data and does not include any establishment or product fees that the filing entity might need to pay in addition.
[d] Totals may not add up due to rounding.
Figure 3: Clinical Trial Costs (in $ Millions) by Phase and Therapeutic Area
As can be observed from Table 1, Phase 2 costs are lower than Phase 3 costs for all but three therapeutic areas: gastrointestinal, hematology, and immunomodulation. This somewhat counterintuitive relationship is due to a variety of factors, including higher data collection costs, administrative staff costs, and site recruitment costs in Phase 2 than in Phase 3 for these therapeutic areas.
3.2 Costs by Trial Phase
To compare average costs by phase across all therapeutic areas, we computed a weighted mean cost,  , and its weighted standard deviation, sij , , for each cost component, i, and clinical trial phase, j, where the weights are the total number of contracts (i.e., sum of investigator and contractor contracts contributing to the PICAS® and CROCAS® datasets11) such that

where wjk is the total number of contracts available for the phase and therapeutic area, k, combination; xijk is the reported mean for cost component i, clinical trial phase j, and therapeutic area k; is the simple average of cost component i for that phase j across all therapeutic areas;Ni is the number of therapeutic areas that are associated with the phase in question; and Ni' is the number of non-zero weights. As one would expect, the average per-study costs across all therapeutic areas increase as clinical development proceeds from Phase 1 to Phases 2 and 3 (see Figure 4).
Figure 4: Average Per-Study Costs by Phase (in $ Millions) Across Therapeutic Areas
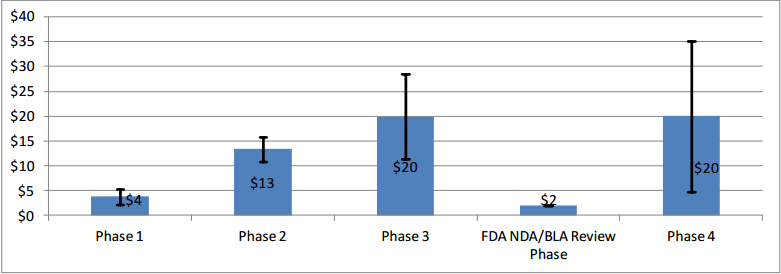
Note: The error bars represent one standard deviation below and above the mean.
While average Phase 4 study costs are equivalent to those of Phase 3, there is high degree of variability in Phase 4 costs across the different therapeutic areas.
11 The number of contracts by therapeutic area and trial phase cannot be publicly reported because they are confidential and proprietary.
3.3 Costs by Cost Component
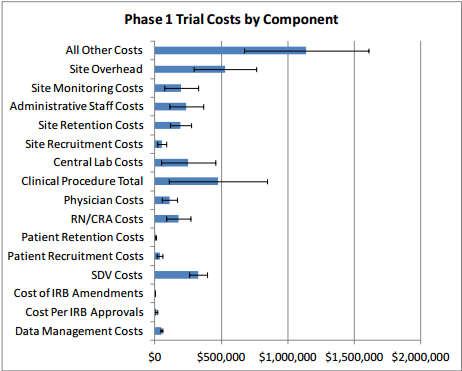
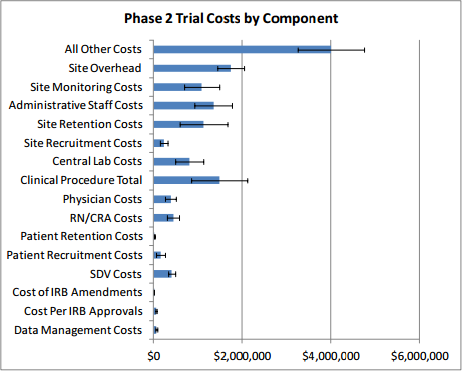
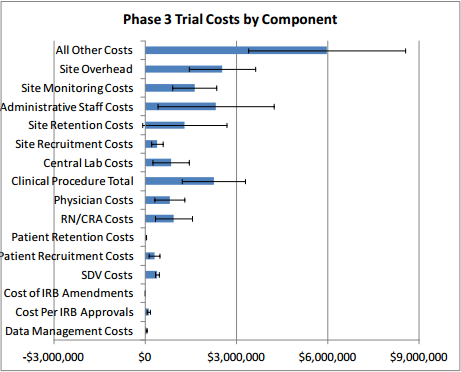
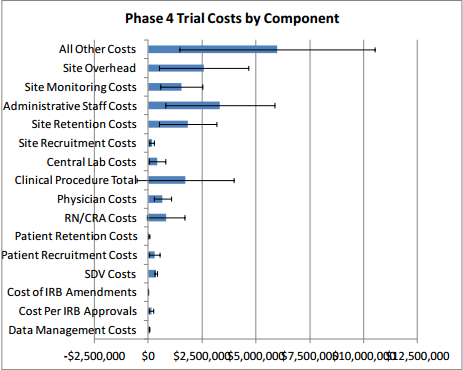
Table 2 presents clinical trial costs by cost component across all therapeutic areas by trial phase. Similar to our evaluation of costs by trial phase discussed in Section 3, when averaging costs across therapeutic areas, we weighted the data by the number of contracts available by therapeutic area. Excluding the All Other Costs and Site Overhead cost components as these are extrapolated numbers, in Phase 1, Clinical Procedure Costs ($476,000) are the highest, followed by SDV costs ($326,000) and Central Laboratory Costs ($252,000). In Phase 2, expenditures that contribute the most to overall costs in descending order include Clinical Procedure Costs ($1.5 million), Administrative Staff Costs ($1.3 million), Site Retention Costs ($1.1 million), Site Monitoring Costs ($1.1 million), Central Laboratory Costs ($804,000), and RN/CRA Costs ($441,000). Even though they are still sizable and higher in absolute terms than those in Phase 1, SDV Costs only constitute three percent (= $406,038 ÷ $13.35 million) of total per-study Phase 2 costs whereas in Phase 1 their share of total per-study costs is around nine percent (= $326,437 ÷ $3.80 million). Similar to Phase 2, Clinical Procedure Costs ($2.3 million), Administrative Staff Costs ($2.3 million), Site Retention Costs ($1.3 million), Site Monitoring Costs ($1.6 million), Central Laboratory Costs ($849,000), and RN/CRA Costs ($940,000) contribute the most to overall per-study Phase 3 costs. In Phase 4, Administrative Staff Costs ($3.3 million) rank the highest, followed by Site Retention Costs ($1.8 million), and Clinical Procedure Costs ($1.7 million). While not insignificant in dollar terms, Patient Recruitment Costs only account for 1.7 to 2.7 percent of overall costs across different clinical trial phases.
Table 2: Clinical Trial Costs, by Cost Component, Phase, and Therapeutic Area [a] [b]
| Cost Component | Phase 1 | Phase 2 | Phase 3 | Phase 4 | ||||
|---|---|---|---|---|---|---|---|---|
| $ | % of Subtotal | $ | % of Subtotal | $ | % of Subtotal | $ | % of Subtotal | |
| Data Management Costs | $50,331 ($8,467) | 2.36% | $59,934 ($21,060) | 0.79% | $39,047 ($19,416) | 0.34% | $49,702 ($9,489) | 0.44% |
| Cost Per IRB Approvals | $11,962 ($6,305) | 0.56% | $60,188 ($16,092) | 0.79% | $114,118 ($46,404) | 1.00% | $137,813 ($112,543) | 1.21% |
| Cost of IRB Amendments | $1,094 ($255) | 0.05% | $1,698 ($447) | 0.02% | $1,919 ($277) | 0.02% | $1,636 ($302) | 0.01% |
| SDV Costs | $326,437 ($65,659) | 15.32% | $406,038 ($80,573) | 5.34% | $400,173 ($66,429) | 3.52% | $353,602 ($62,942) | 3.10% |
| Patient Recruitment Costs | $37,050 ($21,666) | 1.74% | $161,140 ($102,066) | 2.12% | $308,672 ($174,702) | 2.71% | $298,923 ($252,042) | 2.62% |
| Patient Retention Costs | $6,145 ($4,745) | 0.29% | $15,439 ($6,970) | 0.20% | $24,727 ($15,868) | 0.22% | $30,568 ($40,466) | 0.27% |
| RN/CRA Costs | $178,237 ($90,473) | 8.36% | $441,053 ($140,390) | 5.80% | $939,540 ($614,943) | 8.25% | $820,775 ($880,644) | 7.20% |
| Physician Costs | $109,681 ($57,626) | 5.15% | $381,968 ($117,217) | 5.03% | $805,508 ($499,426) | 7.08% | $669,464 ($402,072) | 5.88% |
| Clinical Procedure Total | $475,667 ($371,586) | 22.32% | $1,476,368 ($633,448) | 19.43% | $2,252,208 ($1,033,618) | 19.79% | $1,733,576 ($2,251,401) | 15.22% |
| Central Lab Costs [d] | $252,163 ($203,342) | 11.83% | $804,821 ($313,577) | 10.59% | $849,180 ($600,134) | 7.46% | $419,758 ($377,823) | 3.68% |
| Site Recruitment Costs | $51,904 ($32,814) | 2.44% | $233,729 ($83,799) | 3.08% | $395,182 ($195,983) | 3.47% | $168,343 ($101,311) | 1.48% |
| Site Retention Costs | $193,615 ($79,974) | 9.09% | $1,127,005 ($544,068) | 14.83% | $1,305,361 ($1,382,296) | 11.47% | $1,835,341 ($1,335,892) | 16.11% |
| Administrative Staff Costs | $237,869 ($128,547) | 11.16% | $1,347,390 ($427,859) | 17.73% | $2,321,628 ($1,910,047) | 20.40% | $3,323,081 ($2,534,406) | 29.17% |
| Site Monitoring Costs | $198,896 ($128,142) | 9.33% | $1,083,186 ($392,798) | 14.25% | $1,624,874 ($717,034) | 14.28% | $1,549,761 ($979,371) | 13.60% |
| Subtotal (in $ Million) | $2.13 ($0.86) | 100% | $7.60 ($1.46) | 100% | $11.38 ($4.93) | 100% | $11.39 ($8.53) | 100% |
| Site Overhead [c] | $528,685 ($235,862) | NA | $1,741,811 ($302,049) | NA | $2,541,313 ($1,091,082) | NA | $2,575,007 ($2,082,161) | NA |
| All Other Costs [c] | $1,139,887 ($468,077) | NA | $4,003,615 ($752,108) | NA | $5,967,193 ($2,577,692) | NA | $5,986,008 ($4,543,505) | NA |
| Total (in $ Million) | $3.80 ($1.56) | NA | $13.35 ($2.51) | NA | $19.89 ($8.59) | NA | $19.95 ($15.15) | NA |
NA = Not applicable. Note that the reported numbers represent weighted average costs and standard deviations.
[a] The numbers in parentheses represent standard deviations. [b] The cost for each phase assumes that a single trial (i.e., study) is conducted. [c] These are extrapolated figures based on those cost components for which estimates were available from Medidata. [d] Please note that Phase 1 study sites tend to have inhouse or local labs as opposed to central labs.
3.4 Conclusions
Our study suggests that therapeutic area as well as number and types of clinical procedures involved are the key drivers of costs in Phase 1 through Phase 4 studies. The therapeutic areas with the highest per-study costs in Phase 1 is immunomodulation ($6.6 million), in Phase 2 is hematology ($19.6 million), in Phase 3 is pain and anesthesia ($52.9 million), and in Phase 4 is respiratory system ($72.9 million). Figure 5 presents an overview of the different types of costs constituting each phase and their magnitudes. The denoted error bars represent one standard deviation below and above the mean value.
Figure 5: Per-study Costs across All Therapeutic Areas, by Cost Component and Phase
Excluding site overhead costs and costs for sponsors to monitor the study, the top cost drivers of clinical trial expenditures across all study phases are Clinical Procedure (15 to 22 percent), Administrative Staff (11 to 29 percent), Site Monitoring (nine to 14 percent), Site Retention (nine to 16 percent), and Central Laboratory (four to 12 percent) costs (see Table 2 above).
4 Barriers to Clinical Trials
Broadly speaking, the major obstacles to conducting clinical trials in the United States identified through this research include: high financial cost, the lengthy time frames, difficulties in recruitment and retention of participants, insufficiencies in the clinical research workforce, drug sponsor-imposed barriers; regulatory and administrative barriers, the disconnect between clinical research and medical care, and barriers related to the globalization of clinical research. We discuss each of these in further detail below.
4.1 High Financial Cost
The largest barrier to conducting clinical research—and the one into which most other barriers feed—is the high cost. Studies estimate that it now costs somewhere between $161 million and $2 billion to bring a new drug to market (DiMasi, Hansen, & Grabowski, 2003; Adams & Brantner, 2006; Morgan, Grootendorst, Lexchin, Cunningham, & Greyson, 2011). One particularly well-known and often-cited paper by DiMasi, Hansen, & Grabowski (2003) arrives at a total pre-approval cost estimate of $802 million in 2000 dollars to develop a single drug (inflated to 2012 dollars, this estimate is $1.07 billion) (DiMasi, Hansen, & Grabowski, 2003; U.S. Bureau of Labor Statistics, 2012). More recent estimates of drug development costs are around $1.3 billion to $1.7 billion (Collier, 2009). It is important to note that the DiMasi, Hansen, & Grabowski (2003) estimate and many others in the literature represent fully capitalized costs and are inclusive of failures.
The DiMasi, Hansen, & Grabowski (2003) research on this topic is sponsored by the Tufts Center for the Study of Drug Development (CSDD) and has been the subject of much debate among researchers. Light & Warburton (2005) contend that the $802 million figure is far too high due to “problems with the data and sampling,” specifically small sample size, differences in cost allocation methods over time and across companies, upward biases in industry-reported costs, the types of drugs included, and failure to adjust for government subsidies or tax deductions/credits. Light and Warburton (2005) are also critical of the authors’ use of proprietary and confidential data which precludes independent verification (Light & Warburton, 2005). DiMasi et al. (2003) address these concerns in replies, stating that the accuracy of their results is bolstered by cross-checks against other sources and validation by the U.S. Office of Technology Assessment (DiMasi, Hansen, & Grabowski, 2005). Adams & Brantner (2006) also sought to replicate the findings of DiMasi, et al. (2003) using publicly available data. They arrived at a cost estimate of $868 million, suggesting that $802 million might actually be an underestimate. The authors caution, however, that estimated costs vary widely, depending on drug type, therapeutic area, regulatory policies, and strategic decision-making by drug sponsors. Thus, policymakers should be careful about using a single number to characterize drug development costs (Adams & Brantner, 2006).
Although experts debate the accuracy of various cost estimates, there is widespread agreement that clinical trial costs are substantial and rising. According to a 2007 article, the average cost of developing a drug had risen at a rate 7.4 percent higher than inflation over the past two decades, mostly due to rising clinical trial costs (Collier, 2009). Costs also tend to increase as a drug progresses through each phase of the pipeline, and, as the Institute of Medicine (IOM) notes, Phase 3 clinical trials have become “extraordinarily expensive” (English, Lebovitz, & Giffin, 2010). DiMasi, Hansen, & Grabowski (2003) report that the mean costs per investigational drug entering a phase are $15.2 million for Phase 1, $23.5 million for Phase 2, and $86.3 million for Phase 3. Using publicly available data and a larger sample size than DiMasi, et al., (2003), Adams & Brantner (2010) estimate the average expenditure per drug in human clinical trials at around $27 million per year, with $17 million per year on drugs in Phase 1, $34 million per year on drugs in Phase 2, and $27 million per year on drugs in Phase 3 of the trials. Note that DiMasi, et al. (2003) present costs for the average drug over the entire length of each phase, while Adams & Brantner (2010) present expenditures for one year. Multiplying the latter by average phase durations yields estimates of $24 million, $86 million, and $61 million for Phases 1, 2, and 3, respectively (Adams & Brantner, Spending on new drug development, 2010).
While the reasons for these high costs are manifold, a few key macro-level trends stand out. One contributing factor is the productivity of the drug industry in past years. High levels of investment in research and development have yielded so many drugs that companies are now finding it difficult to develop truly innovative pharmaceuticals. As a result, most new drugs are actually just variations of existing drugs, intended to be only incrementally more effective or safer than those already on the market. Detection of such small, incremental improvements requires studies with large numbers of patients (Collier, 2009), and with greater numbers of participants comes greater expenditure on recruitment efforts, data collection, compliance with administrative requirements, and other trial components.
In addition, there has been a shift in the biopharmaceutical industry toward chronic and degenerative disease research, which, given the aging of a large segment of the population, has the potential to secure steady and sizeable revenue streams for companies who can capture a share of these markets (Collier, 2009; DiMasi, Hansen, & Grabowski, 2003). On the other hand, however, clinical trials for these chronic conditions (such as arthritis, dementia, and cardiac diseases) tend to involve complex and expensive testing, large numbers of patients, and long timeframes, as extended drug exposure is required in order to identify potential long-term effects. Multiplying these long-term data requirements by large numbers of patients yields enormous volumes of data that must be collected, processed, analyzed, and reported, all at great cost to the sponsor.
Another significant trend contributing to higher clinical trial costs is the increased use of health care cost containment strategies, such as tiered formularies and cost-effectiveness data requirements, in the United States and other countries. In response to these measures, drug sponsors might choose to devote more of their clinical research budgets to trials that compare their drug to a competitor drug, as opposed to trials that compare their drug to a placebo. As discussed above, this can lead to increased expenses, as larger trial sizes are needed to demonstrate statistical significance in comparisons of multiple drugs (DiMasi, Hansen, & Grabowski, 2003).
Other cost drivers, which are discussed in more detail in subsequent sections, include increasingly complex clinical trial protocols, conservative approaches to data and site monitoring, and delays caused by differing interpretations of requirements by different parties involved in multicenter trials (Collier, 2009).
The increasing cost of clinical research has significant implications for public health, as it affects drug companies’ willingness to undertake clinical trials. Many companies are taking their trial operations—and their research dollars—to other countries, such as India and China, where trial costs can be up to 60 percent lower (Collier, 2009). Some researchers argue that rising clinical trial costs have made the industry as a whole more risk averse; with such large sums of money at stake, sponsors are less willing to take chances on novel drugs (Collier, 2009). Clinical research centers are also more closely scrutinizing the types of clinical trials they will take on, out of concern that certain projects will fail to be profitable and put them in a deficit (e.g., due to complicated protocols or low per-patient grant amounts) (Collier, 2009; Getz K. A., 2010a).
4.2 Lengthy Timelines
Closely related to the cost of clinical trials is the length of time it takes to complete them, which has also increased in recent years. Between 2000 and 2005, pharmaceutical companies experienced a three percent median increase in development cycle times and a nearly 11 percent increase in regulatory cycle times (Getz K. A., 2006). Though the most recent data released by FDA in the fiscal year (FY) 2011 Prescription Drug User Fee Act (PDUFA) Performance Report indicate that median times to approval for priority and standard applications have decreased by a few months since FY 2008 (U.S. Food and Drug Administration, 2012), 12 the drug development process as a whole is still lengthy. DiMasi, Hansen, & Grabowski (2003) calculated that the average length of time from the start of clinical testing to marketing is 90.3 months (7.5 years), and the entire process, from discovery to registration with the FDA, takes 10 to 15 years for a typical drug (English, Lebovitz, & Giffin, 2010).
Lengthy timelines directly contribute to lower revenues over the course of a drug’s lifecycle, increasing the financial burden of drug development. For instance, long trials mean large human labor costs, as investigators and staff must be compensated for many hours. Long development times also reduce the time a drug has under patent protection, thereby opening the door for generic competitors and reducing the amount of revenue that can be earned. Additionally, the potential for study results to impact medical practice may be reduced over time as changes in clinical practice or the standard of care might make the new drug obsolete (English, Lebovitz, & Giffin, 2010). The timing of investments and returns also factors into the total cost of drug development. As DiMasi, Hansen, & Grabowski (2003) explain:
Once a timeline is established and out-of-pocket costs are allocated over that timeline, the expenditures must be capitalized at an appropriate discount rate. The discount rate should be the expected return that investors forego during development when they invest in pharmaceutical R&D instead of an equally risky portfolio of financial securities. Empirically, such a discount rate can be determined by examining stock market returns and debt-equity ratios for a representative sample of pharmaceutical firms over a relevant period. The resulting discount rate is an average company cost-of-capital (DiMasi, Hansen, & Grabowski, 2003).
The authors estimated that half of the total average cost of bringing a new drug to market—which they estimated at $802 million—was attributable to opportunity costs associated with foregone investments over the drug development period ($403 million) (DiMasi, Hansen, & Grabowski, 2003).
There are a number of factors contributing to the length of clinical trials, and several of these are also discussed in other sections. For one, industry’s focus on treatments for chronic diseases (see Section 4.1) creates a need for long trials to demonstrate safety for drugs that are meant to be taken over an extended term. As discussed in the following sections, long trials face additional challenges with patient and investigator retention, which can in turn cause costly holdups (Weisfeld, English, & Claiborne, 2011). Numerous administrative and regulatory barriers also create delays that protract the clinical trial approval process in the United States (see Section 4.5 for more details). Additionally, the “one-off” ad hoc nature of trial organization contributes to long trial initiation timeframes, as investigators, staff, study sites, and other resources are retained for the purposes of a single trial and then disbanded. In the absence of a consistent trial infrastructure, each clinical trial requires that these resources be assembled anew, a process that can take years (Eisenberg, Kaufmann, Sigal, & Woodcock, 2011; English, Lebovitz, & Giffin, 2010).
Although various technological advances and opportunities for centralized coordination have the potential to shorten drug development timelines, the clinical trial business model has not yet evolved in such a way that would take full advantage of them (Kramer & Schulman, 2011). For example, electronic data capture (EDC) improves efficiency by replacing paper forms and manual data queries with electronic forms and checks; however, not all companies have adopted EDC as a replacement for paper records (Neuer, Warnock, & Slezinger, 2010), and other efficiency gains made possible by this technology—for instance, in patient screening and recruitment—have not yet been realized (Kramer & Schulman, 2011). Site monitoring is another example; according to a recent survey of 65 organizations, 83 percent reported using centrally available data to evaluate site performance, but only 12 percent of respondents actually made frequent use of centralized monitoring to replace time-consuming on-site visits (Morrison, et al., 2011). A third example is the unwillingness of some research sites (academic institutions, most notably) to defer to central IRBs to allow for streamlining of the ethics review process.
According to the literature and the interviews with drug company representatives, this industrywide inertia is rooted in a desire to avoid perceived regulatory risk. That is, companies, investigators, and reviewers continue to take actions that add time and cost but are not value-added, simply because those actions have proven successful in the past (Kramer & Schulman, 2011). Getz (2006) reported that some companies, including Bayer, Astra-Zeneca, Allergan, Boehringer-Ingelheim, and Merck, have found ways to achieve speed advantages (development cycles shortened by up to 17 months and regulatory cycles shortened by up to 3 months) relative to average performers. According to the author, these advantages can be attributed at least in part to terminating projects sooner, collaborating more actively with global regulatory agencies, using information technology and electronic data management technologies consistently and widely, and using CROs more (Getz, 2006). Additionally, partnerships and networks, such as the Pediatric Oncology Experimental Therapeutics Investigators Consortium (POETIC), have succeeded in increasing efficiency by bringing resources together and allowing multiple trials to be conducted without building the infrastructure up from scratch each time. Still, adoption of these models and practices is the exception rather than the standard.
12 See also Brooks, C. (2012). According to this report, analysis of 4,300 global clinical trials across multiple therapeutic areas indicates the trend toward longer trial durations has reversed and clinical trials are now being completed in less time.
4.3 Difficulties in Recruiting and Retaining Participants
In interviews, expert consultants and representatives from pharmaceutical and biotechnology companies and CROs cited patient recruitment as one of the most significant barriers to conducting clinical trials in the United States. Failure to recruit sufficient numbers of patients can result in costly delays or even cancellation of the entire trial (Weisfeld, English, & Claiborne, 2011).
Patient recruitment difficulties are caused by a number of factors, some of which are fairly universal across clinical trials, while others arise due to characteristics of a particular disease or trial. One obvious factor is study size; as discussed previously, trends toward comparative and chronic disease studies contribute to a need for larger numbers of participants. Another common problem is finding willing individuals to participate in clinical trials. Most company representatives also expressed frustration over competition among drug companies for the same patient pools, explaining that multiple large companies often find themselves targeting the same big markets at the same time. For example, many sponsors are interested in pursuing anti-inflammatory drugs because the road to regulatory approval is clear and well-established for these drugs. These companies then compete to enroll patients with a few specific diseases (e.g., asthma, multiple sclerosis, and chronic obstructive pulmonary disease) on which they would like to test their drug. On the other hand, for smaller markets, recruitment might be hindered by the simple fact that patients are few and far between. Many smaller companies focus on developing drugs for orphan diseases, for which the potential pool of patients is, by definition, limited.
There are several factors specific to certain disease areas or trial types that can make it especially difficult to recruit and retain patients in sufficient numbers. For some diseases (such as certain cancers), problems of access arise because patients are located mostly in remote areas, far from the clinical trial sites that are selected based on where investigators are (English, Lebovitz, & Giffin, 2010). Patient retention is a common problem in studies involving long-term endpoints (e.g., multiple sclerosis), lengthier treatments, or negative side effects that cause patients to become fatigued or sick and drop out. Additionally, some trials have narrow patient eligibility criteria that intentionally disqualify many potential participants who have the targeted disease but do not meet other inclusion criteria (English, Lebovitz, & Giffin, 2010). The goal in excluding these patients is to conduct a pure experiment that is free from the confounding influences of comorbid illnesses, concomitant medications, and other such factors (Kramer, Smith, & Califf, 2012). Enrollment restrictions such as these may simplify the trial itself but make recruitment more difficult.
Even if there were an abundance of readily available, ideally suited patients, participation in clinical trials would still be greatly hindered by public attitudes, incentives, and lack of knowledge. Both physicians and their patients are often unaware of clinical trial options, and often times it is only patients of higher socioeconomic status who have the resources, knowledge, and motivation to seek information about a disease, including clinical trials (English, Lebovitz, & Giffin, 2010). Furthermore, physicians may not be able to determine whether standard treatment or a trial is the better option for their patients. To some extent, these problems arise from the separation between the realms of scientific research and clinical care in the United States and the lack of engagement among physicians in the clinical research process (discussed in greater detail in Section 4.7) (Bonham, Califf, Gallin, & Lauer, 2011).
For their part, patients who are aware of clinical trial options might be hesitant to participate for a number of reasons. Fear is a major deterrent; patients understand that taking part in clinical research is good for public health but feel uncertain as to whether it is the best option for their own personal health. Many people are ill-at-ease with the idea of serving as “guinea pigs” and possibly suffering unexpected side effects, while others might assume the new drug is likely to be effective and worry instead about being assigned to a no-treatment or placebo group (Mills, et al., 2006; Welton, Vickers, Cooper, Meade, & Marteau, 1999). A related issue is discomfort with randomization and the idea that choice of treatment will be based on chance rather than the decision of a doctor or the patients themselves (Jenkins & Fallowfield, 2000). Media attention to cases with negative outcomes (e.g., serious side effects or deaths) has also fostered distrust of industry-sponsored trials, and many patients believe that industry will put its own interests ahead of theirs (Weisfeld, English, & Claiborne, 2011; English, Lebovitz, & Giffin, 2010). Awareness of deceptive, exploitative, and racist past practices in experiments, such as the Tuskegee syphilis study, continues to fuel this distrust, particularly among some minorities and cultures within the United States (Weisfeld, English, & Claiborne, 2011; Shavers, Lynch, & Burmeister, 2000).
Aside from the uncertainties involved, participating in clinical research may simply be inconvenient or overly burdensome to patients. By signing up for a trial, patients might subject themselves to interruptions in care, physical and emotional stress caused by leaving their regular provider, time and travel costs, (including transportation to the study site and lost income), and large volumes of confusing paperwork associated with the informed consent process (English, Lebovitz, & Giffin, 2010). Finally, language and literacy barriers may also deter some from participating (Weisfeld, English, & Claiborne, 2011).
4.4 Increasing Competition for Qualified Investigators and Sites
In addition to patient recruitment, difficulty finding investigators and sites was one of the issues most frequently raised by industry representatives in discussions with ERG. According to some, the problem is not a lack of researchers overall but rather a lack of highly qualified researchers who are consistently able to enroll high-quality patients in sufficient numbers. As a result, sponsors compete with each other for these top investigators, creating the impression that there is a shortage even though less well-qualified investigators might be available.
Whether and how sponsors experience this competition is based, to some degree, on their companies’ size and disease specialties. Many of the larger CROs have strategic partnerships with large drug companies, which provide the CROs with a consistent revenue stream. In exchange, the drug companies get priority access to staff, data management resources, and investigators. This allocation of resources to big drug companies further intensifies resource competition for small companies. Companies pursuing drugs in the same therapeutic areas at the same time will also face more competition, not only for patients, as discussed in the Section 4.3, but also for investigators and sites. For highly specialized treatment areas such as anti-fungals, sponsors may have a very limited universe of qualified investigators to choose from in the first place.
Other experts frame the problem somewhat differently, asserting that this barrier stems not simply from competition for top investigators but also from an actual overall shortage of biostatisticians and clinical informaticists across academic medicine, industry, and government (Bonham, Califf, Gallin, & Lauer, 2011). In support of this claim, there is evidence to suggest that the rate of attrition among U.S. investigators is increasing. The proportion of clinical investigators who are from North America has been falling since 1997, while the proportions of investigators from Western Europe and the rest of the world have been increasing (English, Lebovitz, & Giffin, 2010).
There is reason to believe that this trend will persist and the pool of investigators in this country will continue to shrink. It is very challenging to conduct clinical trials and establish a successful career as a clinical investigator in the U.S (English, Lebovitz, & Giffin, 2010); 45 percent of first-time investigators quit the field after their first clinical trial (Califf, Filerman, Murray, & Rosenblatt, 2011), and there is little motivation for new investigators to replace them. The clinical investigator track is, in many ways, less appealing than other options available to researchers, who would prefer to publish results more easily and avoid the hassles of getting a clinical trial protocol approved. Furthermore, conducting clinical trials does not earn researchers much respect among academics, and academic institutions often provide little support in the design and initiation of trials. Although community physicians and practitioners represent a large pool of potential investigators, they are generally uninvolved in the clinical trial process (for reasons discussed in Section 4.7) (English, Lebovitz, & Giffin, 2010). In this shrinking pool of resources, competition for resources will likely continue to intensify as increasing numbers of trials are conducted in orphan/low-prevalence diseases.
The outlook for resources at the investigative site level is similarly bleak. Many veteran sites in the U.S. have been struggling financially in recent years, forcing some to shift resources to more profitable enterprises or even cease their clinical research activities altogether (Getz K. A., 2010a). While some of this financial hardship can be attributed to the global economic downturn—the number of new trials being initiated declined, and many trials have been delayed or terminated—much of it is due to industry practices. For one thing, protocols have grown increasingly complex (in terms of the number of procedures and amendments and amount of effort required to execute them), to the point of becoming unmanageable (discussed in more detail in Section 4.6). Recruitment is also very difficult in the United States (see Section 4.3), which increasingly drives sponsors to sites overseas. Furthermore, sponsors and CROs are responding to the unpredictability of site performance with a practice called “hedging,” in which trials are spread across larger numbers of sites, each with smaller numbers of patients, an economically unfavorable arrangement for many sites. Finally, sites face serious cash flow problems. In general, sponsors try to defer payment to later in the study; it takes an average of approximately 120 days for sites to receive payment from sponsors and CROs for work that they have already completed. Many experienced investigative sites need to borrow money in order to stay afloat, with the average U.S.-based site carrying a debt of $400,000. If these factors remain unaddressed, more sites can be expected to permanently close their doors to clinical research (Getz K. A., 2010a).
4.5 Regulatory and Administrative Barriers
Regulations are often created in response to a negative event befalling a trial participant or a study as a whole (Kramer, Smith, & Califf, 2012). While these regulations are intended to improve safety or other facets of the clinical research process, many times they are not subsequently evaluated to determine whether they actually achieve those purposes or are simply creating additional obstacles.
Furthermore, U.S. regulations pertaining to clinical research were written when the clinical trials enterprise was smaller in terms of the number of active trials and before multicenter trials became common (in the 1980s-1990s) (Kramer, Smith, & Califf, 2012). This section addresses several subcategories of regulatory and administrative barriers.
4.5.1 Regulations Protecting Human Research Subjects and Their Privacy
Ethical / Institutional Review Board Approval (21 Code of Federal Regulations (CFR) 56)
The ethical review process suffers from a lack of clarity regarding the roles and responsibilities of various oversight bodies and what is expected of investigators (English, Lebovitz, & Giffin, 2010). IRBs have expanded their scope of responsibility in recent years, undertaking new tasks such as review of investigators’ conflicts of interest, protection of patient health information, assessment of trial design, and risk management. As a result of this “mission creep,” trials require more approvals from different people within a single IRB, yet there are no indications that safety is improved by the expansion of responsibility (Kramer, Smith, & Califf, 2012).
In addition to the increased bureaucracy and associated delays, the IRB review process for multisite trials (which usually require approvals by multiple IRBs) is also plagued by problems of coordination and consistency (English, Lebovitz, & Giffin, 2010). IRB definitions and standards (e.g., for reportable adverse events, or for what qualifies as equipoise) vary by geographic location, resulting in inconsistencies, delays, and other complications. Lost time and redundancies result when multiple local IRBs must review the same protocols and adverse events instead of a single IRB doing so, and dividing authority among multiple IRBs may weaken any individual board’s ability to demand important changes to protocols. Moreover, important issues flagged by one IRB may not ever be communicated to the other IRBs (Kramer, Smith, & Califf, 2012).
To alleviate some of these problems, FDA recommended in 2006 that one central IRB be used for multicenter trials (U.S. Food and Drug Administration, 2006b); however, many drug sponsors have not made this a requirement and some sites are still unwilling to work with central IRBs. On April 23, 2012, FDA held a public hearing to obtain input from stakeholders on FDA's scope and direction in modernizing the regulations, policies, and practices that apply to the conduct of clinical trials of FDAregulated products, and IRBs were a topic of much discussion. According to speakers at the public hearing, institutions often express concern that they will remain liable, even if reviews are delegated to central IRBs, and therefore prefer to use their own (local) IRB rather than to delegate to a central IRB. Academic institutions have a reputation for being particularly reluctant to defer to central IRBs (reasons for this are discussed in Section 4.8) (U.S. Food and Drug Administration, 2012).
Informed Consent (21 CFR 50)
The process of obtaining informed consent, while important, is burdensome and time-consuming, both for researchers and trial participants. Sponsors are required to educate clinical trial participants as to the purpose of the study, its duration, necessary procedures, potential risks and benefits, and their rights before they can enter the trial. As part of this process, the research team must produce carefully worded documents, discuss the documents and the trial process with each individual patient, get the required patient signatures, and track the paperwork (English, Lebovitz, & Giffin, 2010).
Patients must fill out and sign the numerous forms before they can participate, which can be overwhelming, especially when combined with the U.S. Health Insurance Portability and Accountability Act (HIPAA) forms, monitoring, and compliance (English, Lebovitz, & Giffin, 2010). A recent study of 124 informed consent documents used in multinational, U.S. government-sponsored human immunodeficiency virus (HIV)/acquired immunodeficiency syndrome (AIDS) trials found the median length of the forms to be 22 pages (27 pages for adult forms)(Kass, Chaisson, Taylor, & Lohse, 2011). The authors also noted that, despite the forms’ length, key concepts such as randomization were often inadequately explained, and higher-level reading comprehension skills (at least a ninth-grade level) were needed to understand the documents. The lengthy and confusing forms can be especially problematic for patients with language or disability barriers (U.S. Food and Drug Administration, 2012).
Development of technological solutions is underway, though it is still in its early stages. One option discussed at the April 2012 FDA hearing was to replace paper forms with wireless tablets, which have the potential to facilitate document security and management, as well as to provide information in multiple languages or in audio/video format, which might be more accessible to children and patients with disabilities. However, simply moving excessively long and complicated forms from paper to a tablet screen will not address the need to fundamentally streamline the informed consent process and improve both efficiency and understanding (U.S. Food and Drug Administration, 2012).
Patient Privacy: U.S. Health Insurance Portability and Accountability Act (HIPAA) (45 CFR Part 160 and Subparts A and E of Part 164)
HIPAA requires patients’ authorization to use their health information for research (may be combined with informed consent). There are severe penalties for violating HIPAA, so IRBs strictly enforce compliance. However, one consequence of HIPAA and other privacy laws is that, when patients drop out, site investigators are reluctant to attempt to contact them or seek their medical records to followup on major outcomes/study endpoints. This in turn reduces statistical power and can lead to uncertain study results. It has been suggested that informed consent documents include a statement alerting participants that, should they drop out of the study, the investigators will seek their authorization to track their major outcomes (Kramer, Smith, & Califf, 2012).
4.5.2 Safety Reporting Requirements for Investigational New Drugs (INDs) and Biologics (21 CFR 312)
In the course of clinical investigations conducted under investigational new drug (IND) applications, information regarding adverse events must be communicated among investigators, sponsors, IRBs, and FDA in safety reports. There are a number of terms that are used to categorize adverse events and thereby determine which must be reported. The most up-to-date definitions of these terms from 21 CFR 312.32(a) are provided below:
- Adverse event: “[A]ny untoward medical occurrence associated with the use of a drug in humans, whether or not considered drug related.”
- Life-threatening adverse event or life-threatening suspected adverse reaction: “An adverse event or suspected adverse reaction is considered ‘life-threatening’ if, in the view of either the investigator or sponsor, its occurrence places the patient or subject at immediate risk of death.”
- Serious adverse event or serious suspected adverse reaction: “An adverse event or suspected adverse reaction is considered ‘serious’ if, in the view of either the investigator or sponsor, it results in any of the following outcomes: Death, a life-threatening adverse event, inpatient hospitalization or prolongation of existing hospitalization, a persistent or significant incapacity or substantial disruption of the ability to conduct normal life functions, or a congenital anomaly/birth defect.”
- Suspected adverse reaction: “[A]ny adverse event for which there is a reasonable possibility that the drug caused the adverse event. For the purposes of IND safety reporting, ‘reasonable possibility’ means there is evidence to suggest a causal relationship between the drug and the adverse event. Suspected adverse reaction implies a lesser degree of certainty about causality than adverse reaction, which means any adverse event caused by a drug.”
- Unexpected adverse event or unexpected suspected adverse reaction: “An adverse event or suspected adverse reaction is considered ‘unexpected’ if it is not listed in the investigator brochure or is not listed at the specificity or severity that has been observed; or, if an investigator brochure is not required or available, is not consistent with the risk information described in the general investigational plan or elsewhere in the current application, as amended.”
In the past, the FDA, IRBs, and clinical investigators in multicenter trials have been flooded with expedited reports of serious adverse events (SAEs), making it difficult to determine which were true signals of significant safety events and which were simply “noise.” This high-volume reporting occurred largely as a result of the FDA’s previous safety reporting requirements, which were insufficiently specific with regard to the threshold for determining whether an adverse event was reportable (Sherman, Woodcock, Norden, Grandinetti, & Temple, 2011), combined with cautious over-reporting on the part of sponsors (see Section 4.6). These reports did not provide enough context—such as aggregate data by treatment group—to allow for interpretation of the events and evaluation of their causal relationship with drug therapy. For example, it is impossible to determine whether a single reported case of myocardial infarction is causally related to drug exposure in a study population comprised of elderly patients (Kramer, Smith, & Califf, 2012; Sherman, Woodcock, Norden, Grandinetti, & Temple, 2011).
A new FDA safety reporting regulation (effective March 2011) seeks to remedy these problems by clarifying the roles and responsibilities of sponsors and clinical investigators in the safety reporting process (Kramer, Smith, & Califf, 2012; Sherman, Woodcock, Norden, Grandinetti, & Temple, 2011). The new regulation requires that clinical investigators continue to report all serious adverse events to the sponsor, regardless of whether they are considered to be drug-related. The sponsor, in turn, is required under 21 CFR 312.32(c) to submit an expedited IND safety report to the FDA and all participating investigators within 15 days when any of the following criteria are met: (1) there has been a suspected adverse reaction that is both serious and unexpected (as defined above); (2) there are findings from other studies or animal or in vitro studies that suggest that exposure to the drug results in a significant risk to humans; or (3) there has been a “clinically important increase in the rate of a serious suspected adverse reaction over that listed in the protocol or investigator brochure.” The crux of the new rule is that sponsors should send expedited reports only for those events that the sponsor believes are causally linked to exposure to the investigational agent, rather than sending expedited reports for all events that either the sponsor or the investigator believes are even possibly linked to exposure to the investigation agent.
In contrast to the previous regulations, which permitted either the sponsor or the investigator to make causality determinations, assessment of which events are likely caused by the drug is now solely the responsibility of the sponsor, who has more complete information than the individual investigators. Additionally, more guidance is provided to help sponsors evaluate causality for adverse events and what types of reactions need to be reported. The new requirements are thus intended to reduce the excessive volumes of events being reported to FDA, investigators, and IRBs and more clearly identify which events actually have important patient safety implications (Sherman, Woodcock, Norden, Grandinetti, & Temple, 2011).
Still, it is too early to tell how sponsors will adapt to the change and to what extent the changes will succeed in their intended purpose (Kramer, Smith, & Califf, 2012). Despite the revisions that were made in the spring of 2011 (to 21 CFR parts 312 and 320), some remaining issues were raised by industry and IRB representatives at the public FDA hearing held in April, 2012. For one thing, there may be inconsistent reporting requirements. Investigators are required (under 21 CFR parts 56.108(b)(1), 312.53(d)(1)(vii), and 312.66) to report promptly “to the IRB…all unanticipated problems involving risks to human subjects or others”; however, investigators might interpret an event to be “anticipated” (and therefore not required to be submitted) on one occasion, and then might interpret the same event to be “unanticipated” at another time (Public Hearing, 2012). Another speaker expressed concern that 21 CFR part 56 is still interpreted by sponsors and investigators as requiring every investigator to send every IND safety report to the IRB, and IRBs have trouble interpreting safety data received in a “piecemeal” fashion. The speaker asked that FDA clarify sponsors’ reporting obligations. Individual investigators are also burdened by the need to act as middle men between sponsors and the IRB, which, the speaker argued, is inefficient and unnecessary (U.S. Food and Drug Administration, 2012).
4.5.3 Regulations for Multiple Jurisdictions
In addition to the federal regulations listed above, there are also state and local regulations to comply with, and the requirements may be different for each location in multi-site trials. Companies conducting trials at sites in the European Union (EU) (or other countries) are also regulated by the European Commission/EU Clinical Trials Directive (or other national regulatory authorities) (Kramer, Smith, & Califf, 2012), which may have varying guidance and regulations. The abundance of regulations at various levels and the lack of harmonization among these add a great deal of complexity to the process of conducting clinical trials (Kramer & Schulman, 2011). In interviews, sponsors listed the following areas as being particularly problematic: reporting of results, format for applications, guidance on endpoints, registration requirements, guidelines for clinical programs, biosimilars legislation, and adverse events reporting. For example, the United States and Europe differ as to who bears responsibility for ascertaining the cause of unexpected serious adverse events (SAEs). Under the new U.S. regulation, the drug sponsor is responsible for determining causality; in Europe, either the sponsor or the investigator may do so (as stated in the ICH guidelines) (Kramer, Smith, & Califf, 2012; Sherman, Woodcock, Norden, Grandinetti, & Temple, 2011).
Most industry representatives interviewed agreed that, while the International Conference on Harmonisation of Technical Requirements for Registration of Pharmaceuticals for Human Use Good Clinical Practice (ICH-GCP) guidelines (discussed in Section 4.9) and other harmonization efforts have proven helpful, the problem of differing practices and requirements across jurisdictions is far from being solved. The EU Voluntary Harmonisation Procedure (VHP) illustrates this point. In incorporating the 2001 EU Clinical Trials Directive into national laws and regulations, divergent practices emerged across member states with regard to application dates, timelines for review of clinical trial applications, content/format/language requirements, distribution of responsibilities between authorities and ethics committees, and workload among authorities (Clinical Trials Facilitation Groups (CTFG), 2010).
To address these issues, the Clinical Trials Facilitation Group (CTFG) established the Voluntary Harmonisation Procedure, which allows clinical trial applicants to electronically submit a single set of materials to one coordinator and obtain trial approval across multiple EU states at once, instead of making submissions to each country separately (Buchholzer, 2011; Krafft, Bélorgey, & Szalay, 2012). Since its introduction in 2009, the VHP has been increasingly utilized; over 140 applications had been received as of February 2012, approximately a third of which came from U.S. sponsors and most of which received a positive opinion (Krafft, Bélorgey, & Szalay, 2012). Still, despite near-universal adoption of the VHP across EU member states, many sponsors and CROs remain hesitant to use it (possibly because it is a new and unfamiliar process, and drug companies tend to adhere to traditional practices with proven track records) (Buchholzer, 2011). Furthermore, the VHP does not extend to countries beyond the EU, nor does it address harmonization concerns regarding aspects of clinical trials other than the application process.
Apart from studies spanning multiple geographic locations, lack of harmonization can also be a barrier for research that falls under the purview of multiple federal agencies. In particular, oncology research may be subject to the requirements and guidance of not only FDA, but also the Office for Human Research Protections (OHRP), the National Institutes of Health (NIH), and the Office for Civil Rights (OCR), depending on the study (U.S. Food and Drug Administration, 2012). Though efforts have been made by FDA and OHRP to harmonize guidances, some differences remain among agencies in privacy requirements, government access to records, safety reporting requirements, terminology, and conflict of interest disclosure (U.S. Food and Drug Administration, 2012). For example, while HHS lowered the monetary threshold at which significant financial interests require disclosure from $10,000 to $5,000 in 2011(National Institutes of Health, 2011), FDA’s reporting threshold is $25,000 (U.S. Food and Drug Administration, 2011b). Such inconsistencies cause confusion among investigators and make it difficult to keep abreast of the various requirements (U.S. Food and Drug Administration, 2012).
4.5.4 Conservative Regulatory Climate
Nearly all of the company representatives and experts interviewed commented on what they perceived as a particularly risk-averse regulatory climate of recent years. Many framed the problem as a disproportionate weighting of risk in the risk-benefit equation, with FDA now appearing hesitant to take on even small amounts of risk, regardless of the potential benefit to patients. Those with several years of experience in the industry observed that this conservatism is part of a cyclical pattern governed by political, Congressional, and media pressure following adverse outcomes.
In describing this perceived regulatory conservatism, many company representatives expressed frustration with FDA’s safety data demands for certain indications. For example, multiple interviewees said that many companies can no longer afford to develop drugs for diabetes because of new cardiovascular risk guidelines. In 2008, in light of published findings that the approved drug Avandia increased the risk of heart attacks, FDA issued guidance requiring that all diabetes drugs undergo a cardiovascular risk assessment lasting at least two years (Harris, 2010). Similar requirements are being considered for obesity drugs in the United States (Pollack, 2012).
While interviewees supported the goal of improving patient safety, they also encouraged consideration of the disincentives created by the new rule. They explained that it takes months to test whether a diabetes drug works to help control blood sugar levels, but it takes years and thousands of patients to determine cardiovascular risk, making clinical trials in this therapeutic class prohibitively expensive. Such barriers discourage investment by venture capitalists, and can drive sponsors to other (non-U.S.) markets or lead them to stop pursuing drugs in these classes altogether, thereby drying up the pipeline at a time when high obesity rates in the United States necessitate more treatment options (Pollack, 2012).
Drug company representatives also warn that safety requirements calling for large programs and large volumes of data can produce unexpected safety signals as a result of multiple comparisons and detection bias. Some feel that FDA is requiring too much investigation of safety pre-approval and could instead allow for more of this work to be shifted to post-marketing studies, while reserving the authority to pull the drugs off the market if these are not completed satisfactorily. Sponsors further argue that at the time of approval, FDA could simply make all information available to clinicians and their patients so that they can make their own decisions.
FDA’s exploratory IND guidance was offered by a CRO representative as another example of regulatory risk aversion. Often, in the early stages of research, there are many potential molecules a sponsor is interested in, and some human data is needed before the sponsor can decide which to pursue. FDA’s exploratory IND rule says that sponsors do not have to have all the toxicity data that they would normally need before getting started, but they can only use 1/100th of a dose in human patients (U.S. Food and Drug Administration, 2006a). The interviewee argued that 1/100th of a dose is not informative, and therefore the rule was of little practical use.
4.5.5 Lack of Clear Regulatory Pathways and Guidance for Some Therapeutic Areas
Sometimes, not having a clear idea of what FDA requires is the fault of companies, who might avoid meeting with FDA early in the process, perhaps out of fear of hearing bad news that must then be shared with their investors. However, industry representatives assert that, in many cases, much of the responsibility for failed communication and unclear expectations rests with FDA.
While the regulatory pathways for some therapeutic areas, such as oncology and cardiovascular disease, are well-established, the requirements remain much less clear for other, more “cutting edge” areas, like central nervous system disorders, metabolic diseases, and biosimilars, for which there is little in the way of precedent. In disease areas where guidelines are nonexistent, old, or otherwise lacking, sponsors find it difficult to understand what FDA expects of them before beginning their studies, and the process can result in lengthy back-and-forth discussions and negotiations with reviewers. Such a situation is both inefficient (as each individual company must take the time to seek out information or negotiate the requirements on its own) and unpredictable (as reviewers may change their minds over time).
According to one CRO representative, some drugs fall between the cracks of other regulatory pathways because they are intended to treat diseases that are exceptionally rare or sporadic. While the orphan drug pathway is appropriate for conditions affecting fewer than 200,000 patients, there are some conditions affecting only a few hundred patients that might be effectively treated with a new drug. The barriers to developing a drug for such conditions are substantial; from a regulatory perspective, it is similar to developing a drug for millions of patients, despite the fact that enrollment and other aspects of the process are much more difficult. The interviewee noted that, while there were cases in which FDA had been flexible and helped an important treatment to reach patients (e.g., Botulism Immune Globulin, or “BabyBIG”), there have been other instances where drugs have been dropped because the regulatory barriers were not adjusted. By existing rules, it seems infeasible to sponsors to test a treatment for Escherichia coli (E. coli), for example, as not enough patients can be found who become ill with hemolytic uremia to test the drug. While FDA’s Animal Rule allows sponsors to demonstrate effectiveness in animals, it has only been used a few times (e.g., anthrax).
For therapeutic areas where guidance is lacking, FDA often takes a long time to issue and update guidances. While FDA has undertaken some positive initiatives recently (e.g., starting to issue new guidances, including draft guidance for biosimilars; examining guidances for skin and pneumonia; considering guidances for unmet need pathogens; and considering new approval pathways for pathogens that would require more restrictive labeling and be for more limited populations), these processes can be very slow from industry’s perspective.
4.5.6 Barriers Related to the Review Process
The expert consultants and drug company and CRO representatives interviewed acknowledged the difficulty of FDA’s position, as the Agency faces conflicting pressures from Congress and industry and must balance the need for scientific evidence with the need for timely access to the new drug. Most respondents commented that FDA is consistently understaffed and underfunded, and the resources it does have at its disposal are stretched too thin.
Nonetheless, there were some specific concerns shared by the interviewees regarding the regulatory review process at FDA. One issue that was frequently mentioned was the perceived concentration of too much responsibility and power in the hands of individual reviewers. When most of the burden of decision-making is borne by a single reviewer, that reviewer will bear full responsibility if something goes wrong; thus, he or she might be more risk averse than a group of individuals across whom responsibility is spread evenly. Anecdotal evidence suggests that junior reviewers might be particularly risk averse, while veteran reviewers might be inflexible. Additionally, turnover among reviewers becomes problematic, as it can take quite a long time to get a new reviewer up to speed. Such a system makes company representatives feel that their outcomes are subject to the whims of the individual reviewer and his or her personal feelings about a particular drug or company. Consequently, some respondents expressed a preference for the European regulatory review system, which involves multiple academic experts to reach a scientific consensus. While the FDA does use an advisory board, the interviewees felt that it is involved too late in the process, and its authority is too weak to overrule the reviewer’s decision.
Another common grievance among interview respondents was the difficulty of getting timely feedback from FDA. Though a recent New England Journal of Medicine article found that FDA reviewed applications involving novel therapeutics faster, on average, than the European Medicines Agency (EMA) or Health Canada (Downing, et al., 2012), many sponsors interviewed by ERG felt that there was still room for improvement in the efficiency and predictability of communication. There is a perception in the industry that FDA is becoming more bureaucratic and seeking to formalize all processes--making communication increasingly cumbersome. Rather than being able to contact the relevant FDA reviewers directly, companies say they must first go through project managers, fill out written requests, and complete other intermediate steps. While investigational new drug (IND) timelines are considered acceptable (feedback is received within 30 days), receiving feedback in the post-IND or review periods can take a long time.
A final oft-repeated refrain among industry representatives is the lack of consistency among reviewers and divisions within FDA’s Center for Drug Evaluation and Research (CDER). Respondents believed there to be appreciable variability across divisions at FDA in responsiveness, scientific expertise, flexibility, and openness to meetings. For example, it was mentioned that the Division of Cardio-Renal Drug Products has a reputation for being particularly innovative and flexible relative to other divisions, while Metabolism and Endocrinology Products and Pulmonary, Allergy, and Rheumatology Products are perceived as divisions where drugs are more likely to be delayed. Interviewees indicated that there are good scientists at FDA, but they are scattered across different departments, and the overall scientific caliber of reviewers could be improved to ensure better consistency.
A newly published study by Tufts CSDD explores the issue of consistency among the various FDA drug review divisions using data on new molecular entity (NME) New Drug Applications (NDAs) and “new” Biologic License Applications (BLAs) from the period between 2006 and 2010 (Milne & Kaitin, 2012). The authors outline the various factors that contribute to disparities in regulatory experiences on both the industry side (including therapeutic area, technology turnover, investment levels, and experience/expertise of the sponsor) and FDA side (including staffing levels, organizational changes, workload fluctuations, leadership, advisory committee dynamics, and political pressures). According to the study, there are substantial differences among divisions in terms of staff, workload, approval times, rates of clinical holds ordered on commercial INDs, the percentage of products for which an advisory committee meeting is held, NDA approval rates, and other measures. Confirming what was said in our interviews with industry representatives, the Metabolism & Endocrinology and Respiratory/Rheumatology divisions were indeed found to have exceptionally high rates of clinical holds relative to other divisions.
4.6 Drug Sponsor-imposed Barriers
Drug sponsors face a number of barriers to conducting clinical research that are outside their control. However, there are also a number of barriers that drug sponsors voluntarily impose upon themselves, adding further cost and delay to the process unnecessarily. While some of these avoidable costs and delays are incurred as a result of insufficient early planning or inefficiencies in company practices, the majority of them stem from a desire to avoid failure at all costs (Kramer & Schulman, 2011).
Risk aversion leads companies to take unnecessary steps at various points throughout the clinical trial process. As one drug company representative explained, there is a “bad feedback loop”; clinical trials are so costly that companies will spend millions more to achieve small reductions in the risk of failure. Legal advisors are major drivers of these strategies, which are designed to ensure regulatory compliance and minimize liability (Kramer, Smith, & Califf, 2012). In trial design, each assumption is made conservatively, and the study ends up being overpowered. At larger companies especially, statisticians and others are insulated from the cost consequences of their recommendations, so there is less accountability; no one objects because no one wants to be responsible for failure.
The rest of this section discusses, in greater detail, the various barriers that drug sponsors impose upon themselves in their administrative, study design, data and site monitoring, and serious adverse event reporting practices.
4.6.1 Administrative
Contract negotiation and internal review are two major administrative areas where drug companies suffer from inefficiencies of their own creation. The IOM and the National Cancer Institute (NCI) have tried to generate standard contract terms so that the trickiest parts of contracts between sponsors and contractors and clinical sites would not need to be renegotiated from scratch every time; however, these have gone largely unused by drug companies. Contract negotiation delays can be exacerbated when pharmaceutical companies outsource the execution of standard contracts to subcontractors, who cannot make decisions without approval (Kramer, Smith, & Califf, 2012; Institute of Medicine Forum on Drug Discovery, Development, and Translation, Undated).
Internal review processes for organizations conducting or sponsoring clinical trials can also delay a trial’s start. For example, in the past, Bristol-Myers Squibb needed 8 months and 34 internal review cycles to develop and activate a new protocol. The company has recently made an effort to streamline this process and shorten it to about five months (English, Lebovitz, & Giffin, 2010).
4.6.2 Study Design
Enrollment Restrictions
In trying to create a pure scientific experiment and thereby maximize likelihood of drug approval, sponsors may restrict enrollment using restrictive eligibility criteria that may exclude, for example, patients on other medications or with comorbidities. This practice may be reasonable in the early phases of the study to distill the effect of the drug, free of confounding influences; however, when these restrictive criteria are carried over to later phases of the trials, they make it even more difficult to find a sufficient number of participants and consequently protract the recruiting process (Kramer, Smith, & Califf, 2012). To illustrate the enrollment implications of this increased stringency, a 2010 study by Tufts CSDD reported that 48 percent of patients screened for clinical trials actually completed the trials in the period between 1990 and 1999, while only 23 percent of patients screened in the 2000-2009 period completed them (Kramer, Smith, & Califf, 2012).
Aside from hampering recruitment, the restrictions on participant eligibility also raise scientific concerns, as the new drug might not be adequately studied on relevant patient populations, such as people with common comorbidities. For example, the cardiovascular risks associated with the arthritis drug rofecoxib were established as the sponsor pursued a possible new indication for the drug, not in the course of a systematic study of arthritis patients with concomitant cardiovascular disease (Kramer, Smith, & Califf, 2012). This issue is discussed further Section 4.7.
Complex Clinical Trial Protocols
Clinical trial protocols, which outline the trial methodology, are becoming increasingly complex, involving more assessments, exploratory endpoints, biomarkers, biopsies, etc., and increasing the administrative burden of trials. A study of over 10,000 industry-sponsored clinical trials found that the quantity and frequency of trial-related procedures (e.g., laboratory tests, patient questionnaires) per protocol has increased increased by 6.5 percent and 8.7 percent per year, respectively, during the time period between 1999 and 2005(Getz, Wenger, Campo, Sequine, & Kaitin, 2008). A separate study of 57 Phase 1–Phase 3, industry-created research protocols found that the average total number of protocolrequired procedures increased from 90 for the time period between 1999 and 2002 to 150 for the time period between 2003 and 2005; the average number of inclusion criteria increased from 10 in 1999 to 26 in 2005, and the average case report form expanded from 55 pages in 1999–2002 to 180 in 2003–2006 (Kramer, Smith, & Califf, 2012).
Case Report Forms (CRFs)
A case report form (CRF) is a tool used by investigators to collect data for each participant throughout the trial. More complex CRFs including many data points can significantly increase trial monitoring and other costs (e.g., storage of samples) (English, Lebovitz, & Giffin, 2010), perhaps unnecessarily if the data being collected are not relevant to the specific study. According to experts and industry representatives interviewed, sponsors almost always capture more data than they eventually use in their FDA submissions, and sometimes this extra data even confounds study results. Though the percentage of data collected that ultimately goes unused varies by trial, interviewees estimated that it is anywhere from 10 to 30 percent, and a recent study by Kenneth Getz and others at Tufts CSDD found that 22.3 percent of all clinical trial procedures are considered to be non-core (17.7 percent of Phase 2 procedures and 24.7 percent of Phase 3 procedures). According to that study, which used clinical data from Medidata, 18 percent—or approximately $1.1 million—of a typical study budget is being spent on procedures for supplementary secondary, tertiary, and exploratory endpoints, while another $1.3 million (22 percent) is spent on procedures supporting regulatory compliance (Tufts CSDD, 2012). These findings confirm anecdotal evidence cited in an earlier article by Kenneth Getz, which reported that sponsors estimate that between 15 and 30 percent of all clinical data collected is not used in NDA submissions, costing an additional $20 to $35 million in direct drug development costs for the average drug (Getz K. A., 2010b).
The reasons given by interviewees for collecting this extra data were many and varied. Researchers tend to be overly inclusive, as they are scientifically-minded individuals who want to be able to answer the main question and test other theories, as well. Some of the extra data are needed when the clinical value of some endpoints is uncertain. Moreover, companies tend to collect what they have always collected in the past and simply add new items as needed, without reconsidering whether the old measurements are necessary (Getz & Campo, 2013). FDA reviewers, for their part, might have grown accustomed to seeing the “usual” data points, such as hematology and other general health measures, even if they are nonessential to the study. Some data are collected in part to satisfy payers and providers (e.g., quality of life measurements and other patient-centric measurements). Finally, companies may solicit input from “key opinion leaders” (KOLs) on protocol design, and, while KOLs are practitioners and experts in their disease areas, they may be less well versed in study design and the specific data points that are needed for FDA approval.
Some of the individuals interviewed expressed the opinion that collection of extra data is unavoidable due to the nature of the process; clinical trials represent research under uncertain conditions, and at the time when they are making data collection decisions, study designers do not know for sure what they will need. Some also argued that the data being collected are not actually superfluous because there is always need for the data on file, not because FDA is mandating it, but because it is supportive and reasonable to collect.
Other respondents felt data collection—or at least data collection costs—could be reined in through various means. For example, some of the data can be collected at lower-cost facilities, such as local clinics and pharmacies, reducing the need for infrastructure and overhead. Companies can also be more practical in their planning and streamline their studies by minimizing the number of research questions they seek to answer in a single trial. One respondent said the ideal scenario would be for sponsors to conduct large, simple trials that make use of information that already exists in patients’ electronic health records (EHR) rather than collecting lots of redundant data themselves. In fact, FDA recently published guidance on best practices for conducting and reporting on pharmacoepidemiologic safety studies that use electronic healthcare data sets (including administrative claims data and electronic medical record (EMR) data), acknowledging the potential for new technologies and statistical methods to allow for easier study of safety issues, particularly in situations where observational studies/clinical trials are infeasible (U.S. Food and Drug Administration, 2011a). Some respondents also called for more flexibility on the part of FDA; for example, drugs can be approved without mortality data with the requirement that post-marketing data be collected to demonstrate safety. The drug can later be withdrawn from the market if there are concerns.
Still, there are hurdles to implementing some of these ideas. While the use of administrative databases sounds promising, in reality, researchers always fear the “what-ifs” and collect more data “just in case.” Data sufficiency concerns can be crippling to the development timeline, especially if another clinical trial is required, and researchers are over-cautious as a result. Furthermore, with regard to post-market data collection, several respondents noted that FDA is justifiably worried about the problematic history of pharmaceutical company promises about post-marketing clinical trials, as some companies have drawn out the process of designing post-market clinical trials for many years. Lastly, efforts to simplify data collection are presently hindered by the lack of standardized electronic CRFs that can be used by all researchers across the industry (still, progress is being made; efforts to develop a library of standardized oncology CRFs are already underway) (English, Lebovitz, & Giffin, 2010).
Protocol Amendments
Clinical trial protocols often need to be amended after they have been finalized and approved, a process which can be costly and time-consuming, but also preventable. Using data provided by 17 midsized and large pharmaceutical and biotechnology companies, a recent study conducted by Tufts CSDD analyzed the types, frequency, causes, and costs of nearly 3,600 protocol amendments from 3,410 protocols. The study found that nearly 60 percent of all trial protocols require amendments, a third of which are avoidable through better initial planning and participant recruitment.13 Completed protocols across all clinical trials were found to incur 2.3 amendments on average, with each amendment requiring an average of 6.9 changes to the protocol and causing substantial unanticipated costs and delays. Onethird of all amendments are related to protocol description and patient eligibility criteria; other change categories include dosage/administration, statistical methods, and trial objectives. Across all phases, 43 percent of amendments occur before any patients are enrolled, with amendments more likely to occur in Phase 1. The median time to resolve a protocol problem is 65 days (65 days multiplied by 2.3 amendments equals four to five months of lost time) (Getz, et al., 2011; Tufts CSDD, 2011).
According to the CSDD study, it cost an average of $453,932 to implement each individual protocol amendment. This total is comprised of the following direct costs associated with implementation of an amendment: increased study grants/site fees ($265,281); contract change orders to existing contracts ($109,523); new contracts with providers ($69,444); additional drug supply ($5,300); and IRB fees ($4,384). It does not include the cost of internal time dedicated to implementing each amendment, costs or fees associated with protocol language translation, and costs associated with resubmission to the local authority, nor were any indirect costs (e.g., of development or commercialization delays) estimated. It is also important to note that cost data were only available for 20 of the amendments in the sample; therefore, these cost estimates are highly prone to bias and “should be viewed with caution” (Getz, et al., 2011).
The most common causes of amendments were found to be availability of new safety information (19.5 percent), requests from regulatory agencies to amend the study (18.6 percent), changes in the study strategy (18.4 percent), protocol design flaws (11.3 percent), and difficulties recruiting study volunteers (nine percent). Less common causes include errors/inconsistencies in the protocol (8.7 percent), availability of new data (7.1 percent), investigator/site feedback (4.5 percent), changes in the standard of care (1.9 percent), and manufacturing changes (one percent). In general, protocols with longer treatment durations had a higher incidence of amendments. Among therapeutic areas, cardiovascular and gastrointestinal protocols had the highest incidence of amendments and changes per amendment (Getz, et al., 2011). One of the study’s authors, Kenneth Getz, believes protocol amendments will continue to be prevalent, as the mean number of amendments was found to be positively and significantly correlated with the increasing number of procedures per protocol, study length, and number of investigative sites involved in each clinical trial (Tufts CSDD, 2011).
When asked about protocol amendments, many representatives from smaller drug companies indicated that they regarded them as “just a cost of doing business” or a “necessary evil” that “comes with the territory.” Large companies, by contrast, seemed to have done more internal analysis of their own protocol amendment costs and set goals to lessen their frequency. One large company representative confirmed that the Tufts study estimate of $453,932 per amendment (on average) is accurate or possibly even conservative because it does not include all associated costs. Analysis of that company’s own protocol amendments found that roughly half could be categorized as “avoidable” and the other half as “unavoidable.” Another large company representative estimated the cost per amendment to be $500,000 to $1 million (including implementation costs), depending on what is involved, as some changes require costly new training or equipment, or add a whole new arm to the study and are therefore more expensive.
Failure to Integrate Study Design with Clinical Practice Flow
Industry sponsors generally do not involve site investigators in the protocol design process. As a result, the required procedures outlined in the protocol might not be easy to smoothly integrate into clinical practice at the sites (Kramer, Smith, & Califf, 2012). A CRO representative interviewed provided examples: for instance, a protocol could require that magnetic resonance imaging (MRI) and a series of neurocognitive tests be performed within three days of each other at a site that does not have sufficient access to an MRI machine; or, a protocol might require a series of labs that are highly specialized and cannot be done by the site in house. Better planning and conferring with site investigators during the protocol design phase can help trials to avoid hitting foreseeable logistical snags such as these.
13 This study was based on data collected from seventeen midsized and large pharmaceutical and biotechnology companies: Amgen, Astellas, AstraZeneca, Biogen Idec, Cephalon, Forest, Genentech, Genzyme, Lilly, Merck, Millennium, Otuska, Pfizer, Roche, Schering-Plough, Sepracor, and Takeda. Data from 3,410 protocols were collected across various therapeutic areas, yielding information on 3,596 amendments containing 19,345 total protocol modifications. The study defines amendments as “any change to a protocol requiring internal approval followed by approval from the IRB, ERB, or regulatory authority. Only implemented amendments—that is, amendments approved both internally and by the ethics committee— were counted and analyzed in this study.”
4.6.3 Data and Site Monitoring
Data and site monitoring costs are another key barrier that is largely self-imposed by sponsors. In general, industry-sponsored trials are monitored by individuals who visit sites at intervals defined by their company standard operating procedure (SOP) or study-specific monitoring plan. The pharmaceutical industry estimates that monitoring can account for 15 to 30 percent of total trial costs (Davis, Nolan, Woodcock, & Estabrook, 1999). It is common practice in the industry to conduct site visits frequently (every 4-8 weeks), and source data verification (SDV)—the process of ensuring that the reported trial data are complete and consistent with study subject source records—consumes quite a bit of time during these visits (Usher, 2010; Tantsyura, et al., 2010).
One particularly costly practice is 100 percent SDV. FDA regulations do not require study monitors to check every single source data point at every investigative site, but risk aversion and a conservative interpretation of the regulations has resulted in 100 percent SDV becoming the industry standard (Korieth, 2011). Seeking to avoid negative outcomes of rigorous site inspection audits (which could threaten drug approval), sponsors have voluntarily borne the extremely high costs of 100 percent SDV by on-site monitors in multicenter trials (Kramer, Smith, & Califf, 2012). Eighty-two percent of pharmaceutical industry sponsors reported always verifying CRF data against source data. By contrast, only half of academic/government/cooperative organizations reported always doing so (Morrison, et al., 2011). A 2008 study found that, on average, SDV consumes one-third of companies’ entire Phase 3 trial budget (Getz K. A., 2011a). Because the cost of SDV depends on the size of the study and the complexity of the protocol, the overall trend toward larger, more complex studies is making it increasingly expensive and logistically difficult to check every data point at every site (Korieth, 2011).
Despite its high cost, there is no evidence to suggest that 100 percent SDV significantly improves data quality or likelihood of drug approval (Kramer, Smith, & Califf, 2012). There are a number of possible explanations for this. First, resources are often expended to verify data that is largely or completely irrelevant to study outcomes, such as vital signs or other health information that is not central to the study. Second, it is not likely that drugs will fail to get approval because of SDV issues; there are much more critical areas of concern, such as protocol violations. Third, 100 percent SDV does not even ensure 100 percent accuracy; for a human manually looking for errors, the error rate is 15 percent (meaning the process is only 85 percent accurate) (Korieth, 2011; Society for Clinical Data Management, 2005). Fourth, this approach may lead to the detection of some types of errors (e.g., transcription mistakes), but it does not prevent other data integrity problems (e.g., transcription errors within the source document itself, fraud, misreporting of data by the study participant) (Tantsyura, et al., 2010).
Given its enormous costs and the lack of evidence supporting the value of 100 percent SDV, some industry representatives recommend a shift to partial or risk-based monitoring approaches; however, there are key barriers that must first be overcome. The pervasive risk-aversion in the industry is perhaps the biggest obstacle to the adoption of more efficient monitoring practices. There are not yet wellestablished processes or controls for partial or risk-based monitoring, and drug companies are hesitant to change their practices without FDA guidance on what is acceptable. Even though FDA has released draft guidance (in August 2011) on risk-based monitoring approaches (U.S. Food and Drug Administration, 2011c), it is likely that some companies will still continue doing what they have done traditionally because it has proven successful in the past. There are also practical hurdles; the most commonly used EDC and electronic clinical trial systems were designed to support 100 percent SDV, so technology vendors must change their systems so that they permit partial SDV before such approaches can be widely adopted by industry (Korieth, 2011).
If these barriers can be overcome, the savings for drug sponsors would be enormous. A 2010 study published in the Drug Information Journal found that sponsors could save up to 23.5 percent on Phase 3 oncology study costs by cutting SDV to 50 percent and reducing monitoring frequency accordingly from 6- to 10-week periods (Tantsyura, et al., 2010). The Phase 2 savings are estimated at 16.7 percent. For a cardiology study, the Phase 2 and Phase 3 savings are estimated at 11.6 percent and 14.3 percent, respectively. These cost reductions are a function of reduced per-page review time and reduced number of site visits by monitors, which mean fewer hours spent by monitors on-site and reduced travel expenses (Tantsyura, et al., 2010). “The potential savings are approximately three to four billion dollars in the U.S. alone,” said Vadim Tantsyura, the study’s author and the director of data management for Infinity Pharmaceuticals (Korieth, 2011).
It is also worth noting that several sponsors have yet to make the transition from paper-based studies to use of EDC technologies. Though EDC has been gaining ground, the perception that “everyone uses EDC now” is inaccurate; as of 2007, EDC was used in approximately 50 percent of new trials (Neuer, Warnock, & Slezinger, 2010), and the issues surrounding reliance on paper records were still being raised in the April 2012 FDA hearing on modernizing clinical trials. Moving away from paper results in reduced paper handling costs and allows for fewer site-monitoring visits and easier query resolution (Neuer, Warnock, & Slezinger, 2010). It also eliminates inefficiencies arising from transcription of data from paper to electronic format (U.S. Food and Drug Administration, 2012). Though the longer-term cost and time savings that are achievable through adoption of EDC are substantial, the upfront cost of the EDC system is a key barrier for companies (especially smaller companies) considering the switch (Neuer, Warnock, & Slezinger, 2010).
4.6.4 Serious Adverse Events (SAEs) Reporting for Investigational New Drugs and Biologics (INDs) (21 CFR 312)
Legal advisors have traditionally encouraged sponsors to be nonselective in their reporting of unexpected SAEs to avoid any suspicion among regulators that they were withholding information (at least prior to March 2011, when a new drug safety reporting regulation was implemented) (Kramer, Smith, & Califf, 2012). In situations where drug sponsors are uncertain as to which events must be reported, they are inclined to err on the side of over-reporting rather than under-reporting. Possible areas of ambiguity or excess burden related to the safety reporting regulations themselves are discussed in Section 4.5.
4.7 Disconnect Between Clinical Research and Medical CARE
Janet Woodcock, director of CDER, identified the separation between clinical research and clinical practice in the United States as one of the most serious problems with the current clinical research enterprise (English, Lebovitz, & Giffin, 2010). The problem is a multi-faceted one that also serves to reinforce many of the barriers discussed in other sections, such as shortages of investigators and patients, high costs, and lengthy timelines.
One aspect of this problem is the lack of involvement of community physicians in the clinical research process (English, Lebovitz, & Giffin, 2010). Most U.S. health systems and clinical practice sites do not include research as part of their mission (Kramer, Smith, & Califf, 2012); thus, there are fewer physician referrals of patients to clinical research studies and fewer investigators available to conduct the research than there might be otherwise. This also means that research findings are less likely to be adopted by such physicians in their regular practice (English, Lebovitz, & Giffin, 2010). Many health care professionals do not receive training in research methods (Bonham, Califf, Gallin, & Lauer, 2011) and have difficulty understanding research results and therefore applying them (Kramer, Smith, & Califf, 2012) (discussed in greater detail in Section 4.8).
Apart from issues of mission and training, there exist some disincentives for clinicians to participate in research. The U.S. system is one that encourages physicians to focus on efficiency and profitability, and discourages clinical research for being risky, time-consuming, and costly (Kramer, Smith, & Califf, 2012). Furthermore, although participation in pharmaceutical industry-sponsored clinical trials can be an attractive way for physicians to supplement their incomes (Ashar, Miller, Getz, & Powe, 2004), there is a great deal of scrutiny of doctors who work with pharmaceutical companies, due in part to media attention to conflict of interest cases. Any gifts or other “freebies” doctors receive from drug companies must be reported according to the Physician Payment Sunshine provision under the Patient Protection and Affordable Care Act, and several states have additional rules governing physicianindustry relations (Milne C. , 2012). While these safeguards against conflicts of interest are important, they have the unfortunate side effect of contributing to what some industry representatives described as a prevailing attitude of suspicion toward physician involvement in industry-sponsored clinical research. Such an atmosphere can dampen the appeal of the financial incentives provided by pharmaceutical companies and discourage physicians from participating in trials.
The separation between clinical research and clinical care in the United States also produces data collection inefficiencies, as some of the data that are routinely collected in the course of clinical trials overlap with data collected for the purposes of clinical care. Integration of clinical care and clinical research datasets would eliminate redundancies in data collection, help researchers to identify potential study participants, and offer other efficiency gains. However, at present, such integration is hindered by the lack of standard nomenclature and blend of incompatible paper and electronic data collection systems used in clinical care/billing and clinical research (Kramer, Smith, & Califf, 2012; Califf & Muhlbaier, 2003).
4.8 Barriers at Academic Institutions
There are cases in which drug sponsors might find it appealing or necessary to use academic institutions as trial sites. For instance, sponsors might seek to employ key opinion leaders who are affiliated with a particular institution, or they may be studying a very specialized disease area for which patients can only be found in sufficient numbers at certain universities, medical schools, or other academic sites. Despite these benefits, many aspects of academic institutions are not conducive to efficient and successful clinical research.
Academic institutions have a reputation for taking their ethical and regulatory oversight responsibilities to extremes and creating bureaucratic entanglements that add months to clinical trial timelines (Kramer, Smith, & Califf, 2012; Dilts & Sandler, 2006). A recent study found that the number of steps necessary to open a clinical trial at academic centers was over 110, in contrast to fewer than 60 steps at non-academic centers. The number of approval signatures needed ranged from 11 to 27, compared to a maximum of 11 at non-academic centers (Dilts & Sandler, 2006). For multi-site trials, sponsors and CROs must negotiate contracts individually with each participating institution, and, in a study of 218 trials at academic institutions, the mean time taken for grants and contracts approval was 100 days (which is even longer than IRB review takes, at 69 days) (Kramer, Smith, & Califf, 2012; Dilts & Sandler, 2006).
Though it does not take up as much time as the grants and contract approval process, obtaining ethical approval is another source of frustration for drug sponsors working with academic institutions. As discussed in Section 4.5, use of central IRBs can greatly improve the efficiency of this process; however, academic institutions are often unwilling to defer to these central IRBs. While one pharmaceutical company representative was optimistic that this reluctance was beginning to fade for the sake of staying competitive with other sites, there are other factors that might be difficult to overcome. For one thing, academic institutions have already invested in developing their own internal IRBs (as well as the electronic systems required for protocol submissions to those IRBs), so officials at those institutions will likely be hesitant to let those investments go to waste and lose financial support to a central IRB (Kramer & Schulman, 2011). Another interviewee explained that academic institutions are concerned about relinquishing their responsibility without also being relieved of some of their liability.
Aside from the regulatory and administrative roadblocks, many academic medical centers undervalue or fail to provide incentives for clinical research. There is a perception that clinical research is less intellectually rigorous than basic research. Moreover, many academic institutions do not inculcate in their students, trainees, and faculty a sense of professional obligation to generate new medical knowledge as part of clinical practice. As a result, faculty engaged in clinical research struggle for resources in the academic setting and face special challenges in achieving academic promotion and tenure. Students observing their struggle are less likely to choose the clinical research career path (Kramer, Smith, & Califf, 2012).
A related issue is the failure of academic medical curricula at the graduate and undergraduate levels to encourage fundamental principles of clinical research. Even training designed for investigators neglects research principles in favor of an emphasis on strict compliance with standard operating procedures (Kramer, Smith, & Califf, 2012). Those studying to be physicians are not adequately trained in advanced statistical methods to interpret clinical trial results (even at the level at which they are reported in medical journals), impairing their ability to use such results to inform their clinical care and practice evidence-based medicine (Kramer, Smith, & Califf, 2012; Horton & Switzer, 2005). For example, in a survey of 367 residents from 11 programs, only 37.4 percent knew how to interpret an adjusted odds ratio from a multivariate regression analysis. Seventy-five percent of survey respondents said they did not understand all the statistics they saw in journal articles, but the vast majority felt it was important to be familiar with the concepts in order to understand the literature (Kramer, Smith, & Califf, 2012; Windish, Huot, & Green, 2007).
4.9 Barriers Related to the Globalization of Clinical Research
Another significant barrier to conducting clinical trials in the United States is competition from sites in other countries; indeed, the clinical research footprint is shifting overseas. The number of active, FDA-regulated investigators based outside the United States has grown by 15 percent each year since 2002, while the number of U.S.-based investigators has fallen by 5.5 percent annually (Getz K. A., 2007). A recent study of industry-sponsored Phase 3 clinical trials for the 20 largest U.S.-based pharmaceutical companies found that approximately one third of the trials are being conducted entirely outside the United States and that over half of all study sites are located in other countries. The number of non-U.S. countries being used as trial sites more than doubled between 1995 and 2005, while the proportion of trials conducted in the United States and Western Europe decreased (Glickman, et al., 2009).
There are a number of factors driving this geographical shift. First, significant cost savings are possible, particularly in developing countries (Bailey, Cruickshank, & Sharma; Glickman, et al., 2009). One pharmaceutical company representative reported that a top-tier academic medical center in India charges around $1,500 to $2,000 per case report, which is less than a tenth of the cost at a second-tier center in the United States (Glickman, et al., 2009). Human labor accounts for much of the cost of clinical research, and salaries for physicians, nurses, and study coordinators in developing countries are lower than they are in the United States and other high-income countries (World Health Organization, 2006). Payment to clinical trial sites is also lower elsewhere than it is in the United States, and U.S.- based clinical trials are not as cost-effective (in terms of cost per patient visit) as trials based in other countries (English, Lebovitz, & Giffin, 2010).
Second, shorter timelines, due largely to faster recruitment, are also possible outside the United States. Countries such as China, India, and Russia have large potential patient pools that can help accelerate the otherwise time-consuming recruitment process (Bailey, Cruickshank, & Sharma; Glickman, et al., 2009). One industry representative said participants could be found in India in approximately half the time it takes to recruit in the West (Rai, 2005). For some diseases, such as malaria, sufficient numbers of patients can only be found in other countries (GlaxoSmithKline, 2011). Ultimately, U.S. investigators enroll only two-thirds as many patients as investigators elsewhere (English, Lebovitz, & Giffin, 2010).
Third, conducting trials in other countries allows drug sponsors to access more commercial markets for the drug they are testing. Increasingly, foreign regulatory agencies are demanding that drugs be tested on their own populations before they will allow the drug to be registered in their country; thus, sponsors conduct trials in those countries to fulfill those demands (Schmidt, 2001).
Fourth, conduct standards and intellectual property protection have improved in foreign countries, making these sites more attractive than they have been in the past. A key driver of this improvement has been the widespread adoption of the ICH Technical Requirements for Registration of Pharmaceuticals for Human Use Good Clinical Practice (ICH-GCP) guidelines (Bailey, Cruickshank, & Sharma; Glickman, et al., 2009; Schmidt, 2001; International Conference on Harmonisation of Technical Requirements for Registration of Pharmaceuticals for Human Use (ICH), 1996). The ICH-GCP guidelines establish a set of universal principles to which all clinical trials should adhere, including requirements to follow ethical standards, ensure scientific soundness, preserve the rights and safety of trial subjects, and maintain confidentiality of records, among others (Kramer, Smith, & Califf, 2012).
Fifth, the regulatory environment in wealthy countries, including the United States, has become increasingly burdensome to drug sponsors (Glickman, et al., 2009). More detailed discussion of regulatory barriers can be found in Section 4.5.
Given the factors listed above, it is easy to understand why drug sponsors might decide to shift part or all of their clinical research operations overseas. However, in doing so, they create a new set of potential scientific, ethical, and practical problems. From the standpoint of U.S. clinical care, there is concern that results from trials conducted in other countries may not be generalizable to the U.S. population. Indicators of standards of care for a particular site or country often are not reported, so it is difficult to tell whether different places are really comparable (Glickman, et al., 2009). Furthermore, some diseases may go untreated or undertreated in developing countries, making it easier to find trial participants whose outcomes will not be complicated by prior medications. Such patient populations are not representative of the types of people who would be using the drug in higher income countries, more specifically, patients for whom previous treatments have failed (Glickman, et al., 2009). Finally, geographically dispersed populations may have genetic differences that cause them to respond differently to drugs. Thus, a U.S. patient might have a different reaction to a drug compared to a patient from Asia or Eastern Europe, for example. These genetic differences are often not accounted for in study design or reporting of results (Glickman, et al., 2009).
Aside from the scientific concerns, conducting trials in other countries can also be ethically challenging. This is especially true in developing countries, where research involving human subjects is complicated by factors such as lack of education, poverty, and low health care standards. Participants may not fully understand the trial process or their role, or they may feel compelled to participate by the promise of financial compensation or access to health care that might otherwise be outside their reach (Glickman, et al., 2009). Beyond the generalizability concerns discussed above, it is also ethically questionable to conduct trials in places that are not intended to be major markets for the drug being studied (Glickman, et al., 2009). Lastly, there is a lack of transparency with regard to clinical research in many developing countries. The International Committee of Medical Journal Editors created the “Uniform Requirements for Manuscripts Submitted to Biomedical Journals: Writing and Editing for Biomedical Publication” (International Committee of Medical Journal Editors, 2010), but investigators in developing countries tend to be less well-versed in these guidelines and less experienced, which can be a barrier to obtaining trial data and publishing results (Glickman, et al., 2009).
Practically speaking, conducting trials at multiple sites across different countries magnifies the barriers associated with multicenter trials, including lack of harmonization among regulations across multiple jurisdictions and difficulties in enforcing consistency in protocol across multiple trial sites. Further discussion of these types of barriers can be found in the previous sections.
5 Analysis of Barriers to Clinical Trials
Using information gathered in the literature searches and drug sponsor interviews, we developed a list of potential approaches to reducing or eliminating many of the barriers discussed above. This list of strategies to mitigate barriers was then further refined based on discussions with the working group. In order to select a set of barriers/alternatives to analyze, the working group considered whether each proposed strategy could be alleviated by policies, whether the appropriate policies could be implemented or encouraged by FDA, and whether there was evidence in the literature that could be used to quantify the potential impacts of those policies on clinical trial costs. Based on these criteria, we selected the following barrier mitigation strategies for analysis:
- Use of electronic health records (EHR)
- Looser trial enrollment restrictions
- Simplified clinical trial protocols and reduced amendments
- Reduced source data verification (SDV)
- Wider use of mobile technologies, including electronic data capture (EDC)
- Use of lower-cost facilities or at-home testing
- Priority Review/Priority Review vouchers
- Improvements in FDA review process efficiency and more frequent and timely interactions with FDA
In the context of the clinical trials decision-making framework described above, the barriers can be thought of as those factors that contribute to the cost of each event node and/or those that affect the probability of success. All of the barriers discussed previously ultimately increase the total cost of clinical trials, thus reducing the eNPV of drug development from the point of view of the drug sponsor. In the clinical trials cost model, implementation of policies to alleviate these barriers is captured in the form of reduced clinical trial costs, reduced duration, or changes to other relevant parameters. Within the model interface, users have the option to select one or more approaches from the above list to see the impact on expected trial costs. In general, if the multiple strategies selected impact the same cost parameters, the effects are assumed to be additive, meaning that the associated percentage reductions are summed and then applied to the default values. The individual barrier mitigation strategies and their impacts on model parameters are discussed in further detail below.
Our estimates of the impacts of each approach are based on data available in the published literature and may therefore omit certain other impacts where data do not exist. In the detailed descriptions of each strategy below (Table 3), we discuss the impacts on model parameters that we were able to quantify using published estimates and also list any other parameters that are likely to be impacted but for which we do not have a basis to estimate the magnitude of effect. Given these data limitations, it is therefore necessary to note that the impacts of each strategy on clinical trial costs are likely to be underestimates.
Table 3: Barrier Mitigation Measures and Associated Modeling Approach for Analysis
| Barrier Mitigation Measures | Approach to Modeling | Notes/Sources |
|---|---|---|
| Encourage more widespread use of electronic health records (EHR) for clinical research purposes |
| Notes: Adoption rate of 16% in 2009 has been used to adjust the percentages/effects reported in the literature. Source: U.S. Department of Health & Human Services, 2012; Deloitte, 2009. |
| Encourage sponsors to carefully consider their trial enrollment restrictions |
| Source: Getz, 2008. |
| Encourage sponsors to simplify clinical trial protocols and plan carefully to avoid costly amendments, whenever possible; ensure that they have a clear understanding of what is required by FDA and what is superfluous |
| Source: Tufts, 2012; Getz, 2010b; Getz, 2008. |
| Engage sponsors in discussions on the topic of data and site monitoring to ensure that they are aware of the FDA guidance stating that 100% source data verification is not required |
| Notes: Adoption rates by phase and therapeutic area used to adjust effects. Sources: Tantsyura, et al., 2010; Medidata |
| Encourage sponsors to make wider use of mobile technologies, centrally available data to evaluate site performance, electronic data capture (EDC), and other efficiency-improving options |
| Notes: Adoption rate of 50% in 2007-2008 has been used to adjust the percentages/effects reported in the literature. Source: Neuer, Warnock, & Slezinger, 2010. |
| Encourage sponsors to utilize lower-cost facilities (such as local clinics and pharmacies) or athome testing for data collection purposes whenever possible |
| Source: Shapiro, 2008; Marks & Power, 2002. |
| Grant developers of treatments for neglected diseases a “priority review voucher” |
| Source: Ridley, Grabowski, & Moe, 2006. |
| Conduct internal reviews of efficiency within the FDA and make improvements where possible (also engage in more frequent and timely interactions with industry) |
| Source: U.S. Food and Drug Administration, 2012c. |
5.1 Use of Electronic Health Records (ehr)
In the context of clinical research, electronic health records (EHR) can help physicians to quickly locate patients that meet the inclusion/exclusion criteria for participation in trials and thereby make it easier for them to generate referrals and enrollments. For example, one EHR-based approach that has been utilized is a clinical trial alert (CTA) system, which is designed to notify physicians of ongoing trials and their patients’ potential eligibility (if patients’ EHRs indicate that they meet selected trial criteria). One study found that the CTA intervention at The Cleveland Clinic in Cleveland, Ohio, contributed to a 10-fold increase in physicians’ referral rate and a doubling of their enrollment rate (Embi, et al., 2005).
To translate these recruitment benefits to impacts on parameters in our trial cost estimation model, we consulted a 2009 report produced by Deloitte on secondary uses of EHR data in life sciences, which includes an illustrative example of the potential benefits of integrating EHR with drug development. According to the report, use of EHR data and patient alerts reduces the attrition rate by 50 percent (Deloitte, 2009), which would reduce the number of patients that must be initially recruited. In the example, 2,000 patients are enrolled in anticipation of a 25 percent attrition rate. The target number of patients is therefore 1,500. If the attrition rate is reduced by 50 percent (to 12.5 percent), sponsors only need to enroll 1,714 patients to end up with the same number of patients (1,500) for the trial. This amounts to a 14.3 percent reduction in the number of patients that must be enrolled (relative to 2,000).
Additionally, the 2009 Deloitte report cited previous studies indicating that EHR can drive a 28 percent increase in eligible patient identification and a doubling of monthly patient enrollment rates. We translated these figures to a reduction in patient recruitment costs of roughly 30 to 50 percent and settled on a midpoint of 40 percent. While it is also possible that EHR could impact patient retention and associated per-patient costs, it was not clear from the literature how one might adjust those costs (aside from reducing the number of patients by which they were multiplied). Depending on how EHR is used, it may also contribute to lower data collection costs, but these effects are also yet unquantifiable.
As EHR is already used to some degree in clinical research, it is necessary to adjust our estimated impacts by the appropriate rate of adoption. In other words, the cost data we have from Medidata already reflect the fact that some use of EHR is already taking place; therefore, the average percentage reduction in costs resulting from wider use of EHR will not be as high as it would be if it were not yet being used at all. According to a figure reported by HHS in a news release, the EHR adoption rate was 35 percent in 2011, up from 16 percent in 2009 (hospital settings) (U.S. Department of Health & Human Services, 2012). As our data from Medidata spans the period between 2004 and 2012, we chose to use the 16 percent adoption rate from 2009 to adjust our estimates because it is closer to the midpoint of the time period covered by our data and therefore more likely to approximate the average adoption rate across all trials observed for our cost model. Having made this adjustment, we arrive at a 12.3 percent reduction in the number of patients that must be enrolled and a 35.9 percent reduction in patient recruitment costs (per patient).
Table 4 below provides estimates of expected reductions in per-study costs by phase and overall due to EHR adoption in clinical research across the different therapeutic areas.
Table 4: Projected Impacts of EHR Use on Clinical Trial Costs (in $ Millions and in Percentages), by Therapeutic Area and Phase [a]
| Therapeutic Area | Phase 1 | Phase 2 | Phase 3 | Phase 4 | ||||
|---|---|---|---|---|---|---|---|---|
| $ | % | $ | % | $ | % | $ | % | |
| Anti-Infective | -$0.3512 | -8.27% | -$0.5841 | -4.11% | -$1.4161 | -6.21% | -$0.8032 | -7.31% |
| Cardiovascular | -$0.1251 | -5.78% | -$0.3866 | -5.51% | -$1.8534 | -7.35% | -$0.7256 | -2.61% |
| Central Nervous System | -$0.2657 | -6.78% | -$1.1428 | -8.24% | -$1.6784 | -8.72% | -$0.7480 | -5.29% |
| Dermatology | -$0.0940 | -5.25% | -$0.4070 | -4.59% | -$0.7127 | -6.22% | -$1.2045 | -4.77% |
| Endocrine | -$0.0588 | -4.09% | -$0.6910 | -5.73% | -$0.9985 | -5.89% | -$1.3281 | -4.97% |
| Gastrointestinal | -$0.1151 | -4.81% | -$1.0225 | -6.46% | -$1.2706 | -8.78% | -$0.8899 | -4.08% |
| Genitourinary System | -$0.1984 | -6.43% | -$0.8104 | -5.55% | -$1.1488 | -6.55% | -$0.2666 | -3.92% |
| Hematology | -$0.0244 | -1.43% | -$0.6043 | -3.09% | -$0.4642 | -3.09% | -$0.8521 | -3.16% |
| Immunomodulation | -$0.4476 | -6.82% | -$1.0503 | -6.57% | -$0.6348 | -5.34% | -$1.2160 | -6.14% |
| Oncology | -$0.3026 | -6.74% | -$0.6828 | -6.08% | -$1.1523 | -5.21% | -$2.8862 | -7.43% |
| Ophthalmology | -$0.4602 | -8.62% | -$0.9634 | -6.98% | -$2.2501 | -7.32% | -$0.9463 | -5.39% |
| Pain and Anesthesia | -$0.0565 | -3.97% | -$0.9166 | -5.40% | -$2.5282 | -4.78% | -$1.5528 | -4.83% |
| Respiratory System | -$0.3139 | -6.06% | -$0.7087 | -5.82% | -$1.2338 | -5.34% | -$4.6818 | -6.42% |
[a] The numbers in bold represent the highest savings in dollars and in percentages within that phase. Note that sometimes the highest dollar reduction does not necessarily correspond to the highest reduction in percentage terms.
In Phase 1 studies, cost savings due to EHR adoption are highest for ophthalmology ($0.5 million, representing 8.6 percent of study cost). Cost savings range from $0.4 million (cardiovascular and dermatology) to as high as $1.1 million (central nervous system and immunomodulation) in Phase 2 studies. According to our model, the largest savings in costs from EHR adoption are achievable in Phase 3 studies with ranges from $0.5 million (hematology) to $2.5 million (pain and anesthesia). Similarly, Phase 4 study savings could be as high as $4.7 million (respiratory system) due to EHR implementation.
5.2 Relaxing Trial Enrollment Restrictions
This approach involves encouraging drug sponsors to relax the strict trial enrollment restrictions in the interests of facilitating the patient recruitment process, which, as explained in Section 4.6 above, is a significant barrier to beginning and completing clinical trials. To quantify the impact of this strategy, we used data reported in a 2008 article by Kenneth Getz, which found that “[e]nrollment rates for volunteers who met the rising number of protocol eligibility criteria dropped from 75 percent to 59 percent between the 1999–2002 and 2003–2006 time periods [...]. Patient enrollment cycle times increased for protocols conducted in the latter time period” (Getz K. A., 2008).
For the purposes of modeling this approach, we assumed that looser trial enrollment restrictions would result in a return to the higher enrollment rates seen in the period from 1999 to 2002, a 27.1 percent increase from the rates in the more recent period (which would more accurately represent the cost data from Medidata for the 2004 to 2012 period). As enrollment rate is not a parameter in our cost model, we translate this increase in enrollment rates number to a 27.1 percent decrease in recruitment costs per patient. Table 5 summarizes expected cost savings from relaxing trial enrollment restrictions per study.
Table 5: Projected Impacts of Relaxing Trial Enrollment Restrictions on Clinical Trial Costs (in $ Millions and in Percentages), by Therapeutic Area and Phase [a]
| Therapeutic Area | Phase 1 | Phase 2 | Phase 3 | Phase 4 | ||||
|---|---|---|---|---|---|---|---|---|
| $ | % | $ | % | $ | % | $ | % | |
| Anti-Infective | -$0.0310 | -0.73% | -$0.0408 | -0.29% | -$0.0902 | -0.40% | -$0.0809 | -0.74% |
| Cardiovascular | -$0.0080 | -0.37% | -$0.0345 | -0.49% | -$0.1274 | -0.51% | -$0.0679 | -0.24% |
| Central Nervous System | -$0.0339 | -0.87% | -$0.1318 | -0.95% | -$0.1884 | -0.98% | -$0.1198 | -0.85% |
| Dermatology | -$0.0041 | -0.23% | -$0.0444 | -0.50% | -$0.0669 | -0.58% | -$0.0813 | -0.32% |
| Endocrine | -$0.0089 | -0.62% | -$0.0884 | -0.73% | -$0.1528 | -0.90% | -$0.1811 | -0.68% |
| Gastrointestinal | -$0.0071 | -0.30% | -$0.1270 | -0.80% | -$0.0783 | -0.54% | -$0.0555 | -0.25% |
| Genitourinary System | -$0.0193 | -0.63% | -$0.1063 | -0.73% | -$0.2426 | -1.38% | -$0.0484 | -0.71% |
| Hematology | -$0.0036 | -0.21% | -$0.0747 | -0.38% | -$0.0689 | -0.46% | -$0.1833 | -0.68% |
| Immunomodulation | -$0.0327 | -0.50% | -$0.0639 | -0.40% | -$0.0780 | -0.66% | -$0.1765 | -0.89% |
| Oncology | -$0.0191 | -0.43% | -$0.0347 | -0.31% | -$0.0518 | -0.23% | -$0.3701 | -0.95% |
| Ophthalmology | -$0.0032 | -0.06% | -$0.0329 | -0.24% | -$0.0406 | -0.13% | -$0.1281 | -0.73% |
| Pain and Anesthesia | -$0.0055 | -0.39% | -$0.2049 | -1.21% | -$0.4113 | -0.78% | -$0.3443 | -1.07% |
| Respiratory System | -$0.0206 | -0.40% | -$0.0401 | -0.33% | -$0.1016 | -0.44% | -$0.5490 | -0.75% |
[a] The numbers in bold represent the highest savings in dollars and in percentages within that phase. Note that sometimes the highest dollar reduction does not necessarily correspond to the highest reduction in percentage terms.
Expected savings across most therapeutic areas and phases is in the order of $0.0 to $0.1 million. In Phases 2 and 3, the savings for pain and anesthesia studies, however, could be as high as $0.2 million and $0.4 million per study representing around 1 percent of study costs, respectively. In Phase 4, largest savings could be realized for respiratory system ($0.5 million) and oncology ($0.4 million) studies.
5.3 Simplified Clinical Trial Protocols and Reduced Amendments
This strategy is meant to address the costs associated with collection of unnecessary data and implementing avoidable protocol amendments. Eliminating these inefficiencies has the potential to reduce the magnitude of several cost parameters represented in our model. As described in Section 4.6.2 above, drug sponsors estimate that approximately 15 to 30 percent of all clinical data collected is never used in New Drug Application (NDA) submissions, according to a 2010 article by Kenneth Getz of Tufts CSDD (Getz K. A., 2010b). Therefore, to model the data collection savings that would result from streamlining trial protocols, we reduced data collection, management and analysis costs (per study) by 22.5 percent in all phases (the midpoint of 15 and 30 percent).
If protocols are simplified, fewer clinical procedures will need to be performed yielding an additional source of savings. According to a recent study conducted by Tufts CSDD, 22.3 percent of all procedures are considered to be non-core and can be considered “extraneous” (Tufts CSDD, 2012). Based on this information, we also reduced the clinical procedure total (per patient) by 22.3 percent in all phases.
To quantify the cost savings associated with eliminating avoidable protocol amendments, we referred to the recent Getz/Tufts study discussed above, which found that 33 percent of amendments were “avoidable” or “somewhat avoidable” (Getz, et al., 2011). In our interviews, we heard from one industry representative that his company categorizes its protocol amendments either as avoidable or unavoidable (“unavoidable” being instances of unforeseen requirements or new data surfacing; “avoidable” being problems of oversight, for example, that could be minimized through better planning) and found that the breakdown was roughly even across the two categories. To be conservative, we reduced the number of IRB amendments by 33 percent in our model (as explained in Section 2 above, the average numbers of IRB amendments by phase and therapeutic area were derived from this same Tufts study).
In addition to the effects listed above, this approach would also likely impact the number of SDV fields (as the amount of data being collected would be reduced) and registered nurse (RN)/clinical research associate (CRA) and physician costs per patient (as the number of procedures performed would be reduced). Furthermore, simplified trial protocols might make trial participation less burdensome and exhausting to patients, thereby making it easier and perhaps cheaper to recruit and retain patients. However, we did not have enough information to include these additional effects in our modeling.
Table 6 presents the expected cost savings from implementation of simplified clinical trial protocols and reduced amendments. These range from $0.0 million (hematology) to $0.6 million (ophthalmology) in Phase 1, $0.3 million (hematology, anti-infective, cardiovascular, and dermatology) to $1.1 million (ophthalmology) in Phase 2, and from $0.2 million (hematology) to $2.4 million (ophthalmology) in Phase 3. At the upper end, the savings amount to 8 to 12 percent of study costs in ophthalmology across Phase 1 through Phase 3. In Phase 4, savings could range from $0.2 million (genitourinary system) to $4.2 million (respiratory system).
Table 6: Projected Impacts of Simplified Clinical Trial Protocols and Reduced Amendments on Clinical Trial Costs (in $ Millions and in Percentages), by Therapeutic Area and Phase [a]
| Therapeutic Area | Phase 1 | Phase 2 | Phase 3 | Phase 4 | ||||
|---|---|---|---|---|---|---|---|---|
| $ | % | $ | % | $ | % | $ | % | |
| Anti-Infective | -$0.2156 | -5.08% | -$0.3338 | -2.35% | -$0.5803 | -2.54% | -$0.3834 | -3.49% |
| Cardiovascular | -$0.1093 | -5.05% | -$0.2746 | -3.92% | -$0.9581 | -3.80% | -$0.5404 | -1.95% |
| Central Nervous System | -$0.1911 | -4.88% | -$0.9712 | -7.00% | -$1.3699 | -7.12% | -$0.5065 | -3.59% |
| Dermatology | -$0.0803 | -4.49% | -$0.3365 | -3.79% | -$0.4947 | -4.32% | -$0.7424 | -2.94% |
| Endocrine | -$0.0578 | -4.02% | -$0.4554 | -3.77% | -$0.5992 | -3.53% | -$0.7349 | -2.75% |
| Gastrointestinal | -$0.0673 | -2.81% | -$0.6175 | -3.90% | -$0.8908 | -6.15% | -$0.3439 | -1.58% |
| Genitourinary System | -$0.0991 | -3.21% | -$0.6445 | -4.41% | -$0.7381 | -4.21% | -$0.1593 | -2.34% |
| Hematology | -$0.0343 | -2.01% | -$0.2700 | -1.38% | -$0.2325 | -1.55% | -$0.3980 | -1.47% |
| Immunomodulation | -$0.2998 | -4.57% | -$0.8474 | -5.30% | -$0.4762 | -4.01% | -$0.8042 | -4.06% |
| Oncology | -$0.2547 | -5.68% | -$0.5828 | -5.19% | -$1.0610 | -4.80% | -$2.2442 | -5.78% |
| Ophthalmology | -$0.6278 | -11.76% | -$1.0921 | -7.91% | -$2.3942 | -7.79% | -$0.4971 | -2.83% |
| Pain and Anesthesia | -$0.0476 | -3.35% | -$0.4451 | -2.62% | -$1.3552 | -2.56% | -$0.9239 | -2.88% |
| Respiratory System | -$0.3560 | -6.88% | -$0.5321 | -4.37% | -$1.2704 | -5.50% | -$4.1830 | -5.74% |
[a] The numbers in bold represent the highest savings in dollars and in percentages within that phase. Note that sometimes the highest dollar reduction does not necessarily correspond to the highest reduction in percentage terms.
5.4 Reduced Source Data Verification (sdv)
As discussed in Section 4.6.3 above, many sponsors continue to perform 100 percent source data verification (SDV) in spite of the fact that it is not required by FDA and evidence suggesting that it is not efficient. Thus, the central idea behind this alternative is to encourage industry to reconsider this practice and instead adopt more efficient risk-based approaches.
The first step in estimating the impact of this alternative is quantifying the effect on costs of a movement away from 100 percent SDV in an average clinical trial. We obtained this information from a published study by Tantsyura, et al. (2010), which reported that expected overall (total study cost) savings associated with switching from 100 percent to 50 percent SDV are 11.6 percent for a typical Phase 2 cardiology study (238 subjects) and 16.7 percent for a typical Phase 2 study oncology (100 subjects), and potential savings in typical Phase 3 cardiology and oncology trials are 14.3 percent and 23.5 percent (1,282 subjects and 460 subjects), respectively (Tantsyura, et al., 2010). For cardiology and oncology, we were able to use the percentages reported in this study; for the other therapeutic areas and categories in our model, we used simple averages of the cardiology and oncology percentages (14.2 and 18.9 percent for Phase 2 and Phase 3, respectively).
The second step in estimating the impact of reduced SDV is determining the extent to which this practice is actually still in use. In addition to the itemized clinical trial cost data, Medidata provided us with information on the rate at which sponsors report using 100 percent SDV for each clinical trial phase and therapeutic area combination. In this data provided, all partial SDV efforts are coded as not 100 percent SDV. By contrast, a “100 percent” in this field indicates that 100 percent SDV was used in every contract in the dataset for that phase and therapeutic area. For the sake of simplicity, we assumed that the adoption rate of reduced SDV was equal to 100 minus the percentage reported for each phase and therapeutic area combination; in other words, if the data showed that 67 percent of contracts used 100 percent SDV, we interpreted this to mean that reduced SDV was the adopted practice already in 33 percent of trials. For combinations for which data were missing, we used the average of all other therapeutic areas for that phase.
Using these rates of reduced SDV, we were able to adjust the likely impacts of this approach to account for the fact that some reduction in SDV was already reflected in our cost data (i.e., not all trials were still utilizing 100 percent SDV). Conservatively assuming that there would be no impacts on Phase 1 and Phase 4 trials, in which SDV is less critical, we calculated the percentage reductions in SDV Cost (per data field) by phase and therapeutic area for Phases 2 and 3. It is also possible that reductions in SDV would result in shorter phase lengths, but we did not have enough information to model that change.
Table 7 depicts the cost savings from reduced SDV practices per study. Because SDV only constitutes between 0.9 to 1.6 percent of overall study costs, the savings attributable to reduced SDV activities are minimal, around $0.1 million and $0.2 million (representing around 1 percent of study costs) in Phases 2 and 3 only, respectively.
Table 7: Projected Impacts of Reduced Source Data Verification (SDV) on Clinical Trial Costs (in $ Millions and in Percentages), by Therapeutic Area and Phase [a]
| Therapeutic Area | Phase 1 | Phase 2 | Phase 3 | Phase 4 | ||||
|---|---|---|---|---|---|---|---|---|
| $ | % | $ | % | $ | % | $ | % | |
| Anti-Infective | $0.0000 | 0.00% | -$0.0789 | -0.56% | -$0.0836 | -0.37% | $0.0000 | 0.00% |
| Cardiovascular | -$0.0734 | -1.05% | -$0.1051 | -0.42% | ||||
| Central Nervous System | -$0.1125 | -0.81% | -$0.1467 | -0.76% | ||||
| Dermatology | -$0.1024 | -1.15% | -$0.0753 | -0.66% | ||||
| Endocrine | -$0.0804 | -0.67% | -$0.1052 | -0.62% | ||||
| Gastrointestinal | -$0.0657 | -0.42% | -$0.0845 | -0.58% | ||||
| Genitourinary System | -$0.0992 | -0.68% | -$0.1269 | -0.72% | ||||
| Hematology | -$0.1124 | -0.57% | -$0.1438 | -0.96% | ||||
| Immunomodulation | -$0.1068 | -0.67% | -$0.0960 | -0.81% | ||||
| Oncology | -$0.1212 | -1.08% | -$0.1958 | -0.89% | ||||
| Ophthalmology | -$0.0648 | -0.47% | -$0.0787 | -0.26% | ||||
| Pain and Anesthesia | -$0.1105 | -0.65% | -$0.1256 | -0.24% | ||||
| Respiratory System | -$0.0654 | -0.54% | -$0.0717 | -0.31% | ||||
[a] The numbers in bold represent the highest savings in dollars and in percentages within that phase. Note that sometimes the highest dollar reduction does not necessarily correspond to the highest reduction in percentage terms.
5.5 Wider Use of Mobile Technologies Such as Electronic Data Capture (edc)
Electronic data capture (EDC), described in Section 4.6.3 above, can streamline the patient screening and recruitment processes and allow for central statistical monitoring (Kramer & Schulman, 2011). While is it likely that adoption of EDC would impact many aspects of clinical trials, including site monitoring timelines and costs; site management and project management timelines; and data collection, management, and analysis costs, we only found information in the literature pertaining to the impact of EDC use on study duration and total costs. A 2010 paper reported that use of EDC resulted in a 30 percent decline in study duration (Neuer, Warnock, & Slezinger, 2010). Another study reported that use of EDC reduced total trial costs by 9.8 percent (Eisenstein, et al., 2008); however, we chose to model this approach using impacts on itemized parameters in order to allow for greater flexibility.
As with some of the barrier mitigation strategies discussed above, it is necessary to adjust the 30 percent reduction in study duration by the baseline adoption rate. To do this, we used an adoption rate of 50 percent reported in the same paper: “By the end of 2007, nearly half of all new Phase 1 – 3 studies will be initiated using EDC” (Neuer, Warnock, & Slezinger, 2010). Again, this 2007 adoption rate was used instead of a more recent one because it more accurately reflects the average adoption rate across the entire time period covered by the cost data from Medidata. Thus, if we model this using the 30 percent decrease in study duration and assume an adoption rate of 50 percent, the effect is a 17.6 percent decrease in study duration in Phases 1, 2, 3, and 4. Table 8 presents the costs savings estimates for this barrier mitigation strategy.
Table 8: Projected Impacts of Wider use of Mobile Technologies, such as Electronic Data Capture (EDC), on Clinical Trial Costs (in $ Millions and in Percentages), by Therapeutic Area and Phase [a]
| Therapeutic Area | Phase 1 | Phase 2 | Phase 3 | Phase 4 | ||||
|---|---|---|---|---|---|---|---|---|
| $ | % | $ | % | $ | % | $ | % | |
| Anti-Infective | -$0.1746 | -4.11% | -$1.4930 | -10.50% | -$1.9246 | -8.44% | -$0.7727 | -7.03% |
| Cardiovascular | -$0.0796 | -3.68% | -$0.5178 | -7.39% | -$1.5784 | -6.26% | -$3.6692 | -13.22% |
| Central Nervous System | -$0.2118 | -5.40% | -$0.7988 | -5.76% | -$1.0103 | -5.25% | -$1.4165 | -10.03% |
| Dermatology | -$0.0569 | -3.18% | -$0.8318 | -9.37% | -$0.9007 | -7.86% | -$2.5943 | -10.28% |
| Endocrine | -$0.0691 | -4.80% | -$1.0476 | -8.68% | -$1.4410 | -8.50% | -$2.8179 | -10.56% |
| Gastrointestinal | -$0.1675 | -7.00% | -$1.3374 | -8.45% | -$0.6319 | -4.36% | -$2.4446 | -11.22% |
| Genitourinary System | -$0.1567 | -5.08% | -$1.3233 | -9.06% | -$1.6031 | -9.14% | -$0.7321 | -10.78% |
| Hematology | -$0.1280 | -7.50% | -$2.3964 | -12.25% | -$1.8621 | -12.40% | -$3.5580 | -13.18% |
| Immunomodulation | -$0.3909 | -5.96% | -$1.1296 | -7.07% | -$1.0908 | -9.18% | -$1.8096 | -9.14% |
| Oncology | -$0.2356 | -5.25% | -$0.8139 | -7.25% | -$2.0728 | -9.38% | -$3.0733 | -7.91% |
| Ophthalmology | -$0.1831 | -3.43% | -$0.9419 | -6.82% | -$2.0612 | -6.70% | -$1.7859 | -10.18% |
| Pain and Anesthesia | -$0.0525 | -3.69% | -$1.7881 | -10.54% | -$6.0579 | -11.44% | -$3.7714 | -11.74% |
| Respiratory System | -$0.3852 | -7.44% | -$1.0422 | -8.56% | -$2.2854 | -9.90% | -$6.6866 | -9.17% |
[a] The numbers in bold represent the highest savings in dollars and in percentages within that phase. Note that sometimes the highest dollar reduction does not necessarily correspond to the highest reduction in percentage terms.
Main cost savings for this strategy occur in Phase 2, 3 and 4 studies with savings ranging from $0.5 million (cardiovascular) to $6.7 million (respiratory system). In Phase 1, the highest savings are $0.4 million (immunomodulation and respiratory system). The savings range from $0.5 million (cardiovascular) to $2.4 million (hematology) studies in Phase 2. In Phase 3, the highest savings that can be expected from the adoption of mobile technologies is $6.1 million (pain and anesthesia). Finally, the range of savings in Phase 4 studies is $0.7 million (genitourinary system) and $6.7 million (respiratory system).
5.6 Wider Use of Lower-cost Facilities AND/OR At-home Testing
This approach was suggested in the course of our interviews with drug sponsors. If FDA can successfully encourage sponsors to utilize lower-cost facilities (such as local clinics and pharmacies) for data collection purposes whenever possible, the need for costly infrastructure and overhead can be reduced. Furthermore, sponsors could conduct follow-up visits beyond the initial trial period at local centers to minimize travel and time costs for participants and thereby possibly improve retention. A related option is conducting web-based trials, in which patients can participate from home using computers and smartphones rather than traveling to trial sites. Pfizer has attempted this “clinical trial in a box” idea, recruiting patients through Internet advertisements and providing a website that explains the trial and allows online enrollment. All necessary materials (including the blinded study drug and a mobile app for electronic patient-reported outcomes, or PROs) are sent to participants at home (Silverman, 2011).
If it is more convenient for patients to fulfill trial requirements, they may be more willing to participate in studies. Therefore, one important effect of this approach is shortened enrollment timelines. Clinical Resource Network (CRN) is a provider of services that allow investigative sites to have tests conducted at a subject’s home rather than requiring the patient to be on-site. CRN reports that these services can reduce projected enrollment times from approximately 12 months to 3 months, a reduction of 67 percent (Shapiro, 2008).
We searched for additional literature on what portion of trial time is attributed to enrollment in order to reduce it by 67 percent for Phases 1, 2, and 3 to model this approach. One study reported that at least three years are spent on patient recruitment (Marks & Power, 2002). We assume that this refers to Phases 1 through 3 and divide it equally such that one year is attributed to recruitment in each phase. This is consistent with the 12 months reported by CRN. This year spent on recruitment, reduced by twothirds, becomes one-third of a year. The reduction, 0.67 years, is divided by the typical length of each phase to get a percent reduction that is specific to each phase and therapeutic area.
It is likely that phase time length is not the only parameter in our model that would be affected by this strategy. Depending on the specific characteristics of the approach chosen, there may also be impacts on: data collection, management and analysis costs, patient recruitment costs, patient retention costs, RN/CRA costs, physician costs, clinical procedure total, number of planned patients per site, site recruitment and retention costs, site management and monitoring time periods and costs, project management costs and time, administrative staff costs, and number of sites per study. If the user wishes to test more clearly defined approaches of this type, he/she can enter custom values for these fields to reflect the relevant changes.
Table 9 presents the cost savings attributable to this mitigation strategy, which are fairly sizeable especially in Phase 2 and Phase 3. The savings that could potentially be realized range from $0.1 million (dermatology and endocrine) to $0.8 million (immunomodulation and respiratory system) in Phase 1. In Phase 2, the potential savings range from $0.8 million (cardiovascular) to $4.3 million (hematology). For hematology, these savings are substantial representing 22 percent of study costs. Similarly, savings range from $0.9 million (gastrointestinal) to as high as $9.1 million (pain and anesthesia) in Phase 3 studies.
Table 9: Projected Impacts of Wider Use of Lower-Cost Facilities and/or At-home Testing on Clinical Trial Costs (in $ Millions and in Percentages), by Therapeutic Area and Phase [a]
| Therapeutic Area | Phase 1 | Phase 2 | Phase 3 | Phase 4 | ||||
|---|---|---|---|---|---|---|---|---|
| $ | % | $ | % | $ | % | $ | % | |
| Anti-Infective | -$0.3693 | -8.70% | -$2.6539 | -18.67% | -$2.2712 | -9.96% | $0.0000 | 0.00% |
| Cardiovascular | -$0.1683 | -7.78% | -$0.8485 | -12.10% | -$2.3641 | -9.37% | ||
| Central Nervous System | -$0.4479 | -11.42% | -$1.4198 | -10.23% | -$1.5132 | -7.86% | ||
| Dermatology | -$0.1204 | -6.73% | -$1.4784 | -16.66% | -$1.3490 | -11.77% | ||
| Endocrine | -$0.1461 | -10.15% | -$1.8621 | -15.43% | -$2.0792 | -12.27% | ||
| Gastrointestinal | -$0.3542 | -14.81% | -$2.3773 | -15.01% | -$0.9465 | -6.54% | ||
| Genitourinary System | -$0.3315 | -10.74% | -$2.3521 | -16.10% | -$2.1357 | -12.18% | ||
| Hematology | -$0.2707 | -15.85% | -$4.2597 | -21.77% | -$2.0182 | -13.44% | ||
| Immunomodulation | -$0.8267 | -12.60% | -$2.0079 | -12.57% | -$1.6338 | -13.75% | ||
| Oncology | -$0.4982 | -11.10% | -$1.1189 | -9.97% | -$2.7630 | -12.50% | ||
| Ophthalmology | -$0.3872 | -7.26% | -$1.6743 | -12.13% | -$3.0872 | -10.04% | ||
| Pain and Anesthesia | -$0.1110 | -7.80% | -$3.1783 | -18.73% | -$9.0733 | -17.14% | ||
| Respiratory System | -$0.8146 | -15.73% | -$1.8525 | -15.22% | -$3.4229 | -14.82% | ||
[a] The numbers in bold represent the highest savings in dollars and in percentages within that phase. Note that sometimes the highest dollar reduction does not necessarily correspond to the highest reduction in percentage terms.
5.7 Priority REVIEW/PRIORITY Review Vouchers
The basis for this policy option comes from a paper by Ridley, Grabowski, & Moe published in Health Affairs in 2006. The authors propose that developers of treatments for neglected diseases receive a “priority review voucher” to incentivize production of these therapies. If a treatment meets certain criteria, the developers would be awarded a transferable voucher that entitles the holder to priority FDA review for another drug (or perhaps multiple drugs) and other possible incentives (Ridley, Grabowski, & Moe, 2006).
Ridley, Grabowski, & Moe (2006) estimate that a priority review voucher “would be worth more than $300 million for a potential blockbuster drug, because it would shorten the time FDA takes to analyze data from an average of eighteen months to about six months.” Capturing this impact in the framework of our clinical trial cost model is quite straightforward, assuming the trial being modeled is the one for which the priority review voucher is being used; we simply set the review phase length equal to six months (0.5 years). Aside from reducing the time costs of the trial, this change also increases the NPV of the revenue side of the model by reducing the period of time over which revenues are discounted.
This barrier mitigation strategy reduces the time to market thereby increasing the expected NPV (eNPV) of the sponsor but does not reduce the cash outlays for doing clinical research according to our model.
5.8 Improvements in FDA Review Process Efficiency and More Frequent and Timely Interactions with FDA
This approach is somewhat difficult to quantify due to the highly variable results it is likely to have across review divisions and trials. For example, as one recent paper points out, there are considerable differences among review divisions in the length the NDA review and approval process, and to some extent, these differences are driven by differences in workload and staff resources across the various divisions (Milne & Kaitin, 2012). The same paper shows the impact of holding an advisory committee (AC) meeting on new molecular entity (NME) approval times to be ambiguous; in some review divisions, meetings are associated with shorter average review times, whereas in other divisions, they are actually associated with prolonged review times relative to cases where no meeting was held.
Given the differences in resources and requirements across review divisions, we attempted to gauge what types of improvements in efficiency were viewed as being achievable by FDA itself. According to the PDUFA performance goals for fiscal year (FY) 2013-2017, one of FDA’s objectives is to “[r]eview and act on 90 percent of standard NME NDA and original Biologic License Application (BLA) submissions within 10 months of the 60 day filing date”(U.S. Food and Drug Administration, 2012c). We therefore assumed that improvements in efficiency could result in a reduction of the length of the review phase to 10 months across the board. It is also possible that greater efficiency and improved communication with industry could result in increases in success probabilities in the review phase; however, we did not have enough information to model this potential impact. If this approach and the previous one (priority review/priority review vouchers) are selected, the model will use the shorter of the two time periods for the review phase lengths (six months).
Similar to the previous barrier mitigation strategy, this strategy reduces the time to market thereby increasing the eNPV of the sponsor but does not reduce the cash outlays for doing clinical research according to our model.
5.9 Conclusions
In considering the conclusions that may be drawn based on our evaluation of barrier mitigation strategies, it is important to recognize that establishing clear links between barriers and specific model parameters and their ex-post magnitudes requires extensive research, and our analysis was constrained by the limited availability of this type of information in the literature. Nevertheless, our results can help to inform the discussion surrounding possible barrier mitigation strategies and their relative impacts on drug development costs and returns. Our results are summarized in Table 10 below.
According to our model, priority review vouchers and improvements in FDA review efficiency can help to shorten timelines and increase expected NPV to the drug sponsor. However, these strategies do not reduce the cash outlay needed for the clinical studies. Therefore, holding everything constant, these options may be less appealing as strategies to stimulate drug development than alternatives which substantially lower costs, especially early on in the clinical research process (i.e., in earlier phases).
Use of lower-cost facilities/in-home testing and wider use of mobile technologies appear to be most effective in reducing costs across therapeutic areas and trial phases. Use of lower-cost facilities and/or in-home testing can reduce per-trial costs by up to $0.8 million (16 percent) in Phase 1, $4.3 million (22 percent) in Phase 2, and $9.1 million (17 percent) in Phase 3, depending on therapeutic area. Wider use of mobile technologies can result in very similar maximum savings; $0.4 million (8 percent) in Phase 1, $2.4 million (12 percent) in Phase 2, $6.1 million (12 percent) in Phase 3, and $6.7 million (13 percent) in Phase 4. On the other hand, relaxing trial enrollment restrictions and reducing SDV efforts have smaller impacts on costs, resulting in maximum savings of less than $0.1 million to $0.2 million per trial, representing around one percent of study costs.
Table 10: Summary of Barrier Mitigation Strategy Impacts on Clinical Trial Costs
| Barrier Mitigated | Impacts on Costs per Trial (in $ Millions and in Percentages) | |||||||||||||||
|---|---|---|---|---|---|---|---|---|---|---|---|---|---|---|---|---|
| Phase 1 | Phase 2 | Phase 3 | Phase 4 | |||||||||||||
| $ | % | $ | % | $ | % | $ | % | |||||||||
| Min | Max | Min | Max | Min | Max | Min | Max | Min | Max | Min | Max | Min | Max | Min | Max | |
| Use of electronic health records (EHR) | -$0.02 | -$0.46 | -1.4% | -8.6% | -$0.39 | -$1.14 | -3.1% | -8.2% | -$0.46 | -$2.53 | -3.1% | -8.8% | -$0.27 | -$4.68 | -2.6% | -7.4% |
| Relaxing trial enrollment restrictions | $0.00 | -$0.03 | -0.1% | -0.9% | -$0.03 | -$0.20 | -0.2% | -1.2% | -$0.04 | -$0.41 | -0.1% | -1.4% | -$0.05 | -$0.55 | -0.2% | -1.1% |
| Simplified clinical trial protocols and reduced amendments | -$0.03 | -$0.63 | -2.0% | -11.8% | -$0.27 | -$1.09 | -1.4% | -7.9% | -$0.23 | -$2.39 | -1.6% | -7.8% | -$0.16 | -$4.18 | -1.5% | -5.8% |
| Reduced source data verification (SDV) | $0.00 | $0.00 | 0.0% | 0.0% | -$0.06 | -$0.12 | -0.4% | -1.2% | -$0.07 | -$0.20 | -0.2% | -1.0% | $0.00 | $0.00 | $0.00 | $0.00 |
| Wider use of mobile technologies, i.e., electronic data capture | -$0.05 | -$0.39 | -3.2% | -7.5% | -$0.52 | -$2.40 | -5.8% | -12.3% | -$0.63 | -$6.06 | -4.4% | -12.4% | -$0.73 | -$6.69 | -7.0% | -13.2% |
| Use of lower-cost facilities or at-home testing | -$0.11 | -$0.83 | -6.7% | -15.9% | -$0.85 | -$4.26 | -10.0% | -21.8% | -$0.95 | -$9.07 | -6.5% | -17.1% | $0.00 | $0.00 | $0.00 | $0.00 |
| Priority Review/Priority Review voucher [a] | $0.0 | $0.0 | $0.0 | $0.0 | $0.0 | $0.0 | $0.0 | $0.0 | $0.0 | $0.0 | $0.0 | $0.0 | $0.0 | $0.0 | $0.0 | $0.0 |
| Improvements in FDA review process efficiency [a] | $0.0 | $0.0 | $0.0 | $0.0 | $0.0 | $0.0 | $0.0 | $0.0 | $0.0 | $0.0 | $0.0 | $0.0 | $0.0 | $0.0 | $0.0 | $0.0 |
Notes: “Minimum” and “maximum” define the range of savings across all therapeutic areas. Cost savings are shown as negative values. [a] Mitigation of the barrier reduces FDA review phase duration thereby reducing time to market for the drug. This improved the revenue stream for the sponsor but does not have direct cost impacts in the model.
6 References
Adams, C., & Brantner, V. (2006). Estimating The Cost Of New Drug Development: Is It Really $802 Million? Health Affairs, 25(2).
Adams, C., & Brantner, V. (2010). Spending on new drug development. Health Economics, 19(2), 130- 141.
Angell, M. (2004). Introduction: Drugs are Different. In M. Angell, The Truth About the Drug Companies (pp. xv-xvi). New York: Random House.
Ashar, B. H., Miller, R. G., Getz, K. J., & Powe, N. R. (2004). Prevalence and Determinants of Physician Participation in Conducting Pharmaceutical-sponsored Clinical Trials and Lectures. Journal of General Internal Medicine, 1140–1145.
Bailey, W., Cruickshank, C., & Sharma, N. (n.d.). Make Your Move: Taking Clinical Trials to the Best Location. Retrieved March 22, 2012, from A.T. Kearney: http://www.atkearney.com/index.php/Publications/make-your-move.html
Bonham, A., Califf, R., Gallin, E., & Lauer, M. (2011). Developing a Robust Clinical Trials Workforce. IOM Forum on Drug Discovery, Development, and Translation. Washington, D.C.: Institute of Medicine of the National Academies.
Brooks, C. (2012). An Independent Perspective on Clinical Trial Timelines: Trending Against Expectations. New York: Citeline.
Buchholzer, F. J. (2011). Implementing the Voluntary Harmonization Procedure for Accelerated Clinical Trial Approval. International Pharmaceutical Industry, 3(2), 68-69.
Califf, R. M., & Muhlbaier, L. H. (2003). Health Insurance Portability and Accountability Act (HIPAA): Must There Be a Trade-Off Between Privacy and Quality of Health Care, or Can We Advance Both? Circulation, 108, 915-918.
Califf, R. M., Filerman, G., Murray, R. K., & Rosenblatt, M. (2011). The Clinical Trials Enterprise in the United States: A Call for Disruptive Innovation. IOM Forum on Drug Discovery, Development, and Translation. Washington, D.C.: Institute of Medicine of the National Academies.
Clinical Trials Facilitation Groups (CTFG). (2010, March). Heads of Medicines Agencies (HMA). Retrieved May 15, 2012, from Guidance document for a Voluntary Harmonisation Procedure (VHP) for the assessment of multinational Clinical Trial Applications: Version 2: http://www.hma.eu/fileadmin/dateien/Human_Medicines/01- About_HMA/Working_Groups/CTFG/2010_03_VHP_Guidance_v2.pdf
Clinical Trials Transformation Initiative (CTTI). (2011). Clinical Trials Transformation Initiative (CTTI) - Identifying Practices that through Broad Adoption will Increase the Quality and Efficiency of Clinical Trials. Retrieved May 25, 2012, from https://www.ctti-clinicaltrials.org/
Collier, R. (2009, February 3). Rapidly rising clinical trial costs worry researchers. Canadian Medical Association Journal, 180(3), 277-278.
Cutting Edge Information. (2011, December 5). Outsourcing of Phase II Drug Development Now Accounts for 63% of R&D Budgets. Retrieved April 2012, 6, from Cutting Edge Information: http://www.cuttingedgeinfo.com/2011/outsourcing-phase-ii-drug-development/
Damodaran, A. (2007). Strategic Risk Taking: A Framework for Risk Management. Upper Saddle River, NJ: Pearson Prentice Hall.
Davis, J. R., Nolan, V. P., Woodcock, J., & Estabrook, R. W. (1999). Assuring Data Quality and Validity in Clinical Trials for Regulatory Decision Making: Workshop Report. Roundtable on Research and Development of Drugs, Biologics, and Medical Devices, Institute of Medicine.
Deloitte. (2009). Secondary Uses of Electronic Health Record (EHR) Data in Life Sciences. Deloitte Development LLC.
Dilts, D. M., & Sandler, A. B. (2006). Invisible Barriers to Clinical Trials: The Impact of Structural, Infrastructural, and Procedural Barriers to Opening Oncology Clinical Trials. Journal of Clinical Oncology, 24(28), 4545-4552.
DiMasi, J. A., Feldman, L., Seckler, A., & Wilson, A. (2010, March). Trends in Risks Associated With New Drug Development: Success Rates for Investigational Drugs. Clinical Pharmacology and Therapeutics, 87(3).
DiMasi, J. A., Grabowski, H. G., & Vernon, J. (2004). R&D Costs and Returns by Therapeutic Category. Drug Information Journal, 38, 211-223.
DiMasi, J. A., Hansen, R. W., & Grabowski, H. G. (2005). Reply: Extraordinary claims require extraordinary evidence. Journal of Health Economics, 1034–1044.
DiMasi, J., Hansen, R., & Grabowski, H. (2003). The price of innovation: new estimates of drug development costs. Journal of Health Economics, 22(2), 151-185.
Downing, N. S., Aminawung, J. A., Shah, N. D., Braunstein, J. B., Krumholz, H. M., & Ross, J. S. (2012, May 16). Regulatory Review of Novel Therapeutics — Comparison of Three Regulatory Agencies. The New England Journal of Medicine.
Eisenberg, P., Kaufmann, P., Sigal, E., & Woodcock, J. (2011). Developing a Clinical Trials Infrastructure. IOM Forum on Drug Discovery, Development, and Translation. Washington, D.C.: Institute of Medicine of the National Academies.
Eisenstein, E. L., Collins, R., Cracknell, B. S., Podesta, O., Reid, E. D., Sandercock, P., . . . Diaz, R. (2008). Sensible approaches for reducing clinical trial costs. Clinical Trials, 75-84.
Eisenstein, E. L., Lemons II, P. W., Tardiff, B. E., Schulman, K. A., Jolly, M. K., & Califf, R. M. (2004). Reducing the costs of phase III cardiovascular clinical trials. American Heart Journal, 149(3), 482-488.
Embi, P. J., Jain, A., Clark, J., Bizjack, S., Hornung, R., & Harris, C. M. (2005). Effect of a Clinical Trial Alert System on Physician Participation in Trial Recruitment. Archives of Internal Medicine, 2272-2277.
English, R., Lebovitz, Y., & Giffin, R. (2010). Transforming Clinical Research in the United States: Challenges and Opportunities: Workshop Summary. Institute of Medicine of the National Academies, Forum on Drug Discovery, Development, and Translation Board on Health Sciences Policy. Washington, D.C.: The National Academies Press.
Getz, K. A. (2006, December 1). Hitching a Ride with the Speed Demons of Drug Development. Retrieved December 15, 2011, from Applied Clinical Trials Online: http://www.actmagazine.com/appliedclinicaltrials/article/articleDetail.j...
Getz, K. A. (2007, September 1). Global Clinical Trials Activity in the Details. Retrieved March 21, 2012, from Applied Clinical Trials Online: http://www.appliedclinicaltrialsonline.com/appliedclinicaltrials/article... 3
Getz, K. A. (2008, May 1). The Heavy Burden of Protocol Design. Retrieved July 23, 2012, from Applied Clinical Trials Online: http://license.icopyright.net/user/viewFreeUse.act?fuid=MTY0NDY1NDE%3D
Getz, K. A. (2010a, November 1). Chasing Veteran U.S. Sites Out of the Enterprise. Retrieved April 19, 2012, from Applied Clinical Trials Online: http://license.icopyright.net/rights/offer.act?inprocess=t&sid=13&tag=3.... 552
Getz, K. A. (2010b, January 1). With Clinical Data, Less is More. Retrieved July 23, 2012, from Applied Clinical Trials Online: http://license.icopyright.net/user/viewFreeUse.act?fuid=MTY0NDU0Njg%3D
Getz, K. A. (2011a, March 1). Low Hanging Fruit in the Fight Against Inefficiency. Retrieved December 14, 2011, from Applied Clinical Trials Online: http://license.icopyright.net/user/viewFreeUse.act?fuid=MTQ4OTUyMDE%3D
Getz, K. A. (2011b, May 1). Protocol Amendments: A Costly Solution. Retrieved December 15, 2011, from Applied Clinical Trials Online: http://appliedclinicaltrialsonline.findpharma.com/appliedclinicaltrials/... 719542&sk=9270beba3a37ef7e37f3fa5477eea1cf9%22
Getz, K. A., Wenger, J., Campo, R. A., Sequine, E. S., & Kaitin, K. I. (2008). Assessing the Impact of Protocol Design Changes on Clinical Trial Performance. American Journal of Therapeutics, 450- 457.
Getz, K. A., Zuckerman, R., Cropp, A. B., Hindle, A. L., Krauss, R., & Kaitin, K. I. (2011). Measuring the Incidence, Causes, and Repercussions of Protocol Amendments. Drug Information Journal, 265-275.
Getz, K., & Campo, R. (2013). Drug Development Study Designs have Reached the Danger Zone. Expert Review of Clinical Pharmacology Vol. 6 No. 6, 589–591.
GlaxoSmithKline. (2011, October). Global Public Policy Issues: GlaxoSmithKline’s Position: Clinical Trials in the Developing World. Retrieved May 9, 2012, from GlaxoSmithKline Government Affairs, Public Policy and Patient Advocacy: http://www.gsk.com/policies/GSK-on-clinicaltrials-in-the-developing-worl...
Glickman, S. W., McHutchison, J. G., Peterson, E. D., Cairns, C. B., Harrington, R. A., Califf, R. M., & Schulman, K. A. (2009). Ethical and Scientific Implications of the Globalization of Clinical Research. New England Journal of Medicine, 360(8), 816-823.
Hammons, G. T., Hilman, B. J., Kahan, J. P., & Neu, C. R. (1985). The Decision to Initiate Clinical Trials of Current Medical Practices. RAND Report prepared for the DHHS National Center for Health Services Research and Health Care Technology Assessment.
Harris, G. (2010, September 23). F.D.A. to Restrict Avandia, Citing Heart Risk. The New York Times. Hay, M., Rosenthal, J., Thomas, D., & Craighead, J. (2011, February 15). Presentation: Clinical Trial Success Rates Study (BIO CEO & Investor Conference). Biotechnology Industry Organization (BIO) / BioMedTracker.
Horton, N. J., & Switzer, S. S. (2005). Statistical methods in the journal. New England Journal of Medicine, 1977–1979.
Institute of Medicine Forum on Drug Discovery, Development, and Translation. (Undated). Template for Clinical Trial Agreements. Retrieved March 16, 2012, from http://www.iom.edu/~/media/Files/Activity%20Files/Research/DrugForum/Apr... 28/TemplateCTA%2042209.ashx
International Committee of Medical Journal Editors. (2010, April). Uniform Requirements for Manuscripts Submitted to Biomedical Journals: Writing and Editing for Biomedical Publication. Retrieved March 22, 2012, from International Committee of Medical Journal Editors: http://www.icmje.org/urm_main.html
International Conference on Harmonisation of Technical Requirements for Registration of Pharmaceuticals for Human Use (ICH). (1996, April). Guidance for Industry: E6 Good Clinical Practice: Consolidated Guidance. Retrieved from U.S. Food and Drug Administration: http://www.fda.gov/downloads/Drugs/Guidances/ucm073122.pdf
Jenkins, J. K. (2011, December 8). CDER New Drug Review: 2011 Update - FDA/CMS Summit. Retrieved January 2, 2013, from http://www.fda.gov/downloads/AboutFDA/CentersOffices/OfficeofMedicalProd... CDER/UCM282984.pdf
Jenkins, V., & Fallowfield, L. (2000). Reasons for accepting or declining to participate in randomized clinical trials for cancer therapy. British Journal of Cancer, 82(11), 1783–1788.
Kass, N. E., Chaisson, L., Taylor, H. A., & Lohse, J. (2011). Length and Complexity of US and International HIV Consent Forms from Federal HIV Network Trials. Journal of General Internal Medicine, 26(11), 1324-1328.
Korieth, K. (2011, February). The High Cost and Questionable Impact of 100% SDV. The CenterWatch Monthly, 18(2).
Krafft, H., Bélorgey, C., & Szalay, G. (2012). Correspondence: Experience and further development with the Voluntary Harmonization Procedure for multinational clinical trials in the European Union. Nature Reviews Drug Discovery.
Kramer, J. M., & Schulman, K. A. (2011). Transforming the Economics of Clinical Trials. IOM Forum on Drug Discovery, Development, and Translation. Washington, D.C.: Institute of Medicine of the National Academies.
Kramer, J. M., Smith, P. B., & Califf, R. M. (2012). Impediments to Clinical Research in the United States. Clinical Pharmacology & Therapeutics, 91(3), 535–541.
Light, D. W., & Warburton, R. N. (2005). Discussion: Extraordinary claims require extraordinary evidence. Journal of Health Economics, 1030-1033.
Lipsky, M. S., & Sharp, L. K. (2001). From Idea to Market: The Drug Approval Process. The Journal of the American Board of Family Practice, 362-367.
Marks, L., & Power, E. (2002). Using technology to address recruitment issues in the clinical trial process. Trends in Biotechnology, 105-109.
Medidata Solutions. (2012, September 5). Press Release: Medidata Solutions Selected to Support U.S. Government Research on Drug Development Costs. Retrieved September 24, 2012, from Medidata Solutions Worldwide, News & Events: http://www.mdsol.com/press/medidatasolutions-selected-to-support-us-gove...
Medidata Solutions. (2012a). CRO Contractor Database (CROCAS®).
Medidata Solutions. (2012b). Grants Manager Database (PICAS®)
Mills, E. J., Seely, D., Rachlis, B., Griffith, L., Wu, P., Wilson, K., . . . Wright, J. R. (2006, February). Barriers to participation in clinical trials of cancer: a meta-analysis and systematic review of patient-reported factors. The Lancet Oncology, 7(2), 141-148.
Milne, C. (2012, March 2). Defining Conflict of Interest. Retrieved May 22, 2012, from Pharmaceutical Technology: http://license.icopyright.net/user/viewFreeUse.act?fuid=MTYyMjcyMjE%3D
Milne, C. P., & Kaitin, K. I. (2012). FDA Review Divisions: Performance Levels and the Impact on Drug Sponsors. Clinical Pharmacology & Therapeutics, 91(3), 393-404.
Morgan, S., Grootendorst, P., Lexchin, J., Cunningham, C., & Greyson, D. (2011). The cost of drug development: a systematic review. Health Policy, 100(1), 4-17.
Morrison, B. W., Cochran, C. J., White, J. G., Harley, J., Kleppinger, C. F., Liu, A., . . . Neaton, J. D. (2011). Monitoring the quality of conduct of clinical trials: a survey of current practices. Clinical Trials, 342–349.
National Institutes of Health. (2011, August 23). HHS Tightens Financial Conflict of Interest Rules for Researchers. Retrieved March 5, 2013, from National Institutes of Health: http://www.nih.gov/news/health/aug2011/od-23.htm
Neuer, A., Warnock, N., & Slezinger, E. (2010, April 1). The Upfront Cost Hurdle of EDC. Retrieved May 22, 2012, from Applied Clinical Trials Online: http://license.icopyright.net/user/viewFreeUse.act?fuid=MTYyMjgyMzI%3D
Pollack, A. (2012, March 29). Panel Recommends More Testing for Obesity Drugs. The New York Times.
Rai, S. (2005, February 24). Drug Companies Cut Costs With Foreign Clinical Trials. The New York Times.
Ridley, D. B., Grabowski, H. G., & Moe, J. L. (2006). Developing Drugs For Developing Countries. Health Affairs, 25(2), 313-324.
RTI International. (2006, April). Criteria for Distinguishing Effectiveness From Efficacy Trials in Systematic Reviews. Technical Review(12). Agency for Healthcare Research and Quality. Retrieved February 19, 2013, from http://www.ncbi.nlm.nih.gov/books/NBK44029/pdf/TOC.pdf
Schmidt, C. W. (2001). Monitoring research overseas. Modern Drug Discovery, 4(2), 25-26.
Shapiro, M. (2008, September 1). At Home Testing Offers Solution. Retrieved August 20, 2012, from Modern Medicine: http://license.icopyright.net/user/viewFreeUse.act?fuid=MTY1MTY4MTg%3D
Shavers, V. L., Lynch, C. F., & Burmeister, L. F. (2000). Knowledge of the Tuskegee Study and Its Impact on the Willingness to Participate in Medical Research Studies. Journal of the National Medical Association, 92, 563-572.
Sherman, R. B., Woodcock, J., Norden, J., Grandinetti, C., & Temple, R. J. (2011, July 7). New FDA Regulation to Improve Safety Reporting in Clinical Trials. The New England Journal of Medicine, 3-5.
Silverman, E. (2011, June 7). Pf zer And A ‘Cl n cal Tr al In A Bo ’ For Home Use. Retrieved May 31, 2012, from Pharmalot: http://www.pharmalot.com/2011/06/pfizer-and-a-clinical-trial-in-a-boxfor...
Society for Clinical Data Management. (2005). Good Clinical Data Management Practices, Version 4. Society for Clinical Data Management, Inc.
Tantsyura, V., Grimes, I., Mitchel, J., Fendt, K., Sirichenko, S., Waters, J., . . . Tardiff, B. (2010). Riskbased Source Data Verification Approaches: Pros and Cons. Drug Information Journal, 44, 745– 756.
Tufts CSDD. (2011). September/October 2011 Tufts CSDD Impact Report Press Release. Retrieved December 15, 2011, from Tufts Center for the Study of Drug Development: http://csdd.tufts.edu/files/uploads/september-october_impact_report_pres...
Tufts CSDD. (2012). November/December 2012 Tufts CSDD Impact Report Press Release. Retrieved November 7, 2012, from Tufts Center for the Study of Drug Development: http://csdd.tufts.edu/files/uploads/nov-dec_2012_ir_summary.pdf
U.S. Bureau of Labor Statistics. (2012). Consumer Price Index (CPI) Inflation Calculator. Retrieved April 30, 2012, from U.S. Bureau of Labor Statistics: http://data.bls.gov/cgi-bin/cpicalc.pl
U.S. Department of Health & Human Services. (2012, February 17). News Release: HHS Secretary Kathleen Sebelius announces major progress in doctors, hospital use of health information technology. Retrieved November 15, 2012, from U.S. Department of Health & Human Services Newsroom: http://www.hhs.gov/news/press/2012pres/02/20120217a.html
U.S. Food and Drug Administration. (2006a, January). Guidance for Industry, Investigators, and Reviewers: Exploratory IND Studies. Retrieved March 11, 2013, from http://www.fda.gov/downloads/Drugs/GuidanceComplianceRegulatoryInformati... m078933.pdf
U.S. Food and Drug Administration. (2006b, March). Guidance for Industry: Using a Centralized IRB Review Process in Multicenter Clinical Trials. Retrieved March 14, 2012, from http://www.fda.gov/RegulatoryInformation/Guidances/ucm127004.htm
U.S. Food and Drug Administration. (2011a, February). Guidance for Industry and FDA Staff: Best Practices for Conducting and Reporting Pharmacoepidemiologic Safety Studies Using Electronic Healthcare Data Sets. Retrieved June 13, 2012, from http://www.fda.gov/downloads/Drugs/GuidanceComplianceRegulatoryInformati... CM243537.pdf
U.S. Food and Drug Administration. (2011b, May). Guidance for Clinical Investigators, Industry, and FDA Staff Financial Disclosure by Clinical Investigators: Draft Guidance. Retrieved March 5, 2013, from http://www.fda.gov/downloads/regulatoryinformation/guidances/ucm256525.pdf
U.S. Food and Drug Administration. (2011c, August). Guidance for Industry Oversight of Clinical Investigations — A Risk-Based Approach to Monitoring. Retrieved March 21, 2012, from http://www.fda.gov/downloads/Drugs/.../Guidances/UCM269919.pdf
U.S. Food and Drug Administration. (2012). FY 2011 Performance Report to the President and Congress for the Prescription Drug User Fee Act. Retrieved June 11, 2012, from U.S. Food and Drug Administration: http://www.fda.gov/downloads/AboutFDA/ReportsManualsForms/Reports/UserFe... rmanceReports/PDUFA/UCM294101.pdf
U.S. Food and Drug Administration. (2012, April 23). Public Hearing. Modernizing the Regulation of Clinical Trials and Approaches to Good Clinical Practice. Silver Spring, Maryland: U.S. Food and Drug Administration, Department of Health and Human Services.
U.S. Food and Drug Administration. (2012a, March 25). Modernizing the Regulation of Clinical Trials and Approaches to Good Clinical Practice Public Hearing. Retrieved May 25, 2012, from U.S. Food and Drug Administration: http://www.fda.gov/Drugs/NewsEvents/ucm284118.htm
U.S. Food and Drug Administration. (2012b, July 24). Notice: Prescription Drug User Fee Rates for Fiscal Year 2013.
U.S. Food and Drug Administration. (2012c). PDUFA Reauthorization Performance Goals and Procedures Fiscal Years 2013 Through 2017. Retrieved December 7, 2012, from U.S. Food and Drug Administration: http://www.fda.gov/downloads/forindustry/userfees/prescriptiondruguserfe...
U.S. Food and Drug Administration. (2013). Impact Innovation Predictability Access: 2012 Novel New Drugs Summary. Silver Spring, MD: Center for Drug Evaluation and Research, U.S. Food and Drug Administration, U.S. Department of Health and Human Services.
Usher, R. W. (2010). PhRMA BioResearch Monitoring Committee Perspective on Acceptable Approaches for Clinical Trial Monitoring. Drug Information Journal, 44, 477–483.
Weisfeld, V., English, R. A., & Claiborne, A. B. (2011). Public Engagement and Clinical Trials: New Models and Disruptive Technologies: Workshop Summary. Institute of Medicine of the National Academies, Forum on Drug Discovery, Development, and Translation. Washington, D.C.: The National Academies Press.
Welton, A. J., Vickers, M. R., Cooper, J. A., Meade, T. W., & Marteau, T. M. (1999). Is recruitment more difficult with a placebo arm in randomised controlled trials? A quasirandomised, interview based study. British Medical Journal (BMJ), 318, 1114–1117.
Windish, D. M., Huot, S. J., & Green, M. L. (2007). Medicine Residents’ Understanding of the Biostatistics and Results in the Medical Literature. JAMA, 298(9), 1010-1022.
World Health Organization. (2006). The World Health Report 2006 - Working Together for Health. Retrieved March 22, 2012, from World Health Organization: http://www.who.int/whr/2006/06_chap4_en.pdf
Appendix A: Draft Interview GUIDE14,15
- Is there a minimum rate of return that you require before initiating clinical research for an NME? If so, what is it?
- Is there a minimum revenue threshold below which you might choose to ignore even high-return drug development projects? If so, what is the threshold?
- If interviewee has small company experience: How does this picture change for small companies?
- Do you think it is important to reduce current source data verification costs? Does your firm employ risk-based or some other form of SDV at less than 100%?
- What percentage of laboratory/radiological/physical exam data collected during the course of a clinical trial is never used for the purposes of supporting the New Drug Application (NDA) to FDA? Please elaborate on the reasons for collecting such data.
- For what percentage of clinical trials that you discuss with FDA do they request a material change in your clinical trial protocol? What percentage of the changes requested by FDA is (1) reasonable, (2) uncertain of their value, (3) unreasonable or not useful? Can you describe some of the specific issues, if possible? [Note: Information will be redacted in order not to identify individual companies. If possible, probe about a recent clinical trial experience for more specifics.]
- Does your firm incur substantial costs trying to identify biomarkers during clinical trials? Does the search often prove successful? If so, how important are the clinical trial costs savings from having identified biomarkers? In which specific therapeutic areas are biomarkers relevant? Our final questions relate to the barriers that may delay, hinder, or prevent successful completion of clinical trials for NMEs.
- From your perspective, what are the major barriers to undertaking clinical research in the U.S. for the purposes of demonstrating safety and efficacy to the FDA? How would you rank these in order of relative importance, top to bottom? [If the respondent is unable to offer much, suggest factors such as difficulty of mounting clinical trials, uncertainty about the regulatory approval process, shortage of trained professional staff, etc.]
- Is your firm actively pursuing the use of newer electronic data capture technologies or other technological advances into clinical trial operation? How important or unimportant do you think such techniques will be in lowering clinical trial costs in the future?
- Do you feel that, as a (small/large) firm, you face a different set of barriers compared to (larger/smaller) firms? Additionally, do firms in your therapeutic area face a different set of barriers compared to those in other therapeutic areas? If so, what are the differences?
- In your experience, have you been asked to amend your clinical trial protocol by FDA? If yes, to what extent have the FDA-initiated protocol amendments troublesome or expensive to accommodate compared to self-initiated ones? Do FDA-initiated protocol amendments constitute a significant barrier to drug development compared to other barriers, such as increasing costs associated with patient recruitment, IRB approval delays, etc.? [Note: Probe about a recent clinical trial experience for more specifics.]
- Do you feel that there are clinical investigator shortages in the U.S.? Overseas? If so, how significant of a problem is this? Have you undertaken any measures to mitigate this problem for your company? If so, please describe.
- Are there any recent developments in clinical research that are proving helpful in mitigating barriers to drug development? Please elaborate.
- Are there actions that the federal government could take to mitigate drug development barriers (e.g., make changes to the clinical data submission requirements to FDA)? If so, what are those actions?
- Which of these government actions you enumerated above would have the greatest impact/potential to promote more clinical research in the short term? In the long term?
3 OTHER QUESTIONS (TO ASK IF TIME PERMITS)
- What is the typical rate you use for discounting future revenues (i.e., weighted average cost of capital - WACC)?
- Can you describe/quantify (say on a scale of 1 to 10) how confident you are about your forecasts of future development costs and expected sales volume at the point when you decide to file an IND? [Note: The answer is relevant to our discounting of future projections in some modeling we are attempting for the industry.]
- What types of tools/methods (e.g., real options valuation method) do you use for evaluating/ranking drug development projects? Please describe.
- Thinking about your recent decisions regarding NMEs, have there been individual factors or uncertainties in planning for clinical trials that have led you to decide not to file an IND for reasonably good candidates? Can you outline the reasons for not proceeding with an IND in the case of one or two recent decisions?
- Have you pursued regulatory approvals for any NMEs in the EU and not in the US specifically because of FDA clinical trial requirements?
- To what extent and in what circumstances do you not seek FDA reviews of your clinical trial plans? If there is any uncertainty about FDA’s acceptance of your clinical trial data, are there reasons why you do not seek FDA review before a specific trial? [Note: Probe about a recent clinical trial experience for more specifics.]
4 CLINICAL TRIAL COSTS
Next, we would like to inquire about the sponsor costs of conducting clinical trials to evaluate the safety and efficacy for an NME. We recognize that these costs may vary significantly based on the therapeutic area and other factors. Thus, “guesstimates” of ranges of hours/dollars/percentages are sufficient.
- We are interested in costs incurred by the drug sponsor for managing clinical trials. Can you guesstimate how much you spend internally to manage a given clinical trial, for example, as a percentage of the fees paid to a clinical research organization? Can you describe what the major components of the sponsor costs entail (e.g., oversight activities, monitoring, etc.)?
- What percent of the total cost for a given clinical trial is related to one-time (study-specific) costs?
- Do you conduct clinical trials outside the U.S? If so, how many countries are typically involved?
- (If respondent nd cates “no” to 11, then s p to 12). If so, can you generalize about how the total cost of conducting clinical trials outside the U.S. (including all internal and external expenses) compare to that of U.S. based clinical trials for your company?
- Which components of clinical trial costs are rising most quickly in recent years? Can you offer an assessment as to why clinical trial costs are rising across the board?
14 Due to the Paperwork Reduction Act (PRA) requirements, ERG limited the number of interviews involving the same set of questions to fewer than 10.
15 The interview will be conducted in a semi-structured fashion with additional questions raised depending on the information provided by the interviewee. Notes for the interviewer appear in italics.
16 The questions will be tailored to the background of the interviewee and the type of company.
Appendix B: Medidata Data Element Descriptions
| Data Element | Data Element Description | Unit | Source |
|---|---|---|---|
| Administrative Staff Costs | Non-clinical administrative staff cost associated with managing the study at the sites | Month | CROCAS® (Medidata Solutions, 2012a) |
| All Other Costs | Includes costs of development for the entity being tested, costs for sponsors to run the study (additional internal costs and ancillary administrative costs), and other costs not captured by the other fields. It is equal to 30% of the total costs (according to Medidata, the clinical trial cost fields they have provided to ERG capture 70% of total costs). | Study | Medidata Solutions calculation |
| Central Lab Costs [a] | Central laboratory cost, if central laboratory used | Patient | PICAS® (Medidata Solutions, 2012b) |
| Clinical Procedure Total | Total cost of clinical procedures only for one patient | Patient | PICAS® (Medidata Solutions, 2012b) |
| Cost Per IRB Amendment | Cost of a single IRB amendment | IRB amendment | PICAS® (Medidata Solutions, 2012b) |
| Cost Per IRB Approval | Cost of a single IRB approval | IRB approval | PICAS® (Medidata Solutions, 2012b) |
| Data Collection, Management and Analysis Costs | Costs associated with collection, management, and analysis of data for one study/protocol, across all sites and patients | Study | CROCAS® (Medidata Solutions, 2012a) |
| FDA Application Fee | The Federal Food, Drug, and Cosmetic Act, as amended by the Prescription Drug User Fee Amendments of 2012, which was signed by the President on July 9, 2012 (PDUFA V), authorizes FDA to collect user fees for certain applications for approval of drug and biological products. This document establishes fee rates for fiscal year (FY) 2013 for application fees for an application requiring clinical data ($1,958,800), for establishment fees ($526,500), and for product fees ($98,380). These fees are effective on October 1, 2012, and will remain in effect through September 30, 2013. For applications submitted on or after October 1, 2012, the new fee schedule must be used. | Drug / product | U.S. Food and Drug Administration, 2012c. |
| Number of IRB Amendments | Average number of amendments for a given therapeutic area and phase, as derived from Getz, et al., 2011. In this study, amendments were defined as “any change to a protocol requiring internal approval followed by approval from the IRB, ethical review board (ERB), or regulatory authority. Only implemented amendments—that is, amendments approved both internally and by the ethics committee—were counted and analyzed in this study.” Per-phase amendment counts were calculated by multiplying the average number of amendments by phase (from Table 3 in Getz, et al., 2011) by a therapeutic area-specific factor (calculated using numbers in Table 4 in Getz, et al., 2011). | Study | Getz, et al., 2011; calculation. |
| Number of IRB Approvals | Average number of IRB approvals needed for a given study. The default scenario assumes this to be equal to the number of sites in a study | Study | Assumption based on data from Medidata Insights™ (Medidata Solutions) |
| Number of Patients | The number of planned patients. This is the number of patients a site is expected and contracted to enroll. | Site | PICAS® (Medidata Solutions, 2012b) |
| Number of Project Management Months | The time period from contract signature to the delivery of the statistical report. | Project management month | CROCAS® (Medidata Solutions, 2012a) |
| Number of SDV Fields | Number of SDV fields per study | Study | CROCAS® (Medidata) |
| Number of Site Management Months | Number of months a site was managed; the time period from the first site initiation to the last site close-out | Site month | CROCAS® (Medidata Solutions, 2012a) |
| Number of Site Monitoring Days | The number of actual days spent at a given site (on-site) for monitoring purposes (not the total period over which monitoring was conducted) | Site monitoring day | CROCAS® (Medidata Solutions, 2012a) |
| Number of Sites | Number of clinical investigator sites used per study/protocol | Study | Medidata Insights™ (Medidata Solutions) |
| Number of Trials in Phase | The number of trials conducted in a given phase for the drug. Multiple trials within a phase might be required to test different dosages, for example. The default is one trial in each phase. Enter a whole number between 1 and 10 for Phases 1-3 and a whole number between 0 and 3 for Phase 4 (zero signifying that there is no Phase 4 trial). | Whole number | N/A |
| Site Overhead Percent | Site overhead charged on contracts by the site estimated at 25 percent of total per-study costs | Percent | PICAS® (Medidata Solutions, 2012b) |
| Patient Recruitment Costs | Advertising costs associated with recruitment of patients at the per-patient level | Patient | PICAS® (Medidata Solutions, 2012b) |
| Patient Retention Costs | Amount paid to the patient for study participation, which might include financial compensation, reimbursement for travel, meals, etc | Patient | PICAS® (Medidata Solutions, 2012b) |
| Phase Time | Total length of study phase, in years. For Phases 1, 2, and 3, this variable is equal to the maximum of the phase lengths from DiMasi, et al. (2003), the Number of Site Management Months from Medidata, and the Number of Project Management Months from Medidata. For Phase 4, this variable is equal to the higher of the Number of Site Management Months and the Number of Project Management Months. From DiMasi, et al. (2003): “The timeline is constructed from information on average phase lengths and the average gaps and overlaps between successive phases in a Tufts Center for the Study of Drug Development database of approved new drugs and in our cost survey.” The NDA/BLA review time includes the time from first submission of an NDA/BLA to regulatory marketing approval, and comes from DiMasi, Grabowski, & Vernon (2004). Trial phase times do not reflect differences between therapeutic areas; however, therapeutic areaspecific NDA/BLA review times were available and used for a select list of therapeutic areas. When the user specifies that there are multiple trials within a given phase, total phase time is defined as the average of the maximum phase time entered in any of the trials and the sum of all phase times entered in all of the trials. This is intended to account for the fact that trials may either be concurrent or sequential, depending on the circumstances. | Years | DiMasi, et al., 2003; DiMasi, Grabowski, & Vernon, 2004; CROCAS® (Medidata Solutions, 2012a) |
| Physician Costs | Physician salary cost for one patient (physician salaries divided by the number of patients at site) | Patient | PICAS® (Medidata Solutions, 2012b) |
| Real Annual Discount Rate | The rate at which clinical trial costs are discounted over the time period of the study/development process. Custom discount rates may be entered as decimals between 0 and 1 with leading zero (e.g., 0.15). | Percent | Drug sponsor interviews |
| RN/CRA Costs | Clinical site staff cost (staff salaries divided by the number of patients at site) | Patient | PICAS® (Medidata Solutions, 2012b) |
| SDV Cost | Data clean-up cost for one case report form (CRF) field | Data field | CROCAS® (Medidata Solutions, 2012a) |
| Site Monitoring Costs | On-site monitoring cost for a single day | Day | CROCAS® (Medidata Solutions, 2012a) |
| Site Recruitment Costs | Cost for CRO to evaluate and recruit one site (which may or may not involve a site visit) | Site | CROCAS® (Medidata Solutions, 2012a) |
| Site Retention Costs | Cost for CRO to manage one site for one month | Month | CROCAS® (Medidata Solutions, 2012a) |
| Success Probability | The percent chance that a trial will be successful in a given phase and progress to the next phase (or, in the case of the NDA/BLA review phase, the percent chance that the drug will be granted approval). The BioMedTracker success probabilities used represent ERG's best guess for most relevant therapeutic area; if figures were not available for a similar therapeutic area, general/overall percentages were used. Custom success probabilities may be entered as decimals between 0 and 1 with leading zero (e.g., 0.80). Only one success probability value may be specified for the entire set of trials within a given phase. | Percent per phase | Hay et al., 2011. |
| Worldwide Sales Revenues (millions of 2008 dollars) | Worldwide sales revenues (in millions of dollars) over the product life cycle for new drugs approved in the United States during the period from 1990 to 1994 (net present values, discounted at 11% to the launch year). The revenue figures have been inflated from 2000 dollars to 2008 dollars (midpoint between 2004 and 2012, the range covered by the itemized cost data) using the producer price index for commodities in the category “Drugs and pharmaceuticals” from the Bureau of Labor Statistics (BLS). | Drug / product (millions of 2008 dollars) | DiMasi, Grabowski, & Vernon, 2004; Consumer Price Index (CPI) Inflation Calculator. (2012). |
[a] Phase 1 study sites tend to have in-house or local labs as opposed to central labs.
Appendix C: Features of Operational Model
Upon launching the operational model in Microsoft Excel, the user is automatically taken to the first page of the user form, which prompts the user to indicate whether he intends to examine the impacts of mitigating barriers to clinical trials, or go directly to the examination of clinical trial costs (see Figure C - 1). If “Barrier Impacts” is selected, the user is taken to a screen where different types of barrier mitigation strategies may be selected (see Figure C - 2and Section 5 for further detail). If the user selects “Costs,” the user is then taken to a page that provides a set of instructions and prompts the user to specify the type of clinical trial he would like to model (see Figure C - 3). The clinical trial options built into the model based on data availability include: Therapeutic Area, Devices and Diagnostics, and Pharmacokinetics. If the user selects the “Therapeutic Area” option, a specific therapeutic area must then be chosen from among the following in a separate drop-down menu: Anti-Infective, Cardiovascular, Central Nervous System, Dermatology, Endocrine, Gastrointestinal, Genitourinary System, Hematology, Immunomodulation, Oncology, Ophthalmology, Pain and Anesthesia, and Respiratory System. Once these selections have been made, the user may click on a “Next” button to proceed to the next page of the user form.
Figure C - 1: Welcome Screen of the Clinical Trials Model

Figure C - 2: Impact of Removal of Barriers Screen
Figure C - 3: Selection of Type of Trial Screen for Examination of Costs
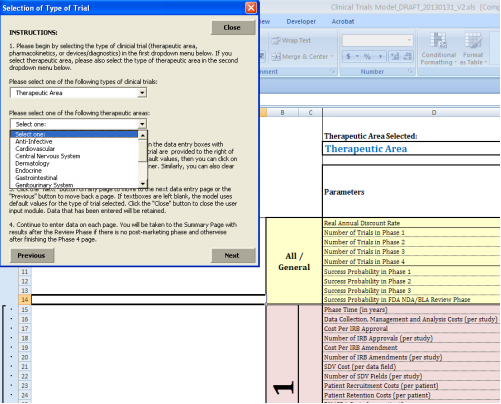
On the succeeding page of the user form (see Figure C - 4), the user then needs to enter some general information about the trial, including the discount rate to be used as well as the probability of success in Phases 1 through 3 and the NDA/BLA review phase. The user may choose to leave these fields blank or specify that the default values be used, in which case these fields are populated with the values from the interviews and literature, as described below. Also on this page are spaces for the user to select the number of trials within each phase. Due to the need to test different dosages or alter other aspects of a trial, multiple trials within a given phase are common or even required in many cases. Therefore, the user must specify how many trials they would like to have in each phase, with possibilities ranging from one to ten for Phases 1 through 3 and zero to three for Phase 4 (if there is no Phase 4, the user needs to enter zero for the number of Phase 4 trials). The ranges for the number of trials for each phase were decided upon based on discussions with the U.S. Department of Health and Human Services (HHS) and the U.S. Food and Drug Administration (FDA) (we asked FDA for an estimate of the number of trials used to support efficacy for NME NDAs and were provided with a range of roughly one to nine trials for Phases 2 and 3). These fields may not be left blank, as the responses will determine how many cost input forms the user will be asked to fill in and how many trial costs are factored into the total phase cost calculations for both the default and custom scenarios.
Figure C - 4: General Questions Screen
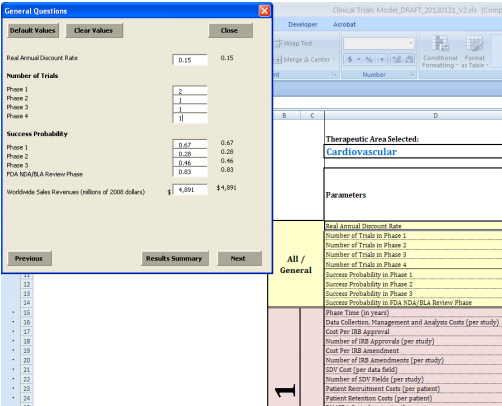
Once this general data are entered, the user may then proceed to the following pages, which request various parameter values for each trial and phase (see Figure C - 5). Within each phase, each trial has its own user input page, and the number of user input pages is equal to the number of trials specified by the user in the previous step. For example, if the user indicates that there would be two Phase 1 trials, the user would see two pages of data to enter for Phase 1. Each of these trial-specific pages asks for information on trial length, number of patients per site, number of sites, and itemized costs, allowing the user to customize values for each trial individually. As on the general tab, the user may choose to populate fields with the default values/averages or enter custom values.
Figure C - 5: Parameter Value Entry for Clinical Trial Study per Trial Phase Screen
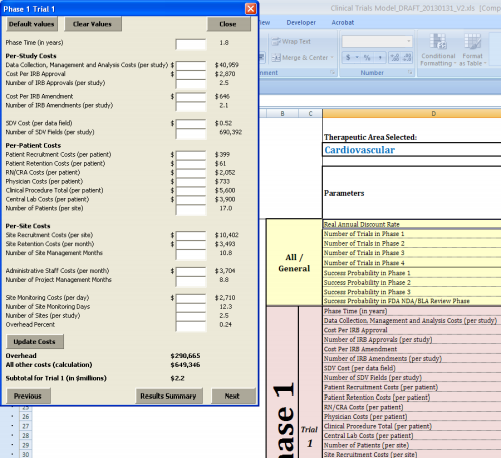
For convenience and ease of use, we have added various user-friendly features to the model interface. For example, if the user is uncertain about the meaning of a particular parameter or wants to understand more fully what it includes, he can hover over the name of the parameter with the cursor to see a brief definition and any important instructions for how to enter a custom value for that parameter. For more information, users can refer to a “Parameter Definitions” page that contains more detailed definitions, as well as information on sources and units. Error-checking is another key feature designed to improve the functionality of the tool. If the user enters a number that is inappropriate for a given parameter (e.g., a negative number), an error message will appear alerting the user to change the custom value entered. Some of these rules are strict and will not permit the user to continue to the next page without entering a valid value. For example, the user cannot enter a trial success probability greater than 1 (100%) or a negative number of patients. Other rules simply provide warnings to the user that the value entered might warrant additional consideration. For example, using the variances from Medidata, we calculated reasonable ranges of possible values that fall within three standard deviations of the default mean. If the user enters a number beyond these ranges (e.g., 20,000 patients per site), a warning message appears. However, given the possibility that users may wish to test the effects of outlier or extreme values, the model permits them to disregard this warning and proceed. Figure C - 6 shows the results screen of the clinical trials model developed.
Figure C - 6: Results Screen
Appendix D: Additional Data Cleaning Steps
We performed the final cleaning and compilation of the various clinical trial data elements using the statistical software STATA. For some combinations of cost component, phase, and therapeutic area, Medidata did not have enough underlying trial data to provide means and variances while still maintaining confidentiality of client information. Because these missing values resulting from these data gaps would render the model’s total cost calculations incomplete, we worked closely with Medidata to extrapolate them as accurately as possible. For the outsourcing and clinical costs that were missing, Medidata multiplied overall U.S. means by phase and therapeutic-area specific factors to create tables of derived costs that could be used to fill in data for phase-therapeutic area combinations for which those measures were missing. Similarly, missing variances were filled in using the overall U.S. variances from the same pool of data used to derive the means. For the counts/non-cost data elements (Number of Site Management Months; Number of Project Management Months, and Number of Site Monitoring Days), Medidata used phase-specific factors to create tables of derived values. However, due to data limitations, these could not be broken down further by therapeutic area. Thus, we used the derived means and variances for these fields to fill in missing values across all therapeutic areas. Missing values in the Number of Planned Patients (per site) and Number of Sites (per study) fields were extrapolated using phase-specific averages across all other therapeutic areas. Finally, Number of SDV Fields (per study) could not be derived by phase or therapeutic area; therefore, in all cases where this measure was blank, it was estimated with the overall U.S. number for all phases and all therapeutic areas.
In addition to filling in missing values for the fields from Medidata, we also had to find data to populate other fields that were missing altogether. Medidata collects data on cost per IRB approvals and cost per IRB amendments which was provided to ERG; however, they do not collect data at this time on the number of IRB approvals or IRB amendments for each study. Therefore they did not have counts by which to multiply the IRB-related costs. To generate counts of IRB approvals, we assumed that one approval would be needed for each site in the study, and created a field called Number of IRB Approvals (per study), which was set to equal the Number of Sites (per study) field provided by Medidata. To obtain counts of IRB amendments, we turned to the literature on clinical trial costs and found counts of protocol amendments in a 2011 study by Kenneth Getz and other researchers at Tufts CSDD (described in Section 4).17 The study reported average numbers of amendments by therapeutic area, and separately by phase (across all therapeutic areas). Thus, we were able to use a similar method to that described above for extrapolating missing values to derive amendment counts by phase and therapeutic area; therapeutic areaspecific factors were calculated and then multiplied by the phase-specific amendment counts, allowing us to fully populate a new field called “ umber of IRB Amendments (per study).” For therapeutic areas for which there was no counterpart in Getz, et al. (2011), we used the counts for the “Other” category.
An additional cleaning step was necessary to reconcile some minor discrepancies between the data obtained from the literature and the data received from Medidata. Specifically, the mean trial phase lengths from DiMasi, Hansen, & Grabowski (2003) were, for a few therapeutic area-phase combinations, slightly shorter than the number of site management months or the number of project management months (defined below) provided by Medidata. To resolve these discrepancies, we set the trial phase length equal to the maximum of these three variables: the mean phase lengths from DiMasi, Hansen, & Grabowski (2003), the number of site management months (from Medidata), and the number of project management months (from Medidata).
17 For the purposes of this study amendments were defined as “any change to a protocol requiring internal approval followed by approval from the IRB, ethical review board (ERB), or regulatory authority. Only implemented amendments—that is, amendments approved both internally and by the ethics committee—were counted and analyzed in this study” (Getz, et al., 2011).