Assessing the Performance of Organ Transplant Programs: Liver and Heart Transplantation
Henry Krakauer Office of Health Policy, Office of the Assistant Secretary for Planning and EvaluationAugust, 1999
Overview
In its role under the National Organ Transplant Act as the responsible steward of the program of solid organ transplantation in the United States, the Department of Health and Human Services has carried out analyses of the three critical issues in transplantation. These are: (1) What is the likelihood that, having been declared a transplant patient by being placed on a waiting list, the patient will actually receive an organ within a reasonable amount of time, say one year? (2) What is the likelihood that the patient will, instead, die while awaiting transplantation? (3) And what is the probability that the patient will still be alive one year after having been placed on the list, whether or not he or she received a transplant?
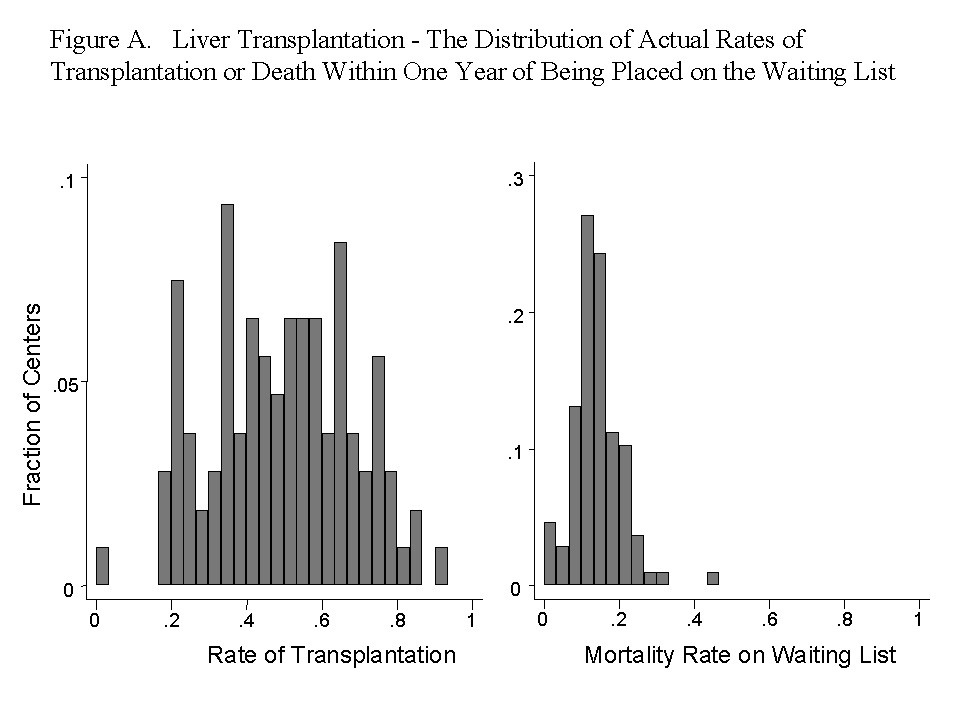
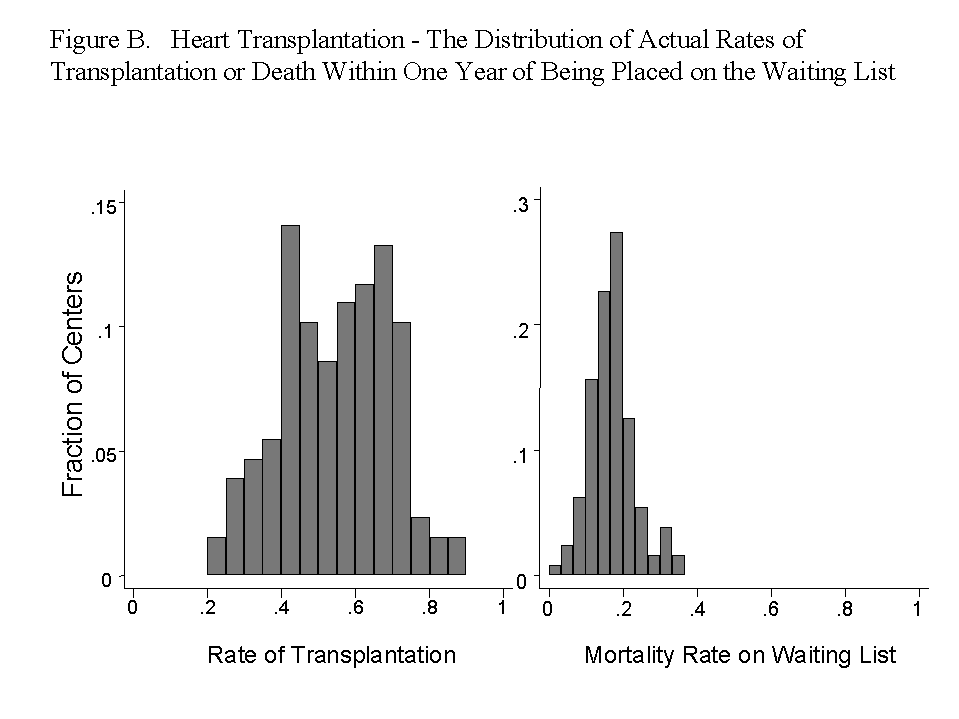
The need for such analyses is highlighted by Figures A (for liver transplantation) and B (for heart transplantation). These figures present the fraction of centers (vertical axis) with actual transplant or waiting-list mortality rates (horizontal axes) and demonstrate the very wide variation among the centers in the rates of transplantation achieved for the patients within one year of being placed on the waiting list. In contrast, the variation in waiting-list mortality rates is much narrower and more clearly centered around an average or peak rate. This indicates that, unlike the probability of death, which is primarily but not solely determined by the clinical condition of the patient, many other considerations determine the probability of being transplanted.
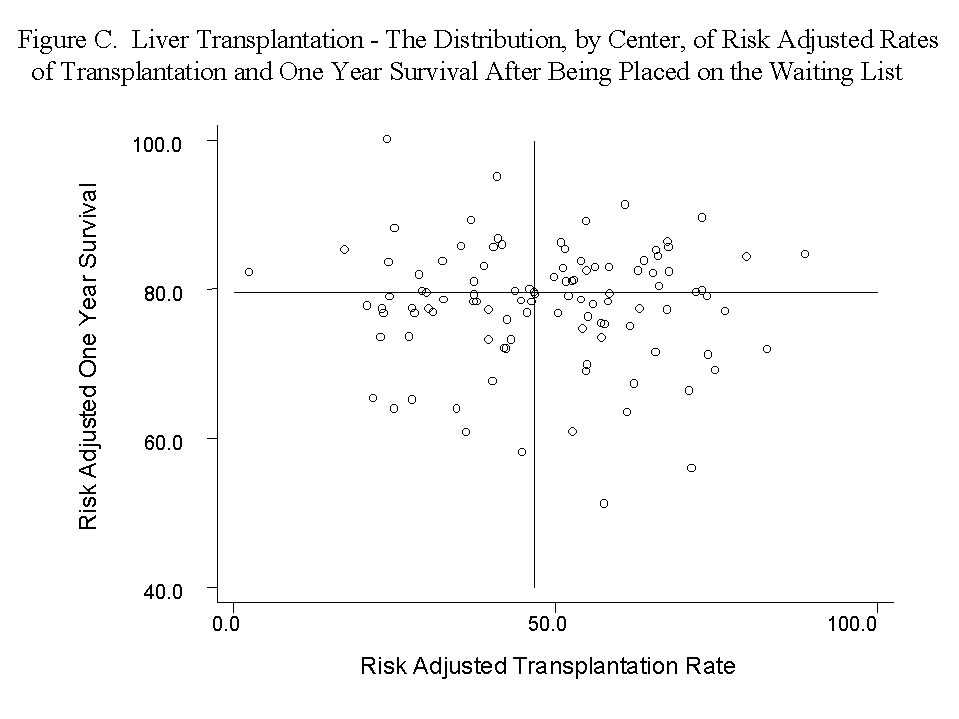
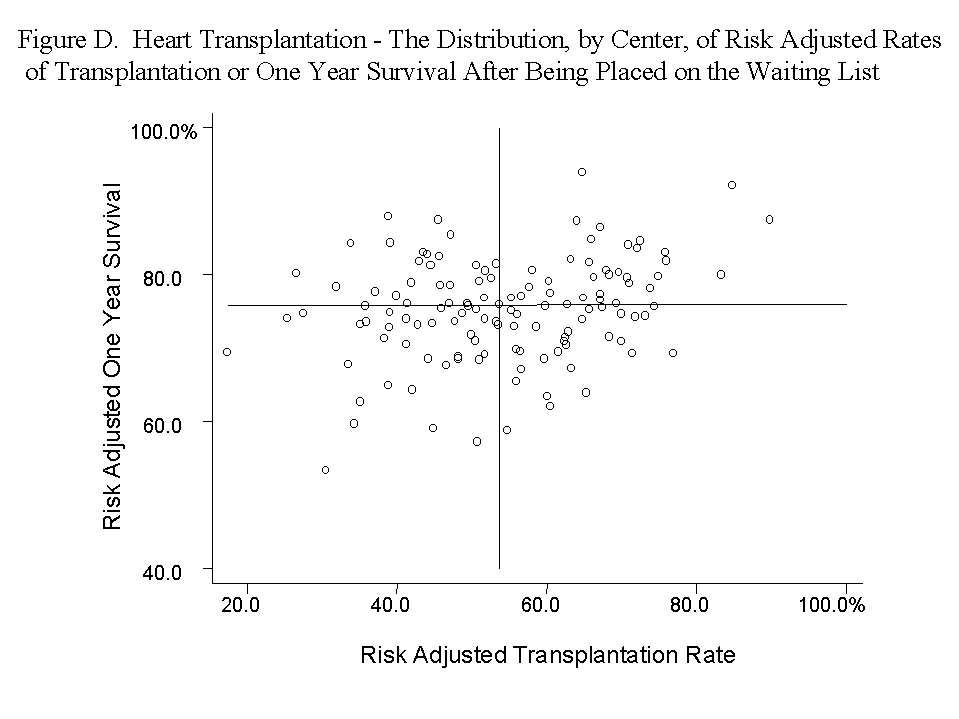
This point is brought out more clearly in Figures C (liver) and D (heart) and in more detail in Tables A (liver) and B (heart). These tables and figures present center-specific risk-adjusted rates of transplantation or of death on the waiting list and the probability of still being alive overall one year after being placed on the waiting list. The risk-adjustment corrects, as best the currently available data permit, for the disparities in the clinical conditions at the time of listing of the patients accepted as candidates by the various centers.
Despite the risk-adjustment, a wide variation in center-specific outcomes is observed. In the case of liver transplantation, 10% of the centers have a standardized risk-adjusted rate of transplantation within one year of listing of 24.9% or less, and 10% have a rate of 71.2% or more. For the probability of dying within a year of listing while awaiting a liver transplant, the corresponding range is 7.7-22.3%, and for the probability of surviving one year as a candidate and/or recipient of the liver transplant the range is 65.3-85.9%. The ranges of standardized risk-adjusted probabilities for heart transplantation are: 35.8-71.8% (transplantation), 9.4-23.1% (death while awaiting a transplant), and 67.0-84.0% (one year survival).
In both liver and heart transplantation, about two-thirds of the deaths within a year of listing occur while awaiting the transplant. The two measures of mortality are strongly correlated, with about 50% of the variation among centers in risk-adjusted survival accounted for by risk-adjusted mortality on the waiting list.
In contrast, there is little correlation between the risk-adjusted rate of transplantation and risk-adjusted survival, none in the case of the liver. In other words, a more aggressive transplant policy does not necessarily achieve better ultimate results. This reinforces the point that the early performance of a transplant is not necessarily the best care that can be provided to a patient. The best care consists of a broad constellation of practices of the listing center and of other hospitals and care-givers to which the patient is subjected while awaiting transplantation, as well as during and after the transplantation itself.
In carrying out these analyses, the Department identified gaps in the currently available data collected by the Scientific Registry. Some additional clinical details about the condition of the patient at the time of listing will be helpful in improving risk-adjustment. Moreover, death is not the sole outcome that must be addressed in the evaluation of transplantation because it is not the sole factor that drives the care of the patient. A clear understanding of the morbidity (clinical complications) and of the impairment of the patients ability to function before and after transplantation is also indispensable. For this, the data are currently not available.
The Department, to fulfill its responsibility for review and oversight of transplantation in the United States, is currently reevaluating the objectives and functions of the Scientific Registry. Its goal is to assure that the Registry carries out on an ongoing and timely basis the assessments of the effectiveness of the transplant program in sustaining the life, health and functional capacities of transplant patients, and of the burdens associated with their care, needed
by the Department and by the transplantation community.
How to Read the Tables
The objective of the accompanying tables is to inform persons concerned with liver or heart transplantation, most particularly the patients, of the likelihood of three critical outcomes: (a) receiving a transplant within one year of being placed on the waiting list, (b) dying before receiving a transplant, and
(c) most importantly, still being alive at least one year after being placed on the waiting list. This information, which applies to an average candidate, is contained in the columns labeled Survival, subheaded Alive (at one year), and Experience on the Waiting List with subheadings Transplanted or Died (within 1 year). The outcomes are presented in two forms, Actual and Adjusted. The term Adjusted refers to a method for correcting for the differences in the severity of the illness of the patients taken care of by the different centers by projecting the centers result, corrected for the severity of illness of its patients, on a standard population. If all patients received equally effective care, the centers adjusted rates would be identical. The differences among the centers in the adjusted rates, therefore, reflect the differences in how well the patients were cared for by the listing center as well as by other hospitals and care givers who participated in the management of the patients conditions.
The first column in each Table identifies by a code number the Center at which the patients were registered as candidates for transplantation. The column labeled Patients gives number of persons listed and provides an indication of how active that center is. The next two columns report on the probability of surviving one year after listing, whether or not a transplant was received - the bottom line. The remaining numerical columns provide information on the two principal alternative events that the patient may experience while awaiting a transplant receipt of the transplant or death. A third alternative, which affects a very small proportion, removal from the waiting list, was also considered in the analyses. All the patients for whom data are displayed in these last columns were followed for at least a full year, hence the cutoff date of December 31, 1997 to permit follow up through 1998. Because of delays in reporting in the post-transplant period, an earlier cutoff date, December 31, 1996, was needed in the analysis of survival.
The ranges listed beneath the US averages cover the middle 80% of the centers. Thus, 10% of the centers had rates below the lower end of the range and 10% had rates above the upper end of the range. In the evaluation of performance, attention should principally focus on the magnitude of the difference between the center=s result and the US average. The ranges are provided to help the reader assess how much the experience of the patients of that center differs from the average.
An additional indication of the differences among the centers is given by the + and - signs to the right of the numbers that signify the rate. This indication addresses the statistical uncertainty about how precisely those differences can be measured. The uncertainty is greatest when few cases or patients are involved and smallest in the case of the high-volume centers. A single symbol indicates that the center=s outcome differs from what would be expected with reasonable certainty (less than 1 chance in 20 that the difference is due to chance only) and two symbols indicate considerable certainty (less than one chance in 100). A + sign indicates that the difference is in a favorable direction (higher probability of transplantation and of surviving at least one year, and lower probability of dying while awaiting a transplant), and a - sign indicates an unfavorable direction (lower than expected probability of transplantation, etc.). The difference between the result obtained at a center and the national average, taken together with this measure of uncertainty, is, therefore, an indication of how distinctively different the experience of the centers patients is from the national average. (Please note that the measures of uncertainty apply to a pattern rather than specifically to the data provided in the Tables. For example, in the case of Survival, the analyses addressed the pattern of survival for a period of up to three years, and that is what is reported by the measure of the level of uncertainty, not just the result at one year given in the Table.)
How to Use the Tables
We have produced the accompanying Tables to draw on recent experience in liver and heart transplantation to help clinicians to provide and patients to obtain the best care possible. By describing what happened to patients following their acceptance as candidates for transplantation by the more than 100 transplant centers in the US, we hope to enable (1) patients and their physicians to make more informed choices, and (2) the transplantation community to more effectively examine its practices and identify those that offer the greatest benefits to the patients.
To compare the experiences of the patients of the various centers, attention should principally be given to the columns that contain the standardized, risk-adjusted data. The data for a particular center should be compared to the national average, given in the first line of each column, and to the range, given in the second line in each column. The range provides reference marks to calibrate the degree of concern with which a centers difference from the national average should be viewed by giving the results obtained by the middle 80% of the centers, with 10% of the centers having results below the low end of the range and 10% above the high end of the range. The columns with the pluses and minuses give an indication of how (un)likely it is that the deviation from the national norm could have been due purely to chance. The pluses and minuses are not measures of how good or bad the centers are. A single plus or minus indicates a chance of less than one in 20 and two pluses or minus a chance of less than one in 100. But keep in mind that over 100 centers are listed in the Tables. That means that for 6 or 7 of them, the observed deviations could in fact be the result of statistical uncertainty at the 1 in 20 level, and for 1 or 2 at the 1 in 100 level.
Therefore, although the data given in the Tables are suggestive, they do not provide definitive proof of superior or inferior performance. What the data do clearly demonstrate is that there is, for the very effective life-saving treatments of heart and liver transplantation, wide variation in the results achieved at different centers, even after variations in the severity of illness of the patients of these centers are corrected for.
We began this note with the statement that the purpose of the Tables is to help us learn from experience. We must end with a word of caution. Whether we draw lessons correctly from experience depends entirely on how completely and accurately the patients, their severity of illness and what happened to them are known to us and on how good the analytic methods that we used are. We are confident about the methods because they have been well tested over the years. However, because the collection of the data about the patients and the clinical events they experience is a complex and arduous task, gaps do exist. In one extreme example, data on either the height or the weight of 80% of the patients of one center were unavailable, preventing the calculation in those cases of the body mass index, an important predictor in several analyses. Depending on how the missing data were handled in the analyses, the results at that center appeared either very good or just average. Therefore, the gaps in the data limit the accuracy of the assessments of performance that we can produce. We are confident about the pattern of variation that we observed, but less so about the position of any given center within that variation. We are currently working with the Scientific Transplant Registry to fill the gaps in the data and to further improve the analytic methods so that we may better determine what works best for patients.
Table A. The Risk-Adjusted Experience of Patients Registered for Liver Transplantation Within One Year of Being Placed on the Waiting List
Survival Experience on the Waiting List (Listings, 4/94-112/96) (Listings, 4/94-12/97) Patients Alive Patients Transplanted Died (at 1 Year) (within 1 year) Center Actual Adjusted Actual Adjusted Actual Adjusted US 16,406 79.6% 79.6% 23,326 46.8% 46.8% 14.1% 14.1% (Range[10-90%] 67.3-87.7 65.3-85.9 22.5-75.0 24.9-71.2 7.4-20.9 7.7-22.3) 12 108 76.2 77.7 175 17.7 20.8 -- 20.0 21.3 13 42 83.1 75.0 44 54.5 61.7 ++ 13.6 18.3 - 14 108 80.2 78.3 157 48.4 46.5 10.8 10.6 15 118 59.9 63.5 -- 171 64.3 61.2 ++ 22.8 24.7 -- 16 280 78.6 82.8 355 44.5 51.3 16.6 14.1 17 340 79.2 76.6 - 469 19.4 23.3 -- 16.4 19.8 18 190 79.3 76.7 258 50.8 50.5 13.2 14.6 19 186 78.7 79.1 226 55.3 52.1 11.1 10.7 20 235 70.6 71.1 -- 296 75.3 73.7 ++ 18.2 18.7 -- 21 18 77.6 76.7 27 40.7 45.7 18.5 22.7 22 21 85.2 84.4 28 75.0 66.0 + 7.1 11.9 23 108 81.0 82.9 148 62.2 58.3 ++ 12.2 12.7 25 377 71.5 73.1 -- 524 46.6 43.2 20.4 22.1 -- 26 202 82.9 82.5 268 58.2 55.0 ++ 15.3 15.3 - 28 490 79.3 83.8 + 655 58.5 54.1 ++ 15.9 13.8 29 100 75.2 73.5 150 21.3 22.9 -- 17.3 19.3 30 556 73.7 77.1 837 69.2 67.4 ++ 14.1 13.6 ++ 31 268 83.2 78.3 364 34.9 37.9 -- 14.0 19.3 32 717 78.3 81.6 + 989 50.3 49.8 14.7 12.6 33 96 76.8 79.5 150 20.7 30.0 -- 18.7 18.3 34 26 61.5 60.8 - 37 59.5 52.8 24.3 25.5 - 35 149 83.0 85.6 206 72.3 67.6 ++ 10.7 10.7 36 156 80.0 73.4 220 53.2 57.2 ++ 11.4 14.7 - 37 151 79.4 78.3 225 34.2 37.4 -- 16.4 17.3 38 178 81.4 78.3 267 54.7 58.3 ++ 10.9 13.1 39 249 85.8 79.6 + 375 74.4 71.9 ++ 11.2 12.1 ++ 41 87 79.1 82.5 104 63.5 62.9 ++ 10.6 11.2 42 93 79.4 79.8 153 75.8 72.9 ++ 15.7 17.0 -- 43 92 75.8 73.1 117 40.2 39.7 - 14.5 13.6 44 87 87.7 84.7 121 90.1 89.0 ++ 7.4 7.7 ++ 45 83 67.3 69.0 - 121 75.2 74.8 ++ 14.0 13.8 ++ 46 348 76.7 78.9 -- 470 24.3 24.3 -- 20.0 17.5 -- 47 356 87.7 83.6 ++ 493 22.5 24.2 -- 11.2 14.6 -- 48 94 79.6 77.3 130 63.8 63.1 ++ 13.8 14.4 - 49 97 77.8 78.5 161 51.6 54.1 13.0 12.4 50 82 69.5 67.6 -- 111 36.0 40.4 18.9 24.5 - 51 118 76.8 76.9 147 77.6 76.4 ++ 11.6 11.6 ++ 52 291 86.1 82.3 + 415 70.4 67.7 ++ 9.4 12.2 ++ 53 160 82.8 83.1 + 269 40.5 39.0 -- 11.9 10.8 ++ 54 145 83.8 81.0 199 52.8 51.7 12.1 12.1 55 94 73.4 72.0 - 136 40.4 42.4 18.4 22.3 - 56 49 72.7 75.2 91 57.1 57.7 ++ 24.2 24.5 -- 57 136 76.4 75.3 206 59.7 57.2 ++ 17.0 18.9 -- 58 164 84.4 79.8 213 25.8 29.3 -- 15.5 18.1 59 97 72.9 68.9 - 168 57.7 54.9 ++ 11.9 14.8 61 457 77.2 77.1 646 37.9 39.8 -- 13.6 14.0 + 63 225 80.7 82.1 308 68.8 65.2 ++ 10.1 10.8 64 112 76.3 77.9 174 52.9 55.9 + 11.5 10.7 65 69 77.8 76.2 88 59.1 55.2 14.8 15.7 66 247 72.9 79.2 409 36.4 37.6 -- 18.3 15.4 67 262 80.3 80.4 392 65.8 66.1 ++ 11.2 12.1 ++ 68 55 90.9 89.1 + 90 56.7 54.9 12.2 12.7 69 259 80.2 76.7 366 23.0 28.2 -- 13.4 17.0 70 177 62.4 63.9 -- 208 35.1 34.7 32.2 33.1 -- 71 338 75.6 78.5 433 32.3 32.6 -- 18.5 14.9 72 113 83.7 84.3 173 81.5 79.7 ++ 8.7 8.5 ++ 73 8 62.5 67.2 46 65.2 62.2 + 21.7 18.8 - 74 128 71.5 77.2 158 34.2 30.3 -- 20.9 16.4 75 112 79.8 80.0 148 52.0 46.0 8.8 8.3 + 76 154 78.1 78.4 261 34.9 44.8 10.3 9.6 + 77 128 77.0 77.2 231 20.3 23.1 -- 16.5 16.5 - 78 673 80.1 79.3 854 48.0 47.0 12.5 11.7 + 79 101 60.6 66.3 -- 150 66.0 70.8 ++ 18.7 15.1 -- 80 196 75.2 77.3 250 33.6 27.8 -- 20.0 16.0 - 81 68 70.4 71.9 - 100 84.0 82.9 ++ 14.0 15.5 -- 82 232 77.5 75.8 324 44.4 42.6 20.1 21.4 -- 83 32 75.0 71.4 45 68.9 65.6 ++ 20.0 21.4 -- 84 7 84.6 83.8 32 65.6 63.8 ++ 12.5 15.3 - 85 120 83.0 81.2 211 46.4 53.0 + 14.7 14.8 86 266 86.7 85.6 ++ 391 33.5 40.5 -- 8.4 10.4 ++ 87 41 73.2 65.3 68 20.6 21.7 -- 17.6 21.4 88 720 79.3 82.9 ++ 1042 62.9 56.3 ++ 13.0 10.8 90 127 83.9 81.0 202 34.2 37.6 -- 10.9 11.6 + 91 126 84.6 81.1 189 47.1 52.6 10.6 10.3 92 . . . 29 48.3 36.1 13.8 12.1 93 12 100.0 79.0 13 76.9 73.6 0.0 0.0 ++ 94 45 72.6 79.4 66 68.2 58.5 + 15.2 14.8 95 16 86.2 85.7 29 37.9 35.5 13.8 12.1 96 11 100.0 91.3 16 75.0 60.9 0.0 0.0 ++ 97 32 93.7 95.0 + 39 56.4 41.1 7.7 8.9 98 25 87.8 83.8 31 41.9 32.5 9.7 11.8 99 51 82.7 89.2 + 73 46.6 37.1 9.6 7.3 + 100 10 50.0 55.9 - 11 54.5 48.1 ++ 45.5 51.9 102 32 87.0 85.2 35 28.6 17.3 -- 14.3 16.4 103 156 74.3 73.6 208 37.0 27.2 -- 21.6 21.8 104 41 85.3 89.6 53 84.9 72.8 + 5.7 6.4 105 33 84.1 86.2 51 62.7 50.9 5.9 6.7 106 33 84.8 85.3 41 65.9 51.6 7.3 9.3 108 112 87.3 86.7 143 39.9 41.2 - 10.5 9.9 + 109 58 78.0 79.7 102 47.1 43.8 9.8 7.2 ++ 110 128 85.7 85.9 + 171 43.9 41.9 - 9.9 10.9 111 374 87.3 81.9 + 547 26.0 28.8 -- 10.8 13.6 ++ 112 777 89.8 88.1 ++ 1024 21.2 25.1 -- 9.7 11.2 ++ 113 28 70.8 76.8 56 26.8 31.0 - 19.6 19.3 114 41 65.4 55.9 - 58 70.7 71.2 ++ 15.5 17.0 -- 115 177 78.6 85.2 250 65.6 65.6 ++ 9.2 7.6 117 47 58.3 63.9 -- 93 17.2 24.9 -- 20.4 16.5 119 7 71.4 69.8 16 56.2 55.0 12.5 15.8 121 17 94.1 65.1 17 23.5 27.8 - 5.9 9.8 122 12 82.5 60.8 25 32.0 36.3 24.0 29.4 123 101 99.0 82.2 ++ 214 0.9 2.6 -- 1.9 4.7 ++ 124 6 83.3 86.4 14 78.6 67.5 0.0 0.0 ++ 125 47 68.5 58.1 -- 65 43.1 44.9 - 26.2 28.1 -- 126 6 50.0 74.6 20 40.0 54.3 15.0 12.3 127 24 31.7 51.2 -- 30 60.0 57.6 + 26.7 24.6 -- 128 5 100.0 100.0 10 20.0 23.9 - 0.0 0.0 ++ 129 12 83.3 72.0 70 32.9 42.1 11.4 11.4
Table B. The Risk-Adjusted Experience of Patients Registered for Heart Transplantation Within One Year of Being Placed on the Waiting List
Survival Experience on the Waiting List (Listings, 4/94-112/96) (Listings, 4/94-12/97) Patients Alive Patients Transplanted Died (at 1 Year) (within 1 year) Center Actual Adjusted Actual Adjusted Actual Adjusted US 10,034 75.8% 75.8% 13,448 53.7% 53.7% 16.5% 16.5% (Range[10-90%] 64.4-83.5 67.0-84.0 35.0-72.7 35.8-71.8 10.0-24.7 9.4-23.1) 1 38 77.6 71.3 58 60.3 62.6 + 19.0 18.0 6 43 70.5 76.0 52 42.3 46.9 23.1 20.7 7 66 70.5 69.2 82 74.4 71.4 ++ 18.3 19.3 -- 8 92 74.9 69.7 119 56.3 56.0 14.3 16.4 9 52 80.6 74.6 64 48.4 48.8 17.2 17.9 12 61 80.0 81.8 88 72.7 76.0 ++ 13.6 13.0 + 15 54 65.1 53.3 -- 65 24.6 30.5 - 20.0 28.7 16 63 74.5 75.1 86 65.1 65.7 + 17.4 15.2 17 75 89.2 79.6 116 63.8 70.7 ++ 6.0 7.5 18 110 71.3 68.5 -- 133 39.1 44.2 - 21.1 20.2 19 86 83.2 75.2 113 44.2 50.6 9.7 13.5 20 51 81.1 77.3 71 64.8 67.2 + 8.5 10.2 21 78 73.8 70.8 91 67.0 62.4 + 17.6 20.2 - 22 92 80.3 74.8 125 34.4 39.0 -- 17.6 23.1 23 32 84.4 84.7 46 71.7 66.0 8.7 10.9 24 29 93.1 87.9 34 35.3 38.9 -- 8.8 9.2 + 25 146 89.4 87.4 + 195 40.0 45.5 -- 10.8 14.6 + 27 55 68.2 65.4 72 58.3 56.0 15.3 19.6 28 342 74.4 73.3 479 48.6 44.7 -- 19.0 17.3 -- 29 23 73.9 75.9 32 68.8 69.3 9.4 6.9 30 109 80.5 76.0 137 47.4 49.4 - 13.1 12.9 + 33 40 79.9 70.9 49 44.9 50.6 12.2 17.3 34 47 82.8 87.3 58 60.3 64.1 8.6 10.0 35 42 73.7 72.9 52 55.8 55.7 17.3 18.8 36 54 65.6 59.1 - 88 43.2 44.8 19.3 23.9 37 112 70.2 72.8 166 60.2 58.6 16.9 15.0 38 54 72.0 68.7 83 50.6 48.3 19.3 19.5 40 196 76.4 73.1 249 31.3 35.0 -- 18.1 21.0 41 69 78.1 76.8 92 68.5 64.9 ++ 16.3 18.1 42 43 82.0 82.0 66 65.2 63.2 13.6 12.1 43 64 65.5 70.3 79 63.3 62.6 + 20.3 18.4 44 247 80.0 78.8 327 74.6 71.1 ++ 10.1 10.1 45 106 79.1 78.5 134 43.3 45.7 - 18.7 19.4 47 91 74.3 76.5 119 68.1 67.1 ++ 16.8 17.5 - 48 41 69.9 73.8 55 67.3 64.7 + 18.2 16.4 49 34 70.4 67.7 40 32.5 33.5 -- 22.5 19.8 50 148 74.9 74.1 203 71.4 71.8 ++ 17.7 18.8 -- 51 34 69.2 68.5 38 57.9 59.7 18.4 18.6 52 255 72.0 73.5 - 314 47.8 47.7 -- 15.0 14.7 ++ 53 129 64.4 67.1 - 162 56.2 56.6 + 24.1 22.7 -- 54 117 74.3 70.4 141 41.1 41.2 -- 18.4 22.8 57 62 79.0 79.1 101 62.4 60.3 14.9 15.1 58 116 66.0 69.0 155 51.6 51.8 21.9 21.4 59 44 75.9 73.8 59 49.2 51.8 25.4 23.5 60 80 80.7 75.3 113 43.4 45.8 16.8 19.6 61 42 80.9 80.5 54 51.9 51.9 11.1 11.4 62 66 60.6 67.5 97 49.5 46.6 32.0 31.1 -- 63 99 84.4 78.3 123 28.5 31.9 -- 12.2 16.2 ++ 65 77 71.4 74.6 95 25.3 27.5 -- 22.1 22.5 66 155 76.0 76.7 198 56.6 55.3 19.7 19.0 - 67 23 73.8 84.3 ++ 26 42.3 39.1 - 15.4 8.8 + 68 59 74.4 71.4 78 67.9 68.4 ++ 11.5 14.0 70 40 95.0 93.9 ++ 50 62.0 64.8 4.0 6.5 71 60 73.3 73.0 93 54.8 53.6 16.1 19.9 72 49 73.4 74.3 - 68 73.5 73.1 ++ 17.6 19.2 -- 73 56 81.9 78.5 68 38.2 47.0 - 11.8 12.9 74 73 75.1 78.9 98 44.9 41.9 17.3 17.0 75 74 67.5 64.2 97 39.2 42.1 23.7 28.0 76 153 89.4 82.7 + 223 43.0 43.9 -- 11.2 15.6 + 77 49 74.6 62.0 70 55.7 60.5 12.9 13.8 78 68 79.4 82.4 93 45.2 45.6 -- 14.0 11.2 ++ 79 55 87.1 86.4 83 67.5 67.1 + 6.0 5.3 80 100 80.9 74.5 126 47.6 56.2 14.3 16.2 81 70 75.7 68.3 88 51.1 51.1 18.2 22.8 82 18 69.1 81.2 25 48.0 50.7 16.0 12.3 83 70 76.6 73.0 97 42.3 42.7 -- 15.5 14.8 + 84 46 83.5 83.1 60 43.3 43.5 16.7 19.4 85 24 66.7 68.4 37 48.6 48.2 27.0 23.7 87 62 75.8 73.9 80 41.2 41.2 -- 18.8 18.7 88 171 83.1 84.0 + 225 68.9 71.0 ++ 12.0 12.3 90 60 85.0 81.8 83 42.2 43.0 - 19.3 21.5 91 89 76.3 79.5 + 112 51.8 52.6 14.3 18.4 92 10 69.3 67.2 18 61.1 63.3 16.7 20.0 94 41 78.0 75.7 51 29.4 35.7 -- 13.7 17.7 95 89 80.2 83.6 120 78.3 72.1 ++ 10.0 11.0 96 119 80.3 77.0 180 58.3 56.6 16.1 16.0 97 157 72.0 64.8 -- 206 33.0 38.8 -- 20.9 26.9 98 138 81.0 80.3 192 68.8 69.6 ++ 9.4 9.4 99 72 75.5 69.5 101 58.4 56.6 13.9 16.1 100 35 74.3 75.5 48 70.8 74.4 ++ 18.8 18.6 -- 101 32 65.6 63.9 46 65.2 65.3 10.9 10.2 102 21 68.1 84.6 40 62.5 72.4 ++ 25.0 20.2 -- 103 55 64.5 72.8 71 45.1 39.0 - 31.0 23.3 104 141 76.7 79.1 162 50.6 51.1 14.2 12.9 105 96 81.1 71.2 123 29.3 38.2 -- 13.0 21.0 106 121 79.5 75.6 169 60.4 59.8 12.4 13.0 108 28 69.9 59.7 31 32.3 34.3 22.6 29.4 109 34 57.7 58.8 - 45 57.8 54.9 22.2 23.0 111 71 83.0 75.4 88 64.8 67.4 ++ 10.2 13.7 112 146 77.9 76.0 198 40.9 41.3 -- 15.7 20.0 113 33 74.9 74.5 42 71.4 70.0 + 14.3 16.2 114 21 60.5 62.6 24 37.5 35.2 - 20.8 16.9 115 204 72.8 73.4 260 35.8 35.8 -- 20.8 21.4 118 38 49.7 57.2 -- 40 50.0 50.8 30.0 24.0 119 18 82.5 77.1 40 40.0 39.9 17.5 21.3 120 317 79.3 81.4 ++ 449 56.1 53.3 14.9 14.2 121 172 72.5 76.7 228 53.1 51.7 18.0 16.3 122 46 74.1 81.6 62 74.2 65.6 12.9 9.1 123 31 74.1 69.2 32 71.9 76.9 ++ 21.9 18.3 - 124 97 70.1 75.7 136 54.4 49.5 24.3 19.8 125 338 76.7 78.3 509 55.8 57.8 14.9 14.2 126 111 75.0 73.5 146 56.2 53.3 15.1 16.7 128 19 78.6 85.4 28 57.1 47.3 25.0 15.6 129 11 81.8 87.4 19 84.2 89.7 ++ 15.8 10.3 130 9 55.6 71.7 15 66.7 50.0 26.7 16.6 131 13 76.9 75.0 15 66.7 55.3 20.0 14.4 132 13 53.9 69.3 15 26.7 17.4 -- 33.3 20.6 133 13 32.6 73.0 15 40.0 . 33.3 . 137 70 63.9 72.1 89 67.4 62.9 24.7 18.5 138 59 75.8 80.0 80 85.0 83.3 + 12.5 11.2 139 18 55.6 70.8 22 72.7 69.9 18.2 16.7 143 29 68.3 79.8 43 81.4 74.9 9.3 6.8 144 15 66.7 79.7 22 72.7 66.3 13.6 7.4 145 57 80.2 84.2 + 78 39.7 33.8 -- 17.9 12.0 ++ 146 31 62.9 80.2 40 35.0 26.6 -- 32.5 15.6 + 147 39 55.8 77.7 62 48.4 37.0 -- 30.6 14.4 + 148 105 71.5 80.6 ++ 146 66.4 67.9 ++ 17.8 14.8 ++ 150 76 74.9 75.8 115 64.3 62.7 ++ 18.3 17.0 151 139 78.0 77.5 190 61.6 60.5 + 15.3 14.8 152 46 84.7 80.5 68 52.9 58.1 10.3 11.1 154 41 79.7 78.2 60 71.7 73.8 + 13.3 8.1 156 86 87.2 83.0 110 77.3 75.8 ++ 10.0 10.8 157 54 63.7 63.3 59 62.7 60.1 + 22.0 23.5 - 158 58 93.1 92.1 ++ 94 89.4 84.8 ++ 3.2 3.6 159 35 81.5 81.3 51 45.1 44.5 - 15.7 14.0 160 14 71.4 69.4 18 66.7 61.6 22.2 23.5 161 64 78.1 73.9 91 23.1 25.3 -- 19.8 18.5 - 162 23 69.2 80.0 + 30 76.7 68.4 13.3 9.3