
About this Research Brief
This paper explores the distribution of plan AVs for individuals enrolled in employer-sponsored insurance. This brief was written by PierreL. Yong, M.D., M.P.H., John Bertko, F.S.A., M.A.A.A., Richard Kronick, Ph.D.
Sherry A. Glied, Ph.D.
Assistant Secretary for Planning and Evaluation
Richard Kronick, Ph.D.
Deputy Assistant Secretary for Health Policy
According to this preliminary analysis, the vast majority — at least approximately 98 percent — of enrollees in Employer-Sponsored Insurance (ESI) are enrolled in plans that meet and exceed an Actuarial Value (AV) of 60 percent whether a hybrid or internal approach is utilized to assess AV. Because there are so few individuals in plans with AVs below 60 percent when assessed against a relatively broad package of services (as illustrated by the FEHBP-PPO plan) in the hybrid approach, and because services such as hospital, physician, and pharmacy benefits account for such a large fraction of the spending in the relatively broad package, the choice of the broader or narrower package of services described in this paper has little effect on the estimated fraction of people in plans with an AV below 60 percent. Plans with benchmark AVs falling below 60 percent are likely PPO plans with high deductibles, in which most individuals do not reach the annual deductible, or so-called mini-med plans, which have low annual limits.
"Summary
- According to preliminary estimates, the overwhelming majority of employer-sponsored insurance (ESI) plans meets and exceeds an actuarial value (AV) of 60 percent. An estimated 1.6 to 2.0 percent of individuals covered by employer-sponsored insurance (ESI) — approximately 2.6 to 3.2 million individuals — are estimated to be enrolled in plans that have an actuarial value below 60 percent when AV is assessed relative to a benchmark set of services such as the services covered in the Federal Employees Health Benefits Program Blue Cross/Blue Shield Preferred Provider Organization (FEHBP-PPO) plan.
- According to this preliminary analysis, the choice of a broader versus a narrower benchmark set of services is likely to have minimal impact on the estimated number of enrollees in plans with AVs below 60 percent. A hypothetical example of a narrower benchmark set of services (relative to the FEHBP-PPO plan) that excludes coverage for rehabilitative services, durable medical equipment, acupuncture and chiropractic services, and home health services is used to estimate this difference. This set of excluded services accounts for a small share of the total cost (5 percent of the total of covered services in the broader benchmark), so using a narrower benchmark increases the estimated AV of each plan by only a small amount. Further, because there are very few enrollees in plans with AVs below 60 percent when assessed against a broader benchmark, using a narrower benchmark has very little effect on the estimated number in plans with AVs below the 60 percent threshold. The estimated number of individuals in ESI plans with AVs below 60 percent declines very slightly to approximately 2.2 to 2.9 million when AV is assessed relative to a narrower benchmark set of services.
- Plans with benchmark AVs falling below 60 percent under either a broader or narrower standard are likely PPO plans with high deductibles, in which most individuals do not reach the annual deductible, or so-called mini-med plans, which have low annual limits.
Introduction
This paper explores the distribution of plan AVs for individuals enrolled in employer-sponsored insurance (ESI). Note that there are many important issues related to calculating AV that are beyond the scope of this paper. For example, issues around the choice of data for calculating AVs (e.g., plan specific data or a national standard dataset) have been discussed in a brief released by the American Academy of Actuaries. Many factors that may have large impacts on premiums are not discussed, including the health status of the covered population, the prices paid by plans for medical services and items, the breadth of the provider network, the plan’s coverage of out-of-network care, and use of utilization management tools. This paper is intended for discussion only and is not guidance related to health reform.
Methods for Calculating Actuarial Values of Employer-Sponsored Insurance
In this draft white paper, we report on the distribution of AVs of ESI plans. This preliminary analysis was conducted by Actuarial Research Corporation (ARC), in collaboration with John Bertko, the senior health actuary at the Center for Consumer Information and Insurance Oversight/Centers for Medicare and Medicaid Services.
AV is calculated as the share of expenses for covered services paid by a plan for a given population, where the numerator is the expenses paid by the plan and the denominator is the total cost of covered services. The total cost of covered services (i.e., the denominator) depends on at least two parameters — first, the services covered, and second, the cost-sharing structure of the plan. The effect of the services covered on the denominator should be clear — if a plan covers a broad set of services the denominator will be larger than if a plan covers a narrow set of services. The effect of cost-sharing on the denominator is through the relationship between cost-sharing and utilization. A plan with larger amounts of patient cost-sharing will have lower levels of expected total spending than a plan with lower amounts of patient cost-sharing, because patient cost-sharing levels affect utilization.
Given these parameters, consider the following approaches to determining the total cost of covered services for AV calculations: 1) an internal benchmark for covered services and cost-sharing and 2) an external benchmark for covered services and an internal benchmark for cost-sharing — a hybrid approach (Figure 1).
Figure 1.
Summary of approaches to estimating the total cost of covered services for AV calculations
| Approach | Benchmark | |
|---|---|---|
| Covered services | Cost-sharing structure | |
| Internal | Internal | Internal |
| Hybrid | External | Internal |
For the purposes of this analysis, we primarily estimated the total cost of covered services utilizing a hybrid approach because this method could be used to establish a reference point for the breadth and generosity of ESI plans. We also conducted the analyses using the internal approach. These results are reported below.
Two external benchmarks for services were selected as illustrative examples. The first uses the services covered by the Federal Employees Health Benefits Program Blue Cross/Blue Shield Preferred Provider Organization plan (FEHBP-PPO).1 The FEHBP-PPO plan, the “broader benchmark,” was chosen for this exercise because ARC had previously conducted analyses using that plan, and had detailed information on the services covered by the plan. For the purposes of this analysis, we also consider a second benchmark, the “narrower benchmark,” which covers a more limited set of health services — physician and mid-level practitioner care, hospital and emergency room services, pharmacy benefits, and laboratory and imaging services. Very few plans in the market today do not cover all of these services.2
Rehabilitative services, durable medical equipment, acupuncture and chiropractic services, and home health services are among the excluded services of the narrower benchmark. While many employer plans currently cover most or all of the services excluded from the narrower benchmark, we excluded these services from the narrower benchmark in this hypothetical example to assess the impact the choice of services included in the benchmark had on the estimated fraction of enrollees in ESI plans with AVs below 60 percent. The services excluded in the narrower benchmark account for 5 percent of the total cost of the services in the broader benchmark (Figure 2).
Figure 2.
Percentage of total cost for covered medical services by service category
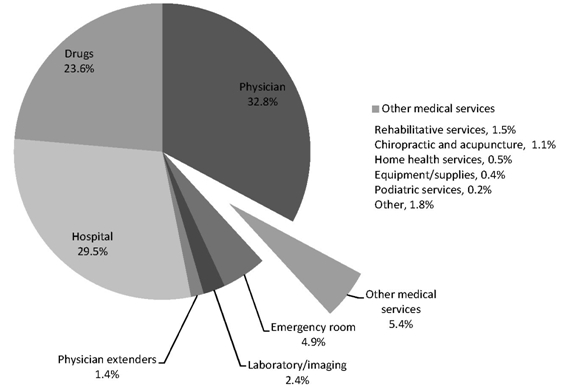
Source: ARC analysis of Medical Expenditure Panel Survey (2005).
The AVs for plans representative of those covering persons under age 65 with ESI through active employment were calculated by evaluating the cost-sharing parameters of the plans, for services covered under the external benchmark, against the expenditures and utilization of a standard population. This was done by means of a claims repayment program, which evaluated the plan’s cost sharing parameters (copayments, deductible, coinsurance, out-of-pocket maximum and benefit maximums) against the covered services as defined by the benchmark (see Appendix A for a technical description of methodology).
1 Services in the FEHBP-PPO plan include physician and mid-level practitioner services, hospital and emergency room services, pharmacy benefits, equipment/supplies, laboratory and imaging services, midwife services, complementary and alternative medicine (chiropractic and acupuncture services), physical and occupational therapy, mental health, and podiatric services. Benefits in this example do not include dental or vision services.
2 Based on data from the Bureau of Labor Statistics’ National Compensation Survey, 2009.
Results
Hybrid Approach
Using the set of services covered by the FEHBP-PPO plan, our preliminary results suggest that an estimated 1.6 to 2.0 percent of individuals — approximately 2.6 to 3.2 million people — are enrolled in ESI with a benchmark AV below 60 percent in today’s marketplace (Figure 3).
Figure 3.
Cumulative percentage and estimated number of individuals enrolled in
employer-sponsored insurance under age 65
by actuarial value of the plans, estimated values for 2010*
| Actuarial value (%) | Cumulative percentage of individuals
enrolled in ESI plans (%) |
Number of enrolled individuals
(millions) |
|
|---|---|---|---|
| 60 | 2 | 3 | |
| 70 | 4 | 6 | }98% |
| 80 | 20 | 32 | |
| 90 | 60 | 96 | |
| 100 | 100 | 160 |
Key: ESI = employer-sponsored insurance
* Note: Cost of covered services was calculated using the set of covered services of the Federal Employees Health Benefits Program Blue Cross/Blue Shield Preferred Provider Organization plan as an external benchmark and the cost-sharing structure of the plan whose AV is being estimated.
Source: Composite of ARC analysis of Bureau of Labor Statistics National Compensation Survey plan provision data (2005), HRET/KFF Employer Survey data (2006-2010), adjusted for estimated buy-down in the small group market, induction, and mini-med plan enrollment.