
Vulnerable Youth and the Transition to Adulthood
Youth from Low-Income Families
July 2009
This Research Brief is part of a larger project:Vulnerable Youth and the Transistion to Adulthood
This Research Brief is available on the Internet at:http://aspe.hhs.gov/hsp/09/VulnerableYouth/3/index.shtml
Printer friendly version in PDF format (4 pages)Free PDF reader 
The author acknowledges the comments of Caroline Ratcliffe, Jennifer Macomber, and Michael Pergamit of the Urban Institute. Also from the Urban Institute, Tracy Vericker helped conceptualize the project and Daniel Kuehn performed the data work and provided technical assistance. Additional information regarding this study can be obtained from the Federal Project Officers: Flavio Menasce (202-260-0384, Flavio.Menasce@hhs.gov), Susan Hauan (202-690-8698, Susan.Hauan@hhs.gov), and Annette Rogers (202-690-7882, Annette.Rogers@hhs.gov).
In 2007, nearly 40 percent of children in the United States lived in low-income families families with incomes at or below 200 percent of the federal poverty level (FPL).[1] Youth from low-income families are vulnerable to poor outcomes as adults, as these youth often lack the resources and opportunities found to lead to better outcomes. This fact sheet compares the young adult outcomes and adolescent risk-taking behaviors of youth from low-income families to those from middle-income (201400 percent of FPL) and high-income (401 percent of FPL or higher) families. All differences discussed below are significant at the 95 percent confidence level or above.
- Youth from low-income families engage in more risk behaviors during adolescence (3.5 mean cumulative risks) than youth from middle-income (3.2 mean cumulative risks) and high-income (2.9 mean cumulative risks) families.[2]
- Youth from low-income families are more likely than youth from middle- and high-income families to have sex before age 16, become a member of a gang, attack someone or get into a fight, steal something worth more than 50 dollars, and ever run away. However, youth from low-income families are not more likely than youth from middle- and high-income families to use alcohol and marijuana, sell illegal drugs, or destroy property.
- Seven percent of young women from low-income families have a child by age 18, while only 2 percent of females from middle-income families and 1 percent of females from high-income families have a birth by this age.
- Nearly a third of youth from low-income families (29 percent) fail to earn high school diplomas, approximately three times greater than the percentage of youth from middle-income families (10 percent) and roughly six times greater than the percentage of youth from high-income families (5 percent).[3]
- Only one in ten youth from low-income families (10 percent) go on to graduate from a four-year college, compared with over a quarter (28 percent) of youth from middle-income families and half (50 percent) of youth from high-income families.
- One in five youth from low-income families (20 percent) are charged with an adult crime by the age of 24, which is higher than the number of youth from middle- and high-income families (16 and 12 percent, respectively).
- Less than half of youth from low-income families (44 percent) remain consistently-connected to school and/or the labor market between ages 18 and 24, a lower share than among youth from middle- and high-income families (67 and 75 percent, respectively) (see Figure 1).[4]
- Roughly 1 in 5 youth from low-income families (18 percent) never connect (making extremely short, or no connections to school and/or the labor market between ages 18 and 24), while only 1 in 50 youth from high-income families (2 percent) fall into this category.
FIGURE 1. Youth Consistently-Connected to School or Work between Ages 18 and 24
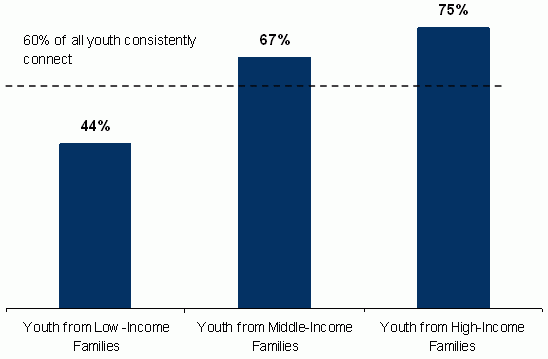
Source: Urban Institute estimates of the National Longitudinal Survey of Youth 1997.Notes: Sample sizes: all youth, n = 2,041; youth from low-income families, n = 896; youth from middle-income families, n = 594; youth from high-income families, n = 365. Consistently-connected youth are in school or working most of the time between ages 18 and 24. Differences are statistically significant at or above the 95% confidence level.
| Youth from low-income families (n = 896) | Youth from middle-income families (n = 594) | Youth from high-income families (n = 365) | All youth (n = 2,041) | |
| Adolescent Risk Behaviors | ||||
| Cumulative risky behaviors (mean) | 3.5 | 3.2* | 2.9* | 3.3 |
| Alcohol by age 13 | 15% | 13% | 15% | 15% |
| Marijuana by age 16 | 35% | 34% | 33% | 35% |
| Used other drugs | 26% | 26% | 29% | 27% |
| Sex by age 16 | 59% | 48%* | 39%* | 51% |
| Attack someone/get into a fight | 33% | 26%* | 22%* | 28% |
| Member of a gang | 12% | 7%* | 5%* | 9% |
| Sell drugs | 19% | 19% | 20% | 19% |
| Destroy property | 35% | 38% | 36% | 36% |
| Steal something worth less than $50 | 46% | 47% | 44% | 46% |
| Steal something worth more than $50 | 18% | 13%* | 11%* | 15% |
| Other property crime | 16% | 15% | 10%* | 14% |
| Carry a gun | 19% | 16% | 11%* | 16% |
| Ever run away | 21% | 16%* | 12%* | 18% |
| Other Sexual activity | ||||
| Sex by age 13 | 5% | 3%* | 3% | 4% |
| Birth by age 18 (of female youth) | 7% | 2%* | 1%* | 4% |
| Highest Degree Completed by Age 23-24 | ||||
| None | 29% | 10%* | 5%* | 17% |
| High school diploma | 55% | 54% | 39%* | 51% |
| Associates degree | 5% | 8% | 5% | 6% |
| Four-year college degree or higher | 10% | 28%* | 50%* | 26% |
| Median Annual Earnings (among Earners) | ||||
| Age 18 | $10,402 | $10,570 | $8,997 | $10,139 |
| Age 19 | $13,026 | $13,127 | $11,800 | $12,637 |
| Age 20 | $13,704 | $14,214 | $14,105 | $13,876 |
| Age 21 | $16,366 | $18,783* | $18,700 | $17,384 |
| Age 22 | $18,806 | $22,265* | $23,762* | $21,430 |
| Age 23 | $21,591 | $20,937 | $24,951* | $22,411 |
| Employment | ||||
| Employed on 24th birthday | 71% | 77% | 89%* | 77% |
| Connectedness to School or Work between Ages 18 and 24 | ||||
| Consistently-connected | 44% | 67%* | 75%* | 60% |
| Initially-connected | 17% | 13%* | 13% | 15% |
| Later-connected | 21% | 14%* | 9%* | 15% |
| Never-connected | 18% | 6%* | 2%* | 10% |
| Charged with a Crime | ||||
| Charged with an adult crime by age 24 | 20% | 16%* | 12%* | 17% |
| Source: Urban Institute estimates of the National Longitudinal Survey of Youth 1997.Notes: Some youth who did not complete high school may have earned a General Equivalency Diploma. Median earnings exclude youth who did not work and therefore had zero earnings. The cumulative risk behavior score is based on the 13 risk behaviors listed beneath it. Adolescent risk behaviors are measured up to age 18, except where otherwise noted. Never-connected youth may make extremely short connections to school or the labor market. * Estimate is significantly different from youth from low-income families at the 95% confidence level or above. | ||||
Endnotes
[1] United States Bureau of the Census. 2008 Annual Social and Economic (ASEC) Supplement. Retrieved October 23, 2008 from: http://pubdb3.census.gov/macro/032008/pov/new02_200_01.htm.
[2] Cumulative risky behaviors include consuming alcohol before age 13, using marijuana before age 16, using other drugs before age 18, selling illegal drugs before age 18, engaging in sex before age 16, stealing something worth less than $50 before age 18, stealing something worth more than $50 before age 18, destroying property before age 18; committing other property crime before age 18, being a member of a gang before age 18, getting into a fight before age 18, carrying a gun before age 18, and running away from home before age 18.
[3] Youth who did not obtain a high school degree may have obtained a General Equivalency Diploma.
[4] Results of a trajectory analyses conducted using the National Longitudinal Survey of Youth 1997 identify four pathways for youth connectedness to employment or school between ages 18 and 24: consistently-connected, initially-connected, later-connected, and never-connected. For more information see Kuehn, D., Pergamit, M., and Macomber, J., and Vericker, T. (2009). Multiple Pathways Connecting to School and Work. Washington, D.C.: U.S. Department of Health and Human Services, Office of the Assistant Secretary for Planning and Evaluation.