
Brenda Spillman and Timothy Waidmann
Urban Institute
June 2014
Printer Friendly Version in PDF Format: http://aspe.hhs.gov/pdf-report/rates-and-timing-medicaid-enrollment-among-older-americans (37 PDF pages)
ABSTRACT
Analysis of the 2004 National Long-Term Care Survey reveals that when this cross-sectional nationally representative survey of older Americans was carried out, 14.3% of Medicare beneficiaries aged 65+ were enrolled in Medicaid. This cohort included older Americans both with and without functional disabilities or cognitive impairment, those residing in nursing homes and in the community, and elders who had become eligible for Medicaid both before and after reaching age 65. Within 4 years, an additional 4.7% of the cohort had transitioned to Medicaid, some while continuing to reside in the community, others in connection with nursing home stays other than short-term Medicare covered post-acute episodes. Multivariate analyses found the strongest predictors of post-baseline transition to Medicaid enrollment were continued survivorship and use of nursing home care. The next largest marginal effects of the predicted probability of transitioning to Medicaid were income (having income below $20,000 for transitioning within 1 year and below $30,000 in all years) and homeownership (not owning a home was a statistically significant predictor of transitioning to Medicaid throughout the follow-up years). In sum, older Americans in the lowest income quartile and those who were not homeowners were much more likely to transition to Medicaid during the 4 year follow-up period compared to older Americans who were in the highest income group. Elders in both the highest and lowest income groups were more likely to enroll in Medicaid if they used nursing home care than to do so if they remained in the community. However, those in the lowest income group were also vulnerable to Medicaid enrollment if they remained in the community, whereas the risk of enrollment in Medicaid among those in the highest income group was almost entirely associated with long-stay nursing home use.
DISCLAIMER: The opinions and views expressed in this report are those of the authors. They do not necessarily reflect the views of the Department of Health and Human Services, the contractor or any other funding organization.
TABLE OF CONTENTS
Analysis Samples
Overview of Analytic Measures
Medicaid Transition
Baseline Characteristics
Time-Varying Characteristics
Methods
OVERVIEW OF MEDICAID ELIGIBILITY AND TRANSITION
COMMUNITY POPULATION AT RISK FOR MEDICAID TRANSITION
MULTIVARIATE ANALYSIS: PROBABILITY OF TRANSITION IN 1-4 YEARS
Marginal Effects on the Predicted Probability of Transition
Predicted Transition Over 4 Years
MULTIVARIATE ANALYSIS: EFFECTS OF TIME-VARYING FACTORS ON TRANSITION
Time-Varying Factors
Baseline Characteristics
APPENDIX A: Additional Tables
LIST OF FIGURES
FIGURE 1: Medicaid Transition Over 4 Years by Nursing Home Use Timing
FIGURE 2: Predicted Percent Transitioning to Medicaid by Income
FIGURE 3: Predicted Percent of Nursing Home Non-Users Transitioning to Medicaid by Income
FIGURE 4: Predicted Percent of Nursing Home Users Transitioning to Medicaid by Income
FIGURE 5: Predicted Percent Transitioning to Medicaid by Homeownership and Nursing Home Use
LIST OF TABLES
TABLE 1: Cumulative Medicaid Enrollment Over a 4-Year Follow-Up Period, Medicare Beneficiaries Age 65 or Older
TABLE 2: Cumulative Percent of Community Residents Transitioning to Medicaid Over a 4-Year Follow-Up by Age, Disability, and Health
TABLE 3: Cumulative Percent of Community Residents Transitioning to Medicaid Over a 4-Year Follow-Up Period by Potential Support Environment and Economic Characteristics
TABLE 4: Residence at Transition, Average Time to Transition, and Average Months of Medicaid Over 4 Years, Community Residents Not Enrolled in Medicaid at Baseline
TABLE 5: Probit Estimation of the Probability of Transition to Medicaid Within 1-4 Years, Community Residents Not Enrolled in Medicaid at Baseline
TABLE 6: Survival Analysis of Transition to Medicaid Within 4 Years, Community Residents Not Eligible for Medicaid at Interview
TABLE A1: Weighted Means/Proportions of Individual-Level Variables Used in Models, All Persons and by Medicaid Transition Over 4 Years
TABLE A2: Predicted Transitions by Income, Homeownership, and Nursing Home Use
ACRONYMS
The following acronyms are mentioned in this report and/or appendix.
| ACA | Affordable Care Act |
|---|---|
| ADL | Activity of Daily Living |
| CLASS | Community Living and Services and Supports |
| DME | Durable Medical Equipment |
| ER | Emergency Room |
| FFS | Fee-For-Service |
| HRS | Health and Retirement Study |
| IADL | Instrumental Activity of Daily Living |
| LTSS | Long-Term Services and Supports |
| MAX | Medicaid Analytic eXtract |
| MDS | Minimum Data Set |
| NLTCS | National Long-Term Care Survey |
| SNF | Skilled Nursing Facility |
INTRODUCTION
Aged Medicare beneficiaries represent a small proportion of the Medicaid population but are disproportionately expensive because of their high likelihood of using long-term services and supports (LTSS). States have expanded community-based services, which the older population generally prefers, but nursing home costs still dominate LTSS spending for the aged. Waiver programs covering LTSS most commonly are available only to those who meet functional standards for nursing home care, and typically have limited slots available. Although the Affordable Care Act (ACA) provided new opportunities for states to expand community-based services to additional groups through state plan amendment or new waiver authorities, the extent of such expansions are not yet known.
This study updates and expands knowledge about the prevalence and process of transitions to Medicaid among aged Medicare enrollees, using multiple years of Medicare, Medicaid, and assessment data linked to the 2004 National Long-Term Care Survey (NLTCS), with a focus on the role of nursing home use. This new information is particularly timely because of current policy exploration of ways to expand access to affordable private pre-funding options for long-term care in the wake of the repeal of the Community Living and Services and Supports (CLASS) program. CLASS, enacted as part of the ACA was repealed because of intractable issues relating to long-run viability in the form specified in the legislation.
Because of the high cost of nursing home care and higher income thresholds typically allowed for nursing home residents, many who are not financially eligible for Medicaid services in the community either would become eligible at nursing home admission or would soon exhaust resources and become eligible. Most available evidence is very old, however, so that both the service environment and Medicaid programs have undergone significant changes. Studies from the 1990s estimated that the risk at age 65 of having Medicaid-financed nursing home care in remaining life was nearly one in five, and that more than 60% of those who ended life as nursing home residents either already were receiving Medicaid or became eligible at admission (Spillman & Kemper 1995). Although the rates of conversion to Medicaid were far lower in the community, a larger number of persons became eligible outside of nursing homes (Liu, Doty, & Manton 1990). Growth in use of community-based residential care and increased options for Medicaid services in the community logically may have increased the rate of conversion in the community, and the availability of alternatives to nursing home care for those with greater financial resources may have reduced the overall risk of Medicaid-financed nursing home use.
Recent estimates based on a longitudinal sample of persons age 65 or older from the Health and Retirement Study (HRS) indicate that about 13% of those not already eligible for Medicaid at a baseline in 1996 or 1998 became eligible over a 10-12 year period ending in 2008 (Wiener et al. 2013). The study used a combination of survey-reported Medicaid eligibility and indicators of "buy-in" to Medicaid in Medicare data linked with the survey. Several caveats apply to these data: (1) the "buy-in" indicator identifies persons for whom state Medicaid programs pay premiums, deductibles, or coinsurance, but cannot distinguish those who receive full Medicaid benefits for services and thus may overstate eligibility; (2) survey reports are subject to error because of well-known respondent confusion between Medicare and Medicaid, and only those who showed a Medicaid card at interview were counted as Medicaid eligible; and (3) 15% of Medicare beneficiaries in the HRS refused to allow linkage to their Medicare data. Strengths are the ability to observe respondent-reported changes in physical and cognitive functioning and use of personal care or nursing home use over the analysis period. A potential weakness, however, is that survey reports of the timing of nursing home admission and the length of use may be less reliable than administrative data.
In the present study, we examine the prevalence and process of transition to Medicaid over a 4-year follow-up period. Although we have only baseline observations from survey data on physical and cognitive status and other personal characteristics, we are able to observe the timing of Medicaid transition to full service benefits directly from Medicaid eligibility files and a new dual-eligibility flag included on the Medicare files since 2006, in addition to the buy-in indicators. The linkage to Minimum Data Set (MDS) nursing home assessments allows more confident identification of nursing home use, regardless of payer.
Research questions to be addressed are the following:
-
What proportion of a representative cross-section of Medicare beneficiaries age 65 or older is either eligible for Medicaid at baseline or will transition to Medicaid over a 1-4 year follow-up period.
-
Among community residents not eligible for Medicaid at baseline, what proportion will transition over 1-4 years, and what is the univariate association between transition and demographic characteristics, disability and health, disability, support environment, economic factors, and nursing home use.
-
Which factors remain important when multivariate controls for the correlation among them are applied?
-
What can time variant information on health spending patterns and nursing home use tell us about the process of Medicaid transition and potential policies to affect it?
DATA AND METHODS
Our analysis is based on the 2004 wave of the NLTCS, which was the dominant nationally representative longitudinal survey focused on disability and long-term care in the Medicare population age 65 or older for 2 decades before the final 2004 survey year.
Throughout the survey's history, Medicare beneficiary and claims data were linked to respondents, providing continuous longitudinal information on Medicare service use and spending. Beginning in the 1999 survey year, the Office of Disability, Aging and Long-Term Care Policy supported linkage of Outcome and Assessment Information Set and MDS assessments, the latter with the particular intent of being able to observe nursing home admissions occurring in the intervals between interviews (Spillman & Long 2009). For the 2004 survey year, Medicaid beneficiary and claims data for the years 2004-2007 also were linked, providing for the first time, more confident identification of Medicaid eligibility and the ability to observe transitions to Medicaid occurring after the survey baseline. The estimates provided in this report draw on data from the 2004 NLTCS and from the linked Medicaid and Medicare administrative files as well as the MDS for identification of the timing of nursing home use.
Analysis Samples
The base sample for descriptive estimates of Medicaid enrollment in the older population is 6,171 respondents to the NLTCS detailed interview, including 2,170 persons who reported no current chronic disability, 3,031 non-institutional residents who reported chronic disabilities, and 970 institutionalized persons. The full population is used in an initial profile of Medicaid enrollment at baseline and transitions over the 4-year follow-up period. For descriptive analyses examining the prevalence and process of Medicaid transitions, the analysis sample is limited to all respondents living in non-institutional settings who are not already enrolled in Medicaid at interview (n=4,254). This sample also is the basis of the analysis file for multivariate models of the probability of transition to Medicaid. For hazard models examining how selected time-varying factors, including Medicare service use, are associated with increased risk of transition over time, we select fee-for-service (FFS) enrollees (n=3,241).
Overview of Analytic Measures
Measures constructed for the descriptive and multivariate analyses include both baseline characteristics and time-varying characteristics. Some baseline characteristics (e.g., gender, race, ethnicity, education) can be assumed to persist throughout the analysis period, while others indicate a starting position relative to others, although we cannot observe change over time (e.g., economic situation, disability, health). Yet other baseline personal characteristics, such as living arrangement, potential informal care resources, and residential setting, are especially likely to change over time in response to declines in health and functioning. Medicaid enrollment, nursing home use, Medicare spending and utilization patterns, and vital status are observed over the full 4-year analysis period. Medicaid state program characteristics, long-term care prices, and local health system characteristics, which can be expected to affect the likelihood and timing of Medicaid transition, can be observed over time, but show so little temporal variation that they are treated in these analyses as persistent baseline characteristics.
Medicaid Transition
We constructed Medicaid enrollment and transition to Medicaid among those not enrolled at baseline from three administrative data sources. The primary source was Medicaid eligibility for full benefits obtained from the 2004-2007 Medicaid Analytic eXtract (MAX) Person Summary files. A secondary source was an indicator of full-benefit dual-eligibility for Medicaid and Medicare from Medicare beneficiary files for 2006-2008. The final source was the "buy-in" indicator on Medicare beneficiary files for 2004-2009. The overlaps in availability of each measure allowed examination of the consistency across sources of Medicaid indicators. In general, "false" positives relative to the MAX data were very uncommon in both the buy-in (about 0.5%) and dual indicator variables (about 0.2%). False negatives were more common in both variables, indicating that both may understate enrollment. Based on analysis of the MAX-based measure that indicated persistence of enrollment after transition and the low rate of false positives in the buy-in and duals indicators, we assumed continuing enrollment through death or the end of the 4-year analysis period for all sample members identified as having transitioned in the MAX data through 2007 or identified by the buy-in flag or duals indicator in 2008 or 2009.
Our measure is enrollment. We do not estimate eligibility and cannot directly distinguish how transition occurred. Some persons may meet financial standards for eligibility choose not to enroll, for example, if they wish to and are able to remain in the community, but community-based Medicaid services are not available. Some persons may meet their state's asset standards but have income above eligibility thresholds, so that they would have to "spend down" income on health care or nursing home use to become eligible. Others may have to "spend down" assets above their state's standards.
Baseline Characteristics
Disability and Cognitive Status. The NLTCS measures disability as using assistive devices or receiving help in the last week with at least one activity of daily living (ADL) or being unable to perform at least one instrumental activity of daily living (IADL) without assistance because of health or disability. The included ADLs are eating, getting in or out of bed, getting around inside, dressing, bathing, and toileting. Although inability to perform IADLs is a more stringent measure than is used in many surveys, limitation in these activities is important for the ability to live independently but indicative of less severe disability than ADL limitation. The included IADLs are getting around outside, doing housework, doing laundry, preparing meals, shopping, taking medications, managing money, and using the telephone. For this analysis, we constructed a hierarchical measure that distinguishes between those managing all disabilities without help, those receiving help with IADLs only, and those receiving help with 1-2 ADLs and 3+ ADLs. The group managing without help primarily consists of a growing segment of the older population that reports managing with assistive devices but no help, but also includes a far smaller group who report inability to perform IADLs but identify no one who usually helps them. For cognition, we constructed an indicator of mild to severe cognitive impairment using survey reports of cognitive conditions and results of the Short Portable Mental Status Questionnaire conventionally coded (Pfeiffer 1975).
Health Characteristics. Health status is an important factor both because poor health and chronic conditions may result in functional decline and need for long-term care, but also because out-of-pocket spending associated with high service utilization may contribute to eroding of financial resources over time. To characterize initial health status, we used self-reported health and selected chronic conditions and events reported by survey respondents. These are high blood pressure, diabetes, heart disease, lung disease (bronchitis, asthma, emphysema) in the last year, a nervous disorder (cerebral palsy, epilepsy, multiple sclerosis, paralysis, Parkinson's disease), and a stroke in the last year.
Informal Care Resources and Support Environment. Informal care, most often provided by close family members, is the most common type of long-term care and may reduce the need for paid care. Because the analysis examines those without and with disabilities at baseline, we characterized potential care resources using two measures that can be constructed for all sample members. The first is whether the respondent lives alone, with a spouse (with or without others), or with only persons other than a spouse. The second measure of potential informal resources is whether the respondent has any daughters who are coresident or live nearby, specifically within an hour's travel. Spouses and children have long been the dominant source of informal care to the older population (Spillman & Black 2005). We further differentiated whether the respondent lived in a traditional community residence, in some other type of retirement or group setting that did not meet criteria for residential care, or in community-based residential care, which includes a range of settings from assisted living to board and care homes, generally indicating the need for daily assistance with household tasks or personal care. About 2.5% of NLTCS respondents live in residential care settings classified as being in the community by NLTCS definitions.
Economic Status. The NLTCS collects information on income in the prior year in categories for individuals and for couples, as well as home ownership and home value. We categorized income as less than $10,000, $10,000 to less than $20,000, $20,000 to less than $30,000, and $30,000 or more. The lowest two categories roughly approximate the poor and near poor (defined as at or below twice the federal poverty threshold for individuals and couples age 65 or older, $9,060 and $11,430, respectively). The survey does not collect information on non-housing assets. Home ownership was missing for less than 3% of the weighted sample (128 unweighted observations), and home value was missing for about 10% of the weighted sample (391 unweighted observations). We imputed values first for home ownership and then for home value, using a hot deck imputation procedure. We categorized home value as less than $75,000, $75,000 to less than $150,000, and $150,000 or more.
Medicaid Program and Health System Characteristics. We constructed state-level Medicaid program characteristics and prices of assisted living, home care, and nursing facility care and county-level health and long-term care system supply variables for all years from 2004-2009 available from various external sources, linked to the survey data by state and county identifiers. From these measures, we constructed indicators of whether values for each state or county were above the median for all states or counties where applicable (prices, supply, and percent of Medicaid program spending in the community). Other state program characteristics relevant to transition included as indicator variables in our analyses are whether the state has special income rules that allow higher income thresholds for nursing home entrants, was a 209B state (with more stringent financial eligibility than federal guidelines), or had a medically needy program. States with medically needy programs allow beneficiaries to become eligible if health care expenses reduce available income below the state threshold, and 209B states also must allow "spend down" to their lower eligibility thresholds. For spousal impoverishment we created indicators of whether the state set protected income thresholds at the maximum allowable and had a protected resource standard at or above the 75th percentile across states and whether community-based waiver participants had spousal impoverishment protections. As noted, we generally found little variation over time in the relative positions of states and counties on these measures and treated them as persistent baseline characteristics.
Time-Varying Characteristics
Medicare Spending and Utilization Patterns. We used Medicare claims files from 2003-2009 to construct monthly spending and utilization. To characterize high spending levels that could indicate additional out-of-pocket health costs contributing to Medicaid transition, we constructed total spending in the 6 months prior to each monthly observation, including the current month. We also constructed flags indicating the use in each month of inpatient, outpatient, home health, skilled nursing facility (SNF), and hospice care.
Nursing Home Use. We used MDS data for the years 2004-2009 to construct a longitudinal monthly file indicating any use, short stay use, and long stay use. A long stay was defined as any episode of 2 months or more without a period of 30 days or more of community residence. Short and long stays are mutually exclusive. For the hazard model, we included separate indicators for short and long stays, since a stay may be "short" because it is a permanent placement that ends quickly in death. For both short and long stays, we excluded months in which the SNF flag was set to differentiate use not covered by Medicare. For descriptive estimates and models predicting the probability of transition to Medicaid over periods of 1-4 years, we constructed indicators of whether use occurred within each time period. We also constructed indicators of whether transition occurred before, at, or after nursing home entry, total months to transition, and months to transition after nursing home entry.
Survival. To control for exposure to the risk of Medicaid transition, we constructed indicators for each month for use in hazard models. For descriptive estimates and models predicting the probability of transition, we constructed indicators of the probability of surviving through each of the 1-year to 4-year analysis periods and variables indicating the proportion of each analysis period survived.
Methods
Descriptive estimates addressing the first two research questions regarding the population enrolled in Medicaid or transitioning over 1-4 years and characteristics associated with transition were produced using SAS (Version 9.2) procedures (Proc Surveyfreq and Proc Surveymean) that produce standard errors corrected for complex survey design. Detailed sample weights adjust for survey design and non-response and are post-stratified by age and sex to the Medicare population in 2004 (Spillman 2011).
To examine factors predicting Medicaid transition over 1-4 years, we used a multivariate model and a probit specification to estimate the probability of transitioning, controlling for personal baseline characteristics, state Medicaid program characteristics, state-level long-term care prices, and county-level supply of long-term care and health care. To address the final research question, we used survival model techniques to examine how time-varying factors, including spending and use of acute and post-acute care and nursing homes are associated with the timing of transitions to Medicaid, controlling for baseline characteristics. Coefficient estimates indicate the relative risk (ratio of instantaneous hazard) that a person will transition to Medicaid at time t given baseline characteristics, total Medicare spending, acute and post-acute service utilization, and nursing home utilization at time t. For the multivariate models, we used Stata (Version 10.1) Probit and streg (survival time regression) commands, respectively, and Stata's survey (svy) commands to produce standard errors adjusted for survey design.
OVERVIEW OF MEDICAID ELIGIBILITY AND TRANSITION
About 14% of Medicare beneficiaries age 65 or older in 2004 were eligible for Medicaid, and another nearly 5% had enrolled within 4 years of interview (Table 1). Women and those age 85+ were more likely and men and those younger than 85 were less likely than the average to be enrolled at baseline and to transition. Not surprisingly, given the association of long-term care utilization and spending with Medicaid eligibility, all groups receiving IADL or ADL assistance, and those with cognitive impairment had far higher than average rates of transition. Most notably, nearly two in three institutional residents at baseline were enrolled in Medicaid, and 70% of this group was enrolled after 4 years, consistent with generally more favorable eligibility rules for those in nursing homes and with the high cost of private nursing home care.
| TABLE 1. Cumulative Medicaid Enrollment Over a 4-Year Follow-Up Period, Medicare Beneficiaries Age 65 or Older | |||||||||
|---|---|---|---|---|---|---|---|---|---|
| Number of Persons (000s) | Percent of Population | Medicaid Status | |||||||
| Enrolled at Baseline | Transition After Baseline | Total Enrolled at Baseline or Transitioning | Not Enrolled at Baseline, No Transition | ||||||
| Within 1 Year | Within 2 Years | Within 3 Years | Within 4 Years | ||||||
| All Medicare aged | 35,135 | 100.0 | 14.3 | 1.5 | 2.7 | 4.0 | 4.7 | 19.0 | 81.0 |
| Gender | |||||||||
| Men | 14,717 | 41.9 | 10.1 | 1.0 | 2.2 | 3.3 | 3.8 | 13.9 | 86.1 |
| Women | 20,418 | 58.1 | 17.3 | 1.8 | 3.1 | 4.5 | 5.3 | 22.6 | 77.4 |
| Age | |||||||||
| 65-74 | 17,941 | 51.1 | 12.4 | 1.1 | 1.7 | 2.4 | 3.0 | 15.4 | 84.6 |
| 75-84 | 12,614 | 35.9 | 14.1 | 1.4 | 3.0 | 4.5 | 5.1 | 19.2 | 80.8 |
| 85+ | 4,580 | 13.0 | 20.1 | 2.6 | 5.7 | 8.9 | 9.9 | 30.0 | 70.0 |
| Disability | |||||||||
| None | 27,771 | 79.0 | 9.7 | 1.0 | 1.9 | 3.0 | 3.5 | 13.2 | 86.8 |
| Receiving no helpa | 1,549 | 4.4 | 13.3 | 2.0 | 3.9 | 5.9 | 7.3 | 20.7 | 79.3 |
| Help with IADLs only | 1,568 | 4.5 | 21.2 | 2.6 | 5.9 | 8.1 | 9.9 | 31.1 | 68.9 |
| Help with 1-2 ADLs | 1,205 | 3.4 | 27.4 | 4.3 | 7.7 | 9.5 | 11.1 | 38.5 | 61.5 |
| Help with 3+ ADLs | 1,557 | 4.4 | 32.6 | 4.4 | 7.1 | 10.2 | 11.5 | 44.1 | 55.9 |
| Institutional residentb | 1,485 | 4.2 | 63.4 | 2.9 | 5.0 | 6.2 | 7.1 | 70.5 | 29.5 |
| Cognitive Status | |||||||||
| Not impaired | 30,114 | 85.7 | 11.9 | 1.2 | 2.2 | 3.3 | 4.0 | 15.9 | 84.1 |
| Impaired | 5,021 | 14.3 | 37.6 | 4.0 | 8.0 | 10.9 | 11.8 | 49.4 | 50.6 |
NOTES: Medicare enrollees age 65 or older responding to detailed interview, NLTCS 2004 (n=6,171).
| |||||||||
COMMUNITY POPULATION AT RISK FOR MEDICAID TRANSITION
Among the population living outside of institutional settings and not enrolled in Medicaid at baseline, a little more than 5% had transitioned by the end of 4 years. Patterns are similar to those for the full population age 65 or older, with women, the oldest old, and those with higher levels of disability more likely than others to transition to Medicaid. As for the full population, those with cognitive impairment at baseline had the highest rate of transition--nearly one in five.
| TABLE 2. Cumulative Percent of Community Residents Transitioning to Medicaid Over a 4-Year Follow-Up by Age, Disability, and Health | |||||||
|---|---|---|---|---|---|---|---|
| Number of Persons (000s) | Percent of Persons | Transition After Baseline | No Transition | ||||
| Within 1 Year | Within 2 Years | Within 3 Years | Within 4 Years | ||||
| Community, not enrolled at baseline | 29,500 | 100.0 | 1.6 | 30. | 4.5 | 5.2 | 94.8 |
| Gender | |||||||
| Men | 13,028 | 44.2 | 1.1 | 2.4 | 3.6 | 4.1 | 95.9 |
| Women | 16,471 | 55.8 | 2.0 | 3.5 | 5.2 | 6.1 | 93.9 |
| Age | |||||||
| 65-74 | 15,651 | 53.1 | 1.3 | 1.9 | 2.8 | 3.4 | 96.6 |
| 75-84 | 10,616 | 36.0 | 1.5 | 3.3 | 5.0 | 5.7 | 94.3 |
| 85+ | 3,233 | 11.0 | 3.5 | 7.0 | 10.9 | 12.1 | 87.9 |
| Disability | |||||||
| None | 25,035 | 84.9 | 1.1 | 2.1 | 3.3 | 3.8 | 96.2 |
| Receiving no helpa | 1,339 | 4.5 | 2.3 | 4.5 | 6.8 | 8.5 | 91.5 |
| Help with IADLs only | 1,230 | 4.2 | 3.2 | 7.5 | 10.2 | 12.6 | 87.4 |
| Help with 1-2 ADLs | 871 | 3.0 | 5.9 | 10.6 | 13.1 | 15.4 | 84.6 |
| Help with 3+ ADLs | 1,024 | 3.5 | 6.7 | 10.6 | 15.3 | 17.3 | 82.7 |
| Cognitive Status | |||||||
| Not impaired | 27,935 | 94.7 | 1.3 | 2.4 | 3.7 | 4.4 | 95.6 |
| Impaired | 1,565 | 5.3 | 6.0 | 13.1 | 18.3 | 19.3 | 80.7 |
| Self-Reported Health Statusb | |||||||
| Excellent/good | 23,063 | 78.8 | 1.0 | 2.1 | 3.4 | 4.0 | 96.0 |
| Fair/poor | 6,217 | 21.2 | 3.5 | 6.0 | 8.2 | 9.4 | 90.6 |
| Selected Health Conditions | |||||||
| None | 11,032 | 37.4 | 0.9 | 1.7 | 2.9 | 3.6 | 96.4 |
| High blood pressure | 13,540 | 46.0 | 2.0 | 3.9 | 5.8 | 6.4 | 93.6 |
| Diabetes | 5,121 | 17.4 | 1.2 | 4.2 | 5.0 | 6.5 | 93.5 |
| Heart disease | 4,536 | 15.4 | 3.1 | 4.4 | 6.0 | 7.2 | 92.8 |
| Lung disease in the last year | 4,164 | 14.1 | 3.6 | 5.5 | 7.1 | 7.7 | 92.3 |
| Paralysis/nervous system disorder | 996 | 3.4 | 4.7 | 7.4 | 10.8 | 11.8 | 88.2 |
| Stroke in the last year | 801 | 2.7 | 4.9 | 7.5 | 8.3 | 8.7 | 91.3 |
NOTES: Medicare enrollees age 65 or older living in community settings and not Medicaid enrolled at baseline, NLTCS 2004 (n=4,254).
| |||||||
Health Status. Those who reported fair or poor health were more than twice as likely to have met eligibility requirements and enrolled in Medicaid than those with excellent or good health over each time period. Those with selected health conditions also were more likely than to have transitioned to Medicaid in each time period than those with none of the selected conditions, although differences were relatively small for those with high blood pressure or diabetes. The rate was highest in each period for those with paralysis or nervous system disorders, followed by those who had experienced a stroke within a year of interview.
| TABLE 3. Cumulative Percent of Community Residents Transitioning to Medicaid Over a 4-Year Follow-Up Period by Potential Support Environment and Economic Characteristics | |||||||
|---|---|---|---|---|---|---|---|
| Number of Persons (000s) | Percent of Persons | Transition After Baseline | No Transition | ||||
| Within 1 Year | Within 2 Years | Within 3 Years | Within 4 Years | ||||
| Support Environment | |||||||
| Potential Informal Support | |||||||
| Lives alone | 9,300 | 31.5 | 2.2 | 4.1 | 6.0 | 7.1 | 92.9 |
| Lives with spouse | 17,399 | 59.0 | 0.9 | 2.1 | 3.0 | 3.4 | 96.6 |
| Lives with others, not spouse | 2,800 | 9.5 | 3.5 | 5.3 | 8.6 | 10.2 | 89.8 |
| Daughter Resident or Within 1 Hour | |||||||
| No | 15,733 | 53.3 | 1.3 | 2.7 | 4.2 | 5.0 | 95.0 |
| Yes | 13,767 | 46.7 | 1.9 | 3.4 | 4.8 | 5.5 | 94.5 |
| Residential Setting | |||||||
| Traditional private residence | 26,320 | 89.2 | 1.3 | 2.5 | 3.7 | 4.4 | 95.6 |
| Retirement community/ housing | 2,575 | 8.7 | 3.3 | 5.4 | 8.6 | 9.7 | 90.3 |
| Community residential care | 605 | 2.1 | 5.8 | 16.7 | 19.2 | 20.9 | 79.1 |
| Economic Characteristics | |||||||
| Annual Income | |||||||
| Less than $10,000 | 2,551 | 8.6 | 3.8 | 7.9 | 10.6 | 11.7 | 88.3 |
| $10,000 - $20,000 | 7,919 | 26.8 | 3.0 | 5.6 | 8.6 | 10.3 | 89.7 |
| $20,000 - $30,000 | 7,086 | 24.0 | 1.6 | 2.4 | 3.7 | 4.0 | 96.0 |
| $30,000 or more | 11,944 | 40.5 | 0.2 | 0.6 | 0.9 | 1.2 | 98.8 |
| Homeownera | |||||||
| No | 7,228 | 24.5 | 3.7 | 6.5 | 9.7 | 10.7 | 89.3 |
| Yes | 22,271 | 75.5 | 0.9 | 1.9 | 2.8 | 3.4 | 96.6 |
| Home Value | |||||||
| Under $75K | 7,137 | 15.5 | 2.2 | 5.4 | 6.9 | 8.2 | 91.8 |
| $75 - $150K | 10,503 | 27.2 | 0.8 | 1.4 | 2.5 | 3.1 | 96.9 |
| $150K or more | 4,631 | 32.8 | 0.3 | 0.5 | 1.1 | 1.5 | 98.5 |
| Education | |||||||
| Less than high school | 7,224 | 24.5 | 3.0 | 5.1 | 8.0 | 9.3 | 90.7 |
| High school | 9,633 | 32.7 | 1.7 | 3.1 | 4.4 | 5.1 | 94.9 |
| Some college | 12,643 | 42.9 | 0.7 | 1.7 | 2.5 | 3.0 | 97.0 |
NOTES: Medicare enrollees age 65 or older living in community settings and not Medicaid enrolled at baseline, NLTCS 2004. (n=4,254).
| |||||||
Support Environment. The nearly six in ten persons who were living with a spouse at baseline had the lowest rate of transition over the 4-year analysis period, while the rates for those who were living alone or with persons other than a spouse were more than twice and more than three times as likely to transition, respectively (Table 3). Having at least one daughter either coresident or nearby had little effect, although among those receiving disability assistance, daughters are second only to spouses in their importance as informal care providers. Those living in residential care settings at baseline are more than five times as likely to transition over 4 years as those in traditional private residences and more than twice as likely as those in retirement housing or communities. This presumably reflects that they already are experiencing functional decline but also may reflect economic factors.
Economic Characteristics. Low income and housing assets are clearly associated with higher rates of transition in each time period, as would be expected. More than one in ten of those in the two lower income categories, approximating poor and near poor individuals and couples, were enrolled in Medicaid by the end of the 4-year period, compared with 4% of those with incomes between $20,000 and $30,000, and only 1.2% of those with baseline incomes of $30,000 or more. Those who were not homeowners had the highest rate of transition in time periods, followed by those with homes valued at less than $75,000. Nearly 11% of non-homeowners and about 8% of those with low home value had enrolled in Medicaid by the end of the 4-year analysis period, compared with only 1.5% of those with home values of $150,000 or more. Education level, which is correlated with economic status but also has been found to be strongly associated with health, functioning, and cognitive health, also is important. Those with less than a high school education were a little more than three times as likely to have enrolled in Medicaid by the end of the 4-year period as those with some college education.
| FIGURE 1. Medicaid Transition Over 4 Years by Nursing Home Use Timing |
|---|
 |
Nursing Home Use. Nursing home use and transition to Medicaid are strongly related, as illustrated by Figure 1. Only about 3% of those with no nursing home use transitioned to Medicaid over the 4-year analysis period. In contrast, one in five persons admitted to a nursing home within 1 year and about 17% of all admitted within 4 years transitioned to Medicaid at some point over 4 years. The contrast is even greater for admissions to long stay use. Again, only about 3% of those with no lengthy use but nearly half of those admitted to a long stay within 1 year and 40% of those ever admitted over 4 years were enrolled in Medicaid by the end of the analysis period. Among persons ever using nursing homes who transitioned to Medicaid, 60% did so only after nursing home entry (not shown). For those with long stays who transitioned, the proportion transitioning after entry was about two in three, compared with only a third of those who had only short stay nursing home use.
Table 4 shows the distribution by place of transition for all persons transitioning over the 4-year analysis period, the average number of months to transition, and, for those transitioning after admission, the number of months until transition following admission. Overall, about 56% of those who transitioned to Medicaid did so in the community, 10% at nursing home admission, and a little more than a third after admission. The average time to transition was 21 months overall and differed little across groups--19 months for those who enrolled at admission and 23 months for those who transitioned after admission. The average number of months of Medicaid coverage over the analysis period was 21 overall, 24 for those transitioning in the community, and 18 and 16 for those who enrolled at or after nursing home admission, respectively.
| TABLE 4. Residence at Transition, Average Time to Transition, and Average Months of Medicaid Over 4 Years, Community Residents Not Enrolled in Medicaid at Baseline | ||||
|---|---|---|---|---|
| Percent of Transitions | Time to Transition (months) | Time to Transition After Nursing Home Admission (months) | Total Months of Medicaid After Transition | |
| All | 100.0 | 21 | --- | 21 |
| Community | 55.7 | 20 | --- | 24 |
| Nursing home | ||||
| At admission | 10.0 | 19 | --- | 18 |
| After admission | 34.3 | 23 | 9 | 16 |
MULTIVARIATE ANALYSIS: PROBABILITY OF TRANSITION IN 1-4 YEARS
Table 5 provides the marginal effect estimates derived from probit models of transitions to Medicaid in 1-4 years, controlling for the percent of each analysis period survived, baseline personal characteristics described above, use of nursing home care, state Medicaid program characteristics, and long-term care prices and local health and long-term care supply characteristics. Although baseline characteristics subject to unobserved change over time logically would be expected to have greater predictive power in the first year, marginal effects on the predicted probability of transition in the first year, are smaller and less likely to be statistically significant than the cumulative results over longer time periods. (Means or proportions of all variables in the model are provided in Appendix Table A1.)
| TABLE 5. Probit Estimation of the Probability of Transition to Medicaid Within 1-4 Years, Community Residents Not Enrolled in Medicaid at Baseline | ||||||||
|---|---|---|---|---|---|---|---|---|
| Marginal Effect on the Probability of Medicaid Transition | ||||||||
| Within 1 Year | Within 2 Years | Within 3 Years | Within 4 Years | |||||
| Exposure and Nursing Home Use | ||||||||
| Percent of analysis period survived | 0.00205 | 0.01091 | * | 0.02383 | ** | 0.02419 | ** | |
| Nursing home entry during analysis period | 0.03899 | ** | 0.05182 | ** | 0.07841 | ** | 0.08095 | ** |
| Economic Factors | ||||||||
| Income $10,000 | 0.01044 | ** | 0.03530 | ** | 0.05103 | ** | 0.06382 | ** |
| Income $10,000 - $20,000 | 0.00961 | ** | 0.02315 | ** | 0.04170 | ** | 0.05487 | ** |
| Income $20,000 - $30,000 | 0.00616 | ** | 0.00803 | 0.01404 | 0.01638 | |||
| Not a homeowner | 0.00441 | ** | 0.01762 | ** | 0.02173 | ** | 0.02067 | ** |
| Home value less than $75,000 | 0.00181 | 0.01767 | * | 0.02073 | ** | 0.02372 | ** | |
| Home value $75,000 - $150,000 | 0.00067 | 0.00346 | 0.00557 | 0.00770 | ||||
| Cumulative Medicare spending last 6 months | 0.00003 | 0.00003 | -0.00010 | -0.00021 | ||||
| Physical and Cognitive Functioning | ||||||||
| Disability but receiving no helpa | 0.00054 | 0.00192 | -0.00064 | 0.00108 | ||||
| Help with IADLs only | 0.00049 | 0.00446 | 0.00426 | 0.00807 | ||||
| Help with 1-2 ADLs | 0.00390 | 0.00645 | 0.00536 | 0.01230 | ||||
| Help with 3+ ADLs | 0.00280 | 0.00465 | 0.01105 | 0.02035 | * | |||
| Cognitively impaired | 0.00129 | 0.01643 | * | 0.02577 | ** | 0.02699 | ** | |
| Health | ||||||||
| Self-reported health fair or poor | 0.00157 | 0.00353 | 0.00621 | 0.00675 | ||||
| High blood pressure | 0.00080 | 0.00426 | 0.00719 | * | 0.00473 | |||
| Diabetes | -0.00146 | ** | -0.00069 | -0.00565 | * | -0.00369 | ||
| Heart disease | 0.00174 | 0.00157 | 0.00118 | 0.00352 | ||||
| Lung disease in the last year | 0.00264 | * | 0.00884 | * | 0.00814 | 0.00878 | ||
| Paralysis/nervous system disorder | 0.00121 | 0.00278 | 0.00460 | 0.00559 | ||||
| Stroke in the last year | 0.00012 | -0.00066 | -0.00376 | -0.00642 | ||||
| Medicaid Program Characteristics (state-level) | ||||||||
| Spousal protection income max AND resource >75th percentile | 0.00113 | 0.00433 | 0.00886 | * | 0.01097 | * | ||
| Spousal resources + income protected for waiver participants | 0.00096 | 0.00346 | 0.00850 | * | 0.00770 | |||
| Special income rule for nursing home residents | 0.00060 | 0.00443 | * | 0.00377 | 0.00360 | |||
| Medically needy program | 0.00178 | ** | 0.00559 | ** | 0.00912 | ** | 0.01193 | ** |
| 209b state | 0.00041 | -0.00022 | 0.00389 | 0.00413 | ||||
| Percent of Medicaid LTSS spending in community >median | 0.00022 | 0.00218 | 0.01051 | ** | 0.01320 | ** | ||
| Long-Term Care Prices (state-level) | ||||||||
| Private monthly cost for assisted living >median | 0.00155 | 0.00374 | 0.00169 | 0.00335 | ||||
| Mean home care aide hourly wage >median | 0.00128 | 0.00350 | 0.00458 | 0.00733 | ||||
| Private pay nursing home per diem >median | 0.00399 | * | -0.00824 | ** | -0.01008 | ** | -0.01268 | ** |
| Long-Term Care and General Health Provider Supply (county-level) | ||||||||
| Home health agencies/1,000 persons 65+ >median | 0.00026 | 0.00065 | 0.00207 | 0.00435 | ||||
| Nursing facility beds/1,000 persons 65+ >median | 0.00047 | -0.00107 | -0.00452 | -0.00596 | ||||
| SNF beds/1,000 persons 65+ >median | 0.00067 | 0.00120 | 0.00416 | 0.00560 | ||||
| Hospital beds/1,000 persons >median | 0.00113 | * | 0.00161 | 0.00510 | 0.00331 | |||
| Physicians/1,000 persons >median | 0.00089 | -0.00286 | -0.00523 | -0.00610 | ||||
| Demographics | ||||||||
| Age 75-84 | 0.00123 | -0.00069 | 0.00073 | -0.00220 | ||||
| Age 85+ | -0.00070 | 0.00169 | 0.00488 | 0.00380 | ||||
| Female | 0.00073 | 0.00110 | 0.00123 | 0.00259 | ||||
| Black, non-Hispanic | 0.01223 | 0.04928 | ** | 0.04938 | ** | 0.06209 | ** | |
| Hispanic | 0.00151 | 0.00127 | 0.00706 | 0.00160 | ||||
| Less than high school education | 0.00165 | 0.00146 | 0.00879 | 0.01212 | * | |||
| High school education | 0.00118 | 0.00144 | 0.00409 | 0.00450 | ||||
| Support Environment | ||||||||
| Lives alone | 0.00026 | -0.00491 | ** | -0.00808 | ** | -0.00852 | ||
| Lives with others, not spouse | 0.00024 | -0.00434 | ** | -0.00220 | -0.00074 | |||
| Any non-resident daughter within 1 hour | 0.00005 | 0.00048 | 0.00076 | 0.00099 | ||||
| Retirement community/housing | 0.00249 | 0.00690 | 0.02075 | ** | 0.02803 | ** | ||
| Community residential/care | 0.00115 | 0.01632 | 0.02043 | 0.03263 | ||||
| SOURCE: Analysis of the 2004 NLTCS linked with administrative data and state and county-level Medicaid program, price, and supply characteristics (n=4,226, excluding 28 cases with data missing on 1 or more explanatory variables). NOTES: Omitted categories are non-Hispanic White/other; lives with spouse; traditional community residence; income $30,000 or more; housing value $150,000 or more; some college education; no disability; self-reported health excellent or good; and none of the selected health conditions or events.
**(*) Significantly different from 0 at the 5%(10%) confidence level. | ||||||||
Marginal Effects on the Predicted Probability of Transition
Exposure and Nursing Home Use. The percent of the analysis period survived is, as would be expected, positively associated with the probability of transition, since it measures the duration of exposure to the possibility of transition. Consistent with the descriptive finding for nursing home use, the cumulative effect of having entered a nursing home during the current or a prior analysis period is positive, statistically significant, and increases with time, and its marginal effect on the predicted probability is the largest across all characteristics in the model in each period.
Economic Factors. The next largest marginal effects are for being in the two income categories below $20,000. Income of $20,000 but less than $30,000 had a significant marginal effect only within a year, while being in either of the two lowest income categories had a uniform positive association that increased in magnitude across time. Not being a homeowner shows a similar pattern of a relatively large and positive association with transition throughout. Having a home value below $75,000 is significantly associated only in years 2-4, when marginal effects are significant and of similar magnitude to those for not owning a home. In a sensitivity analysis excluding nursing home use from the model (note shown), all significant effects of economic factors seen in Table 5 were larger and stronger, and the marginal effect of having income of $20,000 to less than $30,000 (relative to having income of $30,000 or more) increased in magnitude and became significant in all periods. This suggests the vulnerability of this group to transition in the event of nursing home entry.
Functioning and Health. There are perhaps surprisingly few significant marginal effects among the baseline functional and health characteristics included in the model. One explanation may be that these characteristics are highly correlated with economic status. The exception is cognitive impairment, which has a positive and significant marginal effect on the predicted probability in years 2-4.
Medicaid Program Characteristics. Few significant effects are seen among the included program characteristics, which varied little and can be considered persistent across the 4 years covered by this study. Only living in a state with a medically needy program was significant, positive, and increasing with time throughout. Living in a state with relatively generous spousal protection standards or a state with a greater than median share of LTSS spending devoted to community-based services were significant only after 3 years and 4 years.
Long-Term Care Prices and Supply. The only significant marginal effects among long-term care price variables were a perhaps counter-intuitive negative association of private pay nursing home per diems above the median with Medicaid transition after the first year. It is possible that this reflects substitution of other types of care, including informal care in places where nursing home costs are higher, but while marginal effects of both above median assisted living costs and home care aide wages were positive, neither was significantly associated with a greater probability of transition in any period.
Demographics and Support Environment. Among demographic characteristics, the marginal effect of being Black non-Hispanic was significant, positive and increasing over 2-4 years, and having less than a high school education was significant only after 4 years. Age category had no significant association with transition. Although descriptive estimates showed that those living alone were twice as likely as the excluded category of persons living with a spouse to transition to Medicaid, after controlling for other characteristics, living alone was significantly associated with a lower predicted probability of transition over 2-4 years. In the sensitivity analysis excluding nursing home use from the model, the marginal effects for this group remained negative, but were smaller and significant only over 2 years. We interpret this as evidence of the mixed character and potential vulnerability of this group. Those able to live alone at baseline include those who are able to function independently but who also are likely to change residential situation if health and functioning declines (e.g., to move in with others, move to a more supportive setting, or enter a nursing home.) The marginal effect of living in a retirement community or retirement housing was positive throughout but significant only over 3-4 years. The marginal effect of living in community residential care showed a similar pattern, but was significant only over 4 years.
Predicted Transition Over 4 Years
To further investigate the importance of economic characteristics and nursing home use in transitions to Medicaid we predicted the mean probability of Medicaid transition for subgroups defined by income, homeownership, and nursing home use. All other characteristics in the model take the values in the data for each subgroup. Results are shown in Figures 2-5. (Data for Figures 2-5 and additional predictions are provided in Appendix Table A2.)
| FIGURE 2. Predicted Percent Transitioning to Medicaid by Income |
|---|
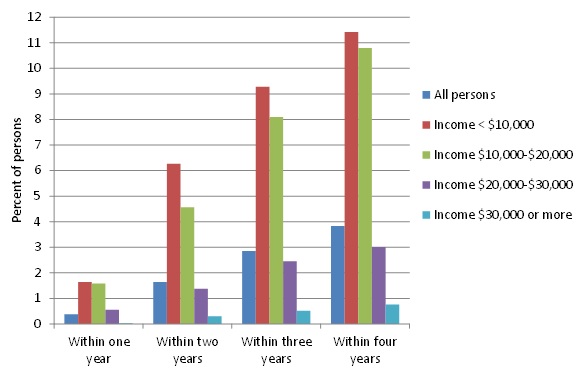 |
Income. The highest rate of transition by far for all time periods was for those with incomes in the lowest two categories, corresponding roughly to the poor and near poor, although the rate was higher as the time period increased for all income levels (Figure 2). Among those with baseline income below $10,000, fewer than 2% transitioned within 1 year, but more than 6% had transitioned within 2 years, and just over 11% had transitioned by the end of 4 years. The pattern was similar, for those with income between $10,000 and $20,000 at baseline, although the percent transitioning was marginally lower after the first year. In contrast, only about 0.5% of those with income of $20,000-$30,000 at baseline had transitioned within a year, and 3% over the full 4 years, while for the highest income group, the proportion who transitioned within 1 year was negligible, and less than 1% had transitioned by the end of the 4-year analysis period.
| FIGURE 3. Predicted Percent of Nursing Home Non-Users Transitioning to Medicaid by Income |
|---|
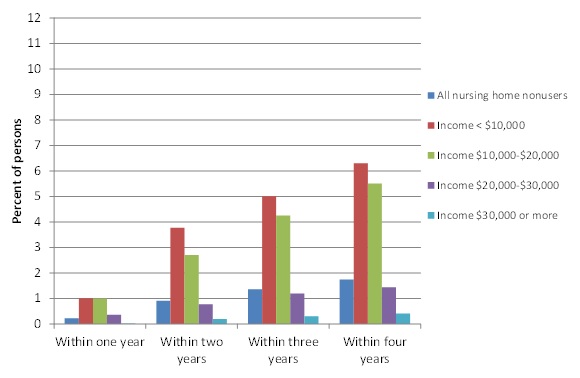 |
Income and Nursing Home Use. Figure 3 and Figure 4 show the dramatic impact of nursing home use on transitions to Medicaid. Figure 3, showing transition rates for those with no nursing home use over 4 years, is on the same scale as Figure 2 to highlight that transitions in every period are about half the overall rate for each income group. In contrast, for nursing home users (Figure 4), the transition rate within 1 year is nearly one in five for the two lowest income categories, rising to more than 30% after 4 years. Whereas less than a half percent of those with intermediate incomes between $20,000 and $30,000 who had no nursing home use transitioned within a year, the rate for those who used a nursing home within a year, was one in ten. However, after 4 years, the cumulate transition rate for nursing home users in this income group had increased only to 12.6%. Among those with incomes of $30,000 or more, less than 3% of those with nursing home use within a year transitioned to Medicaid within a year, and the cumulative transition rate for nursing home users in this income group was only a little more than 6%.
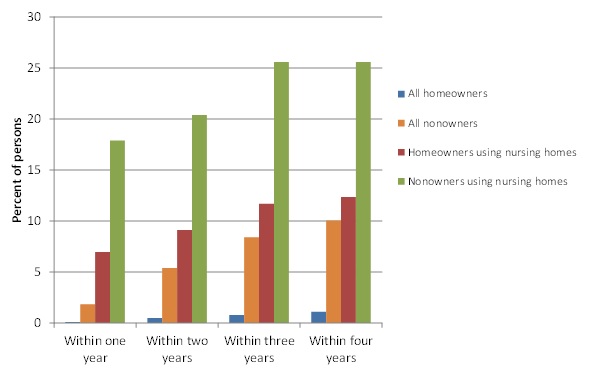
Home Ownership. Figure 5 shows predictions by home ownership at baseline and nursing home use. The contrasts are nearly as stark between non-homeowners and owners as between the lowest and highest income groups, although moderated somewhat by variation in income within non-owners and owners. Less than 1% of homeowners transitioned over 4 years versus one in ten non-owners. The large difference between non-owners and owners is perhaps surprising, since the home is in many cases protected for an extended period, particularly for married couples. It is also the case that home ownership and value are correlated with other asset accumulations that we cannot measure in the NLTCS. When nursing home use is taken into account, differences are amplified. About 7% of homeowners using nursing homes within a year transitioned to Medicaid within a year, compared with about 18% of non-owners. In each time period, the rate of transition among non-owners was more than double that for owners, and by the end of 4 years, a quarter of non-owners were enrolled, compared with about 12% of owners.
| FIGURE 4. Predicted Percent of Nursing Home Users Transition to Medicaid by Income |
|---|
 |
When both income and homeownership are taken into account, patterns are similar. Non-owners are more likely than owners to transition, and both non-owners and owners at all income levels are multiple times more likely to transition if they have nursing home use (not shown, see Appendix Table A1.) For example, among those in the two lowest income categories, about 9% of non-owners who do not use nursing homes transition over 4 years, compared with half that proportion of homeowners. Among those in these income categories who do use nursing homes, the proportions are about one in three for non-owners, compared with about one in four for homeowners. For those in the highest income group, less than 1% of non-owners and owners who do not use nursing homes transition within 4 years, compared with 12% of non-owners and 4% of homeowners who use nursing homes.
| FIGURE 5. Predicted Percent Transitioning to Medicaid by Homeownership and Nursing Home Use |
|---|
 |
MULTIVARIATE ANALYSIS: EFFECTS OF TIME-VARYING FACTORS ON TRANSITION
To examine how spending and utilization over time relate to the process of Medicaid transition we used a hazard model, with Medicare spending and utilization and nursing home use as time-varying characteristics. We then progressively entered baseline variables measuring state-level Medicaid program characteristics and long-term care prices, county-level health and long-term care supply, and individual-level economic characteristics, physical and cognitive functioning, health status, and finally demographic and support environment characteristics (Table 6). Data are monthly records for each individual in the sample, and estimates presented are relative hazards, so that a value greater than 1 indicates that the factor is associated with a greater hazard of transition in the month, and a value between 0 and 1 indicates that the factor is associated with a lower hazard of transition. The model explicitly incorporates exposure to the potential for transition, with Medicaid transition, death, and the end of the 4-year analysis period as terminal events.
Time-Varying Factors
As expected, nursing home use is associated with by far the greatest relative hazard of transition. Because of the likelihood of higher out-of-pocket costs that can be incurred even for insured care, cumulative Medicare spending and utilization patterns also are strongly related to a greater hazard of Medicaid transition, and key utilization events generally remain important when economic, disability, health, and other individual characteristics and state and local characteristics enter the model.
-
The cumulative level of Medicare spending over the previous 6 months is significantly associated with a higher hazard of Medicaid transition when only utilization in the current month is included in the equation.
-
When short and long stay nursing home use in the current month are added to the model, 6-month cumulative spending, SNF use in the current month, and hospice use become insignificant, the latter two results indicating the overlap with the nursing home use variables. Both short and long stays may begin with a Medicare-covered SNF stay or hospice use.
-
Of note is that outpatient use in the current month (which includes emergency room [ER] visits) is associated with a significantly higher hazard of transition (1.4-1.8) in the base model and in all models with controls for the individual's economic status. In specifications including indicators of inpatient and outpatient ER use, the relative hazards for the ER indicators were roughly 1 and not significant (not shown) and those for outpatient and inpatient use were essentially unchanged in magnitude or significance.
-
Inpatient hospital use in the current month is associated with a higher transition hazard than outpatient use in all models except the base model with only spending and Medicare utilization variables (Model A). The relative hazard associated with inpatient use is significant in all but the base model and Model D, in which the only individual-level variables are income and home ownership and value.
Baseline Characteristics
Among the baseline characteristics, the largest effects--in all cases showing increased hazards--are individual income, home ownership and value, and cognitive impairment, and Black race. Among state and local variables, which as discussed earlier, can be considered persistent over the 4-year analysis period, state program characteristics that indicate greater commitment to shifting care to community settings, and county-level supply of home health agencies also are all associated with significantly higher relative hazard of transition. Both being Hispanic and living alone (relative to living with a spouse) are associated with a significantly lower transition hazard.
The individual's economic status at baseline behaves in expected ways, with lower incomes and not having housing wealth strongly associated with a substantially larger hazard of transition.
-
Income has the largest association: those with income less than $20,000, approximating poor and near poor individuals and couples with income below twice the federal poverty thresholds, have a five-fold hazard of transition relative to those with income greater than $30,000, after controls for all other individual characteristics, and those with incomes between $20,000 and $30,000 have nearly a three-fold relative hazard.
-
Not being a homeowner is uniformly associated with a three-fold higher transition hazard in all models; loses significance when controls for health, disability and cognitive impairment are entered in Model E; but regains significance after controls for basic demographics and support environment are added in Model F.
Medicaid program characteristics also are associated with higher transition hazard rates, but the private pay prices of assisted living, home care aides, and nursing homes are not, and among local supply variables, only home health agencies show a significant association.
-
The most important state program characteristic is the percent of Medicaid long-term care spending for those age 65 or older that is used for community-based care: living in a state with a share above the median across all states is associated with a two-fold hazard of transition.
-
Living in a state with spousal income and resource protection for waiver participants receiving care in the community also associated with a uniformly higher and significant hazard of transition.
-
Living in a state with a medically needy program also is significantly associated with an elevated hazard, although the association loses significance when demographic and support environment characteristics are entered in the model.
| TABLE 6. Survival Analysis of Transition to Medicaid Within 4 Years, Community Residents Not Eligible for Medicaid at Interview | ||||||||||||
|---|---|---|---|---|---|---|---|---|---|---|---|---|
| Relative Hazard of Transition to Medicaid Enrollment in Current Month | ||||||||||||
| Model A: Medicare Spending & Utilization | Model B: Model A Plus Nursing Home Use | Model C: Model B Plus Program Features, Prices & Supply | Model D: Model C Plus Economic Factors | Model E: Model D Plus Physical & Cognitive Status, Fair/Poor Health | Model F: Model E Plus Demographic & Support Environment | |||||||
| Time-Varying Characteristics | ||||||||||||
| Total Medicare spending in the last 6 months (log) | 1.155 | ** | 1.033 | 1.047 | 1.055 | 1.043 | 1.033 | |||||
| Inpatient stay in current month | 1.440 | 1.716 | * | 1.760 | * | 1.652 | 1.727 | * | 1.681 | * | ||
| SNF stay in current month | 10.758 | ** | 0.770 | 0.769 | 0.832 | 0.886 | 0.857 | |||||
| Home health use in current month | 0.871 | 1.191 | 1.183 | 1.026 | 1.032 | 0.946 | ||||||
| Hospice use in current month | 2.217 | ** | 1.011 | 1.174 | 0.803 | 0.655 | 0.766 | |||||
| Outpatient use in current month | 1.780 | ** | 1.473 | * | 1.400 | 1.537 | * | 1.576 | ** | 1.580 | ** | |
| Part B or DME use in current month | 0.746 | 0.836 | 0.886 | 0.880 | 0.862 | 0.841 | ||||||
| Any short stay nursing home use in month | 7.889 | ** | 7.488 | ** | 5.170 | ** | 4.250 | ** | 4.675 | ** | ||
| Any long stay nursing home use in month | 52.153 | ** | 50.209 | ** | 33.352 | ** | 25.227 | ** | 30.125 | ** | ||
| Time Invariant Baseline Characteristics | ||||||||||||
| Income less than $10,000 | 5.802 | ** | 5.126 | ** | 5.210 | ** | ||||||
| Income $10,000 - $20,000 | 4.603 | ** | 4.709 | ** | 4.841 | ** | ||||||
| Income $20,000 - $30,000 | 3.041 | ** | 3.000 | ** | 2.721 | * | ||||||
| Not a homeowner | 3.802 | ** | 3.156 | ** | 3.024 | ** | ||||||
| Home value less than $75,000 | 2.181 | * | 2.085 | 2.004 | ||||||||
| Home value $75,000 - $150,000 | 1.768 | * | 1.696 | 1.635 | ||||||||
| Disability but receiving no helpa | 1.041 | 1.070 | ||||||||||
| Help with IADLs only | 1.319 | 1.195 | ||||||||||
| Help with 1-2 ADLs | 1.413 | 1.317 | ||||||||||
| Help with 3+ ADLs | 1.075 | 0.930 | ||||||||||
| Cognitively impaired | 2.738 | ** | 2.575 | ** | ||||||||
| Self-reported health fair or poor | 1.362 | 1.405 | ||||||||||
| Spousal protection income maximum AND resource >75th percentile | 1.130 | 1.394 | 1.311 | 1.429 | ||||||||
| Spousal resources, income protected for waiver participants | 1.587 | ** | 1.820 | ** | 1.681 | ** | 1.730 | ** | ||||
| Special income rules for nursing home residents | 0.956 | 0.890 | 0.850 | 0.819 | ||||||||
| Medically need program | 1.802 | ** | 1.524 | * | 1.506 | * | 1.472 | |||||
| 209b state | 1.319 | 1.376 | 1.306 | 1.321 | ||||||||
| Percent of Medicaid LTSS spending in community >median | 1.772 | ** | 2.023 | ** | 2.037 | ** | 2.262 | ** | ||||
| Private monthly cost for assisted living >median | 0.779 | 0.813 | 0.780 | 0.755 | ||||||||
| Mean home care aide hourly wage >median | 1.072 | 0.957 | 1.047 | 1.100 | ||||||||
| Private pay nursing home per diem >median | 0.780 | 0.915 | 0.872 | 0.921 | ||||||||
| Home health agencies/1,000 persons 65+ >median | 1.467 | ** | 1.332 | 1.455 | * | 1.530 | ** | |||||
| Nursing facility beds/1,000 persons 65+ >median | 0.773 | 0.854 | 0.834 | 0.851 | ||||||||
| SNF beds/1,000 persons 65+ >median | 1.068 | 0.987 | 0.988 | 1.036 | ||||||||
| Hospital beds/1,000 persons >median | 1.009 | 0.981 | 0.928 | 1.016 | ||||||||
| Physicians/1,000 persons >median | 1.041 | 0.997 | 1.027 | 0.957 | ||||||||
| Demographic and Support Characteristics | ||||||||||||
| Age 75-84 | 1.208 | |||||||||||
| Age 85+ | 1.326 | |||||||||||
| Female | 1.234 | |||||||||||
| Black, non-Hispanic | 2.663 | ** | ||||||||||
| Hispanic | 0.371 | ** | ||||||||||
| Less than high school education | 1.515 | |||||||||||
| High school education | 1.365 | |||||||||||
| Lives alone | 0.499 | ** | ||||||||||
| Lives with others, not spouse | 0.769 | |||||||||||
| Any non-resident daughter within 1 hour | 1.001 | |||||||||||
| Retirement community/housing | 1.691 | * | ||||||||||
| Community residential care | 1.043 | |||||||||||
| SOURCE: Analysis of the 2004 NLTCS linked with administrative data and state and county-level Medicaid program, price, and supply characteristics (n=125,930 monthly records for 3,241 FFS Medicare enrollees in all months who were living in non-institutional settings and not enrolled in Medicaid at baseline). NOTE: Omitted categories are White non-Hispanic/other; lives with spouse; traditional community residence; income $30,000 or more; housing value $150,000 or more; some college education; no disability; and self-reported health excellent or good.
**(*) Significantly different from 0 at the 5%(10%) confidence level. | ||||||||||||
SUMMARY AND DISCUSSION
Descriptive and multivariate analyses all point to the central role of nursing home use in transitions to Medicaid enrollment. The next largest factors are, not surprisingly, income and home ownership and value, the latter of which can reasonably be assumed to be highly correlated with the presence of other asset accumulations. Among the lowest income group, nearly 30% of those who used nursing homes transition, compared with a little more than 6% of those who did not, and even high income and homeownership are not sufficient to overcome the effects of nursing home use. In the highest income group we examined, the transition rate is less than 0.5% among those did not use nursing homes, but more than ten times that among those with nursing home use. In multivariate models, only cognitive impairment among health and functional factors is steadfastly a large and significant predictor of transition, possibly reflecting a far higher likelihood of nursing home use. That the most serious level of functional limitation at baseline--three or more ADL limitations--is associated with a higher transition rate only in univariate estimates may be explained by the overlap in these two groups. Nearly half of those with 3+ ADL limitations have cognitive impairment.
Evidence from the multivariate analyses show the significant association of higher income and homeownership with lower likelihoods of transition to Medicaid, among elders living in the community and nursing home users. These findings do not support the claims of some critics that Medicaid financial eligibility criteria are too lax and make it easy for wealthy older Americans to transition to Medicaid while retaining significant financial resources. If current eligibility criteria provide an incentive that older Americans find appealing, we would have expected to find much higher rates of transition to Medicaid among high income older adult homeowners. In particular, the analytic results fail to support concerns that Medicaid's protection of a minimum $522,000 in home equity for older adult users of Medicaid-funded long-term care during their lifetimes encourages transitions to Medicaid among wealthy homeowners. Homeownership was associated with a lower rate of transition among elders at all income levels and at far lower ranges of home equity.
Our study has a number of limitations, notably that we cannot observe changes in health and functional status over time and changes in residential arrangements, such as selling a home and moving to assisted living or moving in with relatives. We are able to observe the large effect of nursing home use and the more modest effects of spending and utilization patterns on the likelihood of transition over time, but cannot directly observe the economic process of "spending down" assets, prior to or after nursing home entry. We do not have even baseline data on assets other than the home that may slow the transition process. Finally, our models do not take into account potentially endogenous factors. For example, nursing home admission may be a route to Medicaid eligibility in cases where income or resources are insufficient to support lengthy community-based care but exceed community eligibility standards.
Nevertheless, our results have a number of implications for policy. First, current efforts to support the change in the locus of care for the frail elderly from nursing homes to community settings may be able to reduce the rate of transitions. Further, although efforts in some states to build greater Medicaid home and community-based services appear to be associated with higher rates of transitions, the effects are modest relative to the higher rates associated with nursing home use. At least some evidence indicates that Medicaid cost effects over time will be favorable (Kaye et al. 2009). Second, policies that improve the availability of affordable pre-funding earlier in life might be able to bridge gaps between financial means and care needs for those with modest retirement income and resources. Third, policies to expand and improve supports for informal caregivers may have the potential to reduce the need for nursing home placement and transitions to Medicaid. Informal caregivers are the dominant source of community-based care for the older population. Previous research has found that reducing stress from caregiving demands reduces or defers nursing home placement (Spillman & Long 2009), and that informal caregivers to those with probable dementia provide more hours of care and report substantial negative aspects of caregiving at far higher rates than other caregivers (Kasper, Freedman, & Spillman 2014). Finally, the results with respect to a greater relative hazard of transition associated with inpatient and outpatient use warrant further investigation to understand whether current Medicare policies intended to reduce hospital admissions and readmissions have the potential to affect transitions to Medicaid. A recent concern has been that large increases in use of inpatient "observation" stays in response to policies attempting to curb hospital readmissions increase beneficiary out-of-pocket expenses for care and also preclude Medicare coverage for any post-discharge SNF stays (Office of the Inspector General 2013; Feng et al. 2012).
REFERENCES
Feng, Z, B Wright, and V Mor. 2012. "Sharp rise in Medicare enrollees being held in hospitals for observation raises concerns about causes and consequences." Health Affairs, 31(6): 1251-1259.
Freedman, VA, BC Spillman, PM Andreski, JC Cornman, EM Crimmins, E Kramarow, J Lubitz, LG Martin, SS Merkin, RF Schoeni, TE Seeman, and TA Waidmann. 2013. "Trends in late-life activity limitations: An update from 5 national surveys." Demography, 50(2): 661-671.
Kaye, HS, MP LaPlante, and C Harrington. 2009. "Do noninstitutional long-term care services reduce Medicaid spending?" Health Affairs, 28(1): 262-272.
Liu, K, P Doty, and K Manton. 1990. "Medicaid spenddown in nursing homes," Gerontologist, 30(1): 7-15.
Office of the Inspector General, U.S. Department of Health and Human Services. 2013. Memorandum Report: Hospitals' Use of Hospital Observation Stays and Short Inpatient Stays for Medicare Beneficiaries OEI-02-12-00040. https://oig.hhs.gov/oei/reports/oei-02-12-00040.pdf.
Pfeiffer E., 1975, "A short portable mental status questionnaire for the assessment of organic brain deficit in elderly patients," J Am Geriatr Soc, 23(10): 433-441.
Spillman, BC. 2011. Technical Documentation: Adjusted 1994, 1999 and 2004 Cross-sectional Weights for the National Long-Term Care Survey. Report to U.S. Department of Health and Human Services, Office of the Assistant Secretary for Planning and Evaluation, Office of Disability, Aging and Long-Term Care Policy.
Spillman, BC, and K Black. 2005. "Staying the Course: Trends in Family Caregiving." AARP Public Policy Institute Issue Paper #2005-17.
Spillman, BC, and SK Long. 2009. "Does high caregiver stress predict nursing home entry?" Inquiry, 46(2): 140-161.
Spillman, BC, and P Kemper. 1995. "Lifetime patterns of payment for nursing home care." Medical Care, 33(3): 280-296.
Wiener, JM, WL Anderson, G Khatutsky, Y Kaganova, and J O'Keeffe. 2013. Medicaid Spend Down: New Estimates and Implications for Long-Term Services and Supports Financing Reform. Washington, DC: RTI International.
APPENDIX A. ADDITIONAL TABLES
| TABLE A1. Weighted Means/Proportions of Individual-Level Variables Used in Models, All Persons and by Medicaid Transition Over 4 Years | |||
|---|---|---|---|
| Community Residents Not Enrolled in Medicaid at Baseline | All | Persons Who Transition Within 4 Years | Persons Who Do No Transition Over 4 Years |
| Unweighted sample size | 4,254 | 386 | 3,868 |
| Proportion of analysis period survived | 0.909 | 0.864 | 0.912 |
| Nursing home entry during analysis period | 0.175 | 0.577 | 0.153 |
| Income $10,000 | 0.085 | 0.193 | 0.079 |
| Income $10,000 - $20,000 | 0.269 | 0.530 | 0.255 |
| Income $20,000 - $30,000 | 0.241 | 0.186 | 0.244 |
| Income $30,000 or more* | 0.405 | 0.091 | 0.423 |
| Not a homeowner | 0.244 | 0.501 | 0.230 |
| Home value less than $75,000 | 0.155 | 0.244 | 0.150 |
| Home value $75,000 - $150,000 | 0.273 | 0.162 | 0.279 |
| Home value $150,000 or more | 0.328 | 0.092 | 0.341 |
| Cumulative Medicare spending last 6 months (000s) | 2.538 | 3.316 | 2.496 |
| No disability* | 0.849 | 0.627 | 0.862 |
| Disability but receiving no help | 0.045 | 0.074 | 0.044 |
| Help with IADLs only | 0.042 | 0.100 | 0.038 |
| Help with 1-2 ADLs | 0.029 | 0.084 | 0.026 |
| Help with 3+ ADLs | 0.035 | 0.116 | 0.030 |
| Cognitively impaired | 0.052 | 0.197 | 0.044 |
| Self-reported excellent or good* | 0.791 | 0.623 | 0.800 |
| Self-reported health fair or poor | 0.209 | 0.377 | 0.200 |
| High blood pressure | 0.461 | 0.564 | 0.455 |
| Diabetes | 0.174 | 0.215 | 0.172 |
| Heart disease | 0.154 | 0.208 | 0.151 |
| Lung disease in the last year | 0.141 | 0.207 | 0.138 |
| Paralysis/nervous system disorder | 0.033 | 0.077 | 0.030 |
| Stroke in the last year | 0.027 | 0.046 | 0.026 |
| Age 65-74* | 0.531 | 0.350 | 0.541 |
| Age 75-84 | 0.360 | 0.394 | 0.358 |
| Age 85+ | 0.109 | 0.256 | 0.101 |
| Male* | 0.443 | 0.346 | 0.448 |
| Female | 0.557 | 0.654 | 0.552 |
| White, non-Hispanic* | 0.908 | 0.821 | 0.913 |
| Black, non-Hispanic | 0.053 | 0.138 | 0.049 |
| Hispanic | 0.039 | 0.041 | 0.039 |
| Less than high school education | 0.245 | 0.437 | 0.235 |
| High school education | 0.326 | 0.316 | 0.326 |
| Some college education* | 0.239 | 0.211 | 0.240 |
| Lives with spouse* | 0.590 | 0.386 | 0.601 |
| Lives alone | 0.315 | 0.428 | 0.309 |
| Lives with others, not spouse | 0.095 | 0.185 | 0.090 |
| Any non-resident daughter within 1 hour | 0.686 | 0.699 | 0.685 |
| Retirement community/housing | 0.088 | 0.162 | 0.083 |
| Community residential care | 0.021 | 0.083 | 0.017 |
| State and County Characteristics | |||
| Spousal protection income maximum AND resources >75th percentile | 0.408 | 0.414 | 0.408 |
| Spousal resources + income protected for wavier participants | 0.607 | 0.653 | 0.605 |
| Special income rule for nursing home residents | 0.677 | 0.657 | 0.678 |
| Medically needy program | 0.664 | 0.721 | 0.661 |
| 209b state | 0.216 | 0.245 | 0.214 |
| Percent of Medicaid LTSS spending in community >median | 0.523 | 0.594 | 0.519 |
| Private monthly cost for assisted living >median | 0.521 | 0.543 | 0.520 |
| Mean home care aide hourly wage >median | 0.420 | 0.460 | 0.417 |
| Private pay nursing home per diem >median | 0.500 | 0.453 | 0.502 |
| Home health agencies/1,000 persons 65+ >median | 0.481 | 0.513 | 0.479 |
| Nursing facility beds/1,000 persons 65+ >median | 0.391 | 0.351 | 0.393 |
| SNF beds/1,000 persons 65+ >median | 0.501 | 0.560 | 0.498 |
| Hospital beds/1,000 persons >median | 0.493 | 0.475 | 0.494 |
| Physicians/1,000 persons >median | 0.506 | 0.463 | 0.509 |
| SOURCE: Analysis of the 2004 NLTCS linked with administrative data and state and county-level Medicaid program, price, and supply characteristics. * Denotes omitted categories. | |||
| TABLE A2. Predicted Transitions by Income, Homeownership, and Nursing Home Use | ||||
|---|---|---|---|---|
| Predicted Percent Transitioning to Medicaid | ||||
| Within 1 Year | Within 2 Years | Within 3 Years | Within 4 Years | |
| All persons | 0.4 | 1.6 | 2.9 | 3.8 |
| Income 10 | 1.6 | 6.3 | 9.3 | 11.4 |
| Income 10-20 | 1.6 | 4.6 | 8.1 | 10.8 |
| Income 20-30 | 0.6 | 1.4 | 2.4 | 3.0 |
| Income 30+ | 0.0 | 0.3 | 0.5 | 0.8 |
| Non-homeowners | 1.8 | 5.4 | 8.4 | 10.1 |
| Income 10 | 3.3 | 9.8 | 14.3 | 16.3 |
| Income 10-20 | 3.5 | 8.2 | 12.9 | 16.3 |
| Income 20-30 | 1.8 | 3.4 | 5.6 | 5.8 |
| Income 30+ | 0.2 | 1.6 | 2.3 | 2.9 |
| Homeowner | 0.1 | 0.8 | 1.5 | 2.1 |
| Income 10 | 0.7 | 3.6 | 5.3 | 7.3 |
| Income 10-20 | 0.8 | 2.7 | 5.3 | 7.4 |
| Income 20-30 | 0.3 | 0.9 | 1.6 | 2.2 |
| Income 30+ | 0.0 | 0.2 | 0.3 | 0.5 |
| No Nursing Home Use | ||||
| All persons | 0.2 | 0.9 | 1.4 | 1.8 |
| Income 10 | 1.0 | 3.8 | 5.0 | 6.3 |
| Income 10-20 | 1.0 | 2.7 | 4.3 | 5.5 |
| Income 20-30 | 0.4 | 0.8 | 1.2 | 1.4 |
| Income 30+ | 0.0 | 0.2 | 0.3 | 0.4 |
| Non-homeowners | 1.1 | 3.0 | 4.1 | 4.7 |
| Income 10 | 2.1 | 6.2 | 7.9 | 9.2 |
| Income 10-20 | 2.2 | 4.8 | 7.0 | 8.5 |
| Income 20-30 | 1.1 | 1.8 | 2.3 | 2.5 |
| Income 30+ | 0.1 | 0.8 | 1.0 | 1.2 |
| Homeowner | 0.1 | 0.5 | 0.8 | 1.1 |
| Income 10 | 0.4 | 2.1 | 3.1 | 4.2 |
| Income 10-20 | 0.5 | 1.7 | 2.9 | 4.0 |
| Income 20-30 | 0.2 | 0.6 | 0.9 | 1.2 |
| Income 30+ | 0.0 | 0.1 | 0.2 | 0.3 |
| Nursing Home Use | ||||
| All persons | 11.6 | 14.0 | 17.5 | 17.9 |
| Income 10 | 17.1 | 24.0 | 28.8 | 29.3 |
| Income 10-20 | 18.6 | 20.9 | 26.4 | 28.3 |
| Income 20-30 | 10.0 | 10.4 | 12.8 | 12.6 |
| Income 30+ | 2.4 | 5.0 | 6.1 | 6.3 |
| Non-homeowners | 17.9 | 20.4 | 25.6 | 25.6 |
| Income 10 | 22.3 | 29.5 | 34.2 | 34.2 |
| Income 10-20 | 23.4 | 25.5 | 31.6 | 32.2 |
| Income 20-30 | 16.8 | 15.3 | 19.9 | 18.4 |
| Income 30+ | 4.6 | 9.4 | 12.0 | 12.1 |
| Homeowner | 7.0 | 9.1 | 11.7 | 12.4 |
| Income 10 | 11.5 | 17.5 | 21.1 | 22.5 |
| Income 10-20 | 13.1 | 15.6 | 21.2 | 23.8 |
| Income 20-30 | 6.5 | 7.5 | 9.0 | 9.6 |
| Income 30+ | 1.5 | 3.1 | 3.8 | 4.1 |
| SOURCE: Probit analysis of the 2004 NLTCS linked with administrative data and stat and county-level Medicaid program, price, and supply characteristics. | ||||
This report was prepared under contract #HHSP23337033T between the U.S. Department of Health and Human Services (HHS), Office of Disability, Aging and Long-Term Care Policy (DALTCP) and the Urban Institute. For additional information about this subject, you can visit the DALTCP home page at http://aspe.hhs.gov/office-disability-aging-and-long-term-care-policy-daltcp or contact the ASPE Project Officer, Pamela Doty, at HHS/ASPE/DALTCP, Room 424E, H.H. Humphrey Building, 200 Independence Avenue, S.W., Washington, D.C. 20201. Their e-mail addresses are: Pamela.Doty@hhs.gov.